Scolaris Content Display Scolaris Content Display

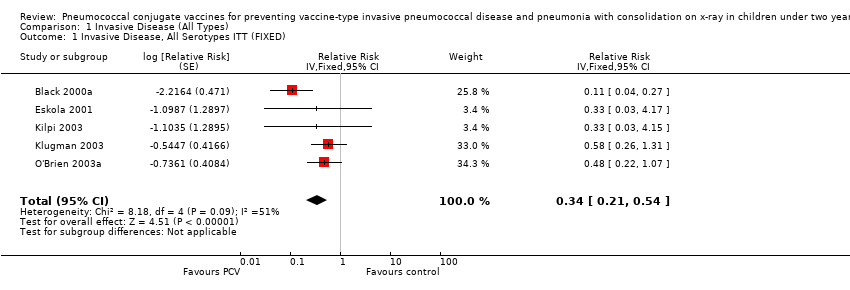
Comparison 1 Invasive Disease (All Types), Outcome 1 Invasive Disease, All Serotypes ITT (FIXED).
Figuras y tablas -
Analysis 1.1

Comparison 1 Invasive Disease (All Types), Outcome 1 Invasive Disease, All Serotypes ITT (FIXED).

Comparison 1 Invasive Disease (All Types), Outcome 2 Invasive Disease, All Serotypes ITT (RANDOM).
Figuras y tablas -
Analysis 1.2

Comparison 1 Invasive Disease (All Types), Outcome 2 Invasive Disease, All Serotypes ITT (RANDOM).

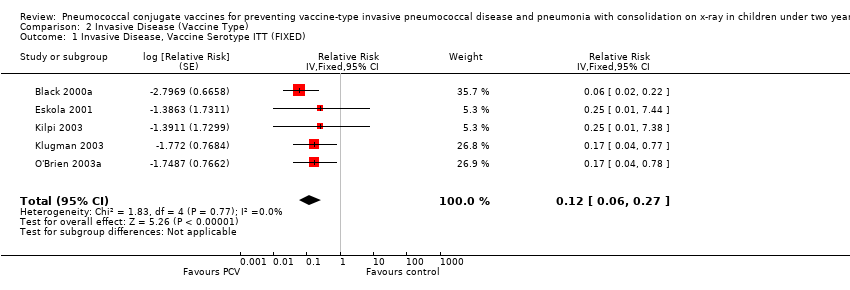
Comparison 2 Invasive Disease (Vaccine Type), Outcome 1 Invasive Disease, Vaccine Serotype ITT (FIXED).
Figuras y tablas -
Analysis 2.1

Comparison 2 Invasive Disease (Vaccine Type), Outcome 1 Invasive Disease, Vaccine Serotype ITT (FIXED).

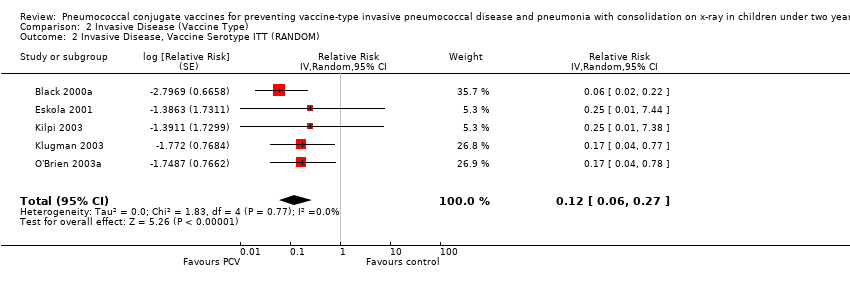
Comparison 2 Invasive Disease (Vaccine Type), Outcome 2 Invasive Disease, Vaccine Serotype ITT (RANDOM).
Figuras y tablas -
Analysis 2.2

Comparison 2 Invasive Disease (Vaccine Type), Outcome 2 Invasive Disease, Vaccine Serotype ITT (RANDOM).

Comparison 2 Invasive Disease (Vaccine Type), Outcome 3 Invasive Disease, Vaccine Serotype PP (FIXED).
Figuras y tablas -
Analysis 2.3

Comparison 2 Invasive Disease (Vaccine Type), Outcome 3 Invasive Disease, Vaccine Serotype PP (FIXED).

Comparison 2 Invasive Disease (Vaccine Type), Outcome 4 Invasive Disease, Vaccine Serotype PP (RANDOM).
Figuras y tablas -
Analysis 2.4

Comparison 2 Invasive Disease (Vaccine Type), Outcome 4 Invasive Disease, Vaccine Serotype PP (RANDOM).

Comparison 3 Invasive Disease (Non‐Vaccine Type), Outcome 1 Invasive Disease, Non Vaccine Serotype ITT (FIXED).
Figuras y tablas -
Analysis 3.1

Comparison 3 Invasive Disease (Non‐Vaccine Type), Outcome 1 Invasive Disease, Non Vaccine Serotype ITT (FIXED).

Comparison 3 Invasive Disease (Non‐Vaccine Type), Outcome 2 Invasive Disease, Non Vaccine Serotype ITT (RANDOM).
Figuras y tablas -
Analysis 3.2

Comparison 3 Invasive Disease (Non‐Vaccine Type), Outcome 2 Invasive Disease, Non Vaccine Serotype ITT (RANDOM).

Comparison 4 Invasive Disease (Vaccine‐related Type), Outcome 1 Invasive Disease, Vaccine‐related Serotype ITT (FIXED).
Figuras y tablas -
Analysis 4.1

Comparison 4 Invasive Disease (Vaccine‐related Type), Outcome 1 Invasive Disease, Vaccine‐related Serotype ITT (FIXED).

Comparison 4 Invasive Disease (Vaccine‐related Type), Outcome 2 Invasive Disease, Vaccine‐related Serotype ITT (RANDOM).
Figuras y tablas -
Analysis 4.2

Comparison 4 Invasive Disease (Vaccine‐related Type), Outcome 2 Invasive Disease, Vaccine‐related Serotype ITT (RANDOM).

Comparison 5 X‐ray confirmed pneumonia, Outcome 1 X‐ray confirmed Pneumonia ITT (FIXED).
Figuras y tablas -
Analysis 5.1

Comparison 5 X‐ray confirmed pneumonia, Outcome 1 X‐ray confirmed Pneumonia ITT (FIXED).

Comparison 5 X‐ray confirmed pneumonia, Outcome 2 X‐ray confirmed Pneumonia ITT (RANDOM).
Figuras y tablas -
Analysis 5.2

Comparison 5 X‐ray confirmed pneumonia, Outcome 2 X‐ray confirmed Pneumonia ITT (RANDOM).

Comparison 5 X‐ray confirmed pneumonia, Outcome 3 X‐ray confirmed Pneumonia PP (FIXED).
Figuras y tablas -
Analysis 5.3

Comparison 5 X‐ray confirmed pneumonia, Outcome 3 X‐ray confirmed Pneumonia PP (FIXED).

Comparison 5 X‐ray confirmed pneumonia, Outcome 4 X‐ray confirmed Pneumonia PP (RANDOM).
Figuras y tablas -
Analysis 5.4

Comparison 5 X‐ray confirmed pneumonia, Outcome 4 X‐ray confirmed Pneumonia PP (RANDOM).

Comparison 6 Clinical pneumonia, Outcome 1 Clinical pneumonia, ITT (FIXED).
Figuras y tablas -
Analysis 6.1

Comparison 6 Clinical pneumonia, Outcome 1 Clinical pneumonia, ITT (FIXED).

Comparison 6 Clinical pneumonia, Outcome 2 Clinical pneumonia, ITT (RANDOM).
Figuras y tablas -
Analysis 6.2

Comparison 6 Clinical pneumonia, Outcome 2 Clinical pneumonia, ITT (RANDOM).

Comparison 6 Clinical pneumonia, Outcome 3 Clinical pneumonia, PP (FIXED).
Figuras y tablas -
Analysis 6.3

Comparison 6 Clinical pneumonia, Outcome 3 Clinical pneumonia, PP (FIXED).

Comparison 6 Clinical pneumonia, Outcome 4 Clinical pneumonia, PP (RANDOM).
Figuras y tablas -
Analysis 6.4

Comparison 6 Clinical pneumonia, Outcome 4 Clinical pneumonia, PP (RANDOM).

Table 1. Quality scale for meta‐analytic review

Subtle bias

Frank bias

Selection Bias [A] [B] [C]

Were there attempts at allocation concealment?

Were the groups being compared balanced in terms of known determinants of outcome?

If not A, check direction of BIAS

Example: Use of opaque envelopes, allocation by a 3rd party.

Note: Magnitude of any difference is more important than the p‐value.

[ ] Overestimate[ ] Underestimate[ ] Hard to determine

Comments:_______________________[ ]Y [ ] N [ ]NS

Comments:___________________[ ]Y [ ] N [ ]NS

Performance Bias [A] [B] [C]

Was the physician caring for the patient blinded regarding treatment?

Were the two groups treated equally in terms of other medication received, frequency of follow‐up and general quality of care?

If not A, check direction of BIAS[ ]

Note: If an identical placebo was used, the answer is probably (but not always) yes.

Note: In some studies, treated patients are seen more often than the controls, or receive different medications.

Overestimate[ ] Underestimate[ ] Hard to determine

Comments:_______________________[ ]Y [ ] N [ ]NS

Comments:___________________[ ]Y [ ] N [ ]NS

Exclusion Bias [A] [B] [C]

Was an intention‐to‐treat analysis conducted?

Are the drop‐out rates comparable?

If not A, check direction of BIAS

Note: Withdrawals are patients who failed to comply with treatment. If outcomes are known for these patients, and they are analyzed as if they complied, this is an ITT analysis.

Note: Drop‐out are patients for whom outcome is uncertain. The denominator in the analysis will be less than the total number of patients randomized.

[ ] Overestimate[ ] Underestimate[ ] Hard to determine

Comments:________________________[ ]Y [ ] N [ ]NS

Comments:___________________[ ]Y [ ] N [ ]NS

Detection Bias [A] [B] [C]

Were the persons making an outcome assessment blinded regarding treatment?

Are the outcome detection methods used similar in both groups?

If not A, check direction of BIAS

Note: The outcome assessor maybe a patient, his physician, or a 3rd party. If an identical placebo was used, the answer is probably (but not always) yes.

Note: In some studies, the criteria used for outcome measurement differ between groups being compared.

[ ] Overestimate[ ] Underestimate[ ] Hard to determine

Comments:_________________________[ ]Y [ ] N [ ]NS

Comments:____________________[ ]Y [ ] N [ ]NS

Note: Please include comments to explain any "N" or "Y" rating, citing the page, column and paragraph number.

RAW SCORES:A=YYB=NY;N‐NS;NS‐NS;NS‐Y;Y‐NSC=YN;NN;NS‐N
TOTAL SCORE: LOWEST SCORE IN ANY ROW.

REVIEWER: ______________________________

DATE:___________________________________

OVER‐ALL SCORE:_________

Figuras y tablas -
Table 1. Quality scale for meta‐analytic review
Comparison 1. Invasive Disease (All Types)

Outcome or subgroup title

No. of studies

No. of participants

Statistical method

Effect size

1 Invasive Disease, All Serotypes ITT (FIXED) Show forest plot

5

Relative Risk (Fixed, 95% CI)

0.34 [0.21, 0.54]

2 Invasive Disease, All Serotypes ITT (RANDOM) Show forest plot

5

Relative Risk (Random, 95% CI)

0.32 [0.15, 0.69]

Figuras y tablas -
Comparison 1. Invasive Disease (All Types)
Comparison 2. Invasive Disease (Vaccine Type)

Outcome or subgroup title

No. of studies

No. of participants

Statistical method

Effect size

1 Invasive Disease, Vaccine Serotype ITT (FIXED) Show forest plot

5

Relative Risk (Fixed, 95% CI)

0.12 [0.06, 0.27]

2 Invasive Disease, Vaccine Serotype ITT (RANDOM) Show forest plot

5

Relative Risk (Random, 95% CI)

0.12 [0.06, 0.27]

3 Invasive Disease, Vaccine Serotype PP (FIXED) Show forest plot

3

Relative Risk (Fixed, 95% CI)

0.14 [0.05, 0.39]

4 Invasive Disease, Vaccine Serotype PP (RANDOM) Show forest plot

3

Relative Risk (Random, 95% CI)

0.14 [0.05, 0.40]

Figuras y tablas -
Comparison 2. Invasive Disease (Vaccine Type)
Comparison 3. Invasive Disease (Non‐Vaccine Type)

Outcome or subgroup title

No. of studies

No. of participants

Statistical method

Effect size

1 Invasive Disease, Non Vaccine Serotype ITT (FIXED) Show forest plot

5

Relative Risk (Fixed, 95% CI)

0.99 [0.40, 2.43]

2 Invasive Disease, Non Vaccine Serotype ITT (RANDOM) Show forest plot

5

Relative Risk (Random, 95% CI)

0.99 [0.40, 2.43]

Figuras y tablas -
Comparison 3. Invasive Disease (Non‐Vaccine Type)
Comparison 4. Invasive Disease (Vaccine‐related Type)

Outcome or subgroup title

No. of studies

No. of participants

Statistical method

Effect size

1 Invasive Disease, Vaccine‐related Serotype ITT (FIXED) Show forest plot

3

Relative Risk (Fixed, 95% CI)

1.09 [0.26, 4.69]

2 Invasive Disease, Vaccine‐related Serotype ITT (RANDOM) Show forest plot

3

Relative Risk (Random, 95% CI)

1.09 [0.26, 4.69]

Figuras y tablas -
Comparison 4. Invasive Disease (Vaccine‐related Type)
Comparison 5. X‐ray confirmed pneumonia

Outcome or subgroup title

No. of studies

No. of participants

Statistical method

Effect size

1 X‐ray confirmed Pneumonia ITT (FIXED) Show forest plot

2

Relative Risk (Fixed, 95% CI)

0.78 [0.69, 0.89]

2 X‐ray confirmed Pneumonia ITT (RANDOM) Show forest plot

2

Relative Risk (Random, 95% CI)

0.78 [0.69, 0.89]

3 X‐ray confirmed Pneumonia PP (FIXED) Show forest plot

2

Relative Risk (Fixed, 95% CI)

0.76 [0.65, 0.89]

4 X‐ray confirmed Pneumonia PP (RANDOM) Show forest plot

2

Relative Risk (Random, 95% CI)

0.76 [0.65, 0.89]

Figuras y tablas -
Comparison 5. X‐ray confirmed pneumonia
Comparison 6. Clinical pneumonia

Outcome or subgroup title

No. of studies

No. of participants

Statistical method

Effect size

1 Clinical pneumonia, ITT (FIXED) Show forest plot

1

Relative Risk (Fixed, 95% CI)

0.93 [0.86, 1.00]

2 Clinical pneumonia, ITT (RANDOM) Show forest plot

1

Relative Risk (Random, 95% CI)

0.93 [0.86, 1.00]

3 Clinical pneumonia, PP (FIXED) Show forest plot

1

Relative Risk (Fixed, 95% CI)

0.94 [0.86, 1.03]

4 Clinical pneumonia, PP (RANDOM) Show forest plot

1

Relative Risk (Random, 95% CI)

0.94 [0.86, 1.03]

Figuras y tablas -
Comparison 6. Clinical pneumonia