Exercise for improving balance in older people
Referencias
References to studies included in this review
References to studies excluded from this review
References to studies awaiting assessment
Additional references
Characteristics of studies
Characteristics of included studies [ordered by study ID]
Ir a:
| Methods | RCT. | |
| Participants | N = 33 completers in two arms | |
| Interventions | Exercise group (STRENGTH) (n = 16): strengthening exercises of lower limbs with theraband and increasing resistance in sitting and standing. | |
| Outcomes | 20 metre walk test (s). | |
| Notes | Trial had 3 arms but NSD between 2 interventions therefore data taken from 'High guidance' group | |
| Risk of bias | ||
| Bias | Authors' judgement | Support for judgement |
| Allocation concealment? | Unclear risk | B ‐ Unclear |
| Methods | RCT. | |
| Participants | N= 38 | |
| Interventions | Exercise group (GBFT): low resistance exercises against gravity, theraband for legs and trunk, reaching, weight shifting, marching on spot, and home exercise programme. | |
| Outcomes | Force platform ‐ LOS AP and ML (cm). | |
| Notes | ||
| Risk of bias | ||
| Bias | Authors' judgement | Support for judgement |
| Allocation concealment? | Unclear risk | B ‐ Unclear |
| Methods | RCT. | |
| Participants | N = 105, Factorial design 51 allocated to relevant arms. | |
| Interventions | Strength group (STRENGTH): free weights and gym equipment | |
| Outcomes | Ability to walk on wide and narrow beams. | |
| Notes | Trial had 4 arms. Part of FICSIT study see Buchner 1993 | |
| Risk of bias | ||
| Bias | Authors' judgement | Support for judgement |
| Allocation concealment? | Unclear risk | B ‐ Unclear |
| Methods | RCT. | |
| Participants | N = 106. | |
| Interventions | Control group: usual activity | |
| Outcomes | OMNI tilt board (s). | |
| Notes | Part of FICSIT study see Buchner 1993 | |
| Risk of bias | ||
| Bias | Authors' judgement | Support for judgement |
| Allocation concealment? | Unclear risk | B ‐ Unclear |
| Methods | RCT. | |
| Participants | N = 56 | |
| Interventions | Exercise group (STRENGTH): combined endurance and resistance. | |
| Outcomes | Usual walking speed (m/s). | |
| Notes | ||
| Risk of bias | ||
| Bias | Authors' judgement | Support for judgement |
| Allocation concealment? | Unclear risk | B ‐ Unclear |
| Methods | RCT. | |
| Participants | N = 50 | |
| Interventions | Exercise group (GBFT): exercise aimed at improving breathing, single and double limb balance, co‐ordination, flexibility, strength and relaxation. | |
| Outcomes | Postural sway during quiet standing on force plate ‐ eyes open, eyes closed ‐ RMS ML and AP (mm) | |
| Notes | ||
| Risk of bias | ||
| Bias | Authors' judgement | Support for judgement |
| Allocation concealment? | Unclear risk | B ‐ Unclear |
| Methods | RCT. | |
| Participants | N = 43 | |
| Interventions | Exercise group (GBFT): balance exercises designed to challenge the visual (e.g. opened /closed eyes), vestibular (e.g. move head), somatosensory (e.g. stand on foam) and muscular (e.g. standing on one leg, bending body in different directions) systems. Exercises were initially performed while standing on the floor (first 4 weeks) and then progressed to standing. | |
| Outcomes | Maximum excursion of LOS (forward, backward, right, left) | |
| Notes | ||
| Risk of bias | ||
| Bias | Authors' judgement | Support for judgement |
| Allocation concealment? | Unclear risk | B ‐ Unclear |
| Methods | RCT. | |
| Participants | N = 18 | |
| Interventions | Exercise group (MULTIPLE): Strength exercises began with 8 to 10 repetitions at 50% of pretest 1RM score on progressed to 75%. Load‐bearing walking, stair‐climbing and balance ‐training exercises, wearing weighted vests after 2 weeks. Balance‐training exercises, in walking. | |
| Outcomes | Body sway (cm) | |
| Notes | ||
| Risk of bias | ||
| Bias | Authors' judgement | Support for judgement |
| Allocation concealment? | Low risk | A ‐ Adequate |
| Methods | RCT. | |
| Participants | N = 34 | |
| Interventions | Exercise group (MULTIPLE): walking different directions at different speeds, combined with movement of the arms, neck and trunk. Exercise to music including weight transfer exercises while sitting and standing and rising from and sitting down in a chair, were performed. | |
| Outcomes | Single legged stance ‐ eyes open, eyes closed (s) | |
| Notes | ||
| Risk of bias | ||
| Bias | Authors' judgement | Support for judgement |
| Allocation concealment? | Unclear risk | B ‐ Unclear |
| Methods | RCT. | |
| Participants | N = 132 | |
| Interventions | Exercise group (STRENGTH): strong for life programme, 35 minute video of 11 exercises, resistance elastic bands, functional movement patterns simulate to PNF, arms and legs, therapists supervised 2 home visits then telephone contact. | |
| Outcomes | Gait velocity (cm/s). | |
| Notes | Compliance 78% | |
| Risk of bias | ||
| Bias | Authors' judgement | Support for judgement |
| Allocation concealment? | Unclear risk | B ‐ Unclear |
| Methods | Quasi RCT. | |
| Participants | N = 50 | |
| Interventions | Exercise group (GBFT): stretching, "static balance" (e.g. standing on one leg), "active balance" (e.g. using tandem heel/toe gait, walking along a line), "response exercises" (e.g. performing maneuvers in response to changing colour signals), walking and cool‐down and relaxation. | |
| Outcomes | Single legged stance ‐ eyes open, eyes closed on force platform | |
| Notes | Compliance median 85% range 0‐142% | |
| Risk of bias | ||
| Bias | Authors' judgement | Support for judgement |
| Allocation concealment? | Low risk | A ‐ Adequate |
| Methods | RCT. | |
| Participants | N = 197. | |
| Interventions | Exercise group (MULTIPLE): improving strength, flexibility, co‐ordination, and balance, the individualised exercise regimes were based on participant's falls risk profile. | |
| Outcomes | Postural sway eyes open and eyes closed on floor and foam (cm) (Lord sway meter) | |
| Notes | Compliance: mean 73.2% across the groups | |
| Risk of bias | ||
| Bias | Authors' judgement | Support for judgement |
| Allocation concealment? | Unclear risk | B ‐ Unclear |
| Methods | Cluster RCT. | |
| Participants | N = 551, factorial design 280 allocated to relevant arms | |
| Interventions | Exercise group (MULTIPLE): warm‐up period, conditioning period including aerobic exercises, specific strengthening exercises, and activities for balance, hand‐eye and foot‐eye coordination, and flexibility. | |
| Outcomes | Postural sway on floor and foam eyes open and eyes closed (mm) (Lord sway meter) | |
| Notes | ||
| Risk of bias | ||
| Bias | Authors' judgement | Support for judgement |
| Allocation concealment? | Low risk | A ‐ Adequate |
| Methods | RCT. | |
| Participants | N = 620 | |
| Interventions | Exercise group (MULTIPLE): based on falls risk profile, individualised exercises aimed at improving strength, and balance and or vision if a problem, peripheral warm up, conditioning, strength, flexibility, coordination and balance. | |
| Outcomes | Postural sway on floor and foam eyes open and eyes closed (mm) (Lord sway meter) | |
| Notes | Three arms to this study: we have reported the enhanced intervention group | |
| Risk of bias | ||
| Bias | Authors' judgement | Support for judgement |
| Allocation concealment? | Low risk | A ‐ Adequate |
| Methods | RCT. | |
| Participants | N = 80 | |
| Interventions | Exercise group (GBFT): stand up/step up routine designed to improve strength and balance with warm up and cool down. | |
| Outcomes | One legged stance (s) | |
| Notes | ||
| Risk of bias | ||
| Bias | Authors' judgement | Support for judgement |
| Allocation concealment? | Low risk | A ‐ Adequate |
| Methods | RCT | |
| Participants | N=22 | |
| Interventions | Exercise group (GBFT): "Get off your Rocker" balance class, including single leg stance, Swiss ball, tandem walking. | |
| Outcomes | BBS (score) | |
| Notes | Abstract only | |
| Risk of bias | ||
| Bias | Authors' judgement | Support for judgement |
| Allocation concealment? | Unclear risk | D ‐ Not used |
| Methods | RCT | |
| Participants | N = 49 | |
| Interventions | Exercise group (GEN ACTIVITY): All exercises were performed seated. Warm‐up, exercises designed to put joints in upper and lower limbs through their full range of movements. As the study progressed participants were encouraged to sustain muscle contractions for longer and increase number of repetitions. | |
| Outcomes | Postural sway ‐ eyes open and eyes closed. | |
| Notes | Compliance mean 91% exercise sessions | |
| Risk of bias | ||
| Bias | Authors' judgement | Support for judgement |
| Allocation concealment? | Unclear risk | B ‐ Unclear |
| Methods | RCT. | |
| Participants | N = 72 | |
| Interventions | Exercise group (MULTIPLE): balance and strength using free weights working at 7/8 on a 10 point Borg Scale, tandem walks, running etc, plus 120 minutes physical activity per week . | |
| Outcomes | Tandem walk (over 20 feet) (s). | |
| Notes | Compliance mean 82%. | |
| Risk of bias | ||
| Bias | Authors' judgement | Support for judgement |
| Allocation concealment? | Unclear risk | B ‐ Unclear |
| Methods | RCT. | |
| Participants | N = 42 | |
| Interventions | Exercise group (GEN ACTIVITY): warm up, light aerobic exercise, exercises aimed at improving neuromotor co‐ordination, and muscle‐strengthening exercises, cool down. | |
| Outcomes | TUG (s) | |
| Notes | Compliance mean 86% (59‐100%) | |
| Risk of bias | ||
| Bias | Authors' judgement | Support for judgement |
| Allocation concealment? | Unclear risk | B ‐ Unclear |
| Methods | RCT. | |
| Participants | N = 21 | |
| Interventions | Exercise group (WALKING): individual walking programme determined by lactate levels during VO2 max test | |
| Outcomes | Force platform ‐ dynamic test, lateral and AP. | |
| Notes | ||
| Risk of bias | ||
| Bias | Authors' judgement | Support for judgement |
| Allocation concealment? | Unclear risk | B ‐ Unclear |
| Methods | RCT. | |
| Participants | N = 22 | |
| Interventions | Exercise group (MULTIPLE): free weights to strengthen and develop power in shoulder, hip adductors/abductors/flexors/extensors, knee flexor/extensors, increasing in repetitions, functional mobility, stretching and balance exercises. | |
| Outcomes | Postural sway on BPM | |
| Notes | Adherence ‐ mean (SD) 43 (3) classes (max 48) | |
| Risk of bias | ||
| Bias | Authors' judgement | Support for judgement |
| Allocation concealment? | Low risk | A ‐ Adequate |
| Methods | RCT. | |
| Participants | N = 230. | |
| Interventions | Exercise group (GBFT): stand up and step ups functional exercises. | |
| Outcomes | Single legged stance (s). | |
| Notes | Trial had 4 arms: others included CBT only, exercise plus CBT. | |
| Risk of bias | ||
| Bias | Authors' judgement | Support for judgement |
| Allocation concealment? | Unclear risk | B ‐ Unclear |
| Methods | RCT. | |
| Participants | N = 131. | |
| Interventions | Resistance training group (STRENGTH): stair climbing with resistance, seated knee extension, standing, standing knee extension. | |
| Outcomes | Tandem stance (s). | |
| Notes | % Compliance resistance training group ‐ 85 (47 ‐ 100), walking group ‐ 82 (29 ‐ 97) | |
| Risk of bias | ||
| Bias | Authors' judgement | Support for judgement |
| Allocation concealment? | Unclear risk | B ‐ Unclear |
| Methods | RCT. | |
| Participants | N = 59. | |
| Interventions | Exercise group (MULTIPLE): PRE, hip, knee and ankle, endurance training bike, treadmill, indoor walking and balance training. | |
| Outcomes | Single legged stance (s) (for max 15 s) | |
| Notes | SD 43.4 years for control group age, might be a typo in original paper | |
| Risk of bias | ||
| Bias | Authors' judgement | Support for judgement |
| Allocation concealment? | Low risk | A ‐ Adequate |
| Methods | RCT. | |
| Participants | N = 14 | |
| Interventions | Exercise group (MULTIPLE): PRE and aerobic conditioning (>70% exercise stress tested maximal HR) using gym equipment and ergometers. | |
| Outcomes | Average gait velocity (cm/s) over 20 feet. (right and left). | |
| Notes | Compliance 95% for exercise group | |
| Risk of bias | ||
| Bias | Authors' judgement | Support for judgement |
| Allocation concealment? | Unclear risk | B ‐ Unclear |
| Methods | RCT. | |
| Participants | N = 81 | |
| Interventions | Exercise group (MULTIPLE): strength and endurance training plus 10 minutes walking. | |
| Outcomes | Parallel stance (max 10s) (s). | |
| Notes | ||
| Risk of bias | ||
| Bias | Authors' judgement | Support for judgement |
| Allocation concealment? | Unclear risk | B ‐ Unclear |
| Methods | RCT. | |
| Participants | N = 38 | |
| Interventions | Exercise group (3D): aerobic dance to music | |
| Outcomes | Single legged stance ‐ eyes open, eyes closed (s). | |
| Notes | Compliance with exercise 78.8% | |
| Risk of bias | ||
| Bias | Authors' judgement | Support for judgement |
| Allocation concealment? | Low risk | A ‐ Adequate |
| Methods | RCT. | |
| Participants | N = 32 | |
| Interventions | Exercise group (WALKING):‐ gait training on a bilateral separated treadmill | |
| Outcomes | Single legged stance (s). | |
| Notes | Data not reported appropriately for walking speed. | |
| Risk of bias | ||
| Bias | Authors' judgement | Support for judgement |
| Allocation concealment? | Unclear risk | D ‐ Not used |
| Methods | RCT. | |
| Participants | N = 28 | |
| Interventions | Exercise group (GBFT): dynamic exercise on force platform and training device with visual feedback on movement on COP. | |
| Outcomes | AP and ML velocities of sway and velocity moment in 6 standing balance tests. | |
| Notes | ||
| Risk of bias | ||
| Bias | Authors' judgement | Support for judgement |
| Allocation concealment? | Unclear risk | B ‐ Unclear |
| Methods | RCT | |
| Participants | N=52 | |
| Interventions | Exercise group (MULTIPLE): exercise centred falls prevention programme with home based exercise aimed at enhancing muscle strength, balance and gait. Included resistance exercise and Tai Chi. | |
| Outcomes | Single legged stance (s), eyes open (max 1 min), eyes closed (max 30 sec) (s) | |
| Notes | ||
| Risk of bias | ||
| Bias | Authors' judgement | Support for judgement |
| Allocation concealment? | Unclear risk | B ‐ Unclear |
| Methods | RCT. | |
| Participants | N = 72. | |
| Interventions | Balance group (GBFT): force platform standing moving target via cursor excursions eyes open and closed. | |
| Outcomes | Chattex balance system to measure: quiet standing eyes open, eyes closed | |
| Notes | Part of Atlanta FICSIT site study. | |
| Risk of bias | ||
| Bias | Authors' judgement | Support for judgement |
| Allocation concealment? | Unclear risk | B ‐ Unclear |
| Methods | RCT. | |
| Participants | N = 94. | |
| Interventions | Exercise group (GBFT): exercise in sitting, standing and walking, in a variety of situations to test balance. | |
| Outcomes | BBS (points) out of 56. | |
| Notes | ||
| Risk of bias | ||
| Bias | Authors' judgement | Support for judgement |
| Allocation concealment? | Low risk | A ‐ Adequate |
| Methods | RCT. | |
| Participants | N = 110. | |
| Interventions | Balance group (GBFT): PRObalancemaster with COP feedback, standing and sitting including gym ball eyes open and eyes closed with and without perturbations and gait on foam and narrow beams. | |
| Outcomes | Loss of Balance during sensory organisation test. | |
| Notes | Part of FICSIT trials. | |
| Risk of bias | ||
| Bias | Authors' judgement | Support for judgement |
| Allocation concealment? | Low risk | A ‐ Adequate |
| Methods | RCT. | |
| Participants | N = 49. | |
| Interventions | Exercise group (3D): Tai Chi simplified form of 24 forms plus 11 easy forms at home. | |
| Outcomes | One legged stance eyes open (max 60 s). | |
| Notes | Subjects from earlier study by Zhang et al 2003 | |
| Risk of bias | ||
| Bias | Authors' judgement | Support for judgement |
| Allocation concealment? | Unclear risk | B ‐ Unclear |
ABBREVIATIONS AND ACRONYMS:
1RM ‐ One repetition maximum score
3D ‐ 3D exercise including tai chi, qi gong, dance, yoga
ADL ‐ Activities of Daily Living.
AP ‐ Anterior ‐ Posterior
BBS ‐ Berg Balance Scale
BPM ‐ Balance Performance Monitor
cm ‐ centimetres
CoM: Body's centre of mass
COP ‐ Centre of Pressure.
COPD ‐ Chronic Obstructive Pulmonary Disease
EPESE ‐ Established Populations for the Epidemiologic Studies of the Elderly short physical performance battery
Ex ‐ Exercise
FRT ‐ Function Reach Test
GBFT ‐ Gait, balance, functional tasks
GEN ACTIVITY ‐ general physical activity
HR ‐ Heart Rate
Hr ‐ hour
Km‐ kilometres
LOS ‐ Locus Of Support
min ‐ minute
ML ‐ medio‐lateral
mm ‐ millimetres
MMSE ‐ Mini Mental Status Examination.
m/s ‐ metres per second
NSD ‐ no significant difference
PNF ‐ proprioceptive neuromuscular facilitation
PRE ‐ Progressive Resistance Exercise.
RCT ‐ Randomised Controlled Trial
RMS ‐ root mean squared
s ‐ seconds
SD ‐ Standard Deviation
SLS ‐ Single Legged Stance
SMD ‐ standardised mean difference
STRENGTH ‐ strength training including resistance or power training
TUG ‐ Timed up and go test
WMD ‐ weighted mean difference
Characteristics of excluded studies [ordered by study ID]
Ir a:
| Study | Reason for exclusion |
| RCT but no specific balance outcomes | |
| RCT no suitable outcome measures | |
| Description of study no data reported | |
| Summary of Day 2002 | |
| Control group received some exercise | |
| Control group received some exercise | |
| Control group had home exercise | |
| Control group received some exercise | |
| Comparison of different exercise types , no control group | |
| Control group had home exercise | |
| Trial of energy supplements all participants received supplement or placebo | |
| Control group received some exercise | |
| Intervention not exercise | |
| Description of methodology no data | |
| No suitable balance outcome measures | |
| Not appropriate outcome measures | |
| No control group | |
| Comparison of exercise types, no control group | |
| osteoporotic participants | |
| No measures | |
| Multifactorial falls programme | |
| No control group | |
| FICSIT study multi‐nutrient supplementation no data presented | |
| No specific balance outcome measures | |
| No control group | |
| Comparison of weighted vests | |
| 61% of participants had hip fracture or lower extremity fracture | |
| No specific balance outcome measures | |
| No control group | |
| No control group | |
| Description of study | |
| No exercise intervention | |
| No appropriate outcome measures of balance | |
| Control group received flexibility training | |
| No specific balance outcome measures | |
| No specific balance outcome measures | |
| Control group had home exercise | |
| No specific balance outcome measures | |
| No specific balance outcome measures | |
| Participants had received cardiopulmonary rehabilitation for prior medical conditions. | |
| Control group had PT | |
| Control group had exercise | |
| No specific balance outcome measures | |
| Intervention under investigation cobblestone mat | |
| Control group had stretching | |
| Control group had exercise programme | |
| all participants had low bone mass | |
| Participants were chronic stroke patients | |
| No measures | |
| Primary outcome falls no primary outcome measure for balance | |
| No specific balance outcome measures | |
| No specific balance outcome measures | |
| Participants had osteoarthritis | |
| No measures | |
| No measures | |
| Control group had exercise | |
| Not randomised | |
| Investigating effects of electrical stimulation | |
| Participants had balance disorders | |
| Participants were visually impaired | |
| Commentary on Robertson 2001 | |
| No control group | |
| Age range from 41 years to 53 years. | |
| Commentary on Campbell 1997 | |
| Control groups received exercise | |
| No specific balance outcome measures | |
| Water versus land based exercise | |
| No appropriate outcome measures of balance | |
| Description of FAME programme no data reported | |
| Control group had video programme | |
| Control group had PT | |
| No specific balance outcome measures | |
| Participants with chronic peripheral vestibular disfunction | |
| Control group had home exercise | |
| No specific balance outcome measures | |
| Commentary on Wolf 1996 | |
| No control group | |
| Control group had exercise | |
| No specific balance outcome measures | |
| No specific balance outcome measures | |
| Multifactorial intervention |
Data and analyses
| Outcome or subgroup title | No. of studies | No. of participants | Statistical method | Effect size |
| 1 AP stability during stance (quiet and dynamic) eyes open: lower values indicate better balance ability Show forest plot | 3 | Std. Mean Difference (IV, Random, 95% CI) | Subtotals only | |
| Analysis 1.1  Comparison 1 Gait, balance, co‐ordination, functional tasks exercise versus control, Outcome 1 AP stability during stance (quiet and dynamic) eyes open: lower values indicate better balance ability. | ||||
| 1.1 Immediately post intervention | 3 | 116 | Std. Mean Difference (IV, Random, 95% CI) | ‐0.71 [‐1.33, ‐0.09] |
| 1.2 Follow‐up @ 6 weeks post intervention | 1 | 30 | Std. Mean Difference (IV, Random, 95% CI) | ‐0.63 [‐1.37, 0.10] |
| 1.3 Follow‐up @ 4 months post intervention | 1 | 35 | Std. Mean Difference (IV, Random, 95% CI) | ‐0.96 [‐1.67, ‐0.26] |
| 2 Mediolateral stability during stance (quiet and dynamic) eyes open: lower values indicate better balance Show forest plot | 3 | Std. Mean Difference (IV, Random, 95% CI) | Subtotals only | |
| Analysis 1.2  Comparison 1 Gait, balance, co‐ordination, functional tasks exercise versus control, Outcome 2 Mediolateral stability during stance (quiet and dynamic) eyes open: lower values indicate better balance. | ||||
| 2.1 Immediately post intervention | 3 | 116 | Std. Mean Difference (IV, Random, 95% CI) | ‐0.39 [‐0.98, 0.20] |
| 2.2 Follow‐up @ 6 weeks post intervention | 1 | 30 | Std. Mean Difference (IV, Random, 95% CI) | ‐0.68 [‐1.42, 0.06] |
| 2.3 Follow‐up @ 4 months post intervention | 1 | 35 | Std. Mean Difference (IV, Random, 95% CI) | 1.09 [0.37, 1.81] |
| 3 AP stability during quiet stance eyes closed: lower values indicate better balance ability Show forest plot | 2 | Std. Mean Difference (IV, Fixed, 95% CI) | Subtotals only | |
| Analysis 1.3  Comparison 1 Gait, balance, co‐ordination, functional tasks exercise versus control, Outcome 3 AP stability during quiet stance eyes closed: lower values indicate better balance ability. | ||||
| 3.1 Immediately post intervention | 2 | 82 | Std. Mean Difference (IV, Fixed, 95% CI) | ‐0.32 [‐0.77, 0.12] |
| 3.2 Follow up @ 4months post intervention | 1 | 35 | Std. Mean Difference (IV, Fixed, 95% CI) | ‐0.13 [‐0.79, 0.54] |
| 4 Mediolateral stability during quiet stance eyes closed: lower values indicate better balance ability Show forest plot | 2 | Std. Mean Difference (IV, Fixed, 95% CI) | Subtotals only | |
| Analysis 1.4  Comparison 1 Gait, balance, co‐ordination, functional tasks exercise versus control, Outcome 4 Mediolateral stability during quiet stance eyes closed: lower values indicate better balance ability. | ||||
| 4.1 Immediately post intervention | 2 | 82 | Std. Mean Difference (IV, Fixed, 95% CI) | ‐0.17 [‐0.60, 0.27] |
| 4.2 Follow up @ 4 months post intervention | 1 | 35 | Std. Mean Difference (IV, Fixed, 95% CI) | ‐0.15 [‐0.82, 0.51] |
| 5 Functional base of support during dynamic test (distance): higher values indicate greater balance ability Show forest plot | 1 | Mean Difference (IV, Fixed, 95% CI) | Subtotals only | |
| Analysis 1.5  Comparison 1 Gait, balance, co‐ordination, functional tasks exercise versus control, Outcome 5 Functional base of support during dynamic test (distance): higher values indicate greater balance ability. | ||||
| 5.1 Immediately post intervention | 1 | 35 | Mean Difference (IV, Fixed, 95% CI) | 0.12 [0.05, 0.19] |
| 5.2 Follow‐up @ 6 months post intervention | 1 | 33 | Mean Difference (IV, Fixed, 95% CI) | 0.08 [0.01, 0.15] |
| 6 Loss of balance during sensory organisation test (errors): less errors indicate better balance ability Show forest plot | 1 | Mean Difference (IV, Fixed, 95% CI) | Subtotals only | |
| Analysis 1.6  Comparison 1 Gait, balance, co‐ordination, functional tasks exercise versus control, Outcome 6 Loss of balance during sensory organisation test (errors): less errors indicate better balance ability. | ||||
| 6.1 Immediately post intervention | 1 | 53 | Mean Difference (IV, Fixed, 95% CI) | ‐1.1 [‐2.24, 0.04] |
| 6.2 Follow‐up @ 6 months post intervention | 1 | 47 | Mean Difference (IV, Fixed, 95% CI) | ‐1.1 [‐2.16, ‐0.04] |
| 7 Maxium excursion of limits of stability (LOS) test: higher values indicate better balance ability Show forest plot | 1 | Mean Difference (IV, Fixed, 95% CI) | Subtotals only | |
| Analysis 1.7  Comparison 1 Gait, balance, co‐ordination, functional tasks exercise versus control, Outcome 7 Maxium excursion of limits of stability (LOS) test: higher values indicate better balance ability. | ||||
| 7.1 Forward | 1 | 29 | Mean Difference (IV, Fixed, 95% CI) | 20.10 [8.66, 31.54] |
| 7.2 Backward | 1 | 29 | Mean Difference (IV, Fixed, 95% CI) | 8.90 [‐1.77, 19.57] |
| 7.3 Right | 1 | 29 | Mean Difference (IV, Fixed, 95% CI) | 19.0 [9.02, 28.98] |
| 7.4 Left | 1 | 29 | Mean Difference (IV, Fixed, 95% CI) | 12.80 [4.10, 21.50] |
| 8 Single leg stance eyes open (force platform measures): lower values indicate better balance ability Show forest plot | 1 | Mean Difference (IV, Fixed, 95% CI) | Subtotals only | |
| Analysis 1.8  Comparison 1 Gait, balance, co‐ordination, functional tasks exercise versus control, Outcome 8 Single leg stance eyes open (force platform measures): lower values indicate better balance ability. | ||||
| 8.1 Average XY area per second (square inches per second) | 1 | 42 | Mean Difference (IV, Fixed, 95% CI) | 0.02 [‐0.57, 0.61] |
| 8.2 Average radial area per second (square inches per second) | 1 | 42 | Mean Difference (IV, Fixed, 95% CI) | ‐0.05 [‐0.26, 0.16] |
| 8.3 Average velocity (inches per second) | 1 | 42 | Mean Difference (IV, Fixed, 95% CI) | 0.12 [‐0.62, 0.86] |
| 9 Single leg stance eyes closed (force platform measures): lower values indicate better balance ability Show forest plot | 1 | Mean Difference (IV, Fixed, 95% CI) | Subtotals only | |
| Analysis 1.9  Comparison 1 Gait, balance, co‐ordination, functional tasks exercise versus control, Outcome 9 Single leg stance eyes closed (force platform measures): lower values indicate better balance ability. | ||||
| 9.1 Average XY area per second (square inches per second) | 1 | 39 | Mean Difference (IV, Fixed, 95% CI) | ‐0.41 [‐1.85, 1.03] |
| 9.2 Average radial area per second (square inches per second) | 1 | 39 | Mean Difference (IV, Fixed, 95% CI) | ‐0.93 [‐2.05, 0.19] |
| 9.3 Average velocity (inches per second) | 1 | 39 | Mean Difference (IV, Fixed, 95% CI) | ‐0.55 [‐2.04, 0.94] |
| 10 Single leg stance time eyes open (s): higher values indicate better balance ability Show forest plot | 4 | Std. Mean Difference (IV, Fixed, 95% CI) | Subtotals only | |
| Analysis 1.10  Comparison 1 Gait, balance, co‐ordination, functional tasks exercise versus control, Outcome 10 Single leg stance time eyes open (s): higher values indicate better balance ability. | ||||
| 10.1 Immediately post intervention | 4 | 164 | Std. Mean Difference (IV, Fixed, 95% CI) | 0.33 [0.02, 0.64] |
| 10.2 Follow up @ 6 months post intervention | 1 | 37 | Std. Mean Difference (IV, Fixed, 95% CI) | 0.32 [‐0.33, 0.97] |
| 11 Single leg stance time eyes closed (s): higher values indicate better balance ability Show forest plot | 1 | 33 | Mean Difference (IV, Fixed, 95% CI) | 0.0 [‐1.20, 1.20] |
| Analysis 1.11  Comparison 1 Gait, balance, co‐ordination, functional tasks exercise versus control, Outcome 11 Single leg stance time eyes closed (s): higher values indicate better balance ability. | ||||
| 12 Functional Reach Test: higher values indicate better balance ability Show forest plot | 1 | 22 | Mean Difference (IV, Fixed, 95% CI) | 0.60 [‐1.71, 2.91] |
| Analysis 1.12  Comparison 1 Gait, balance, co‐ordination, functional tasks exercise versus control, Outcome 12 Functional Reach Test: higher values indicate better balance ability. | ||||
| 13 Timed up and go test (s): lower values indicate better balance ability Show forest plot | 1 | 22 | Mean Difference (IV, Fixed, 95% CI) | ‐1.5 [‐3.49, 0.49] |
| Analysis 1.13  Comparison 1 Gait, balance, co‐ordination, functional tasks exercise versus control, Outcome 13 Timed up and go test (s): lower values indicate better balance ability. | ||||
| 14 Self paced gait speed: higher values indicate better balance ability Show forest plot | 4 | Std. Mean Difference (IV, Fixed, 95% CI) | Subtotals only | |
| Analysis 1.14  Comparison 1 Gait, balance, co‐ordination, functional tasks exercise versus control, Outcome 14 Self paced gait speed: higher values indicate better balance ability. | ||||
| 14.1 Immediately post intervention | 4 | 176 | Std. Mean Difference (IV, Fixed, 95% CI) | 0.23 [‐0.07, 0.53] |
| 14.2 Follow‐up @ 6 months post intervention | 1 | 45 | Std. Mean Difference (IV, Fixed, 95% CI) | 0.31 [‐0.28, 0.90] |
| 14.3 Follow‐up @ 6 weeks post intervention | 1 | 30 | Std. Mean Difference (IV, Fixed, 95% CI) | 0.30 [‐0.42, 1.03] |
| 15 Walking on a beam (m): higher values indicate better balance ability Show forest plot | 1 | 33 | Mean Difference (IV, Fixed, 95% CI) | 0.0 [‐0.18, 0.18] |
| Analysis 1.15  Comparison 1 Gait, balance, co‐ordination, functional tasks exercise versus control, Outcome 15 Walking on a beam (m): higher values indicate better balance ability. | ||||
| 16 Berg Balance Scale (score out of 56) higher values indicate better balance ability Show forest plot | 3 | Mean Difference (IV, Fixed, 95% CI) | Subtotals only | |
| Analysis 1.16  Comparison 1 Gait, balance, co‐ordination, functional tasks exercise versus control, Outcome 16 Berg Balance Scale (score out of 56) higher values indicate better balance ability. | ||||
| 16.1 Immediately post intervention | 3 | 126 | Mean Difference (IV, Fixed, 95% CI) | 2.72 [0.94, 4.50] |
| 16.2 Follow up @ 4 weeks post intervention | 1 | 77 | Mean Difference (IV, Fixed, 95% CI) | 3.60 [‐1.96, 9.16] |
| 16.3 Follow up @ 1 year post intervention | 1 | 49 | Mean Difference (IV, Fixed, 95% CI) | 0.67 [‐7.29, 8.63] |
| Outcome or subgroup title | No. of studies | No. of participants | Statistical method | Effect size |
| 1 Functional base of support during dynamic test (distance): higher values indicate better balance ability Show forest plot | 1 | Mean Difference (IV, Fixed, 95% CI) | Subtotals only | |
| Analysis 2.1  Comparison 2 Strengthening exercise versus control, Outcome 1 Functional base of support during dynamic test (distance): higher values indicate better balance ability. | ||||
| 1.1 Immediately post intervention | 1 | 34 | Mean Difference (IV, Fixed, 95% CI) | ‐0.01 [‐0.09, 0.07] |
| 1.2 Follow‐up @ 6 months post intervention | 1 | 27 | Mean Difference (IV, Fixed, 95% CI) | 0.0 [‐0.10, 0.10] |
| 2 Loss of balance during sensory organisation test (errors): less errors indicate better balance ability Show forest plot | 1 | Mean Difference (IV, Fixed, 95% CI) | Subtotals only | |
| Analysis 2.2  Comparison 2 Strengthening exercise versus control, Outcome 2 Loss of balance during sensory organisation test (errors): less errors indicate better balance ability. | ||||
| 2.1 Immediately post intervention | 1 | 52 | Mean Difference (IV, Fixed, 95% CI) | ‐0.40 [‐1.66, 0.86] |
| 2.2 Follow‐up @ 6 months post intervention | 1 | 42 | Mean Difference (IV, Fixed, 95% CI) | ‐0.10 [‐1.63, 1.43] |
| 3 Tilt board (s) post‐pre change scores: higher values indicate better balance ability Show forest plot | 1 | Mean Difference (IV, Fixed, 95% CI) | Subtotals only | |
| Analysis 2.3  Comparison 2 Strengthening exercise versus control, Outcome 3 Tilt board (s) post‐pre change scores: higher values indicate better balance ability. | ||||
| 3.1 Omnidirectional tilt board (s) | 1 | 51 | Mean Difference (IV, Fixed, 95% CI) | ‐4.0 [‐7.89, ‐0.11] |
| 3.2 AP tilt board (s) | 1 | 51 | Mean Difference (IV, Fixed, 95% CI) | ‐1.0 [‐4.32, 2.32] |
| 4 Single leg stance time eyes open (s): higher values indicate better balance ability Show forest plot | 3 | 170 | Std. Mean Difference (IV, Fixed, 95% CI) | 0.39 [0.08, 0.70] |
| Analysis 2.4  Comparison 2 Strengthening exercise versus control, Outcome 4 Single leg stance time eyes open (s): higher values indicate better balance ability. | ||||
| 5 Single leg stance time eyes closed (s): higher values indicate better balance ability Show forest plot | 2 | Std. Mean Difference (IV, Random, 95% CI) | Subtotals only | |
| Analysis 2.5  Comparison 2 Strengthening exercise versus control, Outcome 5 Single leg stance time eyes closed (s): higher values indicate better balance ability. | ||||
| 5.1 Immediately post intervention | 2 | 119 | Std. Mean Difference (IV, Random, 95% CI) | 0.51 [‐0.31, 1.32] |
| 5.2 Follow up @ 6 months post intervention | 1 | 31 | Std. Mean Difference (IV, Random, 95% CI) | ‐0.09 [‐0.80, 0.63] |
| 6 Tandem walk over 10 feet (s): higher values indicate better balance ability Show forest plot | 1 | 81 | Mean Difference (IV, Fixed, 95% CI) | ‐2.0 [‐4.40, 0.40] |
| Analysis 2.6  Comparison 2 Strengthening exercise versus control, Outcome 6 Tandem walk over 10 feet (s): higher values indicate better balance ability. | ||||
| 7 Tandem stance (s): higher values indicate better balance ability Show forest plot | 3 | 165 | Std. Mean Difference (IV, Random, 95% CI) | 0.24 [‐0.34, 0.82] |
| Analysis 2.7  Comparison 2 Strengthening exercise versus control, Outcome 7 Tandem stance (s): higher values indicate better balance ability. | ||||
| 8 Functional Reach Test (FRT) (cm) pre‐post change scores: lower values indicate better balance ability Show forest plot | 1 | 49 | Mean Difference (IV, Fixed, 95% CI) | ‐4.33 [‐6.00, ‐0.66] |
| Analysis 2.8  Comparison 2 Strengthening exercise versus control, Outcome 8 Functional Reach Test (FRT) (cm) pre‐post change scores: lower values indicate better balance ability. | ||||
| 9 Timed up and go test (TUG) (s): lower values indicate better balance ability Show forest plot | 1 | 33 | Mean Difference (IV, Fixed, 95% CI) | ‐3.5 [‐9.70, 2.70] |
| Analysis 2.9  Comparison 2 Strengthening exercise versus control, Outcome 9 Timed up and go test (TUG) (s): lower values indicate better balance ability. | ||||
| 10 Gait speed: higher values indicate better balance ability Show forest plot | 5 | Std. Mean Difference (IV, Fixed, 95% CI) | Subtotals only | |
| Analysis 2.10  Comparison 2 Strengthening exercise versus control, Outcome 10 Gait speed: higher values indicate better balance ability. | ||||
| 10.1 Immediately post intervention | 5 | 304 | Std. Mean Difference (IV, Fixed, 95% CI) | 0.25 [0.02, 0.48] |
| 10.2 Follow‐up @ 6 months post intervention | 1 | 42 | Std. Mean Difference (IV, Fixed, 95% CI) | 0.24 [‐0.37, 0.85] |
| 11 Balance beam: post‐pre change scores (s): higher values indicate better balance ability Show forest plot | 2 | Mean Difference (IV, Fixed, 95% CI) | Subtotals only | |
| Analysis 2.11  Comparison 2 Strengthening exercise versus control, Outcome 11 Balance beam: post‐pre change scores (s): higher values indicate better balance ability. | ||||
| 11.1 Wide beam | 2 | 100 | Mean Difference (IV, Fixed, 95% CI) | ‐0.14 [‐0.55, 0.26] |
| 11.2 Narrow beam | 1 | 51 | Mean Difference (IV, Fixed, 95% CI) | 0.5 [‐0.14, 1.14] |
| Outcome or subgroup title | No. of studies | No. of participants | Statistical method | Effect size |
| 1 AP stability during stance (quiet and dynamic) eyes open: lower values indicate better balance ability Show forest plot | 2 | Std. Mean Difference (IV, Fixed, 95% CI) | Subtotals only | |
| Analysis 3.1  Comparison 3 3D (Tai Chi, Gi Gong, dance, yoga) versus control, Outcome 1 AP stability during stance (quiet and dynamic) eyes open: lower values indicate better balance ability. | ||||
| 1.1 Immediately post intervention | 2 | 87 | Std. Mean Difference (IV, Fixed, 95% CI) | ‐0.24 [‐0.66, 0.19] |
| 1.2 Follow‐up @ 3 months post intervention | 1 | 48 | Std. Mean Difference (IV, Fixed, 95% CI) | 0.17 [‐0.40, 0.75] |
| 1.3 Follow‐up @ 4 months post intervention | 1 | 35 | Std. Mean Difference (IV, Fixed, 95% CI) | ‐0.15 [‐0.82, 0.52] |
| 2 Mediolateral stability during stance (quiet and dynamic) eyes open: lower values indicate better balance Show forest plot | 1 | Std. Mean Difference (IV, Fixed, 95% CI) | Subtotals only | |
| Analysis 3.2  Comparison 3 3D (Tai Chi, Gi Gong, dance, yoga) versus control, Outcome 2 Mediolateral stability during stance (quiet and dynamic) eyes open: lower values indicate better balance. | ||||
| 2.1 Immediately post intervention | 1 | 38 | Std. Mean Difference (IV, Fixed, 95% CI) | 0.30 [‐0.34, 0.94] |
| 2.3 Follow‐up @ 4 months post intervention | 1 | 38 | Std. Mean Difference (IV, Fixed, 95% CI) | 0.30 [‐0.34, 0.94] |
| 3 AP stability during quiet stance eyes closed: lower values indicate better balance ability Show forest plot | 1 | Std. Mean Difference (IV, Fixed, 95% CI) | Subtotals only | |
| Analysis 3.3  Comparison 3 3D (Tai Chi, Gi Gong, dance, yoga) versus control, Outcome 3 AP stability during quiet stance eyes closed: lower values indicate better balance ability. | ||||
| 3.1 Immediately post intervention | 1 | 38 | Std. Mean Difference (IV, Fixed, 95% CI) | 0.21 [‐0.43, 0.84] |
| 3.2 Follow up @ 4months post intervention | 1 | 38 | Std. Mean Difference (IV, Fixed, 95% CI) | 0.35 [‐0.29, 0.99] |
| 4 Mediolateral stability during quiet stance eyes closed: lower values indicate better balance ability Show forest plot | 1 | Std. Mean Difference (IV, Fixed, 95% CI) | Subtotals only | |
| Analysis 3.4  Comparison 3 3D (Tai Chi, Gi Gong, dance, yoga) versus control, Outcome 4 Mediolateral stability during quiet stance eyes closed: lower values indicate better balance ability. | ||||
| 4.1 Immediately post intervention | 1 | 38 | Std. Mean Difference (IV, Fixed, 95% CI) | 0.00 [‐0.63, 0.64] |
| 4.2 Follow up @ 4 months post intervention | 1 | 38 | Std. Mean Difference (IV, Fixed, 95% CI) | 0.06 [‐0.57, 0.70] |
| 5 Area during narrow stance eyes open post‐pre change scores (mm2/s): lower values indicate better balance Show forest plot | 1 | Mean Difference (IV, Fixed, 95% CI) | Subtotals only | |
| Analysis 3.5  Comparison 3 3D (Tai Chi, Gi Gong, dance, yoga) versus control, Outcome 5 Area during narrow stance eyes open post‐pre change scores (mm2/s): lower values indicate better balance. | ||||
| 5.1 Immediately post intervention | 1 | 52 | Mean Difference (IV, Fixed, 95% CI) | ‐2.0 [‐21.89, 17.89] |
| 5.2 Follow‐up @ 3 months post intervention | 1 | 48 | Mean Difference (IV, Fixed, 95% CI) | 3.0 [‐17.47, 23.47] |
| 6 Angular radius narrow stance eyes open post‐pre change scores (mm): lower values indicate better balance Show forest plot | 1 | Mean Difference (IV, Fixed, 95% CI) | Subtotals only | |
| Analysis 3.6  Comparison 3 3D (Tai Chi, Gi Gong, dance, yoga) versus control, Outcome 6 Angular radius narrow stance eyes open post‐pre change scores (mm): lower values indicate better balance. | ||||
| 6.1 Immediately post intervention | 1 | 52 | Mean Difference (IV, Fixed, 95% CI) | ‐0.10 [‐1.14, 0.94] |
| 6.2 Follow‐up @ 3 months post intervention | 1 | 48 | Mean Difference (IV, Fixed, 95% CI) | 0.0 [‐1.11, 1.11] |
| 7 Area during narrow stance eyes closed post‐pre change scores (mm2/s): lower values indicate better balance Show forest plot | 1 | Mean Difference (IV, Fixed, 95% CI) | Subtotals only | |
| Analysis 3.7  Comparison 3 3D (Tai Chi, Gi Gong, dance, yoga) versus control, Outcome 7 Area during narrow stance eyes closed post‐pre change scores (mm2/s): lower values indicate better balance. | ||||
| 7.1 Immediately post intervention | 1 | 52 | Mean Difference (IV, Fixed, 95% CI) | 29.00 [‐28.94, 86.94] |
| 7.2 Follow‐up @ 3 months post intervention | 1 | 48 | Mean Difference (IV, Fixed, 95% CI) | 39.0 [‐19.01, 97.01] |
| 8 Angular radius narrow stance eyes closed post‐pre change scores (mm): lower values indicate better balance Show forest plot | 1 | Mean Difference (IV, Fixed, 95% CI) | Subtotals only | |
| Analysis 3.8  Comparison 3 3D (Tai Chi, Gi Gong, dance, yoga) versus control, Outcome 8 Angular radius narrow stance eyes closed post‐pre change scores (mm): lower values indicate better balance. | ||||
| 8.1 Immediately post intervention | 1 | 52 | Mean Difference (IV, Fixed, 95% CI) | 0.4 [‐1.23, 2.03] |
| 8.2 Follow‐up @ 3 months post intervention | 1 | 48 | Mean Difference (IV, Fixed, 95% CI) | 0.40 [‐1.28, 2.08] |
| 9 Omnidirectional tilt board post‐pre change scores (s): higher values indicate better balance ability Show forest plot | 1 | Mean Difference (IV, Fixed, 95% CI) | Subtotals only | |
| Analysis 3.9  Comparison 3 3D (Tai Chi, Gi Gong, dance, yoga) versus control, Outcome 9 Omnidirectional tilt board post‐pre change scores (s): higher values indicate better balance ability. | ||||
| 9.1 Immediately post intervention | 1 | 52 | Mean Difference (IV, Fixed, 95% CI) | ‐1.00 [‐7.08, 1.08] |
| 9.2 Follow‐up @ 3 months post intervention | 1 | 48 | Mean Difference (IV, Fixed, 95% CI) | ‐3.0 [‐7.54, 1.54] |
| 10 Single leg stance time eyes open (s): higher values indicate better balance ability Show forest plot | 2 | 85 | Std. Mean Difference (IV, Random, 95% CI) | 1.13 [‐0.17, 2.44] |
| Analysis 3.10  Comparison 3 3D (Tai Chi, Gi Gong, dance, yoga) versus control, Outcome 10 Single leg stance time eyes open (s): higher values indicate better balance ability. | ||||
| 11 Single leg stance time eyes closed (s): higher values indicate better balance ability Show forest plot | 1 | 38 | Mean Difference (IV, Fixed, 95% CI) | ‐1.20 [‐3.80, 1.40] |
| Analysis 3.11  Comparison 3 3D (Tai Chi, Gi Gong, dance, yoga) versus control, Outcome 11 Single leg stance time eyes closed (s): higher values indicate better balance ability. | ||||
| 12 Functional Reach Test (cm): higher values indicate better balance ability Show forest plot | 1 | 38 | Mean Difference (IV, Fixed, 95% CI) | 2.80 [‐1.05, 6.65] |
| Analysis 3.12  Comparison 3 3D (Tai Chi, Gi Gong, dance, yoga) versus control, Outcome 12 Functional Reach Test (cm): higher values indicate better balance ability. | ||||
| 13 Gait speed: higher values indicate better balance ability Show forest plot | 2 | Std. Mean Difference (IV, Fixed, 95% CI) | Subtotals only | |
| Analysis 3.13  Comparison 3 3D (Tai Chi, Gi Gong, dance, yoga) versus control, Outcome 13 Gait speed: higher values indicate better balance ability. | ||||
| 13.1 Immediately post intervention | 2 | 99 | Std. Mean Difference (IV, Fixed, 95% CI) | 0.05 [‐0.34, 0.45] |
| 13.2 Follow‐up @ 3 months post intervention | 1 | 48 | Std. Mean Difference (IV, Fixed, 95% CI) | 0.10 [‐0.48, 0.68] |
| 14 Wide balance beam post‐pre change scores (m/s): higher values indicate better balance ability Show forest plot | 1 | Mean Difference (IV, Fixed, 95% CI) | Subtotals only | |
| Analysis 3.14  Comparison 3 3D (Tai Chi, Gi Gong, dance, yoga) versus control, Outcome 14 Wide balance beam post‐pre change scores (m/s): higher values indicate better balance ability. | ||||
| 14.1 Immediately post intervention | 1 | 52 | Mean Difference (IV, Fixed, 95% CI) | ‐0.1 [‐0.16, ‐0.04] |
| 14.2 Follow‐up @3 months post intervention | 1 | 48 | Mean Difference (IV, Fixed, 95% CI) | ‐0.07 [‐0.17, 0.03] |
| 15 Narrow balance beam post‐pre change scores (m/s): higher values indicate better balance ability Show forest plot | 1 | Mean Difference (IV, Fixed, 95% CI) | Subtotals only | |
| Analysis 3.15  Comparison 3 3D (Tai Chi, Gi Gong, dance, yoga) versus control, Outcome 15 Narrow balance beam post‐pre change scores (m/s): higher values indicate better balance ability. | ||||
| 15.1 Immediately post intervention | 1 | 52 | Mean Difference (IV, Fixed, 95% CI) | 0.8 [‐0.01, 1.61] |
| 15.2 Follow‐up @3 months post intervention | 1 | 48 | Mean Difference (IV, Fixed, 95% CI) | 0.70 [‐0.08, 1.48] |
| Outcome or subgroup title | No. of studies | No. of participants | Statistical method | Effect size |
| 1 Postural sway double stance (post‐pre change scores): lower values indicate better balance ability Show forest plot | 1 | Mean Difference (IV, Fixed, 95% CI) | Subtotals only | |
| Analysis 4.1  Comparison 4 General physical activity versus control, Outcome 1 Postural sway double stance (post‐pre change scores): lower values indicate better balance ability. | ||||
| 1.1 Eyes open | 1 | 41 | Mean Difference (IV, Fixed, 95% CI) | ‐6.70 [‐17.59, 4.19] |
| 1.2 Eyes closed | 1 | 41 | Mean Difference (IV, Fixed, 95% CI) | ‐5.70 [‐26.82, 15.42] |
| 2 Functional Reach Test (cm): higher values indicate better balance ability Show forest plot | 1 | 42 | Mean Difference (IV, Fixed, 95% CI) | 11.8 [7.75, 15.85] |
| Analysis 4.2  Comparison 4 General physical activity versus control, Outcome 2 Functional Reach Test (cm): higher values indicate better balance ability. | ||||
| 3 Timed up and go test (s): lower values indicate better balance ability Show forest plot | 1 | 42 | Mean Difference (IV, Fixed, 95% CI) | ‐3.9 [‐5.83, ‐1.97] |
| Analysis 4.3  Comparison 4 General physical activity versus control, Outcome 3 Timed up and go test (s): lower values indicate better balance ability. | ||||
| Outcome or subgroup title | No. of studies | No. of participants | Statistical method | Effect size |
| 1 Area during narrow stance eyes open post‐pre change scores (mm2/s): lower values indicate better balance Show forest plot | 1 | Mean Difference (IV, Fixed, 95% CI) | Subtotals only | |
| Analysis 5.1  Comparison 5 General physical activity (walking) versus control, Outcome 1 Area during narrow stance eyes open post‐pre change scores (mm2/s): lower values indicate better balance. | ||||
| 1.1 Immediately post intervention | 1 | 52 | Mean Difference (IV, Fixed, 95% CI) | ‐4.0 [‐24.10, 16.10] |
| 1.2 Follow‐up @ 3 months post intervention | 1 | 51 | Mean Difference (IV, Fixed, 95% CI) | 1.0 [‐19.26, 21.26] |
| 2 Angular radius narrow stance eyes open post‐pre change scores (mm): lower values indicate better balance Show forest plot | 1 | Mean Difference (IV, Fixed, 95% CI) | Subtotals only | |
| Analysis 5.2  Comparison 5 General physical activity (walking) versus control, Outcome 2 Angular radius narrow stance eyes open post‐pre change scores (mm): lower values indicate better balance. | ||||
| 2.1 Immediately post intervention | 1 | 52 | Mean Difference (IV, Fixed, 95% CI) | ‐0.5 [‐1.54, 0.54] |
| 2.2 Follow‐up @ 3 months post intervention | 1 | 51 | Mean Difference (IV, Fixed, 95% CI) | ‐0.4 [‐1.47, 0.67] |
| 3 Area during narrow stance eyes closed post‐pre change scores (mm2/s): lower values indicate better balance Show forest plot | 1 | Mean Difference (IV, Fixed, 95% CI) | Subtotals only | |
| Analysis 5.3  Comparison 5 General physical activity (walking) versus control, Outcome 3 Area during narrow stance eyes closed post‐pre change scores (mm2/s): lower values indicate better balance. | ||||
| 3.1 Immediately post intervention | 1 | 52 | Mean Difference (IV, Fixed, 95% CI) | 102.0 [28.58, 175.42] |
| 3.2 Follow‐up @ 3 months post intervention | 1 | 51 | Mean Difference (IV, Fixed, 95% CI) | 118.00 [46.83, 189.17] |
| 4 Angular radius narrow stance eyes closed post‐pre change scores (mm): lower values indicate better balance Show forest plot | 1 | Mean Difference (IV, Fixed, 95% CI) | Subtotals only | |
| Analysis 5.4  Comparison 5 General physical activity (walking) versus control, Outcome 4 Angular radius narrow stance eyes closed post‐pre change scores (mm): lower values indicate better balance. | ||||
| 4.1 Immediately post intervention | 1 | 52 | Mean Difference (IV, Fixed, 95% CI) | 1.4 [‐0.26, 3.06] |
| 4.2 Follow‐up @ 3 months post intervention | 1 | 51 | Mean Difference (IV, Fixed, 95% CI) | 1.6 [‐0.05, 3.25] |
| 6 Dynamic balance lateral axis (degrees): higher values indicate better balance ability Show forest plot | 1 | Mean Difference (IV, Fixed, 95% CI) | Subtotals only | |
| Analysis 5.6  Comparison 5 General physical activity (walking) versus control, Outcome 6 Dynamic balance lateral axis (degrees): higher values indicate better balance ability. | ||||
| 6.1 Average position (degrees) | 1 | 21 | Mean Difference (IV, Fixed, 95% CI) | ‐0.20 [‐0.46, 0.06] |
| 6.2 Amplitude (degrees) | 1 | 21 | Mean Difference (IV, Fixed, 95% CI) | ‐2.50 [‐4.01, ‐0.99] |
| 7 Omnidirectional tilt board post‐pre change scores (s): higher values indicate better balance ability Show forest plot | 1 | Mean Difference (IV, Fixed, 95% CI) | Subtotals only | |
| Analysis 5.7  Comparison 5 General physical activity (walking) versus control, Outcome 7 Omnidirectional tilt board post‐pre change scores (s): higher values indicate better balance ability. | ||||
| 7.1 Immediately post intervention | 1 | 52 | Mean Difference (IV, Fixed, 95% CI) | ‐1.00 [‐7.08, 1.08] |
| 7.2 Follow‐up @ 3 months post intervention | 1 | 51 | Mean Difference (IV, Fixed, 95% CI) | ‐1.00 [‐7.12, 1.12] |
| 8 AP tilt board post‐pre change score (s): higher values indicate better balance ability Show forest plot | 1 | Mean Difference (IV, Fixed, 95% CI) | Subtotals only | |
| Analysis 5.8  Comparison 5 General physical activity (walking) versus control, Outcome 8 AP tilt board post‐pre change score (s): higher values indicate better balance ability. | ||||
| 8.1 Immediately post intervention | 1 | 52 | Mean Difference (IV, Fixed, 95% CI) | 1.0 [‐1.20, 3.20] |
| 8.2 Follow‐up @ 3 months post intervention | 1 | 51 | Mean Difference (IV, Fixed, 95% CI) | ‐1.0 [‐3.75, 1.75] |
| 9 Single leg stance time eyes open (s): Higher values indicate better balance ability Show forest plot | 2 | 95 | Std. Mean Difference (IV, Fixed, 95% CI) | 0.15 [‐0.26, 0.57] |
| Analysis 5.9  Comparison 5 General physical activity (walking) versus control, Outcome 9 Single leg stance time eyes open (s): Higher values indicate better balance ability. | ||||
| 10 Single leg stance time eyes closed (s): higher values indicate better balance ability Show forest plot | 1 | 69 | Mean Difference (IV, Fixed, 95% CI) | 0.40 [‐0.89, 1.69] |
| Analysis 5.10  Comparison 5 General physical activity (walking) versus control, Outcome 10 Single leg stance time eyes closed (s): higher values indicate better balance ability. | ||||
| 11 Tandem walk over 10 feet (s): lower values indicate better balance ability Show forest plot | 1 | 69 | Mean Difference (IV, Fixed, 95% CI) | ‐2.30 [‐4.05, ‐0.55] |
| Analysis 5.11  Comparison 5 General physical activity (walking) versus control, Outcome 11 Tandem walk over 10 feet (s): lower values indicate better balance ability. | ||||
| 12 Tandem stance (s): higher values indicate better balance ability Show forest plot | 1 | 69 | Mean Difference (IV, Fixed, 95% CI) | 12.90 [3.91, 21.89] |
| Analysis 5.12  Comparison 5 General physical activity (walking) versus control, Outcome 12 Tandem stance (s): higher values indicate better balance ability. | ||||
| 13 Functional Reach Test (cm): higher values indicate better balance ability Show forest plot | 1 | 26 | Mean Difference (IV, Fixed, 95% CI) | 10.92 [5.03, 16.81] |
| Analysis 5.13  Comparison 5 General physical activity (walking) versus control, Outcome 13 Functional Reach Test (cm): higher values indicate better balance ability. | ||||
| 14 Self paced gait velocity (m/min): higher values indicate better balance ability Show forest plot | 2 | Std. Mean Difference (IV, Fixed, 95% CI) | Subtotals only | |
| Analysis 5.14  Comparison 5 General physical activity (walking) versus control, Outcome 14 Self paced gait velocity (m/min): higher values indicate better balance ability. | ||||
| 14.1 Immediately post intervention | 2 | 73 | Std. Mean Difference (IV, Fixed, 95% CI) | 0.21 [‐0.26, 0.67] |
| 14.2 Follow‐up @ 3 months post intervention | 1 | 51 | Std. Mean Difference (IV, Fixed, 95% CI) | 0.44 [‐0.12, 1.00] |
| 15 Wide balance beam post‐pre change scores (m/s): higher values indicate better balance ability Show forest plot | 1 | Mean Difference (IV, Fixed, 95% CI) | Subtotals only | |
| Analysis 5.15  Comparison 5 General physical activity (walking) versus control, Outcome 15 Wide balance beam post‐pre change scores (m/s): higher values indicate better balance ability. | ||||
| 15.1 Immediately post intervention | 1 | 52 | Mean Difference (IV, Fixed, 95% CI) | 0.06 [‐0.01, 0.13] |
| 15.2 Follow‐up @3 months post intervention | 1 | 51 | Mean Difference (IV, Fixed, 95% CI) | 0.08 [‐0.01, 0.17] |
| 16 Narrow balance beam post‐pre change scores (m/s): higher values indicate better balance ability Show forest plot | 1 | Mean Difference (IV, Fixed, 95% CI) | Subtotals only | |
| Analysis 5.16  Comparison 5 General physical activity (walking) versus control, Outcome 16 Narrow balance beam post‐pre change scores (m/s): higher values indicate better balance ability. | ||||
| 16.1 Immediately post intervention | 1 | 52 | Mean Difference (IV, Fixed, 95% CI) | 0.5 [‐0.07, 1.07] |
| 16.2 Follow‐up @3 months post intervention | 1 | 51 | Mean Difference (IV, Fixed, 95% CI) | 0.3 [‐0.37, 0.97] |
| Outcome or subgroup title | No. of studies | No. of participants | Statistical method | Effect size |
| 1 Area during narrow stance eyes open post‐pre change scores (mm2/s): lower values indicate better balance Show forest plot | 1 | Mean Difference (IV, Fixed, 95% CI) | Subtotals only | |
| Analysis 6.1  Comparison 6 General physical activity (cycling) versus control, Outcome 1 Area during narrow stance eyes open post‐pre change scores (mm2/s): lower values indicate better balance. | ||||
| 1.1 Immediately post intervention | 1 | 51 | Mean Difference (IV, Fixed, 95% CI) | ‐15.0 [‐32.22, 2.22] |
| 1.2 Follow‐up @ 3 months post intervention | 1 | 49 | Mean Difference (IV, Fixed, 95% CI) | ‐12.0 [‐33.05, 9.05] |
| 2 Angular radius narrow stance eyes open post‐pre change scores (mm): lower values indicate better balance Show forest plot | 1 | Mean Difference (IV, Fixed, 95% CI) | Subtotals only | |
| Analysis 6.2  Comparison 6 General physical activity (cycling) versus control, Outcome 2 Angular radius narrow stance eyes open post‐pre change scores (mm): lower values indicate better balance. | ||||
| 2.1 Immediately post intervention | 1 | 51 | Mean Difference (IV, Fixed, 95% CI) | ‐0.8 [‐2.12, 0.52] |
| 2.2 Follow‐up @ 3 months post intervention | 1 | 49 | Mean Difference (IV, Fixed, 95% CI) | ‐0.80 [0.00, 0.40] |
| 3 Area narrow stance eyes closed post‐pre change scores (mm2/s): lower values indicate better balance Show forest plot | 1 | Mean Difference (IV, Fixed, 95% CI) | Subtotals only | |
| Analysis 6.3  Comparison 6 General physical activity (cycling) versus control, Outcome 3 Area narrow stance eyes closed post‐pre change scores (mm2/s): lower values indicate better balance. | ||||
| 3.1 Immediately post intervention | 1 | 51 | Mean Difference (IV, Fixed, 95% CI) | 38.0 [‐19.93, 95.93] |
| 3.2 Follow‐up @ 3 months post intervention | 1 | 49 | Mean Difference (IV, Fixed, 95% CI) | 55.00 [‐1.38, 111.38] |
| 4 Angular radius narrow stance eyes closed post‐pre change scores (mm): lower values indicate better balance Show forest plot | 1 | Mean Difference (IV, Fixed, 95% CI) | Subtotals only | |
| Analysis 6.4  Comparison 6 General physical activity (cycling) versus control, Outcome 4 Angular radius narrow stance eyes closed post‐pre change scores (mm): lower values indicate better balance. | ||||
| 4.1 Immediately post intervention | 1 | 51 | Mean Difference (IV, Fixed, 95% CI) | 1.0 [‐0.87, 2.87] |
| 4.2 Follow‐up @ 3 months post intervention | 1 | 49 | Mean Difference (IV, Fixed, 95% CI) | 1.30 [‐0.66, 3.26] |
| 5 AP tilt board post‐pre change score (s): higher values indicate better balance ability Show forest plot | 1 | Mean Difference (IV, Fixed, 95% CI) | Subtotals only | |
| Analysis 6.5  Comparison 6 General physical activity (cycling) versus control, Outcome 5 AP tilt board post‐pre change score (s): higher values indicate better balance ability. | ||||
| 5.1 Immediately post intervention | 1 | 51 | Mean Difference (IV, Fixed, 95% CI) | 0.0 [‐2.57, 2.57] |
| 5.2 Follow‐up @ 3 months post intervention | 1 | 49 | Mean Difference (IV, Fixed, 95% CI) | ‐2.0 [‐5.09, 1.09] |
| 6 Omnidirectional tilt board post‐pre change scores (s): higher values indicate better balance ability Show forest plot | 1 | Mean Difference (IV, Fixed, 95% CI) | Subtotals only | |
| Analysis 6.6  Comparison 6 General physical activity (cycling) versus control, Outcome 6 Omnidirectional tilt board post‐pre change scores (s): higher values indicate better balance ability. | ||||
| 6.1 Immediately post intervention | 1 | 51 | Mean Difference (IV, Fixed, 95% CI) | ‐1.0 [‐4.87, 2.87] |
| 6.2 Follow‐up @ 3 months post intervention | 1 | 49 | Mean Difference (IV, Fixed, 95% CI) | ‐5.0 [‐10.13, 0.13] |
| 7 Self paced gait velocity post‐pre change scores (m/min): higher values indicate better balance ability Show forest plot | 1 | Mean Difference (IV, Fixed, 95% CI) | Subtotals only | |
| Analysis 6.7  Comparison 6 General physical activity (cycling) versus control, Outcome 7 Self paced gait velocity post‐pre change scores (m/min): higher values indicate better balance ability. | ||||
| 7.1 Immediately post intervention | 1 | 51 | Mean Difference (IV, Fixed, 95% CI) | 3.00 [‐3.77, 9.77] |
| 7.2 Follow‐up @ 3 months post intervention | 1 | 49 | Mean Difference (IV, Fixed, 95% CI) | 3.0 [‐1.20, 7.20] |
| 8 Wide balance beam post‐pre change scores (m/s): higher values indicate better balance ability Show forest plot | 1 | Mean Difference (IV, Fixed, 95% CI) | Subtotals only | |
| Analysis 6.8  Comparison 6 General physical activity (cycling) versus control, Outcome 8 Wide balance beam post‐pre change scores (m/s): higher values indicate better balance ability. | ||||
| 8.1 Immediately post intervention | 1 | 51 | Mean Difference (IV, Fixed, 95% CI) | 0.0 [‐0.09, 0.09] |
| 8.2 Follow‐up @3 months post intervention | 1 | 49 | Mean Difference (IV, Fixed, 95% CI) | 0.07 [‐0.02, 0.16] |
| 9 Narrow balance beam post‐pre change scores (m/s): higher values indicate better balance ability Show forest plot | 1 | Mean Difference (IV, Fixed, 95% CI) | Subtotals only | |
| Analysis 6.9  Comparison 6 General physical activity (cycling) versus control, Outcome 9 Narrow balance beam post‐pre change scores (m/s): higher values indicate better balance ability. | ||||
| 9.1 Immediately post intervention | 1 | 51 | Mean Difference (IV, Fixed, 95% CI) | 0.1 [‐0.62, 0.82] |
| 9.2 Follow‐up @3 months post intervention | 1 | 49 | Mean Difference (IV, Fixed, 95% CI) | 0.3 [‐0.47, 1.07] |
| Outcome or subgroup title | No. of studies | No. of participants | Statistical method | Effect size |
| 1 Functional base of support (distance) during dynamic test: higher values indicate better balance ability Show forest plot | 1 | Mean Difference (IV, Fixed, 95% CI) | Subtotals only | |
| Analysis 7.1  Comparison 7 Multiple exercise types versus control, Outcome 1 Functional base of support (distance) during dynamic test: higher values indicate better balance ability. | ||||
| 1.1 Immediately post intervention | 1 | 32 | Mean Difference (IV, Fixed, 95% CI) | 0.09 [0.03, 0.15] |
| 1.2 Follow‐up @ 6 months post intervention | 1 | 26 | Mean Difference (IV, Fixed, 95% CI) | 0.09 [0.02, 0.16] |
| 2 Maximal balance range (cm) during dynamic test: higher values indicate better balance ability Show forest plot | 2 | 595 | Mean Difference (IV, Random, 95% CI) | 0.76 [‐1.29, 2.81] |
| Analysis 7.2  Comparison 7 Multiple exercise types versus control, Outcome 2 Maximal balance range (cm) during dynamic test: higher values indicate better balance ability. | ||||
| 3 Total distance travelled by COP during quiet stance (mm): lower values indicate better balance ability Show forest plot | 1 | Mean Difference (IV, Fixed, 95% CI) | Subtotals only | |
| Analysis 7.3  Comparison 7 Multiple exercise types versus control, Outcome 3 Total distance travelled by COP during quiet stance (mm): lower values indicate better balance ability. | ||||
| 3.1 Eyes open | 1 | 14 | Mean Difference (IV, Fixed, 95% CI) | 97.15 [18.59, 175.71] |
| 3.2 Eyes closed | 1 | 14 | Mean Difference (IV, Fixed, 95% CI) | 212.52 [114.79, 310.25] |
| 4 Sway (mm) during dynamic test: higher values indicate better balance ability Show forest plot | 3 | Std. Mean Difference (IV, Random, 95% CI) | Subtotals only | |
| Analysis 7.4  Comparison 7 Multiple exercise types versus control, Outcome 4 Sway (mm) during dynamic test: higher values indicate better balance ability. | ||||
| 4.1 Floor, eyes open (immediately post intervention) | 3 | 893 | Std. Mean Difference (IV, Random, 95% CI) | ‐0.08 [‐0.41, 0.24] |
| 4.2 Floor, eyes closed (immediately post intervention) | 3 | 893 | Std. Mean Difference (IV, Random, 95% CI) | ‐0.10 [‐0.24, 0.04] |
| 4.3 Foam, eyes open (immediately post intervention) | 3 | 893 | Std. Mean Difference (IV, Random, 95% CI) | ‐0.18 [‐0.59, 0.23] |
| 4.4 Foam, eyes closed (immediately post intervention) | 3 | 893 | Std. Mean Difference (IV, Random, 95% CI) | ‐0.10 [‐0.31, 0.11] |
| 5 Body sway (cm): lower values indicate better balance ability Show forest plot | 2 | 35 | Std. Mean Difference (IV, Fixed, 95% CI) | ‐0.87 [‐1.60, ‐0.13] |
| Analysis 7.5  Comparison 7 Multiple exercise types versus control, Outcome 5 Body sway (cm): lower values indicate better balance ability. | ||||
| 6 Loss of balance during sensory organisation test (errors): less errors indicate better balance ability Show forest plot | 1 | Mean Difference (IV, Fixed, 95% CI) | Subtotals only | |
| Analysis 7.6  Comparison 7 Multiple exercise types versus control, Outcome 6 Loss of balance during sensory organisation test (errors): less errors indicate better balance ability. | ||||
| 6.1 Immediately post intervention | 1 | 53 | Mean Difference (IV, Fixed, 95% CI) | ‐0.60 [‐1.86, 0.66] |
| 6.2 Follow‐up @ 6 months post intervention | 1 | 43 | Mean Difference (IV, Fixed, 95% CI) | ‐0.20 [‐1.59, 1.19] |
| 7 Co‐ordinated stability (errors): less errors indicate better balance ability Show forest plot | 3 | 829 | Mean Difference (IV, Fixed, 95% CI) | ‐0.76 [‐1.97, 0.44] |
| Analysis 7.7  Comparison 7 Multiple exercise types versus control, Outcome 7 Co‐ordinated stability (errors): less errors indicate better balance ability. | ||||
| 8 Single leg stance time eyes open (s): higher values indicate better balance ability Show forest plot | 4 | Mean Difference (IV, Fixed, 95% CI) | Subtotals only | |
| Analysis 7.8  Comparison 7 Multiple exercise types versus control, Outcome 8 Single leg stance time eyes open (s): higher values indicate better balance ability. | ||||
| 8.1 Immediately post intervention | 4 | 202 | Mean Difference (IV, Fixed, 95% CI) | 1.30 [‐0.85, 3.44] |
| 8.2 Follow up @ 6 months post intervention | 1 | 33 | Mean Difference (IV, Fixed, 95% CI) | 2.80 [‐4.73, 10.33] |
| 9 Single leg stance time eyes closed (s): higher values indicate better balance ability Show forest plot | 1 | 39 | Mean Difference (IV, Fixed, 95% CI) | 2.03 [‐0.29, 4.35] |
| Analysis 7.9  Comparison 7 Multiple exercise types versus control, Outcome 9 Single leg stance time eyes closed (s): higher values indicate better balance ability. | ||||
| 10 Semitandem stance time (s): higher values indicate better balance ability Show forest plot | 1 | Mean Difference (IV, Fixed, 95% CI) | Subtotals only | |
| Analysis 7.10  Comparison 7 Multiple exercise types versus control, Outcome 10 Semitandem stance time (s): higher values indicate better balance ability. | ||||
| 10.1 Immediately post intervention | 1 | 67 | Mean Difference (IV, Fixed, 95% CI) | 1.0 [‐0.52, 2.52] |
| 10.2 Follow‐up @ 3 months post intervention | 1 | 58 | Mean Difference (IV, Fixed, 95% CI) | 1.40 [‐0.63, 3.43] |
| 11 Parallel stance time (s): higher values indicate better balance ability Show forest plot | 1 | Mean Difference (IV, Fixed, 95% CI) | Subtotals only | |
| Analysis 7.11  Comparison 7 Multiple exercise types versus control, Outcome 11 Parallel stance time (s): higher values indicate better balance ability. | ||||
| 11.1 Immediately post intervention | 1 | 67 | Mean Difference (IV, Fixed, 95% CI) | 0.80 [‐0.47, 2.07] |
| 11.2 Follow‐up @ 3 months post intervention | 1 | 58 | Mean Difference (IV, Fixed, 95% CI) | ‐0.30 [‐1.66, 1.06] |
| 12 Tandem stance time (s): higher values indicate better balance ability Show forest plot | 1 | Mean Difference (IV, Fixed, 95% CI) | Subtotals only | |
| Analysis 7.12  Comparison 7 Multiple exercise types versus control, Outcome 12 Tandem stance time (s): higher values indicate better balance ability. | ||||
| 12.1 Immediately post intervention | 1 | 67 | Mean Difference (IV, Fixed, 95% CI) | 1.90 [0.06, 3.74] |
| 12.2 Follow‐up @ 3 months post intervention | 1 | 58 | Mean Difference (IV, Fixed, 95% CI) | 1.20 [‐0.64, 3.04] |
| 13 Tandem walk (number of steps): higher values indicate better balance ability Show forest plot | 1 | 39 | Mean Difference (IV, Fixed, 95% CI) | 3.39 [1.75, 5.03] |
| Analysis 7.13  Comparison 7 Multiple exercise types versus control, Outcome 13 Tandem walk (number of steps): higher values indicate better balance ability. | ||||
| 14 Tandem walk (s): lower values indicate better balance ability Show forest plot | 1 | 70 | Mean Difference (IV, Fixed, 95% CI) | ‐8.10 [‐13.71, ‐2.49] |
| Analysis 7.14  Comparison 7 Multiple exercise types versus control, Outcome 14 Tandem walk (s): lower values indicate better balance ability. | ||||
| 15 Functional Reach Test (cm): higher values indicate better balance ability Show forest plot | 2 | 60 | Mean Difference (IV, Fixed, 95% CI) | 5.80 [3.37, 8.23] |
| Analysis 7.15  Comparison 7 Multiple exercise types versus control, Outcome 15 Functional Reach Test (cm): higher values indicate better balance ability. | ||||
| 16 Gait speed: higher values indicate better balance ability Show forest plot | 6 | Std. Mean Difference (IV, Fixed, 95% CI) | Subtotals only | |
| Analysis 7.16  Comparison 7 Multiple exercise types versus control, Outcome 16 Gait speed: higher values indicate better balance ability. | ||||
| 16.1 Immediately post intervention | 6 | 264 | Std. Mean Difference (IV, Fixed, 95% CI) | ‐0.14 [‐0.38, 0.11] |
| 16.2 Follow‐up @ 6 months post intervention | 1 | 50 | Std. Mean Difference (IV, Fixed, 95% CI) | 0.37 [‐0.19, 0.93] |
| 16.3 Follow‐up @ 3 months post intervention | 1 | 58 | Std. Mean Difference (IV, Fixed, 95% CI) | ‐0.11 [‐0.63, 0.40] |
| Outcome or subgroup title | No. of studies | No. of participants | Statistical method | Effect size |
| 1 (01.10) Single leg stance time eyes open (s): higher values indicate better balance ability Show forest plot | 4 | Std. Mean Difference (IV, Fixed, 95% CI) | Subtotals only | |
| Analysis 8.1  Comparison 8 Sensitivity analyses for effect of clustering, Outcome 1 (01.10) Single leg stance time eyes open (s): higher values indicate better balance ability. | ||||
| 1.1 Immediately post intervention | 4 | 164 | Std. Mean Difference (IV, Fixed, 95% CI) | 0.33 [0.02, 0.64] |
| 2 (01.14) Self paced gait speed: higher values indicate better balance ability Show forest plot | 4 | Std. Mean Difference (IV, Fixed, 95% CI) | Subtotals only | |
| Analysis 8.2  Comparison 8 Sensitivity analyses for effect of clustering, Outcome 2 (01.14) Self paced gait speed: higher values indicate better balance ability. | ||||
| 2.1 Immediately post intervention | 4 | 176 | Std. Mean Difference (IV, Fixed, 95% CI) | 0.23 [‐0.07, 0.53] |

Comparison 1 Gait, balance, co‐ordination, functional tasks exercise versus control, Outcome 1 AP stability during stance (quiet and dynamic) eyes open: lower values indicate better balance ability.

Comparison 1 Gait, balance, co‐ordination, functional tasks exercise versus control, Outcome 2 Mediolateral stability during stance (quiet and dynamic) eyes open: lower values indicate better balance.

Comparison 1 Gait, balance, co‐ordination, functional tasks exercise versus control, Outcome 3 AP stability during quiet stance eyes closed: lower values indicate better balance ability.

Comparison 1 Gait, balance, co‐ordination, functional tasks exercise versus control, Outcome 4 Mediolateral stability during quiet stance eyes closed: lower values indicate better balance ability.

Comparison 1 Gait, balance, co‐ordination, functional tasks exercise versus control, Outcome 5 Functional base of support during dynamic test (distance): higher values indicate greater balance ability.

Comparison 1 Gait, balance, co‐ordination, functional tasks exercise versus control, Outcome 6 Loss of balance during sensory organisation test (errors): less errors indicate better balance ability.
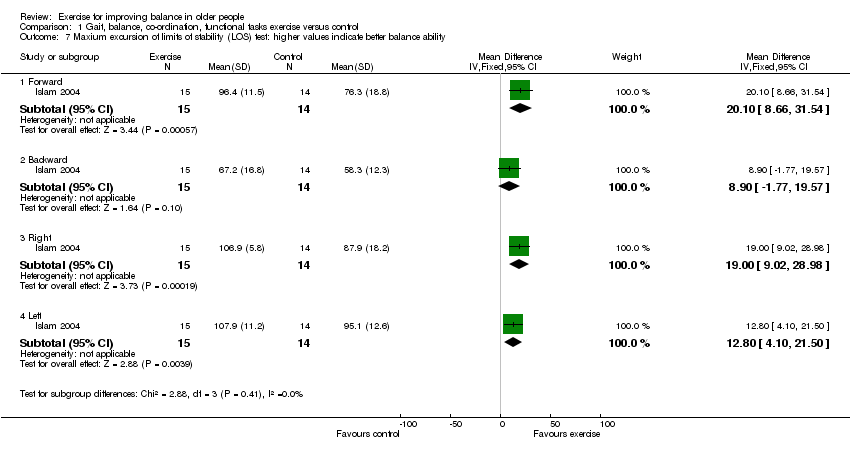
Comparison 1 Gait, balance, co‐ordination, functional tasks exercise versus control, Outcome 7 Maxium excursion of limits of stability (LOS) test: higher values indicate better balance ability.

Comparison 1 Gait, balance, co‐ordination, functional tasks exercise versus control, Outcome 8 Single leg stance eyes open (force platform measures): lower values indicate better balance ability.
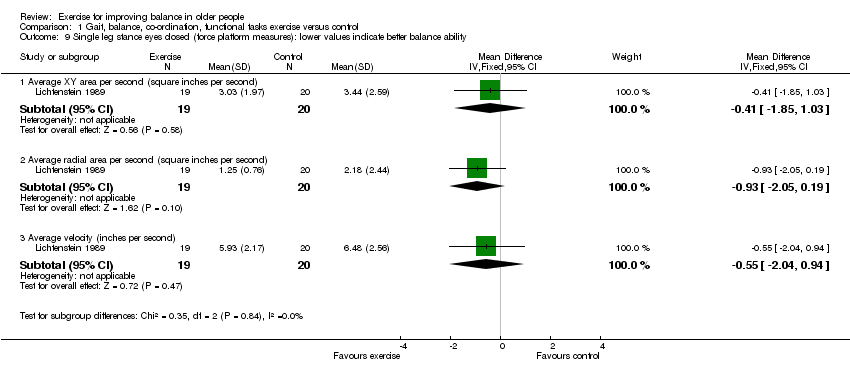
Comparison 1 Gait, balance, co‐ordination, functional tasks exercise versus control, Outcome 9 Single leg stance eyes closed (force platform measures): lower values indicate better balance ability.

Comparison 1 Gait, balance, co‐ordination, functional tasks exercise versus control, Outcome 10 Single leg stance time eyes open (s): higher values indicate better balance ability.

Comparison 1 Gait, balance, co‐ordination, functional tasks exercise versus control, Outcome 11 Single leg stance time eyes closed (s): higher values indicate better balance ability.

Comparison 1 Gait, balance, co‐ordination, functional tasks exercise versus control, Outcome 12 Functional Reach Test: higher values indicate better balance ability.

Comparison 1 Gait, balance, co‐ordination, functional tasks exercise versus control, Outcome 13 Timed up and go test (s): lower values indicate better balance ability.

Comparison 1 Gait, balance, co‐ordination, functional tasks exercise versus control, Outcome 14 Self paced gait speed: higher values indicate better balance ability.

Comparison 1 Gait, balance, co‐ordination, functional tasks exercise versus control, Outcome 15 Walking on a beam (m): higher values indicate better balance ability.

Comparison 1 Gait, balance, co‐ordination, functional tasks exercise versus control, Outcome 16 Berg Balance Scale (score out of 56) higher values indicate better balance ability.
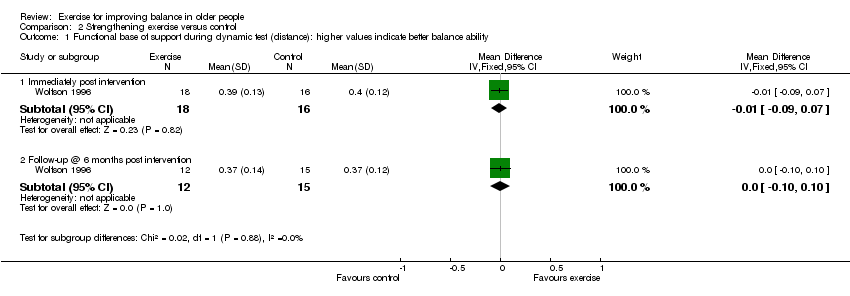
Comparison 2 Strengthening exercise versus control, Outcome 1 Functional base of support during dynamic test (distance): higher values indicate better balance ability.

Comparison 2 Strengthening exercise versus control, Outcome 2 Loss of balance during sensory organisation test (errors): less errors indicate better balance ability.

Comparison 2 Strengthening exercise versus control, Outcome 3 Tilt board (s) post‐pre change scores: higher values indicate better balance ability.

Comparison 2 Strengthening exercise versus control, Outcome 4 Single leg stance time eyes open (s): higher values indicate better balance ability.

Comparison 2 Strengthening exercise versus control, Outcome 5 Single leg stance time eyes closed (s): higher values indicate better balance ability.

Comparison 2 Strengthening exercise versus control, Outcome 6 Tandem walk over 10 feet (s): higher values indicate better balance ability.

Comparison 2 Strengthening exercise versus control, Outcome 7 Tandem stance (s): higher values indicate better balance ability.

Comparison 2 Strengthening exercise versus control, Outcome 8 Functional Reach Test (FRT) (cm) pre‐post change scores: lower values indicate better balance ability.

Comparison 2 Strengthening exercise versus control, Outcome 9 Timed up and go test (TUG) (s): lower values indicate better balance ability.
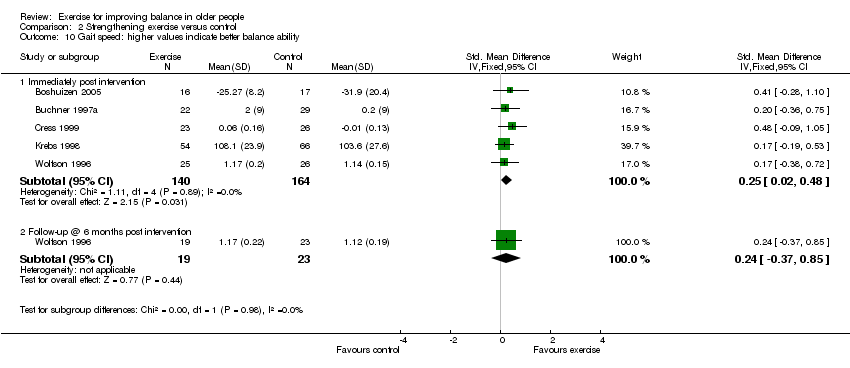
Comparison 2 Strengthening exercise versus control, Outcome 10 Gait speed: higher values indicate better balance ability.
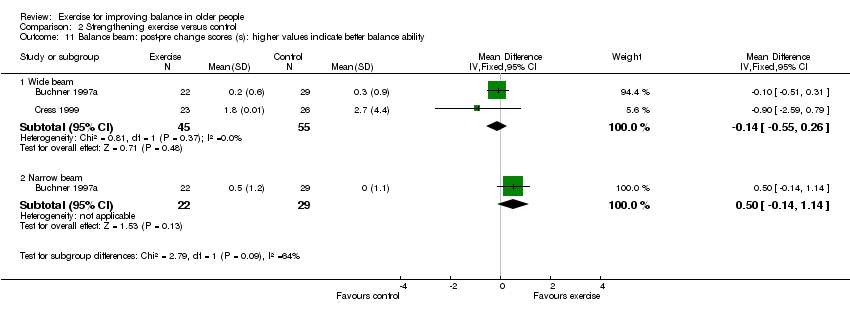
Comparison 2 Strengthening exercise versus control, Outcome 11 Balance beam: post‐pre change scores (s): higher values indicate better balance ability.
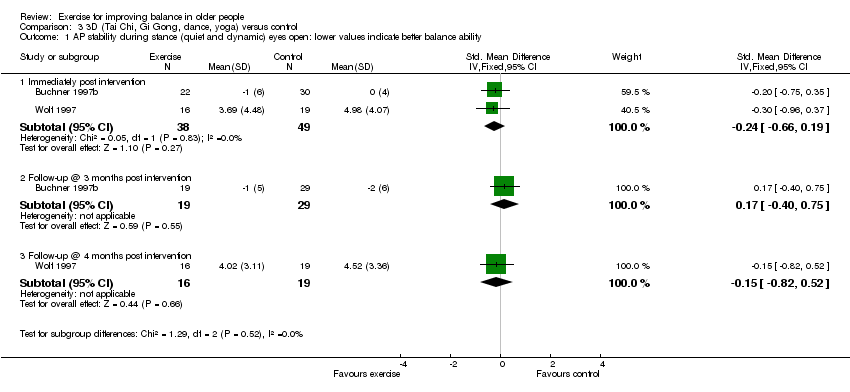
Comparison 3 3D (Tai Chi, Gi Gong, dance, yoga) versus control, Outcome 1 AP stability during stance (quiet and dynamic) eyes open: lower values indicate better balance ability.

Comparison 3 3D (Tai Chi, Gi Gong, dance, yoga) versus control, Outcome 2 Mediolateral stability during stance (quiet and dynamic) eyes open: lower values indicate better balance.
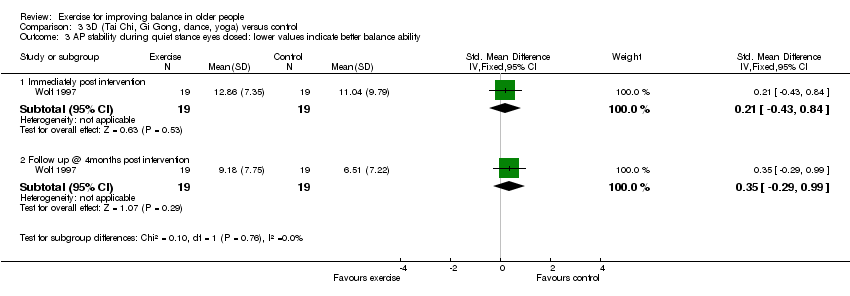
Comparison 3 3D (Tai Chi, Gi Gong, dance, yoga) versus control, Outcome 3 AP stability during quiet stance eyes closed: lower values indicate better balance ability.

Comparison 3 3D (Tai Chi, Gi Gong, dance, yoga) versus control, Outcome 4 Mediolateral stability during quiet stance eyes closed: lower values indicate better balance ability.
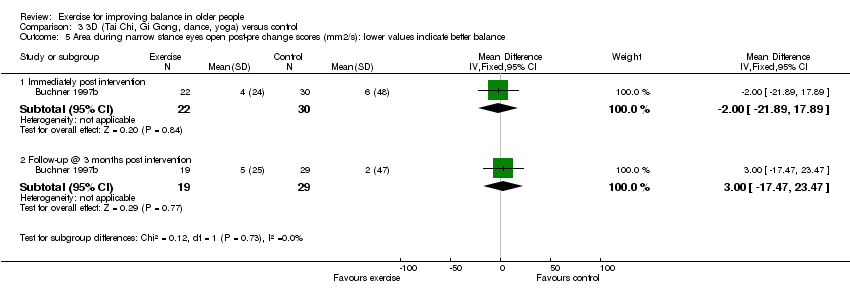
Comparison 3 3D (Tai Chi, Gi Gong, dance, yoga) versus control, Outcome 5 Area during narrow stance eyes open post‐pre change scores (mm2/s): lower values indicate better balance.

Comparison 3 3D (Tai Chi, Gi Gong, dance, yoga) versus control, Outcome 6 Angular radius narrow stance eyes open post‐pre change scores (mm): lower values indicate better balance.
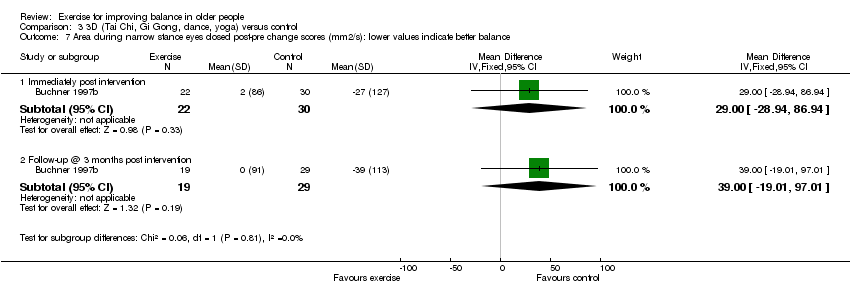
Comparison 3 3D (Tai Chi, Gi Gong, dance, yoga) versus control, Outcome 7 Area during narrow stance eyes closed post‐pre change scores (mm2/s): lower values indicate better balance.
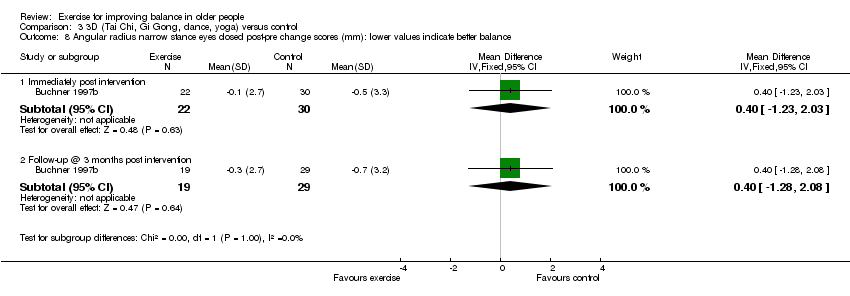
Comparison 3 3D (Tai Chi, Gi Gong, dance, yoga) versus control, Outcome 8 Angular radius narrow stance eyes closed post‐pre change scores (mm): lower values indicate better balance.

Comparison 3 3D (Tai Chi, Gi Gong, dance, yoga) versus control, Outcome 9 Omnidirectional tilt board post‐pre change scores (s): higher values indicate better balance ability.

Comparison 3 3D (Tai Chi, Gi Gong, dance, yoga) versus control, Outcome 10 Single leg stance time eyes open (s): higher values indicate better balance ability.

Comparison 3 3D (Tai Chi, Gi Gong, dance, yoga) versus control, Outcome 11 Single leg stance time eyes closed (s): higher values indicate better balance ability.

Comparison 3 3D (Tai Chi, Gi Gong, dance, yoga) versus control, Outcome 12 Functional Reach Test (cm): higher values indicate better balance ability.
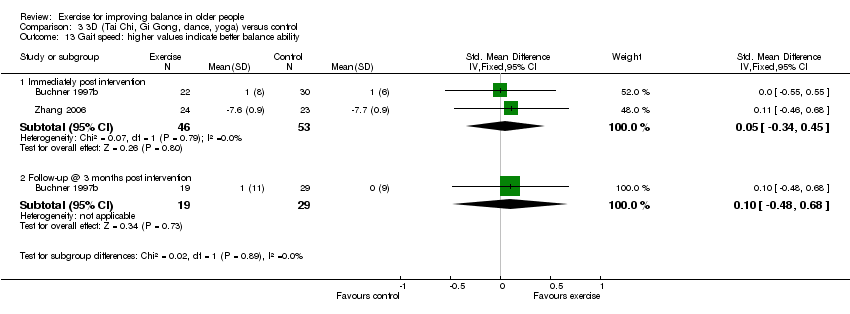
Comparison 3 3D (Tai Chi, Gi Gong, dance, yoga) versus control, Outcome 13 Gait speed: higher values indicate better balance ability.
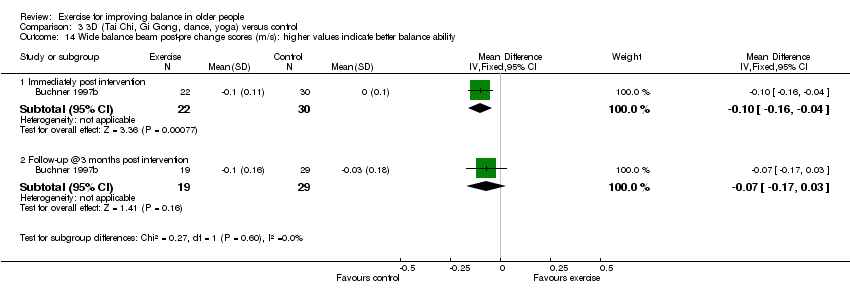
Comparison 3 3D (Tai Chi, Gi Gong, dance, yoga) versus control, Outcome 14 Wide balance beam post‐pre change scores (m/s): higher values indicate better balance ability.
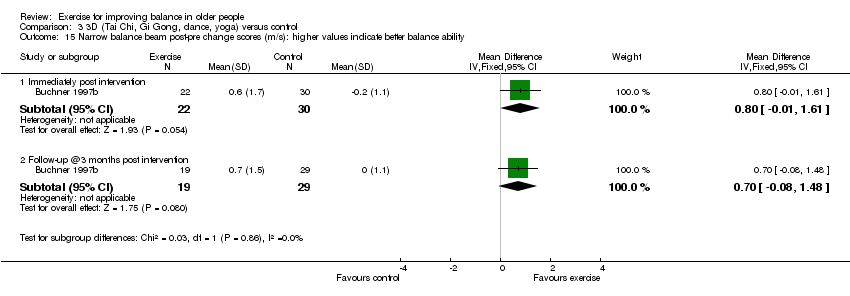
Comparison 3 3D (Tai Chi, Gi Gong, dance, yoga) versus control, Outcome 15 Narrow balance beam post‐pre change scores (m/s): higher values indicate better balance ability.
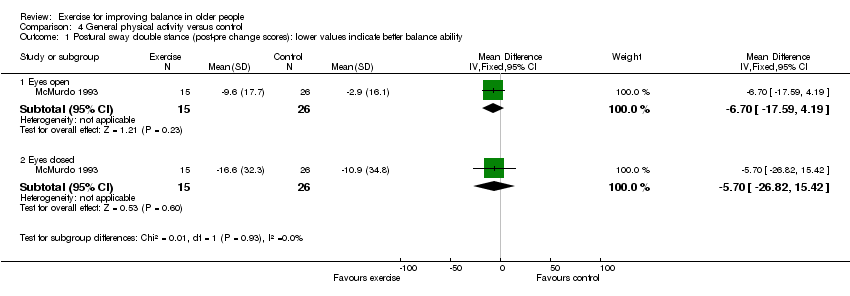
Comparison 4 General physical activity versus control, Outcome 1 Postural sway double stance (post‐pre change scores): lower values indicate better balance ability.

Comparison 4 General physical activity versus control, Outcome 2 Functional Reach Test (cm): higher values indicate better balance ability.

Comparison 4 General physical activity versus control, Outcome 3 Timed up and go test (s): lower values indicate better balance ability.
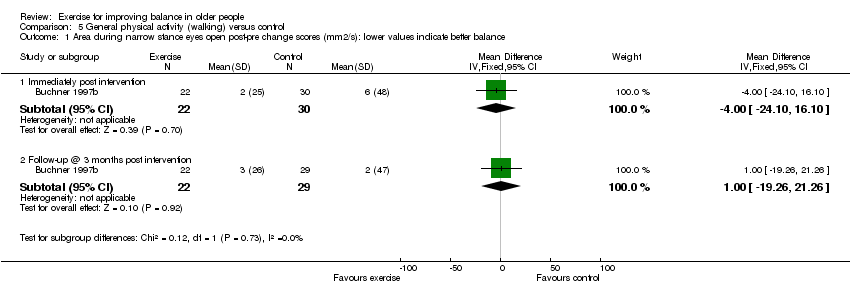
Comparison 5 General physical activity (walking) versus control, Outcome 1 Area during narrow stance eyes open post‐pre change scores (mm2/s): lower values indicate better balance.

Comparison 5 General physical activity (walking) versus control, Outcome 2 Angular radius narrow stance eyes open post‐pre change scores (mm): lower values indicate better balance.

Comparison 5 General physical activity (walking) versus control, Outcome 3 Area during narrow stance eyes closed post‐pre change scores (mm2/s): lower values indicate better balance.

Comparison 5 General physical activity (walking) versus control, Outcome 4 Angular radius narrow stance eyes closed post‐pre change scores (mm): lower values indicate better balance.
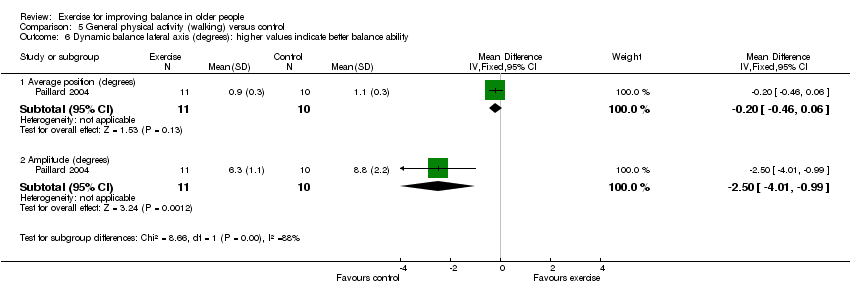
Comparison 5 General physical activity (walking) versus control, Outcome 6 Dynamic balance lateral axis (degrees): higher values indicate better balance ability.
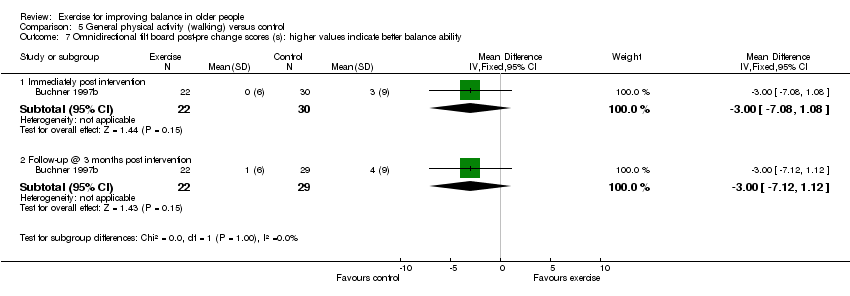
Comparison 5 General physical activity (walking) versus control, Outcome 7 Omnidirectional tilt board post‐pre change scores (s): higher values indicate better balance ability.
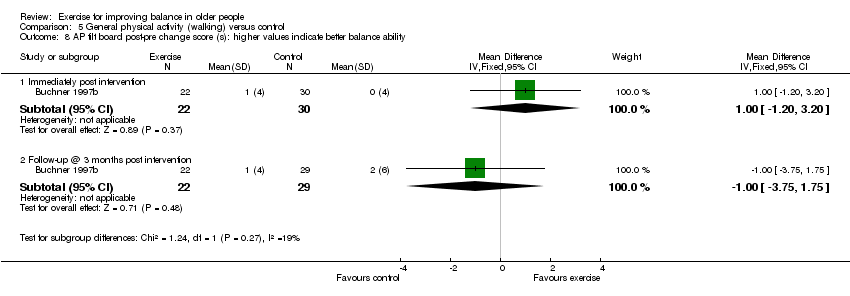
Comparison 5 General physical activity (walking) versus control, Outcome 8 AP tilt board post‐pre change score (s): higher values indicate better balance ability.

Comparison 5 General physical activity (walking) versus control, Outcome 9 Single leg stance time eyes open (s): Higher values indicate better balance ability.

Comparison 5 General physical activity (walking) versus control, Outcome 10 Single leg stance time eyes closed (s): higher values indicate better balance ability.

Comparison 5 General physical activity (walking) versus control, Outcome 11 Tandem walk over 10 feet (s): lower values indicate better balance ability.

Comparison 5 General physical activity (walking) versus control, Outcome 12 Tandem stance (s): higher values indicate better balance ability.

Comparison 5 General physical activity (walking) versus control, Outcome 13 Functional Reach Test (cm): higher values indicate better balance ability.

Comparison 5 General physical activity (walking) versus control, Outcome 14 Self paced gait velocity (m/min): higher values indicate better balance ability.

Comparison 5 General physical activity (walking) versus control, Outcome 15 Wide balance beam post‐pre change scores (m/s): higher values indicate better balance ability.

Comparison 5 General physical activity (walking) versus control, Outcome 16 Narrow balance beam post‐pre change scores (m/s): higher values indicate better balance ability.

Comparison 6 General physical activity (cycling) versus control, Outcome 1 Area during narrow stance eyes open post‐pre change scores (mm2/s): lower values indicate better balance.
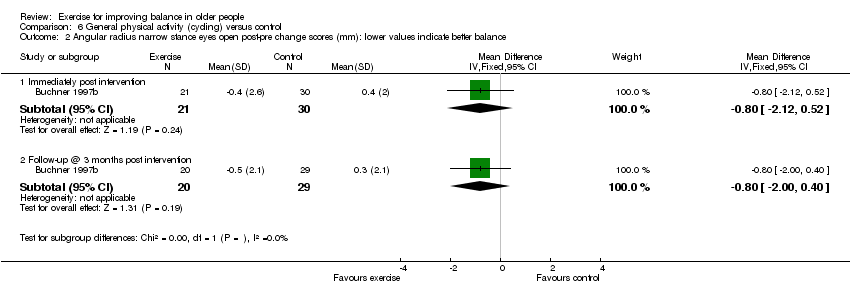
Comparison 6 General physical activity (cycling) versus control, Outcome 2 Angular radius narrow stance eyes open post‐pre change scores (mm): lower values indicate better balance.

Comparison 6 General physical activity (cycling) versus control, Outcome 3 Area narrow stance eyes closed post‐pre change scores (mm2/s): lower values indicate better balance.
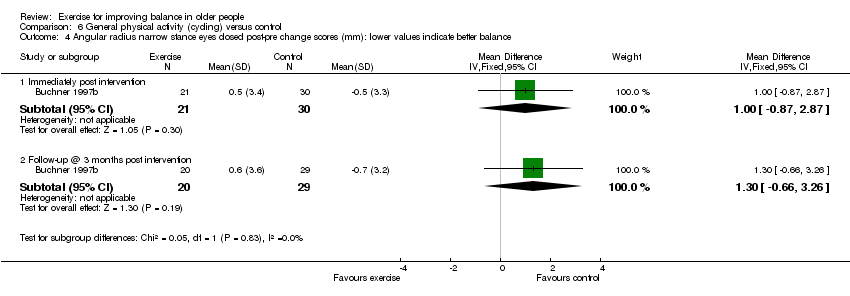
Comparison 6 General physical activity (cycling) versus control, Outcome 4 Angular radius narrow stance eyes closed post‐pre change scores (mm): lower values indicate better balance.

Comparison 6 General physical activity (cycling) versus control, Outcome 5 AP tilt board post‐pre change score (s): higher values indicate better balance ability.
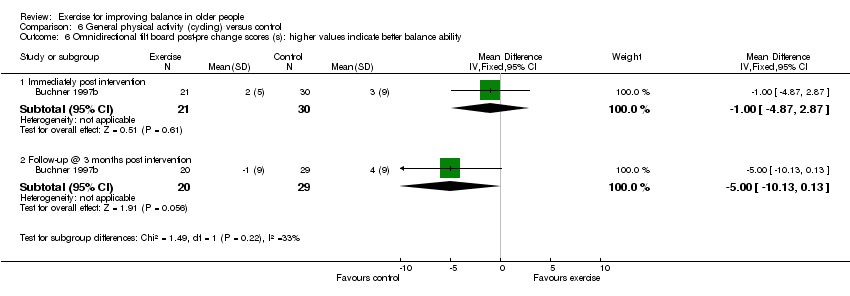
Comparison 6 General physical activity (cycling) versus control, Outcome 6 Omnidirectional tilt board post‐pre change scores (s): higher values indicate better balance ability.
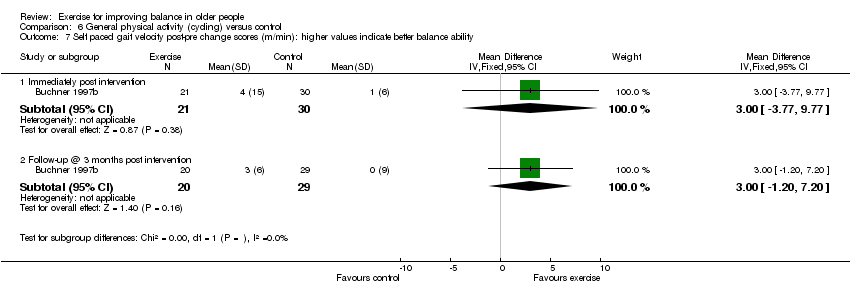
Comparison 6 General physical activity (cycling) versus control, Outcome 7 Self paced gait velocity post‐pre change scores (m/min): higher values indicate better balance ability.
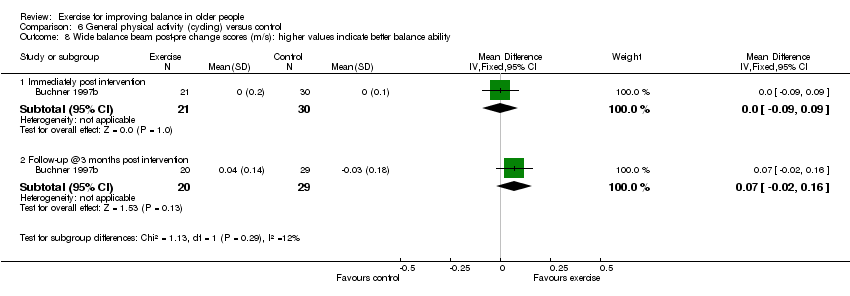
Comparison 6 General physical activity (cycling) versus control, Outcome 8 Wide balance beam post‐pre change scores (m/s): higher values indicate better balance ability.
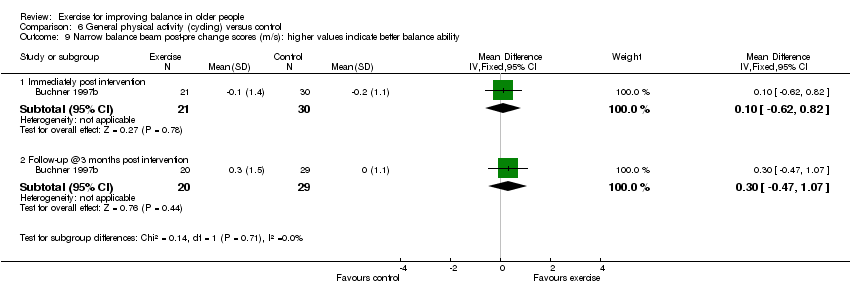
Comparison 6 General physical activity (cycling) versus control, Outcome 9 Narrow balance beam post‐pre change scores (m/s): higher values indicate better balance ability.

Comparison 7 Multiple exercise types versus control, Outcome 1 Functional base of support (distance) during dynamic test: higher values indicate better balance ability.

Comparison 7 Multiple exercise types versus control, Outcome 2 Maximal balance range (cm) during dynamic test: higher values indicate better balance ability.

Comparison 7 Multiple exercise types versus control, Outcome 3 Total distance travelled by COP during quiet stance (mm): lower values indicate better balance ability.

Comparison 7 Multiple exercise types versus control, Outcome 4 Sway (mm) during dynamic test: higher values indicate better balance ability.

Comparison 7 Multiple exercise types versus control, Outcome 5 Body sway (cm): lower values indicate better balance ability.
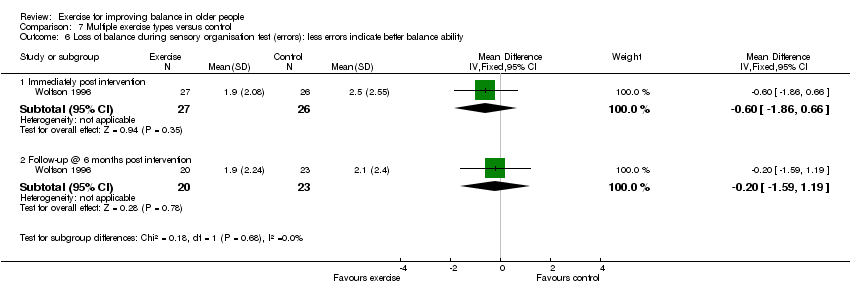
Comparison 7 Multiple exercise types versus control, Outcome 6 Loss of balance during sensory organisation test (errors): less errors indicate better balance ability.

Comparison 7 Multiple exercise types versus control, Outcome 7 Co‐ordinated stability (errors): less errors indicate better balance ability.

Comparison 7 Multiple exercise types versus control, Outcome 8 Single leg stance time eyes open (s): higher values indicate better balance ability.

Comparison 7 Multiple exercise types versus control, Outcome 9 Single leg stance time eyes closed (s): higher values indicate better balance ability.

Comparison 7 Multiple exercise types versus control, Outcome 10 Semitandem stance time (s): higher values indicate better balance ability.

Comparison 7 Multiple exercise types versus control, Outcome 11 Parallel stance time (s): higher values indicate better balance ability.
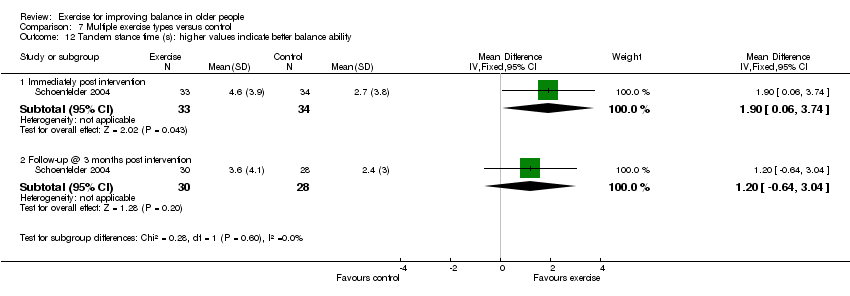
Comparison 7 Multiple exercise types versus control, Outcome 12 Tandem stance time (s): higher values indicate better balance ability.

Comparison 7 Multiple exercise types versus control, Outcome 13 Tandem walk (number of steps): higher values indicate better balance ability.

Comparison 7 Multiple exercise types versus control, Outcome 14 Tandem walk (s): lower values indicate better balance ability.

Comparison 7 Multiple exercise types versus control, Outcome 15 Functional Reach Test (cm): higher values indicate better balance ability.

Comparison 7 Multiple exercise types versus control, Outcome 16 Gait speed: higher values indicate better balance ability.

Comparison 8 Sensitivity analyses for effect of clustering, Outcome 1 (01.10) Single leg stance time eyes open (s): higher values indicate better balance ability.

Comparison 8 Sensitivity analyses for effect of clustering, Outcome 2 (01.14) Self paced gait speed: higher values indicate better balance ability.
| Glossary |
| 1RM ‐ one repetition maximum score |
| Items and scores |
| M‐A (D1b). Was the assigned treatment adequately concealed prior to allocation? |
| M‐B (D8). Were the outcomes of patients/participants who withdrew described and included in the analysis (intention to treat)? |
| M‐C (D4). Were the outcome assessors blinded to treatment status? |
| M‐D (D2). Were the treatment and control group comparable at entry? |
| M‐E (D6). Were the participants blind to assignment status after allocation? |
| M‐F (D5). Were the treatment providers blind to assignment status? |
| M‐G. Were care programmes, other than the trial options, identical? |
| M‐H (D3). Were the inclusion and exclusion criteria clearly defined? |
| M‐I. Were the interventions clearly defined? |
| M‐J. Were the outcome measures used clearly defined? |
| M‐K. Were tests used in outcome assessment clinically useful? |
| M‐L. Was the surveillance active, and of clinically appropriate duration (i.e. at least 3 months)? |
| D7. Were point estimates and measures of variability presented for the primary outcome measures? |
| MAC‐1. Was the compliance rate in each group likely to cause bias? |
| MAC‐2. Was there a description of adverse effects of the intervention(s)? |
| Study ID | M‐A (D1b) | M‐B (D8) | M‐C (D4) | M‐D (D2) | M‐E (D6) | M‐F (D5) | M‐G |
| Boshuizen 2005 | 1 | 2 | 2 | 2 | 0 | 0 | 0 |
| Brouwer 2003 | 1 | 1 | 0 | 2 | 0 | 0 | 0 |
| Buchner 1997a | 1 | 2 | 1 | 2 | 0 | 0 | 0 |
| Buchner 1997b | 1 | 2 | 2 | 2 | 0 | 0 | 0 |
| Cress 1999 | 1 | 0 | 0 | 2 | 0 | 0 | 0 |
| Crilly 1989 | 1 | 2 | 0 | 2 | 0 | 0 | 0 |
| Islam 2004 | 2 | 2 | 0 | 2 | 0 | 0 | 0 |
| Jessup 2003 | 1 | 2 | 2 | 2 | 0 | 0 | 0 |
| Johansson 1991 | 1 | 1 | 2 | 2 | 0 | 0 | 0 |
| Krebs 1998 | 1 | 1 | 1 | 2 | 0 | 0 | 2 |
| Lichtenstein 1989 | 2 | 1 | 0 | 1 | 2 | 0 | 0 |
| Lord 1995 | 2 | 2 | 2 | 2 | 0 | 0 | 2 |
| Lord 2003 | 1 | 1 | 0 | 0 | 0 | 0 | 0 |
| Lord 2005 | 1 | 1 | 2 | 2 | 0 | 0 | 0 |
| MacRae 1994 | 2 | 0 | 0 | 0 | 2 | 0 | 2 |
| McGarry 2001 | 1 | 0 | 0 | 0 | 0 | 0 | 0 |
| McMurdo 1993 | 2 | 2 | 2 | 2 | 0 | 0 | 0 |
| Nelson 2004 | 1 | 1 | 2 | 2 | 0 | 0 | 0 |
| Okumiya 1996 | 1 | 1 | 2 | 2 | 0 | 0 | 0 |
| Paillard 2004 | 2 | 0 | 0 | 0 | 0 | 0 | 1 |
| Ramsbottom 2004 | 2 | 2 | 0 | 1 | 0 | 0 | 2 |
| Reinsch 1992 | 1 | 1 | 0 | 1 | 1 | 0 | 1 |
| Rooks 1997a | 1 | 0 | 0 | 2 | 1 | 0 | 0 |
| Rubenstein 2000 | 1 | 0 | 1 | 2 | 0 | 1 | 2 |
| Sauvage 1992 | 1 | 0 | 2 | 2 | 0 | 0 | 2 |
| Schoenfelder 2004 | 1 | 0 | 1 | 1 | 2 | 0 | 0 |
| Shigematsu 2002 | 1 | 0 | 0 | 2 | 2 | 0 | 2 |
| Shimada 2004 | 1 | 1 | 0 | 2 | 0 | 0 | 2 |
| Sihvonen 2004 | 1 | 1 | 0 | 2 | 0 | 0 | 2 |
| Suzuki 2004 | 1 | 2 | 2 | 2 | 0 | 0 | 2 |
| Wolf 1997 | 1 | 0 | 0 | 2 | 0 | 0 | 2 |
| Wolf 2001 | 2 | 2 | 1 | 2 | 0 | 0 | 2 |
| Wolfson 1996 | 2 | 1 | 2 | 2 | 0 | 2 | 2 |
| Zhang 2006 | 0 | 0 | 0 | 2 | 0 | 0 | 2 |
| Study ID | M‐H (D3) | M‐I | M‐J | M‐K | M‐L | D7 | MAC‐1 | MAC‐2 |
| Boshuizen 2005 | 1 | 2 | 2 | 2 | 1 | 2 | 1 | 0 |
| Brouwer 2003 | 2 | 2 | 2 | 2 | 1 | 2 | 1 | 0 |
| Buchner 1997a | 2 | 2 | 2 | 2 | 2 | 2 | 2 | 1 |
| Buchner 1997b | 2 | 2 | 2 | 2 | 2 | 2 | 2 | 0 |
| Cress 1999 | 2 | 2 | 2 | 2 | 0 | 2 | 0 | 0 |
| Crilly 1989 | 2 | 0 | 2 | 1 | 1 | 2 | 0 | 0 |
| Islam 2004 | 2 | 2 | 2 | 1 | 2 | 2 | 2 | 2 |
| Jessup 2003 | 2 | 2 | 2 | 1 | 2 | 2 | 0 | 0 |
| Johansson 1991 | 2 | 2 | 2 | 1 | 1 | 2 | 1 | 0 |
| Krebs 1998 | 2 | 2 | 2 | 1 | 0 | 2 | 2 | 0 |
| Lichtenstein 1989 | 2 | 2 | 2 | 1 | 2 | 2 | 1 | 2 |
| Lord 1995 | 2 | 2 | 2 | 1 | 2 | 2 | 2 | 1 |
| Lord 2003 | 0 | 1 | 2 | 1 | 2 | 2 | 1 | 1 |
| Lord 2005 | 2 | 2 | 2 | 1 | 2 | 2 | 2 | 0 |
| MacRae 1994 | 1 | 2 | 2 | 1 | 2 | 2 | 2 | 0 |
| McGarry 2001 | 0 | 0 | 1 | 2 | 0 | 0 | 0 | 0 |
| McMurdo 1993 | 2 | 2 | 2 | 1 | 2 | 0 | 1 | 0 |
| Nelson 2004 | 2 | 2 | 2 | 2 | 0 | 2 | 1 | 2 |
| Okumiya 1996 | 1 | 1 | 2 | 1 | 2 | 2 | 1 | 0 |
| Paillard 2004 | 2 | 2 | 2 | 1 | 0 | 2 | 0 | 0 |
| Ramsbottom 2004 | 2 | 2 | 2 | 2 | 2 | 2 | 1 | 0 |
| Reinsch 1992 | 1 | 2 | 2 | 1 | 0 | 2 | 1 | 0 |
| Rooks 1997a | 2 | 2 | 2 | 2 | 0 | 2 | 0 | 2 |
| Rubenstein 2000 | 2 | 2 | 2 | 2 | 0 | 2 | 0 | 0 |
| Sauvage 1992 | 2 | 2 | 2 | 2 | 1 | 2 | 2 | 0 |
| Schoenfelder 2004 | 2 | 2 | 2 | 2 | 2 | 2 | 1 | 0 |
| Shigematsu 2002 | 2 | 2 | 2 | 2 | 1 | 2 | 2 | 0 |
| Shimada 2004 | 1 | 2 | 2 | 2 | 0 | 2 | 2 | 1 |
| Sihvonen 2004 | 2 | 2 | 2 | 1 | 1 | 2 | 2 | 0 |
| Suzuki 2004 | 1 | 1 | 2 | 1 | 2 | 1 | 2 | 2 |
| Wolf 1997 | 2 | 2 | 2 | 2 | 2 | 2 | 0 | 0 |
| Wolf 2001 | 2 | 2 | 2 | 1 | 2 | 2 | 0 | 0 |
| Wolfson 1996 | 2 | 2 | 2 | 2 | 2 | 2 | 2 | 2 |
| Zhang 2006 | 1 | 2 | 2 | 2 | 0 | 2 | 2 | 0 |
| Outcome or subgroup title | No. of studies | No. of participants | Statistical method | Effect size |
| 1 AP stability during stance (quiet and dynamic) eyes open: lower values indicate better balance ability Show forest plot | 3 | Std. Mean Difference (IV, Random, 95% CI) | Subtotals only | |
| 1.1 Immediately post intervention | 3 | 116 | Std. Mean Difference (IV, Random, 95% CI) | ‐0.71 [‐1.33, ‐0.09] |
| 1.2 Follow‐up @ 6 weeks post intervention | 1 | 30 | Std. Mean Difference (IV, Random, 95% CI) | ‐0.63 [‐1.37, 0.10] |
| 1.3 Follow‐up @ 4 months post intervention | 1 | 35 | Std. Mean Difference (IV, Random, 95% CI) | ‐0.96 [‐1.67, ‐0.26] |
| 2 Mediolateral stability during stance (quiet and dynamic) eyes open: lower values indicate better balance Show forest plot | 3 | Std. Mean Difference (IV, Random, 95% CI) | Subtotals only | |
| 2.1 Immediately post intervention | 3 | 116 | Std. Mean Difference (IV, Random, 95% CI) | ‐0.39 [‐0.98, 0.20] |
| 2.2 Follow‐up @ 6 weeks post intervention | 1 | 30 | Std. Mean Difference (IV, Random, 95% CI) | ‐0.68 [‐1.42, 0.06] |
| 2.3 Follow‐up @ 4 months post intervention | 1 | 35 | Std. Mean Difference (IV, Random, 95% CI) | 1.09 [0.37, 1.81] |
| 3 AP stability during quiet stance eyes closed: lower values indicate better balance ability Show forest plot | 2 | Std. Mean Difference (IV, Fixed, 95% CI) | Subtotals only | |
| 3.1 Immediately post intervention | 2 | 82 | Std. Mean Difference (IV, Fixed, 95% CI) | ‐0.32 [‐0.77, 0.12] |
| 3.2 Follow up @ 4months post intervention | 1 | 35 | Std. Mean Difference (IV, Fixed, 95% CI) | ‐0.13 [‐0.79, 0.54] |
| 4 Mediolateral stability during quiet stance eyes closed: lower values indicate better balance ability Show forest plot | 2 | Std. Mean Difference (IV, Fixed, 95% CI) | Subtotals only | |
| 4.1 Immediately post intervention | 2 | 82 | Std. Mean Difference (IV, Fixed, 95% CI) | ‐0.17 [‐0.60, 0.27] |
| 4.2 Follow up @ 4 months post intervention | 1 | 35 | Std. Mean Difference (IV, Fixed, 95% CI) | ‐0.15 [‐0.82, 0.51] |
| 5 Functional base of support during dynamic test (distance): higher values indicate greater balance ability Show forest plot | 1 | Mean Difference (IV, Fixed, 95% CI) | Subtotals only | |
| 5.1 Immediately post intervention | 1 | 35 | Mean Difference (IV, Fixed, 95% CI) | 0.12 [0.05, 0.19] |
| 5.2 Follow‐up @ 6 months post intervention | 1 | 33 | Mean Difference (IV, Fixed, 95% CI) | 0.08 [0.01, 0.15] |
| 6 Loss of balance during sensory organisation test (errors): less errors indicate better balance ability Show forest plot | 1 | Mean Difference (IV, Fixed, 95% CI) | Subtotals only | |
| 6.1 Immediately post intervention | 1 | 53 | Mean Difference (IV, Fixed, 95% CI) | ‐1.1 [‐2.24, 0.04] |
| 6.2 Follow‐up @ 6 months post intervention | 1 | 47 | Mean Difference (IV, Fixed, 95% CI) | ‐1.1 [‐2.16, ‐0.04] |
| 7 Maxium excursion of limits of stability (LOS) test: higher values indicate better balance ability Show forest plot | 1 | Mean Difference (IV, Fixed, 95% CI) | Subtotals only | |
| 7.1 Forward | 1 | 29 | Mean Difference (IV, Fixed, 95% CI) | 20.10 [8.66, 31.54] |
| 7.2 Backward | 1 | 29 | Mean Difference (IV, Fixed, 95% CI) | 8.90 [‐1.77, 19.57] |
| 7.3 Right | 1 | 29 | Mean Difference (IV, Fixed, 95% CI) | 19.0 [9.02, 28.98] |
| 7.4 Left | 1 | 29 | Mean Difference (IV, Fixed, 95% CI) | 12.80 [4.10, 21.50] |
| 8 Single leg stance eyes open (force platform measures): lower values indicate better balance ability Show forest plot | 1 | Mean Difference (IV, Fixed, 95% CI) | Subtotals only | |
| 8.1 Average XY area per second (square inches per second) | 1 | 42 | Mean Difference (IV, Fixed, 95% CI) | 0.02 [‐0.57, 0.61] |
| 8.2 Average radial area per second (square inches per second) | 1 | 42 | Mean Difference (IV, Fixed, 95% CI) | ‐0.05 [‐0.26, 0.16] |
| 8.3 Average velocity (inches per second) | 1 | 42 | Mean Difference (IV, Fixed, 95% CI) | 0.12 [‐0.62, 0.86] |
| 9 Single leg stance eyes closed (force platform measures): lower values indicate better balance ability Show forest plot | 1 | Mean Difference (IV, Fixed, 95% CI) | Subtotals only | |
| 9.1 Average XY area per second (square inches per second) | 1 | 39 | Mean Difference (IV, Fixed, 95% CI) | ‐0.41 [‐1.85, 1.03] |
| 9.2 Average radial area per second (square inches per second) | 1 | 39 | Mean Difference (IV, Fixed, 95% CI) | ‐0.93 [‐2.05, 0.19] |
| 9.3 Average velocity (inches per second) | 1 | 39 | Mean Difference (IV, Fixed, 95% CI) | ‐0.55 [‐2.04, 0.94] |
| 10 Single leg stance time eyes open (s): higher values indicate better balance ability Show forest plot | 4 | Std. Mean Difference (IV, Fixed, 95% CI) | Subtotals only | |
| 10.1 Immediately post intervention | 4 | 164 | Std. Mean Difference (IV, Fixed, 95% CI) | 0.33 [0.02, 0.64] |
| 10.2 Follow up @ 6 months post intervention | 1 | 37 | Std. Mean Difference (IV, Fixed, 95% CI) | 0.32 [‐0.33, 0.97] |
| 11 Single leg stance time eyes closed (s): higher values indicate better balance ability Show forest plot | 1 | 33 | Mean Difference (IV, Fixed, 95% CI) | 0.0 [‐1.20, 1.20] |
| 12 Functional Reach Test: higher values indicate better balance ability Show forest plot | 1 | 22 | Mean Difference (IV, Fixed, 95% CI) | 0.60 [‐1.71, 2.91] |
| 13 Timed up and go test (s): lower values indicate better balance ability Show forest plot | 1 | 22 | Mean Difference (IV, Fixed, 95% CI) | ‐1.5 [‐3.49, 0.49] |
| 14 Self paced gait speed: higher values indicate better balance ability Show forest plot | 4 | Std. Mean Difference (IV, Fixed, 95% CI) | Subtotals only | |
| 14.1 Immediately post intervention | 4 | 176 | Std. Mean Difference (IV, Fixed, 95% CI) | 0.23 [‐0.07, 0.53] |
| 14.2 Follow‐up @ 6 months post intervention | 1 | 45 | Std. Mean Difference (IV, Fixed, 95% CI) | 0.31 [‐0.28, 0.90] |
| 14.3 Follow‐up @ 6 weeks post intervention | 1 | 30 | Std. Mean Difference (IV, Fixed, 95% CI) | 0.30 [‐0.42, 1.03] |
| 15 Walking on a beam (m): higher values indicate better balance ability Show forest plot | 1 | 33 | Mean Difference (IV, Fixed, 95% CI) | 0.0 [‐0.18, 0.18] |
| 16 Berg Balance Scale (score out of 56) higher values indicate better balance ability Show forest plot | 3 | Mean Difference (IV, Fixed, 95% CI) | Subtotals only | |
| 16.1 Immediately post intervention | 3 | 126 | Mean Difference (IV, Fixed, 95% CI) | 2.72 [0.94, 4.50] |
| 16.2 Follow up @ 4 weeks post intervention | 1 | 77 | Mean Difference (IV, Fixed, 95% CI) | 3.60 [‐1.96, 9.16] |
| 16.3 Follow up @ 1 year post intervention | 1 | 49 | Mean Difference (IV, Fixed, 95% CI) | 0.67 [‐7.29, 8.63] |
| Outcome or subgroup title | No. of studies | No. of participants | Statistical method | Effect size |
| 1 Functional base of support during dynamic test (distance): higher values indicate better balance ability Show forest plot | 1 | Mean Difference (IV, Fixed, 95% CI) | Subtotals only | |
| 1.1 Immediately post intervention | 1 | 34 | Mean Difference (IV, Fixed, 95% CI) | ‐0.01 [‐0.09, 0.07] |
| 1.2 Follow‐up @ 6 months post intervention | 1 | 27 | Mean Difference (IV, Fixed, 95% CI) | 0.0 [‐0.10, 0.10] |
| 2 Loss of balance during sensory organisation test (errors): less errors indicate better balance ability Show forest plot | 1 | Mean Difference (IV, Fixed, 95% CI) | Subtotals only | |
| 2.1 Immediately post intervention | 1 | 52 | Mean Difference (IV, Fixed, 95% CI) | ‐0.40 [‐1.66, 0.86] |
| 2.2 Follow‐up @ 6 months post intervention | 1 | 42 | Mean Difference (IV, Fixed, 95% CI) | ‐0.10 [‐1.63, 1.43] |
| 3 Tilt board (s) post‐pre change scores: higher values indicate better balance ability Show forest plot | 1 | Mean Difference (IV, Fixed, 95% CI) | Subtotals only | |
| 3.1 Omnidirectional tilt board (s) | 1 | 51 | Mean Difference (IV, Fixed, 95% CI) | ‐4.0 [‐7.89, ‐0.11] |
| 3.2 AP tilt board (s) | 1 | 51 | Mean Difference (IV, Fixed, 95% CI) | ‐1.0 [‐4.32, 2.32] |
| 4 Single leg stance time eyes open (s): higher values indicate better balance ability Show forest plot | 3 | 170 | Std. Mean Difference (IV, Fixed, 95% CI) | 0.39 [0.08, 0.70] |
| 5 Single leg stance time eyes closed (s): higher values indicate better balance ability Show forest plot | 2 | Std. Mean Difference (IV, Random, 95% CI) | Subtotals only | |
| 5.1 Immediately post intervention | 2 | 119 | Std. Mean Difference (IV, Random, 95% CI) | 0.51 [‐0.31, 1.32] |
| 5.2 Follow up @ 6 months post intervention | 1 | 31 | Std. Mean Difference (IV, Random, 95% CI) | ‐0.09 [‐0.80, 0.63] |
| 6 Tandem walk over 10 feet (s): higher values indicate better balance ability Show forest plot | 1 | 81 | Mean Difference (IV, Fixed, 95% CI) | ‐2.0 [‐4.40, 0.40] |
| 7 Tandem stance (s): higher values indicate better balance ability Show forest plot | 3 | 165 | Std. Mean Difference (IV, Random, 95% CI) | 0.24 [‐0.34, 0.82] |
| 8 Functional Reach Test (FRT) (cm) pre‐post change scores: lower values indicate better balance ability Show forest plot | 1 | 49 | Mean Difference (IV, Fixed, 95% CI) | ‐4.33 [‐6.00, ‐0.66] |
| 9 Timed up and go test (TUG) (s): lower values indicate better balance ability Show forest plot | 1 | 33 | Mean Difference (IV, Fixed, 95% CI) | ‐3.5 [‐9.70, 2.70] |
| 10 Gait speed: higher values indicate better balance ability Show forest plot | 5 | Std. Mean Difference (IV, Fixed, 95% CI) | Subtotals only | |
| 10.1 Immediately post intervention | 5 | 304 | Std. Mean Difference (IV, Fixed, 95% CI) | 0.25 [0.02, 0.48] |
| 10.2 Follow‐up @ 6 months post intervention | 1 | 42 | Std. Mean Difference (IV, Fixed, 95% CI) | 0.24 [‐0.37, 0.85] |
| 11 Balance beam: post‐pre change scores (s): higher values indicate better balance ability Show forest plot | 2 | Mean Difference (IV, Fixed, 95% CI) | Subtotals only | |
| 11.1 Wide beam | 2 | 100 | Mean Difference (IV, Fixed, 95% CI) | ‐0.14 [‐0.55, 0.26] |
| 11.2 Narrow beam | 1 | 51 | Mean Difference (IV, Fixed, 95% CI) | 0.5 [‐0.14, 1.14] |
| Outcome or subgroup title | No. of studies | No. of participants | Statistical method | Effect size |
| 1 AP stability during stance (quiet and dynamic) eyes open: lower values indicate better balance ability Show forest plot | 2 | Std. Mean Difference (IV, Fixed, 95% CI) | Subtotals only | |
| 1.1 Immediately post intervention | 2 | 87 | Std. Mean Difference (IV, Fixed, 95% CI) | ‐0.24 [‐0.66, 0.19] |
| 1.2 Follow‐up @ 3 months post intervention | 1 | 48 | Std. Mean Difference (IV, Fixed, 95% CI) | 0.17 [‐0.40, 0.75] |
| 1.3 Follow‐up @ 4 months post intervention | 1 | 35 | Std. Mean Difference (IV, Fixed, 95% CI) | ‐0.15 [‐0.82, 0.52] |
| 2 Mediolateral stability during stance (quiet and dynamic) eyes open: lower values indicate better balance Show forest plot | 1 | Std. Mean Difference (IV, Fixed, 95% CI) | Subtotals only | |
| 2.1 Immediately post intervention | 1 | 38 | Std. Mean Difference (IV, Fixed, 95% CI) | 0.30 [‐0.34, 0.94] |
| 2.3 Follow‐up @ 4 months post intervention | 1 | 38 | Std. Mean Difference (IV, Fixed, 95% CI) | 0.30 [‐0.34, 0.94] |
| 3 AP stability during quiet stance eyes closed: lower values indicate better balance ability Show forest plot | 1 | Std. Mean Difference (IV, Fixed, 95% CI) | Subtotals only | |
| 3.1 Immediately post intervention | 1 | 38 | Std. Mean Difference (IV, Fixed, 95% CI) | 0.21 [‐0.43, 0.84] |
| 3.2 Follow up @ 4months post intervention | 1 | 38 | Std. Mean Difference (IV, Fixed, 95% CI) | 0.35 [‐0.29, 0.99] |
| 4 Mediolateral stability during quiet stance eyes closed: lower values indicate better balance ability Show forest plot | 1 | Std. Mean Difference (IV, Fixed, 95% CI) | Subtotals only | |
| 4.1 Immediately post intervention | 1 | 38 | Std. Mean Difference (IV, Fixed, 95% CI) | 0.00 [‐0.63, 0.64] |
| 4.2 Follow up @ 4 months post intervention | 1 | 38 | Std. Mean Difference (IV, Fixed, 95% CI) | 0.06 [‐0.57, 0.70] |
| 5 Area during narrow stance eyes open post‐pre change scores (mm2/s): lower values indicate better balance Show forest plot | 1 | Mean Difference (IV, Fixed, 95% CI) | Subtotals only | |
| 5.1 Immediately post intervention | 1 | 52 | Mean Difference (IV, Fixed, 95% CI) | ‐2.0 [‐21.89, 17.89] |
| 5.2 Follow‐up @ 3 months post intervention | 1 | 48 | Mean Difference (IV, Fixed, 95% CI) | 3.0 [‐17.47, 23.47] |
| 6 Angular radius narrow stance eyes open post‐pre change scores (mm): lower values indicate better balance Show forest plot | 1 | Mean Difference (IV, Fixed, 95% CI) | Subtotals only | |
| 6.1 Immediately post intervention | 1 | 52 | Mean Difference (IV, Fixed, 95% CI) | ‐0.10 [‐1.14, 0.94] |
| 6.2 Follow‐up @ 3 months post intervention | 1 | 48 | Mean Difference (IV, Fixed, 95% CI) | 0.0 [‐1.11, 1.11] |
| 7 Area during narrow stance eyes closed post‐pre change scores (mm2/s): lower values indicate better balance Show forest plot | 1 | Mean Difference (IV, Fixed, 95% CI) | Subtotals only | |
| 7.1 Immediately post intervention | 1 | 52 | Mean Difference (IV, Fixed, 95% CI) | 29.00 [‐28.94, 86.94] |
| 7.2 Follow‐up @ 3 months post intervention | 1 | 48 | Mean Difference (IV, Fixed, 95% CI) | 39.0 [‐19.01, 97.01] |
| 8 Angular radius narrow stance eyes closed post‐pre change scores (mm): lower values indicate better balance Show forest plot | 1 | Mean Difference (IV, Fixed, 95% CI) | Subtotals only | |
| 8.1 Immediately post intervention | 1 | 52 | Mean Difference (IV, Fixed, 95% CI) | 0.4 [‐1.23, 2.03] |
| 8.2 Follow‐up @ 3 months post intervention | 1 | 48 | Mean Difference (IV, Fixed, 95% CI) | 0.40 [‐1.28, 2.08] |
| 9 Omnidirectional tilt board post‐pre change scores (s): higher values indicate better balance ability Show forest plot | 1 | Mean Difference (IV, Fixed, 95% CI) | Subtotals only | |
| 9.1 Immediately post intervention | 1 | 52 | Mean Difference (IV, Fixed, 95% CI) | ‐1.00 [‐7.08, 1.08] |
| 9.2 Follow‐up @ 3 months post intervention | 1 | 48 | Mean Difference (IV, Fixed, 95% CI) | ‐3.0 [‐7.54, 1.54] |
| 10 Single leg stance time eyes open (s): higher values indicate better balance ability Show forest plot | 2 | 85 | Std. Mean Difference (IV, Random, 95% CI) | 1.13 [‐0.17, 2.44] |
| 11 Single leg stance time eyes closed (s): higher values indicate better balance ability Show forest plot | 1 | 38 | Mean Difference (IV, Fixed, 95% CI) | ‐1.20 [‐3.80, 1.40] |
| 12 Functional Reach Test (cm): higher values indicate better balance ability Show forest plot | 1 | 38 | Mean Difference (IV, Fixed, 95% CI) | 2.80 [‐1.05, 6.65] |
| 13 Gait speed: higher values indicate better balance ability Show forest plot | 2 | Std. Mean Difference (IV, Fixed, 95% CI) | Subtotals only | |
| 13.1 Immediately post intervention | 2 | 99 | Std. Mean Difference (IV, Fixed, 95% CI) | 0.05 [‐0.34, 0.45] |
| 13.2 Follow‐up @ 3 months post intervention | 1 | 48 | Std. Mean Difference (IV, Fixed, 95% CI) | 0.10 [‐0.48, 0.68] |
| 14 Wide balance beam post‐pre change scores (m/s): higher values indicate better balance ability Show forest plot | 1 | Mean Difference (IV, Fixed, 95% CI) | Subtotals only | |
| 14.1 Immediately post intervention | 1 | 52 | Mean Difference (IV, Fixed, 95% CI) | ‐0.1 [‐0.16, ‐0.04] |
| 14.2 Follow‐up @3 months post intervention | 1 | 48 | Mean Difference (IV, Fixed, 95% CI) | ‐0.07 [‐0.17, 0.03] |
| 15 Narrow balance beam post‐pre change scores (m/s): higher values indicate better balance ability Show forest plot | 1 | Mean Difference (IV, Fixed, 95% CI) | Subtotals only | |
| 15.1 Immediately post intervention | 1 | 52 | Mean Difference (IV, Fixed, 95% CI) | 0.8 [‐0.01, 1.61] |
| 15.2 Follow‐up @3 months post intervention | 1 | 48 | Mean Difference (IV, Fixed, 95% CI) | 0.70 [‐0.08, 1.48] |
| Outcome or subgroup title | No. of studies | No. of participants | Statistical method | Effect size |
| 1 Postural sway double stance (post‐pre change scores): lower values indicate better balance ability Show forest plot | 1 | Mean Difference (IV, Fixed, 95% CI) | Subtotals only | |
| 1.1 Eyes open | 1 | 41 | Mean Difference (IV, Fixed, 95% CI) | ‐6.70 [‐17.59, 4.19] |
| 1.2 Eyes closed | 1 | 41 | Mean Difference (IV, Fixed, 95% CI) | ‐5.70 [‐26.82, 15.42] |
| 2 Functional Reach Test (cm): higher values indicate better balance ability Show forest plot | 1 | 42 | Mean Difference (IV, Fixed, 95% CI) | 11.8 [7.75, 15.85] |
| 3 Timed up and go test (s): lower values indicate better balance ability Show forest plot | 1 | 42 | Mean Difference (IV, Fixed, 95% CI) | ‐3.9 [‐5.83, ‐1.97] |
| Outcome or subgroup title | No. of studies | No. of participants | Statistical method | Effect size |
| 1 Area during narrow stance eyes open post‐pre change scores (mm2/s): lower values indicate better balance Show forest plot | 1 | Mean Difference (IV, Fixed, 95% CI) | Subtotals only | |
| 1.1 Immediately post intervention | 1 | 52 | Mean Difference (IV, Fixed, 95% CI) | ‐4.0 [‐24.10, 16.10] |
| 1.2 Follow‐up @ 3 months post intervention | 1 | 51 | Mean Difference (IV, Fixed, 95% CI) | 1.0 [‐19.26, 21.26] |
| 2 Angular radius narrow stance eyes open post‐pre change scores (mm): lower values indicate better balance Show forest plot | 1 | Mean Difference (IV, Fixed, 95% CI) | Subtotals only | |
| 2.1 Immediately post intervention | 1 | 52 | Mean Difference (IV, Fixed, 95% CI) | ‐0.5 [‐1.54, 0.54] |
| 2.2 Follow‐up @ 3 months post intervention | 1 | 51 | Mean Difference (IV, Fixed, 95% CI) | ‐0.4 [‐1.47, 0.67] |
| 3 Area during narrow stance eyes closed post‐pre change scores (mm2/s): lower values indicate better balance Show forest plot | 1 | Mean Difference (IV, Fixed, 95% CI) | Subtotals only | |
| 3.1 Immediately post intervention | 1 | 52 | Mean Difference (IV, Fixed, 95% CI) | 102.0 [28.58, 175.42] |
| 3.2 Follow‐up @ 3 months post intervention | 1 | 51 | Mean Difference (IV, Fixed, 95% CI) | 118.00 [46.83, 189.17] |
| 4 Angular radius narrow stance eyes closed post‐pre change scores (mm): lower values indicate better balance Show forest plot | 1 | Mean Difference (IV, Fixed, 95% CI) | Subtotals only | |
| 4.1 Immediately post intervention | 1 | 52 | Mean Difference (IV, Fixed, 95% CI) | 1.4 [‐0.26, 3.06] |
| 4.2 Follow‐up @ 3 months post intervention | 1 | 51 | Mean Difference (IV, Fixed, 95% CI) | 1.6 [‐0.05, 3.25] |
| 6 Dynamic balance lateral axis (degrees): higher values indicate better balance ability Show forest plot | 1 | Mean Difference (IV, Fixed, 95% CI) | Subtotals only | |
| 6.1 Average position (degrees) | 1 | 21 | Mean Difference (IV, Fixed, 95% CI) | ‐0.20 [‐0.46, 0.06] |
| 6.2 Amplitude (degrees) | 1 | 21 | Mean Difference (IV, Fixed, 95% CI) | ‐2.50 [‐4.01, ‐0.99] |
| 7 Omnidirectional tilt board post‐pre change scores (s): higher values indicate better balance ability Show forest plot | 1 | Mean Difference (IV, Fixed, 95% CI) | Subtotals only | |
| 7.1 Immediately post intervention | 1 | 52 | Mean Difference (IV, Fixed, 95% CI) | ‐1.00 [‐7.08, 1.08] |
| 7.2 Follow‐up @ 3 months post intervention | 1 | 51 | Mean Difference (IV, Fixed, 95% CI) | ‐1.00 [‐7.12, 1.12] |
| 8 AP tilt board post‐pre change score (s): higher values indicate better balance ability Show forest plot | 1 | Mean Difference (IV, Fixed, 95% CI) | Subtotals only | |
| 8.1 Immediately post intervention | 1 | 52 | Mean Difference (IV, Fixed, 95% CI) | 1.0 [‐1.20, 3.20] |
| 8.2 Follow‐up @ 3 months post intervention | 1 | 51 | Mean Difference (IV, Fixed, 95% CI) | ‐1.0 [‐3.75, 1.75] |
| 9 Single leg stance time eyes open (s): Higher values indicate better balance ability Show forest plot | 2 | 95 | Std. Mean Difference (IV, Fixed, 95% CI) | 0.15 [‐0.26, 0.57] |
| 10 Single leg stance time eyes closed (s): higher values indicate better balance ability Show forest plot | 1 | 69 | Mean Difference (IV, Fixed, 95% CI) | 0.40 [‐0.89, 1.69] |
| 11 Tandem walk over 10 feet (s): lower values indicate better balance ability Show forest plot | 1 | 69 | Mean Difference (IV, Fixed, 95% CI) | ‐2.30 [‐4.05, ‐0.55] |
| 12 Tandem stance (s): higher values indicate better balance ability Show forest plot | 1 | 69 | Mean Difference (IV, Fixed, 95% CI) | 12.90 [3.91, 21.89] |
| 13 Functional Reach Test (cm): higher values indicate better balance ability Show forest plot | 1 | 26 | Mean Difference (IV, Fixed, 95% CI) | 10.92 [5.03, 16.81] |
| 14 Self paced gait velocity (m/min): higher values indicate better balance ability Show forest plot | 2 | Std. Mean Difference (IV, Fixed, 95% CI) | Subtotals only | |
| 14.1 Immediately post intervention | 2 | 73 | Std. Mean Difference (IV, Fixed, 95% CI) | 0.21 [‐0.26, 0.67] |
| 14.2 Follow‐up @ 3 months post intervention | 1 | 51 | Std. Mean Difference (IV, Fixed, 95% CI) | 0.44 [‐0.12, 1.00] |
| 15 Wide balance beam post‐pre change scores (m/s): higher values indicate better balance ability Show forest plot | 1 | Mean Difference (IV, Fixed, 95% CI) | Subtotals only | |
| 15.1 Immediately post intervention | 1 | 52 | Mean Difference (IV, Fixed, 95% CI) | 0.06 [‐0.01, 0.13] |
| 15.2 Follow‐up @3 months post intervention | 1 | 51 | Mean Difference (IV, Fixed, 95% CI) | 0.08 [‐0.01, 0.17] |
| 16 Narrow balance beam post‐pre change scores (m/s): higher values indicate better balance ability Show forest plot | 1 | Mean Difference (IV, Fixed, 95% CI) | Subtotals only | |
| 16.1 Immediately post intervention | 1 | 52 | Mean Difference (IV, Fixed, 95% CI) | 0.5 [‐0.07, 1.07] |
| 16.2 Follow‐up @3 months post intervention | 1 | 51 | Mean Difference (IV, Fixed, 95% CI) | 0.3 [‐0.37, 0.97] |
| Outcome or subgroup title | No. of studies | No. of participants | Statistical method | Effect size |
| 1 Area during narrow stance eyes open post‐pre change scores (mm2/s): lower values indicate better balance Show forest plot | 1 | Mean Difference (IV, Fixed, 95% CI) | Subtotals only | |
| 1.1 Immediately post intervention | 1 | 51 | Mean Difference (IV, Fixed, 95% CI) | ‐15.0 [‐32.22, 2.22] |
| 1.2 Follow‐up @ 3 months post intervention | 1 | 49 | Mean Difference (IV, Fixed, 95% CI) | ‐12.0 [‐33.05, 9.05] |
| 2 Angular radius narrow stance eyes open post‐pre change scores (mm): lower values indicate better balance Show forest plot | 1 | Mean Difference (IV, Fixed, 95% CI) | Subtotals only | |
| 2.1 Immediately post intervention | 1 | 51 | Mean Difference (IV, Fixed, 95% CI) | ‐0.8 [‐2.12, 0.52] |
| 2.2 Follow‐up @ 3 months post intervention | 1 | 49 | Mean Difference (IV, Fixed, 95% CI) | ‐0.80 [0.00, 0.40] |
| 3 Area narrow stance eyes closed post‐pre change scores (mm2/s): lower values indicate better balance Show forest plot | 1 | Mean Difference (IV, Fixed, 95% CI) | Subtotals only | |
| 3.1 Immediately post intervention | 1 | 51 | Mean Difference (IV, Fixed, 95% CI) | 38.0 [‐19.93, 95.93] |
| 3.2 Follow‐up @ 3 months post intervention | 1 | 49 | Mean Difference (IV, Fixed, 95% CI) | 55.00 [‐1.38, 111.38] |
| 4 Angular radius narrow stance eyes closed post‐pre change scores (mm): lower values indicate better balance Show forest plot | 1 | Mean Difference (IV, Fixed, 95% CI) | Subtotals only | |
| 4.1 Immediately post intervention | 1 | 51 | Mean Difference (IV, Fixed, 95% CI) | 1.0 [‐0.87, 2.87] |
| 4.2 Follow‐up @ 3 months post intervention | 1 | 49 | Mean Difference (IV, Fixed, 95% CI) | 1.30 [‐0.66, 3.26] |
| 5 AP tilt board post‐pre change score (s): higher values indicate better balance ability Show forest plot | 1 | Mean Difference (IV, Fixed, 95% CI) | Subtotals only | |
| 5.1 Immediately post intervention | 1 | 51 | Mean Difference (IV, Fixed, 95% CI) | 0.0 [‐2.57, 2.57] |
| 5.2 Follow‐up @ 3 months post intervention | 1 | 49 | Mean Difference (IV, Fixed, 95% CI) | ‐2.0 [‐5.09, 1.09] |
| 6 Omnidirectional tilt board post‐pre change scores (s): higher values indicate better balance ability Show forest plot | 1 | Mean Difference (IV, Fixed, 95% CI) | Subtotals only | |
| 6.1 Immediately post intervention | 1 | 51 | Mean Difference (IV, Fixed, 95% CI) | ‐1.0 [‐4.87, 2.87] |
| 6.2 Follow‐up @ 3 months post intervention | 1 | 49 | Mean Difference (IV, Fixed, 95% CI) | ‐5.0 [‐10.13, 0.13] |
| 7 Self paced gait velocity post‐pre change scores (m/min): higher values indicate better balance ability Show forest plot | 1 | Mean Difference (IV, Fixed, 95% CI) | Subtotals only | |
| 7.1 Immediately post intervention | 1 | 51 | Mean Difference (IV, Fixed, 95% CI) | 3.00 [‐3.77, 9.77] |
| 7.2 Follow‐up @ 3 months post intervention | 1 | 49 | Mean Difference (IV, Fixed, 95% CI) | 3.0 [‐1.20, 7.20] |
| 8 Wide balance beam post‐pre change scores (m/s): higher values indicate better balance ability Show forest plot | 1 | Mean Difference (IV, Fixed, 95% CI) | Subtotals only | |
| 8.1 Immediately post intervention | 1 | 51 | Mean Difference (IV, Fixed, 95% CI) | 0.0 [‐0.09, 0.09] |
| 8.2 Follow‐up @3 months post intervention | 1 | 49 | Mean Difference (IV, Fixed, 95% CI) | 0.07 [‐0.02, 0.16] |
| 9 Narrow balance beam post‐pre change scores (m/s): higher values indicate better balance ability Show forest plot | 1 | Mean Difference (IV, Fixed, 95% CI) | Subtotals only | |
| 9.1 Immediately post intervention | 1 | 51 | Mean Difference (IV, Fixed, 95% CI) | 0.1 [‐0.62, 0.82] |
| 9.2 Follow‐up @3 months post intervention | 1 | 49 | Mean Difference (IV, Fixed, 95% CI) | 0.3 [‐0.47, 1.07] |
| Outcome or subgroup title | No. of studies | No. of participants | Statistical method | Effect size |
| 1 Functional base of support (distance) during dynamic test: higher values indicate better balance ability Show forest plot | 1 | Mean Difference (IV, Fixed, 95% CI) | Subtotals only | |
| 1.1 Immediately post intervention | 1 | 32 | Mean Difference (IV, Fixed, 95% CI) | 0.09 [0.03, 0.15] |
| 1.2 Follow‐up @ 6 months post intervention | 1 | 26 | Mean Difference (IV, Fixed, 95% CI) | 0.09 [0.02, 0.16] |
| 2 Maximal balance range (cm) during dynamic test: higher values indicate better balance ability Show forest plot | 2 | 595 | Mean Difference (IV, Random, 95% CI) | 0.76 [‐1.29, 2.81] |
| 3 Total distance travelled by COP during quiet stance (mm): lower values indicate better balance ability Show forest plot | 1 | Mean Difference (IV, Fixed, 95% CI) | Subtotals only | |
| 3.1 Eyes open | 1 | 14 | Mean Difference (IV, Fixed, 95% CI) | 97.15 [18.59, 175.71] |
| 3.2 Eyes closed | 1 | 14 | Mean Difference (IV, Fixed, 95% CI) | 212.52 [114.79, 310.25] |
| 4 Sway (mm) during dynamic test: higher values indicate better balance ability Show forest plot | 3 | Std. Mean Difference (IV, Random, 95% CI) | Subtotals only | |
| 4.1 Floor, eyes open (immediately post intervention) | 3 | 893 | Std. Mean Difference (IV, Random, 95% CI) | ‐0.08 [‐0.41, 0.24] |
| 4.2 Floor, eyes closed (immediately post intervention) | 3 | 893 | Std. Mean Difference (IV, Random, 95% CI) | ‐0.10 [‐0.24, 0.04] |
| 4.3 Foam, eyes open (immediately post intervention) | 3 | 893 | Std. Mean Difference (IV, Random, 95% CI) | ‐0.18 [‐0.59, 0.23] |
| 4.4 Foam, eyes closed (immediately post intervention) | 3 | 893 | Std. Mean Difference (IV, Random, 95% CI) | ‐0.10 [‐0.31, 0.11] |
| 5 Body sway (cm): lower values indicate better balance ability Show forest plot | 2 | 35 | Std. Mean Difference (IV, Fixed, 95% CI) | ‐0.87 [‐1.60, ‐0.13] |
| 6 Loss of balance during sensory organisation test (errors): less errors indicate better balance ability Show forest plot | 1 | Mean Difference (IV, Fixed, 95% CI) | Subtotals only | |
| 6.1 Immediately post intervention | 1 | 53 | Mean Difference (IV, Fixed, 95% CI) | ‐0.60 [‐1.86, 0.66] |
| 6.2 Follow‐up @ 6 months post intervention | 1 | 43 | Mean Difference (IV, Fixed, 95% CI) | ‐0.20 [‐1.59, 1.19] |
| 7 Co‐ordinated stability (errors): less errors indicate better balance ability Show forest plot | 3 | 829 | Mean Difference (IV, Fixed, 95% CI) | ‐0.76 [‐1.97, 0.44] |
| 8 Single leg stance time eyes open (s): higher values indicate better balance ability Show forest plot | 4 | Mean Difference (IV, Fixed, 95% CI) | Subtotals only | |
| 8.1 Immediately post intervention | 4 | 202 | Mean Difference (IV, Fixed, 95% CI) | 1.30 [‐0.85, 3.44] |
| 8.2 Follow up @ 6 months post intervention | 1 | 33 | Mean Difference (IV, Fixed, 95% CI) | 2.80 [‐4.73, 10.33] |
| 9 Single leg stance time eyes closed (s): higher values indicate better balance ability Show forest plot | 1 | 39 | Mean Difference (IV, Fixed, 95% CI) | 2.03 [‐0.29, 4.35] |
| 10 Semitandem stance time (s): higher values indicate better balance ability Show forest plot | 1 | Mean Difference (IV, Fixed, 95% CI) | Subtotals only | |
| 10.1 Immediately post intervention | 1 | 67 | Mean Difference (IV, Fixed, 95% CI) | 1.0 [‐0.52, 2.52] |
| 10.2 Follow‐up @ 3 months post intervention | 1 | 58 | Mean Difference (IV, Fixed, 95% CI) | 1.40 [‐0.63, 3.43] |
| 11 Parallel stance time (s): higher values indicate better balance ability Show forest plot | 1 | Mean Difference (IV, Fixed, 95% CI) | Subtotals only | |
| 11.1 Immediately post intervention | 1 | 67 | Mean Difference (IV, Fixed, 95% CI) | 0.80 [‐0.47, 2.07] |
| 11.2 Follow‐up @ 3 months post intervention | 1 | 58 | Mean Difference (IV, Fixed, 95% CI) | ‐0.30 [‐1.66, 1.06] |
| 12 Tandem stance time (s): higher values indicate better balance ability Show forest plot | 1 | Mean Difference (IV, Fixed, 95% CI) | Subtotals only | |
| 12.1 Immediately post intervention | 1 | 67 | Mean Difference (IV, Fixed, 95% CI) | 1.90 [0.06, 3.74] |
| 12.2 Follow‐up @ 3 months post intervention | 1 | 58 | Mean Difference (IV, Fixed, 95% CI) | 1.20 [‐0.64, 3.04] |
| 13 Tandem walk (number of steps): higher values indicate better balance ability Show forest plot | 1 | 39 | Mean Difference (IV, Fixed, 95% CI) | 3.39 [1.75, 5.03] |
| 14 Tandem walk (s): lower values indicate better balance ability Show forest plot | 1 | 70 | Mean Difference (IV, Fixed, 95% CI) | ‐8.10 [‐13.71, ‐2.49] |
| 15 Functional Reach Test (cm): higher values indicate better balance ability Show forest plot | 2 | 60 | Mean Difference (IV, Fixed, 95% CI) | 5.80 [3.37, 8.23] |
| 16 Gait speed: higher values indicate better balance ability Show forest plot | 6 | Std. Mean Difference (IV, Fixed, 95% CI) | Subtotals only | |
| 16.1 Immediately post intervention | 6 | 264 | Std. Mean Difference (IV, Fixed, 95% CI) | ‐0.14 [‐0.38, 0.11] |
| 16.2 Follow‐up @ 6 months post intervention | 1 | 50 | Std. Mean Difference (IV, Fixed, 95% CI) | 0.37 [‐0.19, 0.93] |
| 16.3 Follow‐up @ 3 months post intervention | 1 | 58 | Std. Mean Difference (IV, Fixed, 95% CI) | ‐0.11 [‐0.63, 0.40] |
| Outcome or subgroup title | No. of studies | No. of participants | Statistical method | Effect size |
| 1 (01.10) Single leg stance time eyes open (s): higher values indicate better balance ability Show forest plot | 4 | Std. Mean Difference (IV, Fixed, 95% CI) | Subtotals only | |
| 1.1 Immediately post intervention | 4 | 164 | Std. Mean Difference (IV, Fixed, 95% CI) | 0.33 [0.02, 0.64] |
| 2 (01.14) Self paced gait speed: higher values indicate better balance ability Show forest plot | 4 | Std. Mean Difference (IV, Fixed, 95% CI) | Subtotals only | |
| 2.1 Immediately post intervention | 4 | 176 | Std. Mean Difference (IV, Fixed, 95% CI) | 0.23 [‐0.07, 0.53] |

