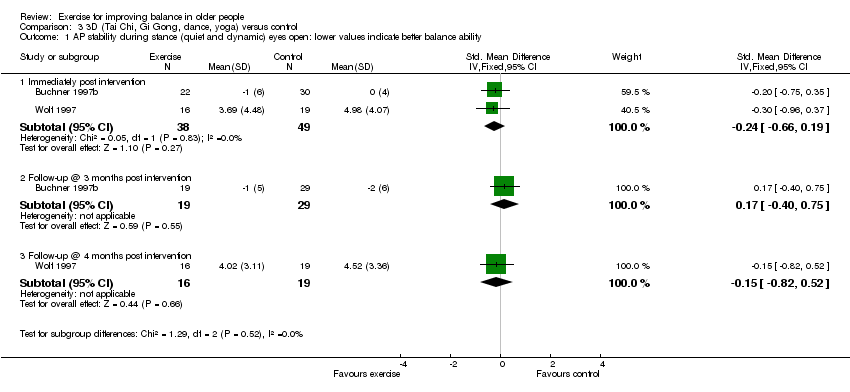
| 1 AP stability during stance (quiet and dynamic) eyes open: lower values indicate better balance ability Show forest plot | 3 | | Std. Mean Difference (IV, Random, 95% CI) | Subtotals only |
|
| 1.1 Immediately post intervention | 3 | 116 | Std. Mean Difference (IV, Random, 95% CI) | ‐0.71 [‐1.33, ‐0.09] |
| 1.2 Follow‐up @ 6 weeks post intervention | 1 | 30 | Std. Mean Difference (IV, Random, 95% CI) | ‐0.63 [‐1.37, 0.10] |
| 1.3 Follow‐up @ 4 months post intervention | 1 | 35 | Std. Mean Difference (IV, Random, 95% CI) | ‐0.96 [‐1.67, ‐0.26] |
| 2 Mediolateral stability during stance (quiet and dynamic) eyes open: lower values indicate better balance Show forest plot | 3 | | Std. Mean Difference (IV, Random, 95% CI) | Subtotals only |
|
| 2.1 Immediately post intervention | 3 | 116 | Std. Mean Difference (IV, Random, 95% CI) | ‐0.39 [‐0.98, 0.20] |
| 2.2 Follow‐up @ 6 weeks post intervention | 1 | 30 | Std. Mean Difference (IV, Random, 95% CI) | ‐0.68 [‐1.42, 0.06] |
| 2.3 Follow‐up @ 4 months post intervention | 1 | 35 | Std. Mean Difference (IV, Random, 95% CI) | 1.09 [0.37, 1.81] |
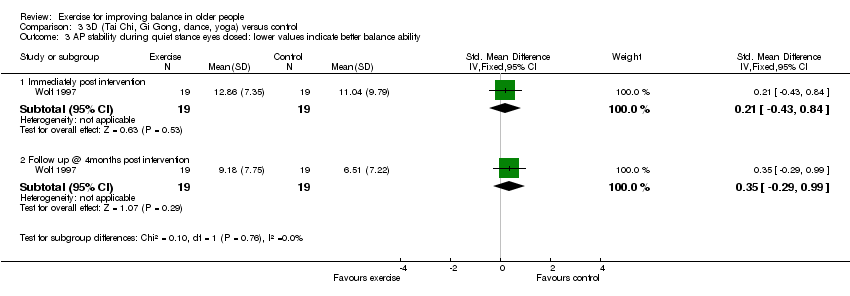
| 3 AP stability during quiet stance eyes closed: lower values indicate better balance ability Show forest plot | 2 | | Std. Mean Difference (IV, Fixed, 95% CI) | Subtotals only |
|
| 3.1 Immediately post intervention | 2 | 82 | Std. Mean Difference (IV, Fixed, 95% CI) | ‐0.32 [‐0.77, 0.12] |
| 3.2 Follow up @ 4months post intervention | 1 | 35 | Std. Mean Difference (IV, Fixed, 95% CI) | ‐0.13 [‐0.79, 0.54] |
| 4 Mediolateral stability during quiet stance eyes closed: lower values indicate better balance ability Show forest plot | 2 | | Std. Mean Difference (IV, Fixed, 95% CI) | Subtotals only |
|
| 4.1 Immediately post intervention | 2 | 82 | Std. Mean Difference (IV, Fixed, 95% CI) | ‐0.17 [‐0.60, 0.27] |
| 4.2 Follow up @ 4 months post intervention | 1 | 35 | Std. Mean Difference (IV, Fixed, 95% CI) | ‐0.15 [‐0.82, 0.51] |
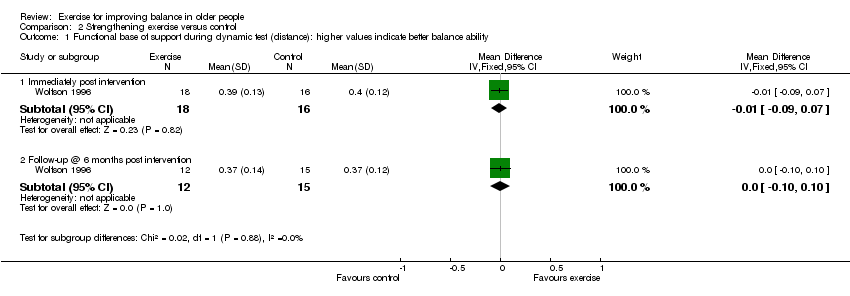
| 5 Functional base of support during dynamic test (distance): higher values indicate greater balance ability Show forest plot | 1 | | Mean Difference (IV, Fixed, 95% CI) | Subtotals only |
|
| 5.1 Immediately post intervention | 1 | 35 | Mean Difference (IV, Fixed, 95% CI) | 0.12 [0.05, 0.19] |
| 5.2 Follow‐up @ 6 months post intervention | 1 | 33 | Mean Difference (IV, Fixed, 95% CI) | 0.08 [0.01, 0.15] |
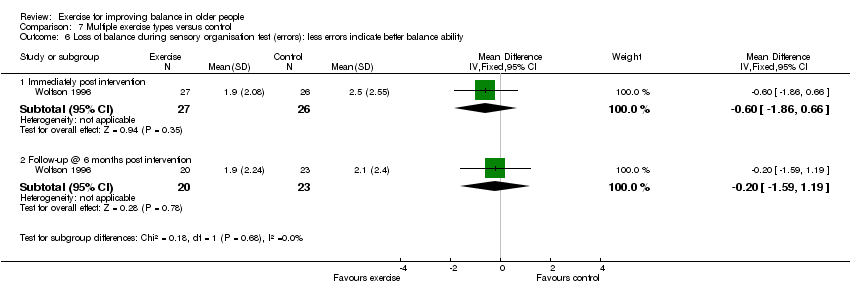
| 6 Loss of balance during sensory organisation test (errors): less errors indicate better balance ability Show forest plot | 1 | | Mean Difference (IV, Fixed, 95% CI) | Subtotals only |
|
| 6.1 Immediately post intervention | 1 | 53 | Mean Difference (IV, Fixed, 95% CI) | ‐1.1 [‐2.24, 0.04] |
| 6.2 Follow‐up @ 6 months post intervention | 1 | 47 | Mean Difference (IV, Fixed, 95% CI) | ‐1.1 [‐2.16, ‐0.04] |
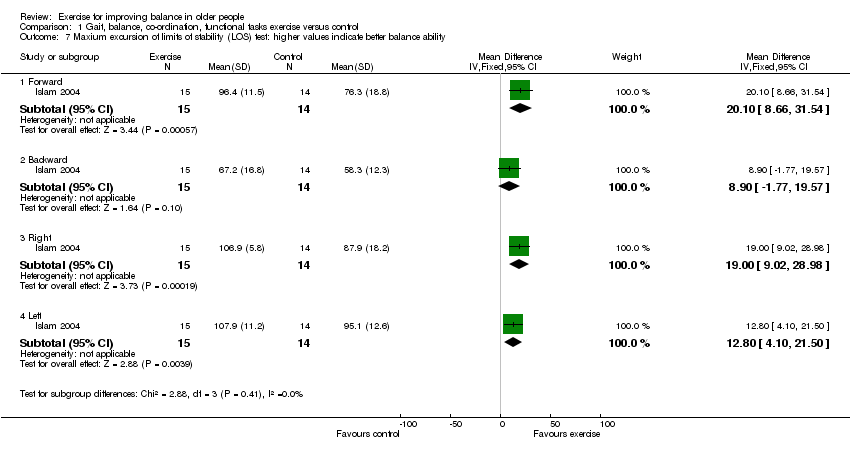
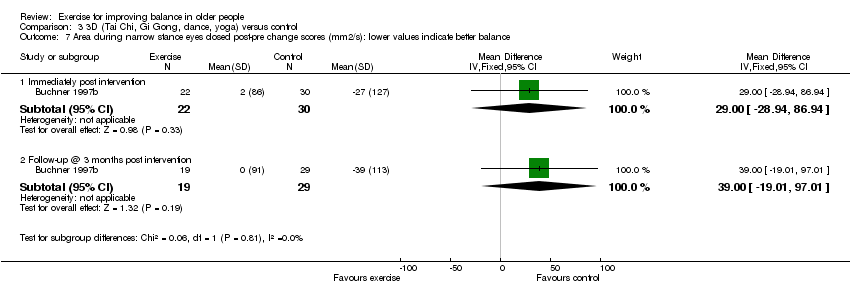
| 7 Maxium excursion of limits of stability (LOS) test: higher values indicate better balance ability Show forest plot | 1 | | Mean Difference (IV, Fixed, 95% CI) | Subtotals only |
|
| 7.1 Forward | 1 | 29 | Mean Difference (IV, Fixed, 95% CI) | 20.10 [8.66, 31.54] |
| 7.2 Backward | 1 | 29 | Mean Difference (IV, Fixed, 95% CI) | 8.90 [‐1.77, 19.57] |
| 7.3 Right | 1 | 29 | Mean Difference (IV, Fixed, 95% CI) | 19.0 [9.02, 28.98] |
| 7.4 Left | 1 | 29 | Mean Difference (IV, Fixed, 95% CI) | 12.80 [4.10, 21.50] |
| 8 Single leg stance eyes open (force platform measures): lower values indicate better balance ability Show forest plot | 1 | | Mean Difference (IV, Fixed, 95% CI) | Subtotals only |
|
| 8.1 Average XY area per second (square inches per second) | 1 | 42 | Mean Difference (IV, Fixed, 95% CI) | 0.02 [‐0.57, 0.61] |
| 8.2 Average radial area per second (square inches per second) | 1 | 42 | Mean Difference (IV, Fixed, 95% CI) | ‐0.05 [‐0.26, 0.16] |
| 8.3 Average velocity (inches per second) | 1 | 42 | Mean Difference (IV, Fixed, 95% CI) | 0.12 [‐0.62, 0.86] |
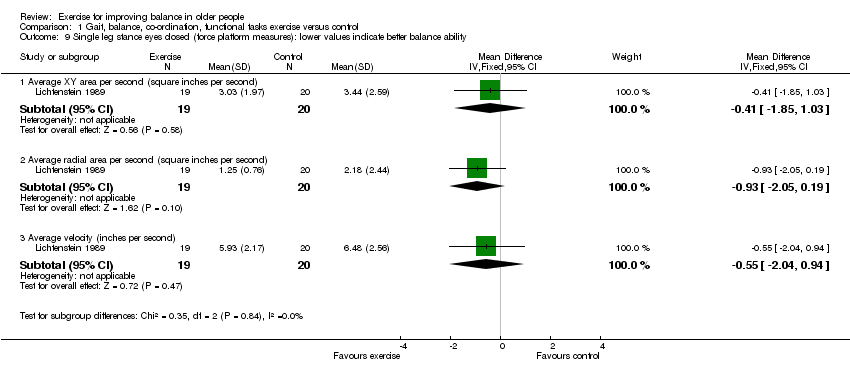
| 9 Single leg stance eyes closed (force platform measures): lower values indicate better balance ability Show forest plot | 1 | | Mean Difference (IV, Fixed, 95% CI) | Subtotals only |
|
| 9.1 Average XY area per second (square inches per second) | 1 | 39 | Mean Difference (IV, Fixed, 95% CI) | ‐0.41 [‐1.85, 1.03] |
| 9.2 Average radial area per second (square inches per second) | 1 | 39 | Mean Difference (IV, Fixed, 95% CI) | ‐0.93 [‐2.05, 0.19] |
| 9.3 Average velocity (inches per second) | 1 | 39 | Mean Difference (IV, Fixed, 95% CI) | ‐0.55 [‐2.04, 0.94] |
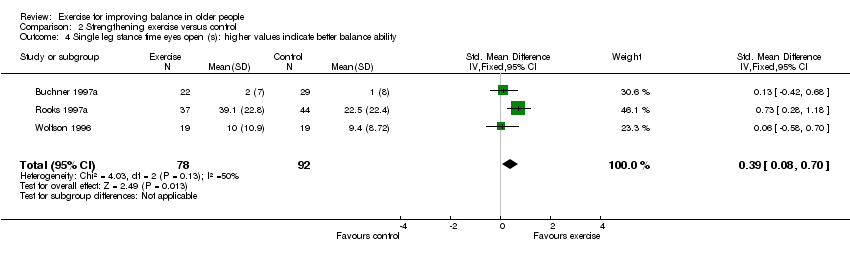
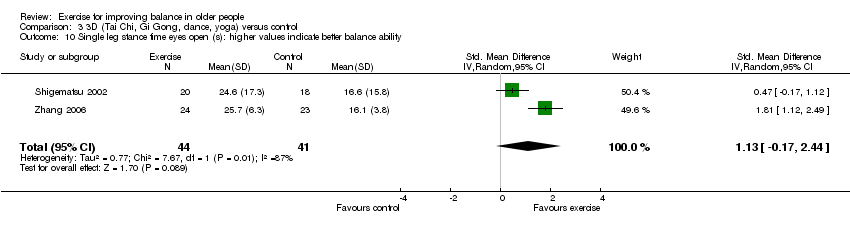
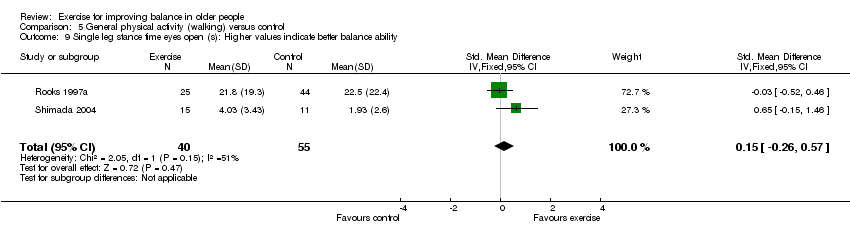
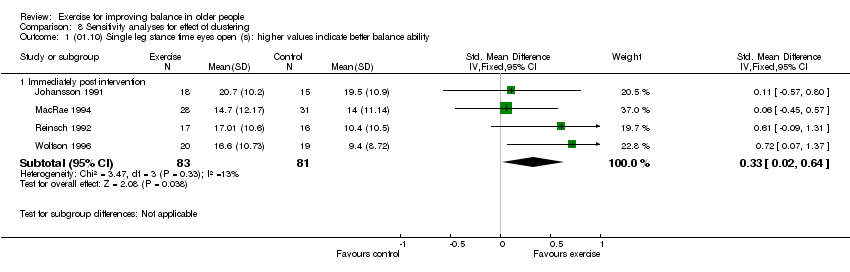
| 10 Single leg stance time eyes open (s): higher values indicate better balance ability Show forest plot | 4 | | Std. Mean Difference (IV, Fixed, 95% CI) | Subtotals only |
|
| 10.1 Immediately post intervention | 4 | 164 | Std. Mean Difference (IV, Fixed, 95% CI) | 0.33 [0.02, 0.64] |
| 10.2 Follow up @ 6 months post intervention | 1 | 37 | Std. Mean Difference (IV, Fixed, 95% CI) | 0.32 [‐0.33, 0.97] |
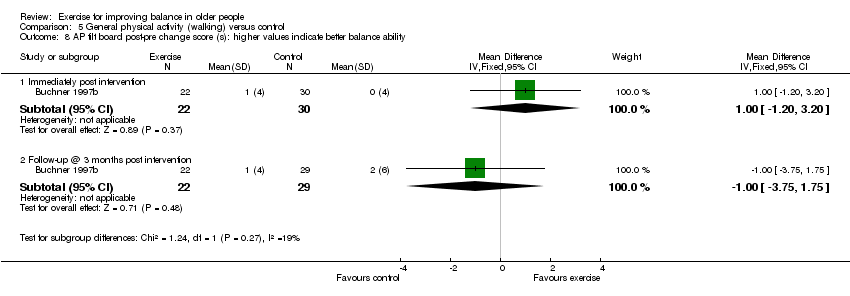
| 11 Single leg stance time eyes closed (s): higher values indicate better balance ability Show forest plot | 1 | 33 | Mean Difference (IV, Fixed, 95% CI) | 0.0 [‐1.20, 1.20] |
|
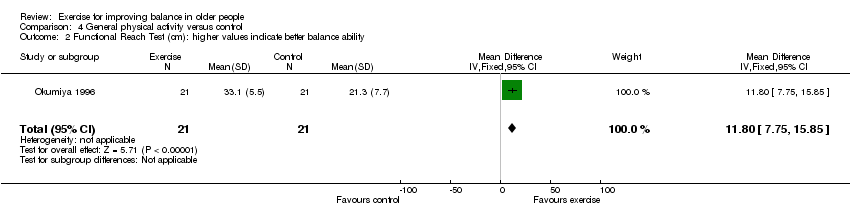
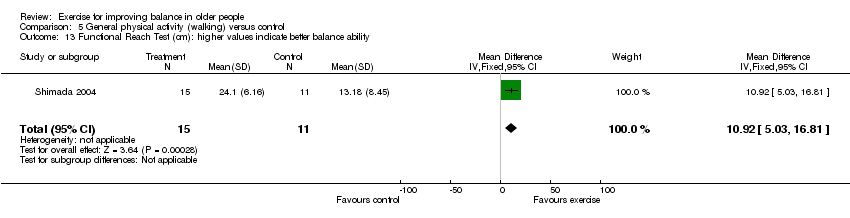
| 12 Functional Reach Test: higher values indicate better balance ability Show forest plot | 1 | 22 | Mean Difference (IV, Fixed, 95% CI) | 0.60 [‐1.71, 2.91] |
|
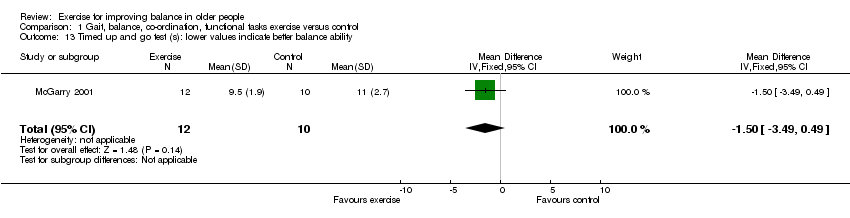
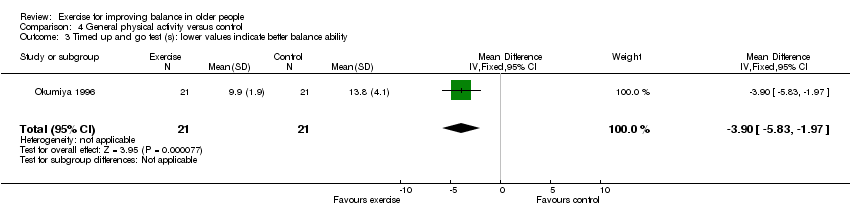
| 13 Timed up and go test (s): lower values indicate better balance ability Show forest plot | 1 | 22 | Mean Difference (IV, Fixed, 95% CI) | ‐1.5 [‐3.49, 0.49] |
|
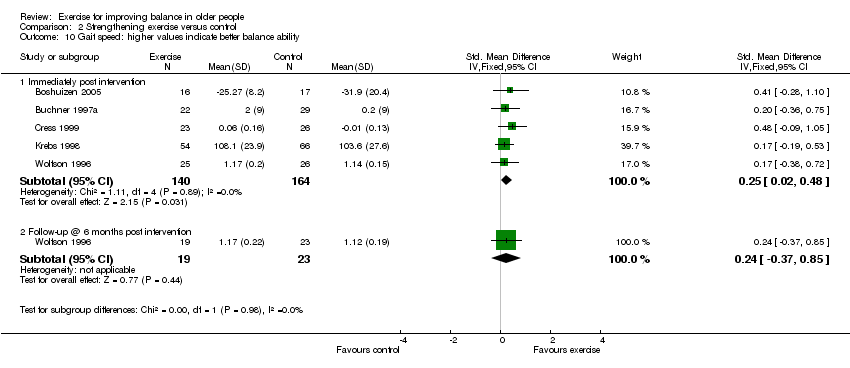
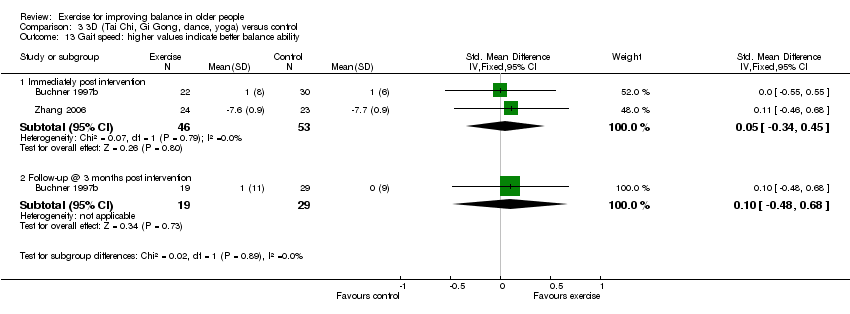
| 14 Self paced gait speed: higher values indicate better balance ability Show forest plot | 4 | | Std. Mean Difference (IV, Fixed, 95% CI) | Subtotals only |
|
| 14.1 Immediately post intervention | 4 | 176 | Std. Mean Difference (IV, Fixed, 95% CI) | 0.23 [‐0.07, 0.53] |
| 14.2 Follow‐up @ 6 months post intervention | 1 | 45 | Std. Mean Difference (IV, Fixed, 95% CI) | 0.31 [‐0.28, 0.90] |
| 14.3 Follow‐up @ 6 weeks post intervention | 1 | 30 | Std. Mean Difference (IV, Fixed, 95% CI) | 0.30 [‐0.42, 1.03] |
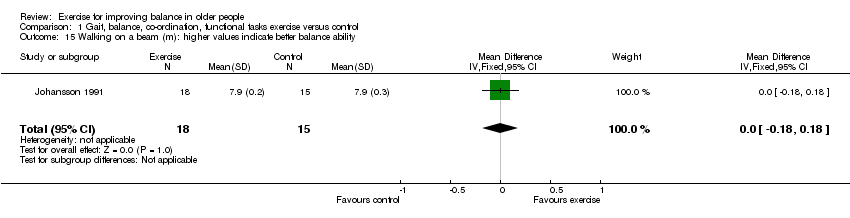
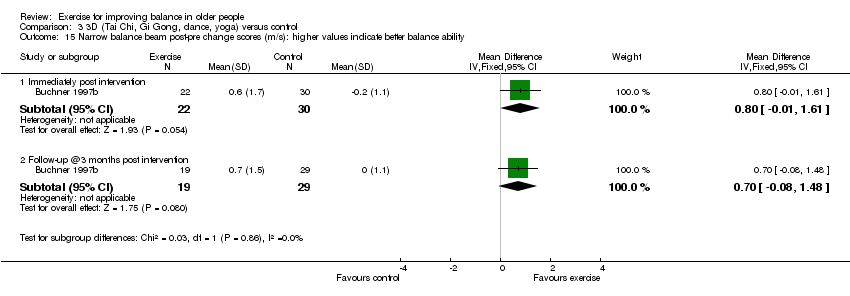
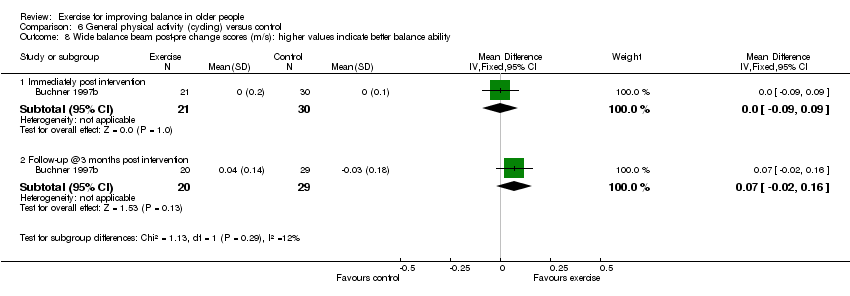
| 15 Walking on a beam (m): higher values indicate better balance ability Show forest plot | 1 | 33 | Mean Difference (IV, Fixed, 95% CI) | 0.0 [‐0.18, 0.18] |
|
| 16 Berg Balance Scale (score out of 56) higher values indicate better balance ability Show forest plot | 3 | | Mean Difference (IV, Fixed, 95% CI) | Subtotals only |
|
| 16.1 Immediately post intervention | 3 | 126 | Mean Difference (IV, Fixed, 95% CI) | 2.72 [0.94, 4.50] |
| 16.2 Follow up @ 4 weeks post intervention | 1 | 77 | Mean Difference (IV, Fixed, 95% CI) | 3.60 [‐1.96, 9.16] |
| 16.3 Follow up @ 1 year post intervention | 1 | 49 | Mean Difference (IV, Fixed, 95% CI) | 0.67 [‐7.29, 8.63] |