Early erythropoiesis‐stimulating agents in preterm or low birth weight infants
Referencias
References to studies included in this review
References to studies excluded from this review
References to ongoing studies
Additional references
References to other published versions of this review
Characteristics of studies
Characteristics of included studies [ordered by study ID]
| Methods | Randomised open controlled study | |
| Participants | 292 preterm infants < 33 weeks' GA, birth weight < 1500 grams, no blood sampling > 10 mL in the first 7 days after birth, no previous blood transfusion, no IVH > grade 1, no history of hematological disease, no urinary tract infection or sepsis | |
| Interventions | 142 infants in EPO group received EPO (EPREX 2000, Santa‐Farma‐Gurel, Istanbul) 200 IU/kg SC from the seventh day of life and continued twice weekly (400 IU/kg/week, low dose) for 6 weeks. 150 infants in the control group did not receive a placebo. Both groups received iron (3 to 5 mg/kg/d orally) (high dose). | |
| Outcomes | Use of 1 or more red blood cell transfusions | |
| Notes | Infants who had received red blood cell transfusion before study entry were excluded. | |
| Risk of bias | ||
| Bias | Authors' judgement | Support for judgement |
| Random sequence generation (selection bias) | Low risk | Computer‐assisted randomisation scheme |
| Allocation concealment (selection bias) | Unclear risk | No information provided |
| Blinding of participants and personnel (performance bias) | High risk | No placebo used |
| Blinding of outcome assessment (detection bias) | High risk | No placebo used |
| Incomplete outcome data (attrition bias) | Low risk | Complete follow‐up: yes |
| Selective reporting (reporting bias) | Unclear risk | The protocol for the study was not available to us; therefore we cannot ascertain whether deviations from the protocol occurred. |
| Other bias | Low risk | Appears free of other bias |
| Methods | Randomised open controlled study | |
| Participants | 93 infants < 7 days of life, in room air or requiring 30% oxygen at study entry with birth weight between 900 and 1500 grams | |
| Interventions | 32 infants (low‐dose group) received EPO (Recormon) SC, 250 IU/kg 3 times a week (high dose). | |
| Outcomes | Use of 1 or more red blood cell transfusions | |
| Notes | It is not stated whether infants who had received blood transfusions before study entry were included. Transfusion guidelines were in place. | |
| Risk of bias | ||
| Bias | Authors' judgement | Support for judgement |
| Random sequence generation (selection bias) | Unclear risk | No information provided |
| Allocation concealment (selection bias) | Unclear risk | Blinding of randomisation unclear |
| Blinding of participants and personnel (performance bias) | High risk | No placebo was given to the control group. Personnel were aware of treatments. |
| Blinding of outcome assessment (detection bias) | High risk | No placebo was given to the control group. Outcome assessors were aware of treatments. |
| Incomplete outcome data (attrition bias) | Low risk | Complete follow‐up: yes |
| Selective reporting (reporting bias) | Unclear risk | The protocol for the study was not available to us; therefore we cannot ascertain whether deviations from the protocol occurred. |
| Other bias | Low risk | Appears free of other bias |
| Methods | Randomised controlled trial | |
| Participants | 22 preterm infants with gestational age < 32 weeks, birth weight < 1750 grams, and age > 2 days | |
| Interventions | 11 infants in the EPO group received EPO (unnamed product), 400 IU, 3 times weekly, IV (400 IU/mL saline solution for 1 to 2 minutes) if IV line in place (1200 IU/kg/week, high dose), then continued SC, plus iron (h) 20 mg/kg once a week IV (high‐dose iron) from second day of life until discharge. | |
| Outcomes | Number of transfusions | |
| Notes | It is not stated whether infants who had received blood transfusions before study entry were included. | |
| Risk of bias | ||
| Bias | Authors' judgement | Support for judgement |
| Random sequence generation (selection bias) | Unclear risk | No information provided |
| Allocation concealment (selection bias) | Unclear risk | Infants randomly assigned |
| Blinding of participants and personnel (performance bias) | High risk | Control group received no placebo. Personnel were not blinded. |
| Blinding of outcome assessment (detection bias) | High risk | Control group received no placebo. Personnel were not blinded. |
| Incomplete outcome data (attrition bias) | Low risk | Complete follow‐up: yes |
| Selective reporting (reporting bias) | Unclear risk | The protocol for the study was not available to us; therefore we cannot ascertain whether deviations from the protocol occurred. |
| Other bias | Low risk | Appears free of other bias |
| Methods | Randomised controlled trial | |
| Participants | 63 preterm infants with birth weight < 1750 grams and gestational age < 32 weeks, between the second day and 8 weeks of life | |
| Interventions | 22 infants in EPO + iron group received 400 IU EPO (Eprex, Cilag, Italy) per kg 3 times a week (high dose) + 20 mg/kg/week of IV iron (high dose). | |
| Outcomes | Mean number of blood transfusions (95% CI) | |
| Notes | It is not stated whether infants who had received blood transfusions before study entry were included. | |
| Risk of bias | ||
| Bias | Authors' judgement | Support for judgement |
| Random sequence generation (selection bias) | Unclear risk | No information provided |
| Allocation concealment (selection bias) | Unclear risk | Infants randomly allocated |
| Blinding of participants and personnel (performance bias) | Unclear risk | No placebo was administered. Personnel were aware of treatments. |
| Blinding of outcome assessment (detection bias) | Unclear risk | No placebo was administered. Outcome assessors were aware of treatments. |
| Incomplete outcome data (attrition bias) | Low risk | Complete follow‐up: yes |
| Selective reporting (reporting bias) | Unclear risk | The protocol for the study was not available to us; therefore we cannot ascertain whether deviations from the protocol occurred. |
| Other bias | Low risk | Appears free of other bias |
| Methods | Randomised controlled trial | |
| Participants | 45 preterm infants with BW ≤ 1800 grams and GA ≤ 35 weeks, age 1 day | |
| Interventions | 15 infants in group 1 received EPO (Kirin Brewery, Co., Ltd., Japan) 150 IU/kg (450 IU/kg/week, low dose) SC 3 times a week for 6 weeks. | |
| Outcomes | Use of 1 or more red blood cell transfusions | |
| Notes | It is not stated whether infants who had received blood transfusions before study entry were included. | |
| Risk of bias | ||
| Bias | Authors' judgement | Support for judgement |
| Random sequence generation (selection bias) | Unclear risk | Unclear |
| Allocation concealment (selection bias) | Unclear risk | Allocation concealment unclear |
| Blinding of participants and personnel (performance bias) | High risk | No placebo was given. Personnel were aware of group assignments |
| Blinding of outcome assessment (detection bias) | High risk | No placebo was given. Outcome assessors were aware of group assignments. |
| Incomplete outcome data (attrition bias) | Low risk | Complete follow‐up: yes |
| Selective reporting (reporting bias) | Unclear risk | The protocol for the study was not available to us; therefore we cannot ascertain whether deviations from the protocol occurred. |
| Other bias | Low risk | Appears free of other bias |
| Methods | Double‐blind randomised controlled trial | |
| Participants | Preterm infants, PMA ≤ 33 weeks | |
| Interventions | 20 infants received enteral rhG‐CSF, 20 received enteral rhEPO, 20 received both enteral rhG‐CSF and rhEPO, and 30 received distilled water as placebo. This regimen was started on the day the neonatologist chose to start feedings. Study drugs were given enterally. The daily dose of enteral rhG‐CSF and/or rhEPO was diluted in sterile distilled water and was kept in a separate opaque aliquot before administration through the orogastric/nasogastric tube with milk feedings for 7 days. rhEPO was given as 88 IU/kg (total dose 616 IU/kg ‐ high dose). The placebo group was given 1 mL of distilled water once daily. It is not clear whether all infants received the same volume/kg of drug for the 3 interventions. | |
| Outcomes | Death | |
| Notes | We included the outcome of Time to achieve full enteral feeding (days) under a separate comparison. | |
| Risk of bias | ||
| Bias | Authors' judgement | Support for judgement |
| Random sequence generation (selection bias) | Low risk | Randomisation sequence generated by computer |
| Allocation concealment (selection bias) | Low risk | Opaque sequentially numbered sealed envelopes |
| Blinding of participants and personnel (performance bias) | Unclear risk | Study drugs were kept in separate opaque aliquots before administration through the orogastric/nasogastric tube with milk feedings for 7 days. Control group was given 1 mL of distilled water (placebo). Placebo must have looked different from the opaque study drugs. |
| Blinding of outcome assessment (detection bias) | Unclear risk | See above. |
| Incomplete outcome data (attrition bias) | Low risk | All randomised infants were accounted for. |
| Selective reporting (reporting bias) | Low risk | Trial was registered as NCT01441427, on September 18, 2011, before the trial started. No deviations from the protocol are apparent. |
| Other bias | Low risk | Appears free of other bias |
| Methods | Randomised controlled trial | |
| Participants | 45 preterm infants born between 24 6/7 and 31 6/7 weeks' gestation | |
| Interventions | 30 infants in the EPO group received 3000 IU rhEPO/kg (Epoietin Beta, Roche, Basel Switzerland) IV 3 to 6, 12 to 18, and 36 to 42 hours after birth (high dose). No infant was treated later with rhEPO for anaemia of prematurity. 15 infants in the placebo group received the same volume of 0.9% NaCl (indistinguishable from rhEPO). Use of iron was not mentioned. | |
| Outcomes | Mortality | |
| Notes | Study was supported by Roche Foundation for Anemia Research. Infants who were 26 0/7 to 31 6/7 weeks' PMA at birth were included in another study by the same group (Fauchère 2015). The first author ‐ Dr. Fauchère ‐ informed us with that the study included 8 infants who were < 26 weeks' PMA at enrolment (6 infants in the EPO group and 2 in the placebo group). 3 survivors were included in the < 26 weeks' PMA group (1 infant in the EPO group and 2 in the placebo group). We report on mortality for these 8 infants under Fauchère 2008. We report on MDI, PDI, CP, vision, and hearing for the 3 survivors under Fauchère 2008. | |
| Risk of bias | ||
| Bias | Authors' judgement | Support for judgement |
| Random sequence generation (selection bias) | Low risk | Computer‐based random‐number generator |
| Allocation concealment (selection bias) | Low risk | Assignment was made by the hospital pharmacy. |
| Blinding of participants and personnel (performance bias) | Low risk | Normal saline was given as the placebo intervention; it was indistinguishable from the rhEPO solution. |
| Blinding of outcome assessment (detection bias) | Low risk | Normal saline was given as the placebo intervention; it was indistinguishable from the rhEPO solution. |
| Incomplete outcome data (attrition bias) | Low risk | Outcomes reported for all randomised infants |
| Selective reporting (reporting bias) | Unclear risk | Study was registered at www.clinicaltrials.gov (NCT00413946) in December 2006, after the last participant had been enrolled in November 2006. Registration was for the larger study published in 2015 (Fauchère 2015). The protocol for the early part of the study was not available to us; therefore we cannot ascertain whether deviations from the protocol occurred. |
| Other bias | Low risk | Appears free of other bias |
| Methods | Randomised controlled trial | |
| Participants | Preterm infants with PMA 26 0/7 to 31 6/7 weeks | |
| Interventions | Experimental intervention: EPO (Epoietin Beta, Roche Basel, Switzerland) (3000 IU/kg BW), equal to 1 mL solution/kg BW, was given IV at < 3, 12 to 18, and 36 to 42 hours after birth over a period of 10 minutes – total dose 9000 IU/kg during first week of life – high dose. Total number randomised: n = 229 infants (1 infant in the EPO group was excluded because the infant did not get the full medication dose as allocated – 229 infants analysed) Control intervention: 1 mL solution/kg BW of NaCl 0.9% IV at < 3, 12 to 18, and 36 to 42 hours after birth over a period of 10 minutes Total number randomised: n = 214 infants (6 infants in the placebo group excluded because they did not receive the full medication dose as allocated – 214 infants analysed) | |
| Outcomes | Mortality | |
| Notes | This study includes infants ≥ 26 weeks from Fauchère 2008. The 2008 study included 6 infants in the EPO group and 2 in the placebo group who were < 26 weeks' PMA. In the EPO group, 5 died and 1 survived. In the placebo group, both infants survived. We report the outcomes of these infants under Fauchère 2008. We received additional information on these 8 infants at < 26 weeks' PMA from Dr. Fauchère. | |
| Risk of bias | ||
| Bias | Authors' judgement | Support for judgement |
| Random sequence generation (selection bias) | Low risk | Computer‐based random‐number generator |
| Allocation concealment (selection bias) | Low risk | Assignment by hospital pharmacy |
| Blinding of participants and personnel (performance bias) | Low risk | Normal saline given as the placebo intervention and indistinguishable from the rhEPO solution |
| Blinding of outcome assessment (detection bias) | Low risk | Normal saline given as the placebo intervention and indistinguishable from the rhEPO solution |
| Incomplete outcome data (attrition bias) | Low risk | Outcomes reported for all randomised infants |
| Selective reporting (reporting bias) | Low risk | Study was registered at www.clinicaltrials.gov (NCT00413946) in December 2006. |
| Other bias | Low risk | Appears free of other bias |
| Methods | Randomised controlled trial | |
| Participants | 40 preterm infants with BW < 800 grams and GA < 32 weeks' gestation | |
| Interventions | EPO group (n = 21) received 300 IU/kg/d of EPO (Erypo, Janssen‐Cilag Pharma, Vienna, Austria) IV (as long as IV access was available), or 700 IU/kg 3 times/week (2100 IU/kg/week, high dose) and iron dextran 1.5 mg/kg/d IV or iron polymerase complex 9 mg/kg/d orally (high dose). | |
| Outcomes | Use of 1 or more red blood cell transfusions NEC | |
| Notes | 47 infants were eligible for enrolment in the study. Four infants were excluded because of parental refusal (n = 2) or IVH grade IV (n = 2). | |
| Risk of bias | ||
| Bias | Authors' judgement | Support for judgement |
| Random sequence generation (selection bias) | Unclear risk | No information provided |
| Allocation concealment (selection bias) | Low risk | Sealed opaque envelopes |
| Blinding of participants and personnel (performance bias) | High risk | No placebo was administered to the control group. Personnel were aware of group assignments. |
| Blinding of outcome assessment (detection bias) | High risk | No placebo was administered to the control group. Outcome assessors were aware of group assignments. |
| Incomplete outcome data (attrition bias) | Unclear risk | Complete follow‐up: 47 infants were eligible for enrolment in the study. Four infants were excluded because of parental refusal (n = 2) or IVH grade IV (n = 2). |
| Selective reporting (reporting bias) | Unclear risk | The protocol for the study was not available to us; therefore we cannot ascertain whether deviations from the protocol occurred. |
| Other bias | Low risk | Appears free of other bias |
| Methods | Randomised controlled trial | |
| Participants | Population: 44 preterm infants, 7 days old | |
| Interventions | Intervention: EPO group received 250 IU/kg/d 3 times weekly IV for 4 weeks (750 IU/kg/week, high dose). Use of iron is not stated, nor is it stated what the control group received. | |
| Outcomes | Neonatal Behavioral Neurological Assessment at 40 weeks' PMA | |
| Notes | This study has been published as a full report in Chinese. Only the abstract was written in English. We requested the full paper and if possible an English translation from the first author (2009‐08‐08). The only data provided with means and SDs were scores for the Neonatal Behavioral Neurological Assessment at 40 weeks' PMA. | |
| Risk of bias | ||
| Bias | Authors' judgement | Support for judgement |
| Random sequence generation (selection bias) | Unclear risk | No information provided |
| Allocation concealment (selection bias) | Unclear risk | 44 preterm infants randomly divided into 2 groups |
| Blinding of participants and personnel (performance bias) | Unclear risk | As we have not been able to obtain an English translation of the full article, this item cannot be assessed. |
| Blinding of outcome assessment (detection bias) | Unclear risk | As we have not been able to obtain an English translation of the full article, this item cannot be assessed. |
| Incomplete outcome data (attrition bias) | Unclear risk | Complete follow‐up: unclear |
| Selective reporting (reporting bias) | Unclear risk | As we have not been able to obtain an English translation of the full article, this item cannot be assessed. |
| Other bias | Unclear risk | As we have not been able to obtain an English translation of the full article, this item cannot be assessed. |
| Methods | Randomised controlled trial | |
| Participants | Population: 40 preterm infants with BW > 1000 grams but < 1750 grams and GA > 28 weeks but < 34 weeks, who were between 48 and 96 hours old at the time of study entry | |
| Interventions | EPO group received 500 IU/kg/d of EPO SC twice weekly (1000 IU/kg/week, high dose) and iron (ferrous sulphate) 3 mg/kg/d enterally (low dose). Control infants received iron (ferrous sulphate) 3 mg/kg/d enterally (low dose) at second week of life. Parenteral iron was not administered throughout the study. | |
| Outcomes | Number of red blood cell transfusions per patient | |
| Notes | "Guidelines for red‐cell transfusions were based on the relatively strict existing policy in the nursery which was used to administer transfusions during the study period". | |
| Risk of bias | ||
| Bias | Authors' judgement | Support for judgement |
| Random sequence generation (selection bias) | Unclear risk | No information provided |
| Allocation concealment (selection bias) | Low risk | Numbered sealed envelopes |
| Blinding of participants and personnel (performance bias) | High risk | No placebo was used. Personnel were aware of group assignments. |
| Blinding of outcome assessment (detection bias) | High risk | No placebo was used. Outcome assessors were aware of group assignments. |
| Incomplete outcome data (attrition bias) | Low risk | Complete follow‐up: yes. 18 infants were excluded owing to parents' refusal and unavailability. |
| Selective reporting (reporting bias) | Unclear risk | The protocol for the study was not available to us; therefore we cannot ascertain whether deviations from the protocol occurred. |
| Other bias | Low risk | Appears free of other bias |
| Methods | Randomised controlled study | |
| Participants | 50 neonates with BW ≤ 1500 grams, PMA ≤ 31 weeks | |
| Interventions | EPO group received rhEPO (Cilag A.G., Zug, Switzerland) 3 × 250 U/kg/week SC (750 U/kg/week – high dose) (n = 24). Treatment was given for 6 weeks. Control group (n = 26) received no intervention. All infants received elemental iron 3 mg/kg/d. Treatment was initiated at 3 to 7 days – early EPO. | |
| Outcomes | Transfusions/patient | |
| Notes | Retrospectively, infants were divided into those without complications (without or with minimal signs of respiratory distress and no signs of sepsis) and those with complications requiring mechanical ventilation (RDS and sepsis with positive blood culture) for longer than 3 days, who were characterised as having complications. Outcomes were reported separately for infants without complications (we listed those outcomes under Kremenopoulos 1997A) and for infants with complications (we listed those outcomes under Kremenopoulos 1997B). An additional group of 35 infants (Group B) were enrolled at 3 to 8 weeks and will be included in the late EPO review. No information was provided regarding transfusion guidelines for either group. | |
| Risk of bias | ||
| Bias | Authors' judgement | Support for judgement |
| Random sequence generation (selection bias) | Unclear risk | No information provided |
| Allocation concealment (selection bias) | Unclear risk | "In group A 50 infants were randomly assigned". |
| Blinding of participants and personnel (performance bias) | High risk | No placebo was used. |
| Blinding of outcome assessment (detection bias) | High risk | No placebo was used. |
| Incomplete outcome data (attrition bias) | Low risk | Outcomes were reported for all enrolled infants. |
| Selective reporting (reporting bias) | Unclear risk | The protocol for the study was not available to us, so we cannot judge if whether deviations from the protocol occurred. |
| Other bias | Low risk | Appears free of other bias |
| Methods | Randomised controlled study | |
| Participants | 50 neonates with BW ≤ 1500 grams, PMA ≤ 31 weeks | |
| Interventions | EPO group received rhEPO (Cilag A.G., Zug, Switzerland) 3 × 250 U/kg/week SC (750 U/kg/week – high dose) (n = 24). Treatment was given for 6 weeks. Control group (n = 26) received no intervention. All infants received elemental iron 3 mg/kg/d. Treatment was initiated at 3 to 7 days – early EPO. | |
| Outcomes | Transfusions/patient | |
| Notes | Retrospectively, infants were divided into those without complications (without or with minimal signs of respiratory distress and no signs of sepsis) and those with complications requiring mechanical ventilation (RDS and sepsis with positive blood culture) for longer than 3 days, who were characterised as having complications. Outcomes were reported separately for infants without complications (we listed those outcomes under Kremenopoulos 1997A) and for infants with complications (we listed those outcomes under Kremenopoulos 1997B). An additional group of 35 infants (Group B) were enrolled at 3 to 8 weeks and will be included in the late EPO review. No information was provided regarding transfusion guidelines for either group. | |
| Risk of bias | ||
| Bias | Authors' judgement | Support for judgement |
| Random sequence generation (selection bias) | Unclear risk | No information provided |
| Allocation concealment (selection bias) | Unclear risk | "In group B 50 infants were randomly assigned". |
| Blinding of participants and personnel (performance bias) | High risk | No placebo was used. |
| Blinding of outcome assessment (detection bias) | High risk | No placebo was used. |
| Incomplete outcome data (attrition bias) | Low risk | Outcomes were reported for all enrolled infants. |
| Selective reporting (reporting bias) | Unclear risk | The protocol for the study was not available to us, so we cannot judge whether any deviations from the protocol occurred. |
| Other bias | Low risk | Appears free of other bias |
| Methods | Randomised controlled trial | |
| Participants | 19 preterm infants with GA < 35 weeks' gestation and birth weight ≤ 1500 grams | |
| Interventions | Infants in EPO group I (n = 6) received EPO (Recormon, Boehringer Mannheim) 100 IU/kg twice a week IV (200 IU/kg/week, low dose) between days 7 and 37, and infants in EPO group II (n = 6) received 400 IU/kg twice weekly (800 IU/kg/week, high dose) during the same time period. Control group (n = 7) received no treatment or placebo. Both EPO groups received 10 mg/kg/week of iron IV (high dose). Control group did not receive iron. | |
| Outcomes | Total volume (mL/kg) of blood transfused between days 7 and 37 | |
| Notes | Transfusion guidelines were in place. | |
| Risk of bias | ||
| Bias | Authors' judgement | Support for judgement |
| Random sequence generation (selection bias) | Unclear risk | No information provided |
| Allocation concealment (selection bias) | Unclear risk | Randomly selected preterm infants |
| Blinding of participants and personnel (performance bias) | High risk | Control group received no placebo or iron. Personnel were aware of treatment groups. |
| Blinding of outcome assessment (detection bias) | High risk | Control group received no placebo or iron. Outcome assessors were aware of treatment groups. |
| Incomplete outcome data (attrition bias) | Low risk | Complete follow‐up: yes |
| Selective reporting (reporting bias) | Unclear risk | The protocol for the study was not available to us; therefore we cannot ascertain whether deviations from the protocol occurred. |
| Other bias | Low risk | Appears free of other bias |
| Methods | Double‐blind randomised controlled trial | |
| Participants | 40 VLBW infants with birth weight between 750 and 1500 grams at < 26 weeks' gestation | |
| Interventions | 21 infants in the EPO group received EPO (Eprex 4000, Cilag de Mexico SA de CV) 150 units/kg/d (during first 6 weeks of life), 1050 IU/kg/week (high dose), and 19 infants in the control group received placebo. | |
| Outcomes | Number of transfusions per group | |
| Notes | We could not ascertain whether transfusion guidelines were in place, and if infants who had received blood transfusions before study entry were included. | |
| Risk of bias | ||
| Bias | Authors' judgement | Support for judgement |
| Random sequence generation (selection bias) | Unclear risk | Unclear |
| Allocation concealment (selection bias) | Unclear risk | Infants were randomly assigned. |
| Blinding of participants and personnel (performance bias) | Low risk | Observers were unaware of treatment assignments. Placebo was used. |
| Blinding of outcome assessment (detection bias) | Low risk | Observers were unaware of treatment assignments. Placebo was used. |
| Incomplete outcome data (attrition bias) | Low risk | Complete follow‐up: yes |
| Selective reporting (reporting bias) | Unclear risk | The protocol for the study was not available to us; therefore we cannot ascertain whether deviations from the protocol occurred. |
| Other bias | Low risk | Appears free of other bias |
| Methods | Double‐blind randomised controlled trial | |
| Participants | 244 infants with birth weight of 750 to 1499 grams; 3 infants excluded after randomisation | |
| Interventions | 120 infants in the EPO group received 250 IU of epoetin beta (Boehringer‐Mannheim, Germany) per kilogram; injections on Monday, Wednesday, and Friday (750 IU/kg/week, high dose). Treatment continued until day 40 to 42, for a total of 17 doses. | |
| Outcomes | Use of 1 or more red blood cell transfusions | |
| Notes | Infants who had received transfusions before study entry were included (28 in the EPO group and 17 in the control group). | |
| Risk of bias | ||
| Bias | Authors' judgement | Support for judgement |
| Random sequence generation (selection bias) | Unclear risk | No information provided |
| Allocation concealment (selection bias) | Low risk | Numbered sealed envelopes |
| Blinding of participants and personnel (performance bias) | Low risk | Most participating doctors were reluctant to administer repeated subcutaneous injections of placebo to low birth weight infants. Therefoere, 2 teams were formed at each centre: Treating physicians determined whether infants could be enrolled or withdrawn from the study, decided whether they should receive transfusions, and monitored them without knowing their treatment group; "dosing investigators" performed randomisation and administered epoetin beta but were not involved in the infants' care. When treatment was to be given, a dosing investigator carrying a "black box" containing appropriate equipment visited each infant, administered study medication, and placed adhesive strips on both thighs (of both epoetin recipients and controls), which remained there until the next visit. During this procedure, staff and parents had to leave. A treating physician or a dosing investigator assigned to an infant had to serve in that capacity as long as the infant was studied. |
| Blinding of outcome assessment (detection bias) | Low risk | See information in the box above. |
| Incomplete outcome data (attrition bias) | High risk | Complete follow‐up: no Three of the 244 infants who underwent randomisation were excluded; all data on 2 infants were lost, and treatment (EPO) was inadvertently omitted for 1 infant, whose records were not completed. The remaining 241 infants were evaluated in an ITT analysis. |
| Selective reporting (reporting bias) | Unclear risk | The protocol for the study was not available to us; therefore we cannot ascertain whether deviations from the protocol occurred. |
| Other bias | Low risk | Appears free of other bias |
| Methods | Double‐blind randomised controlled trial | |
| Participants | 219 ELBW infants were randomly assigned to early EPO, late EPO, or control on day 3 of life. | |
| Interventions | 74 infants in the early EPO group received EPO (NeoRecor‐mon, F. Hoffman‐La Roche, Basel, Switzerland) 250 IU/kg, IV or SC, 3 times a week (750 IU/kg/week, high dose), starting from day 3 of life, for 9 weeks. | |
| Outcomes | Use of 1 or more red blood cell transfusions | |
| Notes | Sample size calculation was performed. | |
| Risk of bias | ||
| Bias | Authors' judgement | Support for judgement |
| Random sequence generation (selection bias) | Unclear risk | No information provided |
| Allocation concealment (selection bias) | Low risk | Numbered sealed envelopes |
| Blinding of participants and personnel (performance bias) | Low risk | Treating physicians determined whether infants could be enrolled or withdrawn from the study, and whether infants should receive transfusions, and monitored them without knowing their treatment group. Dosing investigators performed randomisation and administered rhEPO but were not involved in the infants’ care. When treatment was to be given, a dosing investigator carrying a “black box” containing appropriate equipment visited each infant, gave or simulated administration of study medication, and placed adhesive strips on both thighs (of rhEPO recipients and controls), which remained there until the next visit. During this procedure, staff and parents had to leave. A treating physician or a dosing investigator assigned to an infant served in that function as long as the infant was studied. |
| Blinding of outcome assessment (detection bias) | Low risk | See the information in the box above. |
| Incomplete outcome data (attrition bias) | Low risk | Complete follow‐up: yes; 1 of the 220 randomised infants (control group) was excluded from all evaluations because parents withdrew consent a few hours after randomisation before the start of the treatment phase. |
| Selective reporting (reporting bias) | Unclear risk | The protocol for the study was not available to us; therefore we cannot ascertain whether deviations from the protocol occurred. |
| Other bias | Low risk | Appears free of other bias |
| Methods | Randomised controlled trial | |
| Participants | 30 preterm infants with birth weight of 750 to 1499 grams and 5 to 10 days old | |
| Interventions | 15 infants in the EPO group received epoetin alpha (Janssen‐Cilag Pharmaceuticals, Vienna, Austria) 300 IU/kg SC 3 times a week for 4 weeks. | |
| Outcomes | Study gives results as cumulative volume of blood transfused per kg with first and third quartiles. | |
| Notes | It is not stated whether infants who had received blood transfusions before study entry were included. | |
| Risk of bias | ||
| Bias | Authors' judgement | Support for judgement |
| Random sequence generation (selection bias) | Low risk | Computerised random number generator |
| Allocation concealment (selection bias) | Unclear risk | 30 preterm infants were randomly assigned. |
| Blinding of participants and personnel (performance bias) | High risk | Control group did not receive placebo. Personnel were aware of group assignments. |
| Blinding of outcome assessment (detection bias) | High risk | Control group did not receive placebo. Outcome assessors were aware of group assignments. |
| Incomplete outcome data (attrition bias) | Low risk | Complete follow‐up: yes |
| Selective reporting (reporting bias) | Unclear risk | The protocol for the study was not available to us; therefore we cannot ascertain whether deviations from the protocol occurred. |
| Other bias | Low risk | Appears free of other bias |
| Methods | Double‐blind randomised controlled trial | |
| Participants | 43 preterm infants < 33 weeks' gestation and < 1700 grams | |
| Interventions | 22 infants in EPO group received erythropoietin (Eprex; Janssen‐Cilag, Auckland, New Zealand) at a dose of 1200 IU/kg/week (high dose) SC in 3 divided doses until the age of 3 weeks, when the dose was reduced to 600 IU/kg/week. Treatment continued until 34 weeks' completed gestation, or for a minimum of 3 weeks. | |
| Outcomes | Use of 1 or more red blood cell transfusions | |
| Notes | It is not stated whether infants who had received blood transfusions before study entry were included. | |
| Risk of bias | ||
| Bias | Authors' judgement | Support for judgement |
| Random sequence generation (selection bias) | Low risk | Computer generated |
| Allocation concealment (selection bias) | Low risk | Infants were randomised by the hospital pharmacist to receive EPO or no treatment (control group). |
| Blinding of participants and personnel (performance bias) | Low risk | Treatment was administered by a designated study nurse who was not involved in clinical management decisions related to the infants. On each of the treatment days, the nurse collected vials of EPO and saline, and 1‐mL syringes were prepared in a side room. The syringes were labelled with the patient's name. A screen was placed around the bedside; those on EPO received SC injection, and adhesive plaster was placed over the injection site. Those in the control group had plaster applied to a similar site as those on EPO; the sites in both groups were then left covered until the next treatment day. |
| Blinding of outcome assessment (detection bias) | Low risk | See above, under 'Blinding of participants and personnel'. |
| Incomplete outcome data (attrition bias) | Low risk | Complete follow‐up: yes |
| Selective reporting (reporting bias) | Unclear risk | The protocol for the study was not available to us; therefore we cannot ascertain whether deviations from the protocol occurred. |
| Other bias | Low risk | Appears free of other bias |
| Methods | Randomised controlled trial Study location: 5 centres in Europe | |
| Participants | 93 infants with PMA of 28 to 32 completed weeks' gestation | |
| Interventions | 43 infants in the EPO group received EPO (Boehringer Mannheim GmbH) 30 IU/kg SC every third day (70 IU/kg/week, low dose) from the fourth to the 25th day of life. | |
| Outcomes | Use of 1 or more red blood cell transfusions | |
| Notes | It is not stated whether infants who had received blood transfusions before study entry were included. | |
| Risk of bias | ||
| Bias | Authors' judgement | Support for judgement |
| Random sequence generation (selection bias) | Unclear risk | No information provided |
| Allocation concealment (selection bias) | Low risk | Prenumbered sealed envelopes |
| Blinding of participants and personnel (performance bias) | High risk | Control infants were not given subcutaneous injections of placebo. Personnel were not blinded. |
| Blinding of outcome assessment (detection bias) | High risk | Control infants were not given subcutaneous injections of placebo. Assessors were not blinded. |
| Incomplete outcome data (attrition bias) | Low risk | Complete follow‐up: yes |
| Selective reporting (reporting bias) | Unclear risk | The protocol for the study was not available to us; therefore we cannot ascertain whether deviations from the protocol occurred. |
| Other bias | Low risk | Appears free of other bias |
| Methods | Randomised controlled trial | |
| Participants | 20 ill newborn VLBW infants, less than 48 hours of age, weighing between 750 and 1500 grams at birth with GA > 27 weeks | |
| Interventions | 10 infants in the EPO group received EPO (unnamed product), 200 IU/kg/d (1400 IU/kg/week, high dose) IV for 14 consecutive days. | |
| Outcomes | Use of 1 or more red blood cell transfusions | |
| Notes | It is not stated whether infants who had received blood transfusions before study entry were included. | |
| Risk of bias | ||
| Bias | Authors' judgement | Support for judgement |
| Random sequence generation (selection bias) | Unclear risk | No information provided |
| Allocation concealment (selection bias) | Unclear risk | Infants were randomly selected. |
| Blinding of participants and personnel (performance bias) | Low risk | All caregivers and investigators were masked to treatment groups. |
| Blinding of outcome assessment (detection bias) | Low risk | All caregivers and investigators were masked to treatment groups. |
| Incomplete outcome data (attrition bias) | Low risk | Complete follow‐up: yes Investigators found no differences in the number of infants with BPD, IVH, or NEC (data not shown). |
| Selective reporting (reporting bias) | Unclear risk | The protocol for the study was not available to us; therefore we cannot ascertain whether deviations from the protocol occurred. After the interim analysis, the study was discontinued because of significant differences between groups in numbers of transfusions. |
| Other bias | Low risk | Appears free of other bias |
| Methods | Double‐blind randomised controlled trial | |
| Participants | 28 ELBW infants with birth weight ≤ 750 grams who were 72 hours of age or younger | |
| Interventions | 15 infants received EPO (unnamed product) 200 IU/kg/d (1400 IU/kg/week, high dose) IV, for 14 consecutive days. | |
| Outcomes | Total volume of blood transfused per infant | |
| Notes | It is not stated whether infants who had received blood transfusions before study entry were included, but numbers of transfusions from birth to day 1 are reported; thus infants who had received transfusions were included. | |
| Risk of bias | ||
| Bias | Authors' judgement | Support for judgement |
| Random sequence generation (selection bias) | Unclear risk | No information provided |
| Allocation concealment (selection bias) | Low risk | Infants were randomly assigned in a double‐blind fashion. |
| Blinding of participants and personnel (performance bias) | Low risk | Study is described as a double‐blind placebo‐controlled study, and a placebo was used. |
| Blinding of outcome assessment (detection bias) | Low risk | Study is described as a double‐blind placebo‐controlled trial, and a placebo was used. |
| Incomplete outcome data (attrition bias) | Low risk | Complete follow‐up: yes. Two infants in each group died before the 21‐day study period. |
| Selective reporting (reporting bias) | Unclear risk | The protocol for the study was not available to us; therefore we cannot ascertain whether deviations from the protocol occurred |
| Other bias | Low risk | Appears free of other bias |
| Methods | Double‐blind randomised controlled trial | |
| Participants | 172 infants with birth weight between 401 grams and 1000 grams, PMA < 32 weeks, and between 24 and 96 hours old at the time of study entry, who were likely to survive > 72 hours | |
| Interventions | 87 infants in the EPO group received 400 U/kg EPO (unnamed product) 3 times weekly (1200 IU/kg/week, high dose) IV, or SC when IV access was not available. | |
| Outcomes | Use of 1 or more red blood cell transfusions | |
| Notes | It is not stated whether infants who had received blood transfusions before study entry were included. Study was supported by grants from Ortho‐Biotech and Schein Pharmaceuticals. | |
| Risk of bias | ||
| Bias | Authors' judgement | Support for judgement |
| Random sequence generation (selection bias) | Unclear risk | No information provided |
| Allocation concealment (selection bias) | Low risk | Blinding of randomisation: yes. All caregivers and investigators (except research nurses) were masked to treatment assignment. |
| Blinding of participants and personnel (performance bias) | Low risk | All caregivers and investigators (except research nurses) were masked to treatment assignment. |
| Blinding of outcome assessment (detection bias) | Low risk | All caregivers and investigators (except research nurses) were masked to treatment assignment. |
| Incomplete outcome data (attrition bias) | Unclear risk | All infants were followed through their hospital stay up to 120 days. Of 72 EPO‐treated and 70 placebo‐control infants surviving to discharge, follow‐up data at 18 to 22 months' corrected age were collected on 51 of 72 EPO‐treated infants (71%) and 51 of 70 placebo/controls (73%). Follow‐up rates were low. |
| Selective reporting (reporting bias) | Unclear risk | The protocol for the study was not available to us; therefore we cannot ascertain whether deviations from the protocol occurred. |
| Other bias | Low risk | Appears free of other bias. Study was supported by grants from Ortho‐Biotech and Schein Pharmaceuticals. |
| Methods | Double‐blind randomised controlled trial | |
| Participants | 118 infants with birth weight 1001 to 1250 grams, PMA ≤ 32 weeks, and between 24 and 96 hours old at the time of study entry who were likely to survive > 72 hours | |
| Interventions | 59 infants in the EPO group received 400 U/kg EPO (unnamed product) 3 times weekly (1200 IU/kg/week, high dose) IV or SC when IV access was not available. 59 infants in the placebo/control group received sham SC injections when IV access was not available. An adhesive bandage covered true and sham injection sites. Treatment was continued until discharge, transfer, death, or 35 completed weeks' corrected PMA. | |
| Outcomes | Numer of infants who received any transfusion (primary outcome) Use of 1 or more red blood cell transfusions | |
| Notes | Infants in Ohls 2001B were not examined at 18 to 22 months' corrected age. Only infants in Ohls 2001A were examined at follow‐up (see notes under Ohls 2001A). | |
| Risk of bias | ||
| Bias | Authors' judgement | Support for judgement |
| Random sequence generation (selection bias) | Unclear risk | No information provided |
| Allocation concealment (selection bias) | Low risk | Blinding of randomisation: yes. All caregivers and investigators (except research nurses) were masked to treatment assignment. |
| Blinding of participants and personnel (performance bias) | Low risk | All caregivers and investigators (except research nurses) were masked to treatment assignment. |
| Blinding of outcome assessment (detection bias) | Low risk | All caregivers and investigators (except research nurses) were masked to treatment assignment. |
| Incomplete outcome data (attrition bias) | Low risk | All infants were followed through their hospital stay up to 120 days. |
| Selective reporting (reporting bias) | Unclear risk | The protocol for the study was not available to us; therefore we cannot ascertain whether deviations from the protocol occurred. |
| Other bias | Low risk | Appears free of other bias. Study was supported by grants from Ortho‐Biotech and Schein Pharmaceuticals. |
| Methods | Randomised masked controlled clinical trial | |
| Participants | 102 infants with BW 500 to 1250 grams and ≤ 48 hours of age. Infants with trisomies, significant congenital anomalies, hypertension, seizures, thromboses, haemolytic disease, or receiving EPO clinically were ineligible for the study. | |
| Interventions | Infants were randomised in masked fashion to 1 of 3 groups: EPO, 400 U/kg (1200 U/kg/week ‐ high dose), given subcutaneously 3 times a week (Monday, Wednesday, and Friday); Darbe, 10 µg/kg, given subcutaneously once a week, with sham dosing 2 other times per week; or placebo, consisting of 3 sham doses per week. Dosing continued until 35 completed weeks’ gestation, discharge, transfer to another hospital, or death. Doses of Darbe and EPO were initially based on study entry weight and were adjusted weekly. Study drug concentrations were chosen to give equivalent volumes (0.1 mL/kg body weight) of Darbe or EPO. All infants (regardless of treatment arm) received supplemental iron, folate (50 mg per day oral), and vitamin E (15 IU per day oral). Iron dextran, 3 mg/kg once a week, was added to parenteral nutrition while infants were receiving, 60 mL/kg per day enteral feedings. Oral iron 3 mg/kg per day was started when feedings were ≥ 60 mL/kg per day, and was increased to 6 mg/kg per day when feedings reached 120 mL/kg per day (high dose). Serum ferritin concentrations were used to adjust iron dosing. For infants in whom ferritin concentrations were > 400 ng/mL, the parenteral or enteral dose of iron was decreased by 50%; for infants in whom ferritin concentrations were < 50 ng/mL, the parenteral or enteral dose was doubled. | |
| Outcomes | Use of 1 or more red blood cell transfusions | |
| Notes | In the previous version of the review, we obtained additional information from Dr. Ohls regarding several outcomes; this explains why some of the data we have entered in RevMan 5.3 differ from the original publication. 17 infants (17%) were transfused before treatment was initiated. | |
| Risk of bias | ||
| Bias | Authors' judgement | Support for judgement |
| Random sequence generation (selection bias) | Low risk | Randomisation lists for each pharmacist were computer generated. |
| Allocation concealment (selection bias) | Low risk | All caregivers were blinded to treatment groups, except research pharmacists at each site, who drew up study medications to be administered by the research nurse. |
| Blinding of participants and personnel (performance bias) | Low risk | All caregivers were blinded to treatment groups, except research pharmacists at each site, who drew up study medications to be administered by the research nurse. The placebo group received sham injections. |
| Blinding of outcome assessment (detection bias) | Low risk | All caregivers were blinded to treatment groups, except research pharmacists at each site, who drew up study medications to be administered by the research nurse. The placebo group received sham injection. |
| Incomplete outcome data (attrition bias) | Unclear risk | Three participants (1 who had the study drug mistakenly held at the start of the study and subsequently never received any study drug; 1 who was found to be ineligible based on congenital neurological anomaly on head ultrasound noted before receiving study drug; and 1 who died of a pulmonary haemorrhage before receiving study drug) were excluded from analysis. One infant had the study drug stopped at 34 weeks’ corrected gestation at the request of parents. All infants who received at least 1 dose of study drug were included in the analysis (n = 33 in each group). Bayley Scales of Infant Development (BSID‐III) cognitive scores at 18 to 22 months are reported in E‐PAS2013:2924, but not PDI scores. A full report was published in 2014 (Ohls 2014). At the end of hospitalisation, 94 infants were evaluated. Five hospital deaths occurred, and 14 children did not return for follow‐up. Eighty children were evaluated at follow‐up at a corrected age of 18 to 22 months (Darbe n = 27 (84%), EPO n = 29 (91%), placebo/sham injection n = 24 (80%)). A report of preschool assessment (at age 3.5 to 4 years) was published in 2016 (Ohls 2016), and the study assessed 53 children (Darbe n = 15 (47%), EPO n = 24 (75%), placebo n =14 (47%)). In 2017, an additional study (Lowe 2017) reported on behavioural measures in 49 children (Darbe or EPO n = 35 (55%), placebo n = 14 (47%)). The 2 groups of Darbe and EPO were combined to create an erythropoiesis‐stimulating agent (ESA) group. Percentages are based on the number of infants evaluated at the end of hospitalisation. Follow‐up rates beyond 18 to 22 months were low. |
| Selective reporting (reporting bias) | Low risk | Study was registered as NCT00334737 in June 2006. No major deviations from the protocol are apparent, except that primary outcomes included MDI at 18 to 22 months and PDI as a secondary outcome. MDI and PDI are not reported in the primary publication. |
| Other bias | Low risk | Appears free of other bias |
| Methods | Randomised controlled trial | |
| Participants | 39 infants (BW 700 to 1500 grams, PMA ≤ 30.0 weeks) | |
| Interventions | 21 infants received EPO (EPO 250 IU/kg/d during the first 6 days of life IV for a period of 30 minutes) (total dose 1500 IU/kg/week). 18 infants received placebo (isotonic saline as placebo for a period of 30 minutes). None of the infants received iron during the first week of life. | |
| Outcomes | Iron status | |
| Notes | We received additional information from Dr. Peltoniemi. | |
| Risk of bias | ||
| Bias | Authors' judgement | Support for judgement |
| Random sequence generation (selection bias) | Low risk | Random number table |
| Allocation concealment (selection bias) | Low risk | Allocation was concealed, but details are not provided. |
| Blinding of participants and personnel (performance bias) | Low risk | Study drug and placebo were put into identical syringes. |
| Blinding of outcome assessment (detection bias) | Low risk | Nurses, doctors, and study investigators were blinded. |
| Incomplete outcome data (attrition bias) | Unclear risk | Outcomes during initial hospital stay reported for all randomised infants. Of 20 surviving children at 2 years of age, 19 were enrolled and 10 were evaluated on Griffiths Developmental Scale. Of 16 surviving placebo group children at 2 years of age, all were enrolled and 9 were evaluated at on Griffiths Developmental Scale. Follow‐up rates for Griffiths Developmental Scale were low (thus unclear risk). |
| Selective reporting (reporting bias) | Low risk | The protocol for the study was not available to us. The protocol was written in Finnish, and Dr. Antilla assured Dr. Peltoniemi that no deviations from the protocol occurred. |
| Other bias | Low risk | Appears free of other bias |
| Methods | Single‐blind randomised controlled trial | |
| Participants | 96 preterm infants, PMA 28 to 34 weeks' gestation | |
| Interventions | Control group receiving standard parenteral nutrition (group 1: n = 31), iron‐supplemented group (iron sucrose (IS)) (group 2: IS, n = 33), and iron‐supplemented combined erythropoietin group (group 3: IS + EPO, n = 32). IS + EPO group received EPO 400 IU/kg twice a week for 2 weeks; total dose 800 IU/kg per week (1600 IU/kg in 2 weeks) (high dose). IS group and IS + EPO group received iron 200 µg/kg/d until 2 weeks after birth. | |
| Outcomes | NEC | |
| Notes | For outcomes, we included the IS group and the IS + EPO group. | |
| Risk of bias | ||
| Bias | Authors' judgement | Support for judgement |
| Random sequence generation (selection bias) | Unclear risk | No information provided |
| Allocation concealment (selection bias) | Low risk | Participants were randomly assigned to 1 of 3 groups in the following manner: Treatment cards were imprinted with a unique randomisation code and were placed in sequentially numbered opaque envelopes. At the study site, treatment cards were taken out in sequential order, and participants were assigned to the corresponding treatment group on the basis of the randomisation number. |
| Blinding of participants and personnel (performance bias) | Low risk | All investigators, physicians, and nurses involved in participant care and parents were blinded to group assignment. The randomisation process was made available only to the pharmacist, who supervised the quality of iron sucrose and the parenteral nutrition preparation. |
| Blinding of outcome assessment (detection bias) | Low risk | All investigators, physicians, and nurses involved in participant care and parents were blinded to this assignment. The randomisation process was made available only to the pharmacist, who supervised the quality of iron sucrose and the parenteral nutrition preparation. |
| Incomplete outcome data (attrition bias) | Low risk | Of 96 preterm infants enrolled, 91 infants completed the study; 30 belonged to the control group, 31 to the iron‐supplemented (IS) group, and 30 to the iron‐supplemented (IS) + EPO group. Five infants could not complete the study. One infant in the IS group died from respiratory failure, and 4 infants (1 in the control group, 1 in the IS group, and 2 in the IS + EPO group) were discharged because treatments were discontinued by their parents. |
| Selective reporting (reporting bias) | Unclear risk | Study protocol was not available to us, and we cannot judge whether deviations from the protocol occurred. |
| Other bias | Low risk | Appears free of other bias. |
| Methods | Randomised double‐blind controlled clinical trial | |
| Participants | 60 newborn infants under 1500 grams birth weight; mean age at entry in the EPO group 7.75 ± 2.42 days, and mean age at entry in the control group 7.96 ± 2.44 days | |
| Interventions | 29 infants in the EPO group received r‐EPO (Eritropoyetina del Laboraorio Andromaco) 200 IU/kg SC, 3 times a week (600 IU/kg/week, high dose), during 4 weeks. | |
| Outcomes | Number of transfusions per infant | |
| Notes | ||
| Risk of bias | ||
| Bias | Authors' judgement | Support for judgement |
| Random sequence generation (selection bias) | Unclear risk | No information presented |
| Allocation concealment (selection bias) | Unclear risk | "were randomised ina double‐blind fashion" ‐ but no specific information provided |
| Blinding of participants and personnel (performance bias) | Unclear risk | No specific information provided |
| Blinding of outcome assessment (detection bias) | Unclear risk | No specific information provided |
| Incomplete outcome data (attrition bias) | Low risk | Complete follow‐up: yes |
| Selective reporting (reporting bias) | Unclear risk | The protocol for the study was not available to us; therefore we cannot ascertain whether deviations from the protocol occurred. |
| Other bias | Low risk | Appears free of other bias |
| Methods | Randomised controlled trial | |
| Participants | Preterm infants, PMA ≤ 32 weeks' gestation, and < 72 hours of age | |
| Interventions | EPO group (n = 366) received EPO at 500 IU/kg IV every other day for 2 weeks. Cumulative dose of 3500 IU/kg. First dose within 72 hours after birth. Placebo group (n = 377) received an equivalent volume of normal saline IV. | |
| Outcomes | Head U/S within 3 days after birth, then weekly until discharge At 18 months' corrected age, neurological exam and Mental Developmental Index (Bayley Scales – Second Edition) Hearing test,‐ Deafness defined as a hearing disability that required amplification. Blindness defined as corrected visual acuity < 20/200 Moderate or severe disability defined as survival with at least 1 of the following complications: cerebral palsy, MDI < 70, deafness, or blindness | |
| Notes | ROP grades are not reported. We wrote in March 2017 to the corresponding author, but we had not received a response as of 11 June 2017. | |
| Risk of bias | ||
| Bias | Authors' judgement | Support for judgement |
| Random sequence generation (selection bias) | Low risk | Computer‐based random number generator |
| Allocation concealment (selection bias) | Low risk | Group assignment for each consecutive participant was concealed in a sealed envelope before participants were included. |
| Blinding of participants and personnel (performance bias) | High risk | Doctors and nurses responsible for treatment were not blinded according to the rules of medical procedure in China. |
| Blinding of outcome assessment (detection bias) | Unclear risk | According to trial authors, "The investigators performing the short‐term and long‐term outcome assessments and the parents were blinded to patients' group allocation". It is difficult to understand this statement, as doctors and nurses were not blinded to treatments. Final evaluation at 18 months' corrected age was performed by doctors from the Child Growth and Development Department, who were blinded to the treatment protocol and were not allowed to have access to the treatment history of infants. |
| Incomplete outcome data (attrition bias) | Unclear risk | All 743 randomised infants were accounted for in short‐term outcomes. For outcomes at 18 months, 309 children in the EPO group (36 infants were lost to follow‐up) and 304 in the placebo group (39 children were lost to follow‐up) were assessed (90% in both groups). |
| Selective reporting (reporting bias) | High risk | Study was registered as NCT02036073 but was registered in December 2013, after recruitment had been completed. Study started to recruit patients in January 2009. Therefore we are unable to tell whether any deviations occurred from the study protocol that was established before the study start. In the protocol, the primary outcome measure was: Incidence of MDI < 70 at corrected age of 18 months, and secondary outcome measures were Incidence of ROP at corrected age 42 weeks. In the full report, primary outcomes are listed as death, disability, or death + disability at 18 months' corrected age. ROP is listed as a neonatal complication. |
| Other bias | Low risk | Appears free of other bias |
| Methods | Randomised double‐blind controlled trial | |
| Participants | 44 newborn infants with birth weight under 1500 grams, age 1 to 7 days | |
| Interventions | EPO group (n = 25) received 150 IU/kg/dose of EPO (Cilag AG, Zug, Switzerland) twice a week (300 IU/kg/week, low dose) during 4 weeks. Control group (n = 19) received no placebo. From the 15th day of life, iron was started at 3 mg/kg/d (low dose) in all infants. | |
| Outcomes | Number of transfusions per infant | |
| Notes | It is not stated whether infants who had received blood transfusions before study entry were included. | |
| Risk of bias | ||
| Bias | Authors' judgement | Support for judgement |
| Random sequence generation (selection bias) | Low risk | Random number table |
| Allocation concealment (selection bias) | Low risk | Blinding of randomisation: yes |
| Blinding of participants and personnel (performance bias) | Low risk | "The doctors in clinical charge were unaware of the treatment or control status of the babies". |
| Blinding of outcome assessment (detection bias) | Low risk | "The doctors in clinical charge were unaware of the treatment or control status of the babies". |
| Incomplete outcome data (attrition bias) | Low risk | Complete follow‐up: yes |
| Selective reporting (reporting bias) | Unclear risk | The protocol for the study was not available to us; therefore we cannot ascertain whether deviations from the protocol occurred. |
| Other bias | Low risk | Appears free of other bias |
| Methods | Randomised controlled trial | |
| Participants | 97 VLBW infants with GA ≤ 31 weeks, birth weight 1500 grams or less, and age 1 to 7 days | |
| Interventions | 33 infants received rHuEPO (Cilag AG, Zug, Switzerland) 150 IU/kg twice weekly (300 IU/kg/week, low dose). | |
| Outcomes | Use of 1 or more red blood cell transfusions | |
| Notes | It is not stated whether infants who had received blood transfusions before study entry were included. | |
| Risk of bias | ||
| Bias | Authors' judgement | Support for judgement |
| Random sequence generation (selection bias) | Low risk | Random number table |
| Allocation concealment (selection bias) | Unclear risk | Infants were randomly assigned. |
| Blinding of participants and personnel (performance bias) | High risk | Control group received no placebo. Personnel were not blinded. |
| Blinding of outcome assessment (detection bias) | High risk | Control group received no placebo. Outcome assessors were not blinded. |
| Incomplete outcome data (attrition bias) | Low risk | Complete follow‐up: yes |
| Selective reporting (reporting bias) | Unclear risk | The protocol for the study was not available to us; therefore we cannot ascertain whether deviations from the protocol occurred. |
| Other bias | Low risk | Appears free of other bias |
| Methods | Randomised controlled clinical trial | |
| Participants | 36 VLBW infants with gestational age < 31 weeks and birth weight < 1300 grams with clinical stability at the time of entry | |
| Interventions | 18 infants in the treatment group received rHuEPO (Cilag AG, Zug, Switzerland) 200 IU/kg every alternate day (700 units/kg/week, high dose) SC. | |
| Outcomes | Use of 1 or more red blood cell transfusions | |
| Notes | This study does not mention the exact day when treatment was started. | |
| Risk of bias | ||
| Bias | Authors' judgement | Support for judgement |
| Random sequence generation (selection bias) | Low risk | Random number table |
| Allocation concealment (selection bias) | Unclear risk | Infants were randomly assigned to receive EPO or not. |
| Blinding of participants and personnel (performance bias) | High risk | No placebo was administered. Personnel were not blinded. |
| Blinding of outcome assessment (detection bias) | High risk | No placebo was administered. Outcome assessors were not blinded. |
| Incomplete outcome data (attrition bias) | Low risk | Completeness follow‐up: yes |
| Selective reporting (reporting bias) | Unclear risk | The protocol for the study was not available to us; therefore we cannot ascertain whether deviations from the protocol occurred. |
| Other bias | Low risk | Appears free of other bias |
| Methods | Randomised controlled trial | |
| Participants | 60 VLBW infants, < 7 days of age, < 35 weeks' PMA, and weighing < 1500 grams | |
| Interventions | 30 infants were supplemented with rHuEPO 200 IU/kg/dose SC 3 times/week for 2 weeks, started on day 7 of life. EPO group and control group (n = 30) received oral iron 6 mg/kg/d and folic acid 0.5 mg every alternate day up to 12 weeks of age. Administration of both iron and folic acid started from day 14 of life, or as soon as enteral feeding was initiated after day 14. | |
| Outcomes | Mortality is the only outcome that can be ascertained from this study. | |
| Notes | Mortality is the only outcome that can be ascertained from this study. For all other outcomes of interest, including neonates requiring blood transfusion while in hospital, trial authors excluded 13 infants; in the EPO group, 4 infants died during hospital stay, 1 participant did not come in for first follow‐up, and 1 did not come in for second follow‐up. In the control group, 5 infants died during hospital stay and 2 did not come in for second follow‐up. Finally, 24 infants in group 1 and 23 infants in group 2 completed follow‐up until 10 weeks of age. These 13 infants who dropped out were excluded from the analysis. We suggest that infants who died should have been included in both the nominator and the denominator for the outcomes of need for blood transfusion and number of blood transfusions (ITT analysis). A total of 13 infants dropped out of the study, which represents 22% ‐ a very high percentage. | |
| Risk of bias | ||
| Bias | Authors' judgement | Support for judgement |
| Random sequence generation (selection bias) | Unclear risk | Lottery method |
| Allocation concealment (selection bias) | Unclear risk | Lottery method |
| Blinding of participants and personnel (performance bias) | High risk | No placebo was used, so personnel could not be blinded. |
| Blinding of outcome assessment (detection bias) | High risk | Outcome assessors were not blinded. |
| Incomplete outcome data (attrition bias) | High risk | 22% of the infants dropped out. In‐hospital outcome data did not include deaths. Lack of ITT analysis |
| Selective reporting (reporting bias) | Unclear risk | The protocol for this study was not available to us, so we are not able to tell whether deviations from the protocol occurred. |
| Other bias | Low risk | Appears free of other bias |
| Methods | Non‐blind randomised controlled trial | |
| Participants | 00 VLBW infants, < 33 weeks' GA, hematocrit 40% to 60% at birth | |
| Interventions | 50 infants in the EPO group received EPO (unnamed product) 250 IU/kg/dose SC 3 times a week (750 IU/kg/week, high dose) from day 5 to day 40. | |
| Outcomes | Exposure of a proportion of infants to 1 or more red blood cell transfusions | |
| Notes | It is not stated whether infants who had received blood transfusions before study entry were included. | |
| Risk of bias | ||
| Bias | Authors' judgement | Support for judgement |
| Random sequence generation (selection bias) | Unclear risk | No information provided |
| Allocation concealment (selection bias) | Unclear risk | Infants were randomised to receive EPO or no drug. |
| Blinding of participants and personnel (performance bias) | High risk | No placebo drug was given to the control group. Personnel were not blinded to study group. |
| Blinding of outcome assessment (detection bias) | High risk | No placebo drug was given to the control group. Outcome assessors were not blinded to study group. |
| Incomplete outcome data (attrition bias) | Low risk | Complete follow‐up: yes |
| Selective reporting (reporting bias) | Unclear risk | The protocol for the study was not available to us; therefore we cannot ascertain whether deviations from the protocol occurred. |
| Other bias | Low risk | Appears free of other bias |
BP: blood pressure.
BPD: bronchopulmonary dysplasia.
BSID: Bayley Scales of Infant Development.
BW: birth weight.
CI: confidence interval.
CP: cerebral palsy.
ELBW: extremely low birth weight.
EPO: erythropoietin.
GA: gestational age.
g: grams.
Hct: hematocrit.
IS: iron sucrose.
ITT: intention‐to‐treat.
IU: international units.
IV: intravenous/intravenously.
IVH: intraventricular haemorrhage.
MDI: Mental Development Index.
MRI: magnetic resonance imaging.
NEC: necrotising enterocolitis.
PDI: Psychomotor Development Index.
PMA: postmenstrual age.
PVL: periventricular leukomalacia.
RDS: respiratory depression syndrome.
rhEPO: recombinant human EPO.
rhG‐CSF: recombinant human granulocyte colony‐stimulating factor.
ROP: retinopathy of prematurity.
SC: subcutaneous/subcutaneously.
TPN: total parenteral nutrition.
u/s: ultrasound.
VLBW: very low birth weight.
Characteristics of excluded studies [ordered by study ID]
| Study | Reason for exclusion |
| Patients were enrolled immediately after birth. The volume of RBC transfusions was reported as mL/week over the study period. We could not use this information in our outcome of total volume (mL/kg) of blood transfused per infant. | |
| This study was not a randomised controlled trial. | |
| Infants were > 6 days old. Will be included in the 'Late EPO' review. | |
| One of the authors of this study, Dr. R.K. Ohls, informed us that this study reported on a subgroup of Ohls 2001A. All outcomes of Bierer 2006 were included in the 2004 follow‐up publication of Ohls 2001A. | |
| This study compared 2 different dosing regimens for the same total weekly dose of EPO. The trial included no control or placebo group. | |
| This study assessed the effectiveness of IV vs SC administration of EPO and included no non‐treated group. | |
| This study did not reveal the number of infants allocated to treatment and control groups, nor the age at which the infants entered into the study. | |
| This study reported the same findings as Haiden 2005. | |
| Both study groups received erythropoietin. | |
| This was not a randomised controlled trial. | |
| This was a randomised controlled trial, but results showed no clinical outcomes of interest for this review. | |
| No outcomes of interest for this review were reported. | |
| Upon consultation with one of the trial authors (Bolado‐Garcia PB), it was clarified that this was not a randomised controlled trial. | |
| This randomised controlled trial compared the effectiveness of EPO administered by continuous intravenous vs subcutaneous route. | |
| This randomised controlled trial compared 2 doses of EPO: 750 IU/kg/week vs 1500 IU/kg/week without a non‐treated control group. | |
| This study compared different routes of administration (SC EPO vs EPO added to the total parenteral nutrition fluid). This study included no untreated control group. | |
| This was a randomised controlled trial in which one group received oral EPO, and the other group SC EPO. The trial included no untreated control group. | |
| 128 infants were randomised early (first week of life) to EPO group (n = 66) or control group (n = 62). The dose of EPO is not stated in the abstract. Infants randomised to EPO received significantly fewer transfusions and had less IVH. | |
| Not a randomised controlled trial (20 study participants and 20 concurrent controls). | |
| This study was labelled by trial authors as a quasi‐randomised (assignment on an alternating basis) trial. Study authors reported on uneven numbers in the 2 groups (42 infants in the EPO group and 51 in the control group). On request, the principal author provided the following information. "In the study period 112 premature infants < 1500 grams were followed in the NICU. Informed consents were obtained from the parents of 97 babies, but only 93 babies completed the study because 3 patients were lost to follow‐up after discharge and one baby died of bronchopulmonary dysplasia before completing the 12 week monitoring period. These 4 babies were omitted from the study group (r‐Hu EPO+enteral iron). These infants are included in the result section. At the end of the study r‐Hu EPO was not available, and 2 more patients had only iron supplementation. Then the study was closed and these 2 babies were also added to the control group". | |
| This randomised controlled trial compared 2 different dosing schedules of EPO. Group 1 (60 infants; mean postnatal age at entry 6 ± 3.1 days) received SC EPO at 250 units per kg per dose, 3 times weekly for 6 weeks. Group 2 (59 infants; mean postnatal age at entry 7 ± 3.9 days) received SC EPO at 750 units per kg per dose once weekly for 6 weeks. No untreated group was included. | |
| Trial population consisted of infants > 37 weeks' PMA. |
EPO: erythropoietin.
IV: intravenous.
IVH: intraventricular haemorrhage.
RBC: red blood cell.
SC: subcutaneous.
Characteristics of ongoing studies [ordered by study ID]
| Trial name or title | Preterm Erythropoietin Neuroprotection Trial (PENUT Trial) (PENUT) |
| Methods | Randomised controlled trial |
| Participants | Preterm infants 24 0/7 to 27 6/7 weeks' gestation, beginning in the first 24 hours after birth |
| Interventions | Experimental: EPO 1000 U/kg followed by 400 U/kg. Participants will receive 6 doses of intravenous EPO 1000 U/kg/dose at 48‐hour intervals from the time of enrolment. Following the high‐dose period, participants will receive subcutaneous EPO 400 U/kg/dose 3 times a week until 32 6/7 weeks' postmenstrual age. |
| Outcomes | Primary outcome measures: neurodevelopmental outcome [Time Frame: 24 to 26 months' corrected age], neurodevelopmental exam Bayley‐III: MDI and PDI Placebo comparator: Control participants will receive 6 doses of vehicle intravenously during the first 2 weeks of life. Doses will be administered at 48‐hour intervals from the time of enrolment. Following high‐dose administration, sham subcutaneous injections will be given 3 times a week through to 32 6/7 weeks' postmenstrual age. |
| Starting date | December 2013 |
| Contact information | Sandra Juul, Professor of Pediatrics, University of Washington |
| Notes | NCT01378273 |
| Trial name or title | Erythropoietin in premature infants to prevent encephalopathy: a multi‐centre randomised blinded controlled study of the efficacy of erythropoietin in China |
| Methods | Multi‐centre randomised blinded controlled study |
| Participants | Preterm infants |
| Interventions | Experimental: Erythropoietin EPO is administered 1000 U/kg IV in 48 hours after preterm birth, and at 48‐hour intervals for 3 doses per week. After 6 doses, subcutaneously 3 doses per week until at corrected age of 34 weeks. Placebo comparator: Normal saline is administered 5 mL IV at 3 to 6 hours after preterm birth, and at 48‐hour intervals for 3 doses per week. After 6 doses, subcutaneously 3 doses per week until at corrected age of 34 weeks |
| Outcomes | Primary outcome measures: neurodevelopment (Bayley Scores) [Time Frame: At corrected age of 18 months]. To evaluate neurodevelopmental function via Bayley Scores of Infant Development Mental Development Index (BSID) and incidence of MDI < 70 (severe) or MDI < 85 (moderate). |
| Starting date | September 2015 |
| Contact information | Wenhao Zhou, Doctor (+86)021‐64931003; [email protected] |
| Notes | NCT02550054 |
BSID: Bayley Scales of Infant Development.
EPO: erythropoietin.
GMFM: Gross Motor Function Measure.
MDI: Mental Development Index.
PDI: Psychomotor Development Index.
PMA: postmenstrual age.
Data and analyses
| Outcome or subgroup title | No. of studies | No. of participants | Statistical method | Effect size |
| 1 Use of 1 or more red blood cell transfusions (low and high doses of EPO) Show forest plot | 19 | 1750 | Risk Ratio (M‐H, Fixed, 95% CI) | 0.79 [0.74, 0.85] |
| Analysis 1.1 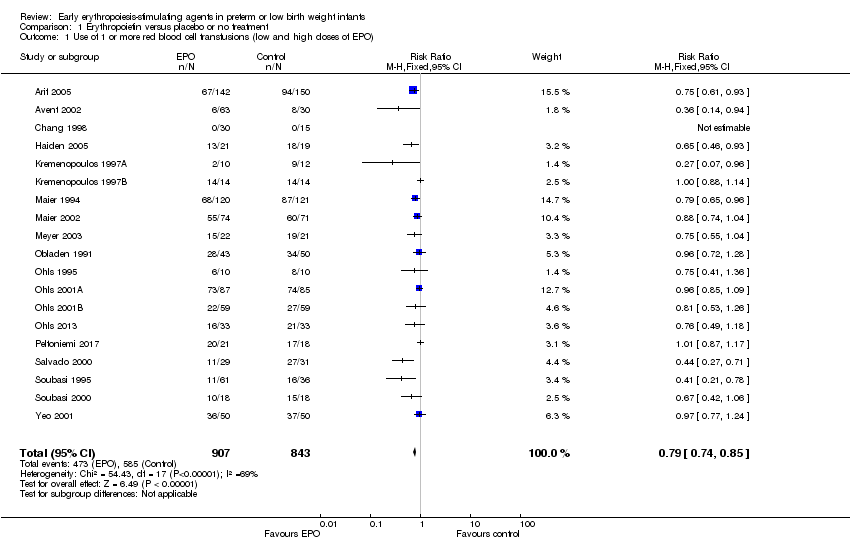 Comparison 1 Erythropoietin versus placebo or no treatment, Outcome 1 Use of 1 or more red blood cell transfusions (low and high doses of EPO). | ||||
| 2 Use of 1 or more blood transfusions (high dose of EPO) Show forest plot | 17 | 1317 | Risk Ratio (M‐H, Fixed, 95% CI) | 0.79 [0.74, 0.86] |
| Analysis 1.2  Comparison 1 Erythropoietin versus placebo or no treatment, Outcome 2 Use of 1 or more blood transfusions (high dose of EPO). | ||||
| 2.1 High‐dose iron | 11 | 863 | Risk Ratio (M‐H, Fixed, 95% CI) | 0.84 [0.77, 0.92] |
| 2.2 Low‐dose iron | 6 | 454 | Risk Ratio (M‐H, Fixed, 95% CI) | 0.71 [0.62, 0.82] |
| 3 Use of 1 or more red blood cell transfusions (low‐dose EPO) Show forest plot | 4 | 484 | Risk Ratio (M‐H, Fixed, 95% CI) | 0.77 [0.65, 0.91] |
| Analysis 1.3 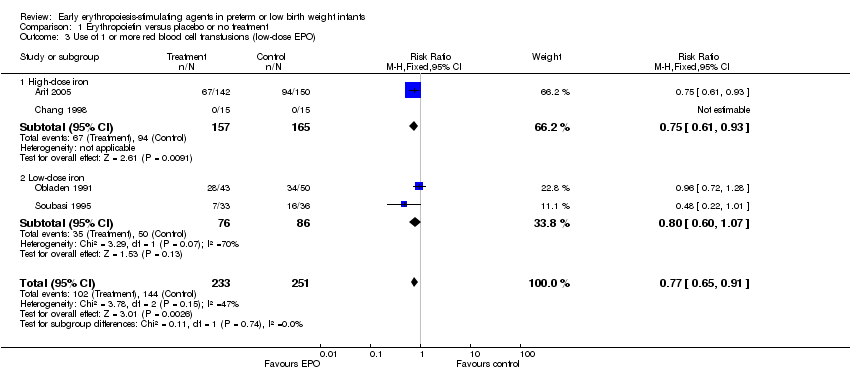 Comparison 1 Erythropoietin versus placebo or no treatment, Outcome 3 Use of 1 or more red blood cell transfusions (low‐dose EPO). | ||||
| 3.1 High‐dose iron | 2 | 322 | Risk Ratio (M‐H, Fixed, 95% CI) | 0.75 [0.61, 0.93] |
| 3.2 Low‐dose iron | 2 | 162 | Risk Ratio (M‐H, Fixed, 95% CI) | 0.80 [0.60, 1.07] |
| 4 Total volume (mL/kg) of blood transfused per infant Show forest plot | 7 | 581 | Mean Difference (IV, Fixed, 95% CI) | ‐6.82 [‐11.52, ‐2.11] |
| Analysis 1.4  Comparison 1 Erythropoietin versus placebo or no treatment, Outcome 4 Total volume (mL/kg) of blood transfused per infant. | ||||
| 5 Number of red blood transfusions per infant Show forest plot | 16 | 1744 | Mean Difference (IV, Fixed, 95% CI) | ‐0.57 [‐0.68, ‐0.45] |
| Analysis 1.5  Comparison 1 Erythropoietin versus placebo or no treatment, Outcome 5 Number of red blood transfusions per infant. | ||||
| 6 Number of donors to whom the infant was exposed Show forest plot | 5 | Mean Difference (IV, Fixed, 95% CI) | Subtotals only | |
| Analysis 1.6  Comparison 1 Erythropoietin versus placebo or no treatment, Outcome 6 Number of donors to whom the infant was exposed. | ||||
| 6.1 Among all randomised infants | 3 | 254 | Mean Difference (IV, Fixed, 95% CI) | ‐0.54 [‐0.89, ‐0.20] |
| 6.2 Among infants who were transfused | 2 | 290 | Mean Difference (IV, Fixed, 95% CI) | 0.05 [‐0.33, 0.42] |
| 7 Mortality during initial hospital stay (all causes of mortality) Show forest plot | 20 | 2212 | Risk Ratio (M‐H, Fixed, 95% CI) | 0.89 [0.68, 1.16] |
| Analysis 1.7 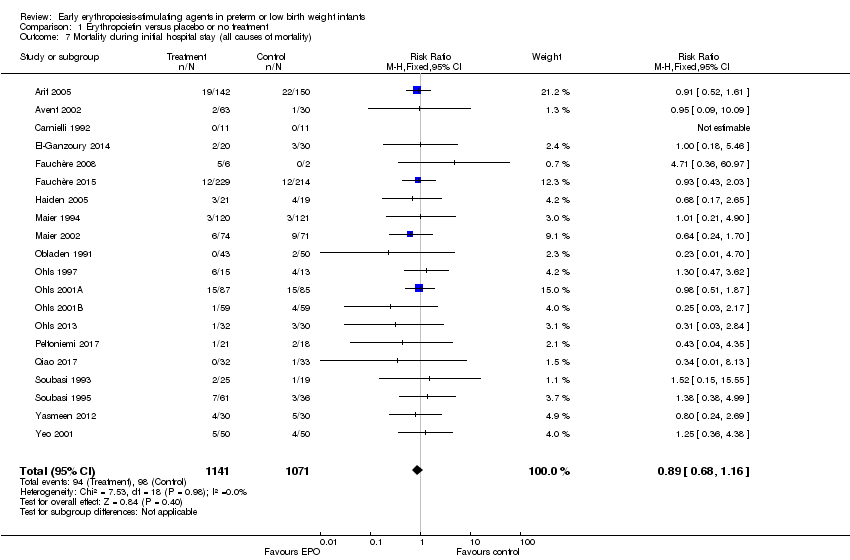 Comparison 1 Erythropoietin versus placebo or no treatment, Outcome 7 Mortality during initial hospital stay (all causes of mortality). | ||||
| 8 Retinopathy of prematurity (all stages or stage not reported) Show forest plot | 11 | 2185 | Risk Ratio (M‐H, Fixed, 95% CI) | 0.92 [0.79, 1.08] |
| Analysis 1.8 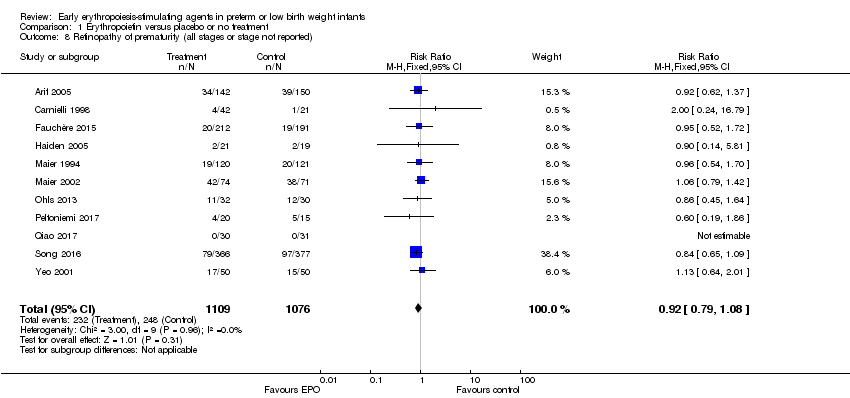 Comparison 1 Erythropoietin versus placebo or no treatment, Outcome 8 Retinopathy of prematurity (all stages or stage not reported). | ||||
| 9 Retinopathy of prematurity (stage ≥ 3) Show forest plot | 8 | 1283 | Risk Ratio (M‐H, Fixed, 95% CI) | 1.24 [0.81, 1.90] |
| Analysis 1.9  Comparison 1 Erythropoietin versus placebo or no treatment, Outcome 9 Retinopathy of prematurity (stage ≥ 3). | ||||
| 10 Proven sepsis Show forest plot | 12 | 2180 | Risk Ratio (M‐H, Fixed, 95% CI) | 0.87 [0.74, 1.02] |
| Analysis 1.10  Comparison 1 Erythropoietin versus placebo or no treatment, Outcome 10 Proven sepsis. | ||||
| 11 Necrotising enterocolitis (stage not reported) Show forest plot | 15 | 2639 | Risk Ratio (M‐H, Fixed, 95% CI) | 0.69 [0.52, 0.91] |
| Analysis 1.11 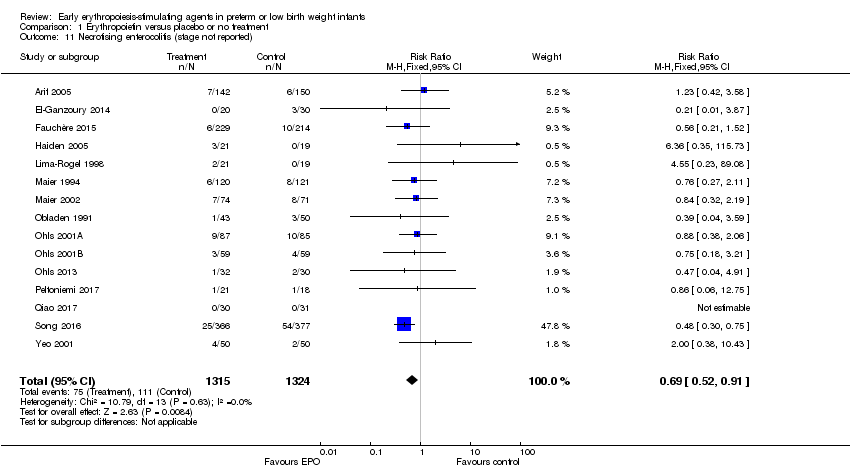 Comparison 1 Erythropoietin versus placebo or no treatment, Outcome 11 Necrotising enterocolitis (stage not reported). | ||||
| 12 Intraventricular haemorrhage (all grades) Show forest plot | 10 | 1226 | Risk Ratio (M‐H, Fixed, 95% CI) | 0.98 [0.76, 1.26] |
| Analysis 1.12  Comparison 1 Erythropoietin versus placebo or no treatment, Outcome 12 Intraventricular haemorrhage (all grades). | ||||
| 13 Intraventricular haemorrhage (grades III and IV) Show forest plot | 8 | 1460 | Risk Ratio (M‐H, Fixed, 95% CI) | 0.60 [0.43, 0.85] |
| Analysis 1.13  Comparison 1 Erythropoietin versus placebo or no treatment, Outcome 13 Intraventricular haemorrhage (grades III and IV). | ||||
| 14 Periventricular leukomalacia Show forest plot | 6 | 1469 | Risk Ratio (M‐H, Fixed, 95% CI) | 0.66 [0.48, 0.92] |
| Analysis 1.14  Comparison 1 Erythropoietin versus placebo or no treatment, Outcome 14 Periventricular leukomalacia. | ||||
| 15 Length of hospital stay (days) Show forest plot | 8 | 970 | Mean Difference (IV, Fixed, 95% CI) | ‐3.20 [‐5.34, ‐1.06] |
| Analysis 1.15 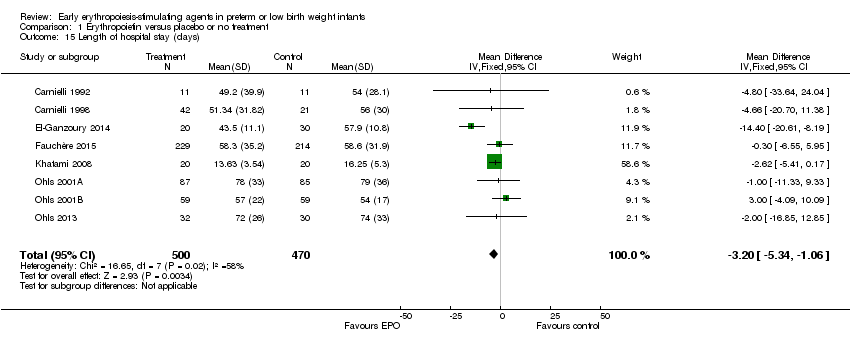 Comparison 1 Erythropoietin versus placebo or no treatment, Outcome 15 Length of hospital stay (days). | ||||
| 16 Bronchopulmonary dysplasia Show forest plot | 13 | Risk Ratio (M‐H, Fixed, 95% CI) | Subtotals only | |
| Analysis 1.16  Comparison 1 Erythropoietin versus placebo or no treatment, Outcome 16 Bronchopulmonary dysplasia. | ||||
| 16.1 Supplemental oxygen at 28 days of age | 2 | 136 | Risk Ratio (M‐H, Fixed, 95% CI) | 0.86 [0.50, 1.47] |
| 16.2 Supplemental oxygen at 36 weeks | 7 | 1719 | Risk Ratio (M‐H, Fixed, 95% CI) | 0.95 [0.81, 1.11] |
| 16.3 Age at diagnosis not stated | 5 | 528 | Risk Ratio (M‐H, Fixed, 95% CI) | 0.98 [0.61, 1.56] |
| 17 Neutropenia Show forest plot | 10 | 966 | Risk Ratio (M‐H, Fixed, 95% CI) | 0.81 [0.53, 1.24] |
| Analysis 1.17  Comparison 1 Erythropoietin versus placebo or no treatment, Outcome 17 Neutropenia. | ||||
| 18 Hypertension Show forest plot | 6 | 706 | Risk Ratio (M‐H, Fixed, 95% CI) | 0.97 [0.14, 6.69] |
| Analysis 1.18  Comparison 1 Erythropoietin versus placebo or no treatment, Outcome 18 Hypertension. | ||||
| 19 Hemangioma Show forest plot | 1 | 443 | Risk Ratio (M‐H, Fixed, 95% CI) | 1.33 [0.79, 2.26] |
| Analysis 1.19  Comparison 1 Erythropoietin versus placebo or no treatment, Outcome 19 Hemangioma. | ||||
| 20 Neonatal Behavioral Neurological Assessment at 40 weeks' PMA Show forest plot | 1 | 44 | Mean Difference (IV, Fixed, 95% CI) | 1.80 [1.26, 2.34] |
| Analysis 1.20  Comparison 1 Erythropoietin versus placebo or no treatment, Outcome 20 Neonatal Behavioral Neurological Assessment at 40 weeks' PMA. | ||||
| 21 Infants with white matter injury at term‐corrected PMA Show forest plot | 1 | 165 | Risk Ratio (M‐H, Fixed, 95% CI) | 0.61 [0.37, 1.00] |
| Analysis 1.21  Comparison 1 Erythropoietin versus placebo or no treatment, Outcome 21 Infants with white matter injury at term‐corrected PMA. | ||||
| 22 Infants with white matter signal abnormality at term‐corrected PMA Show forest plot | 1 | 165 | Risk Ratio (M‐H, Fixed, 95% CI) | 0.23 [0.05, 1.01] |
| Analysis 1.22 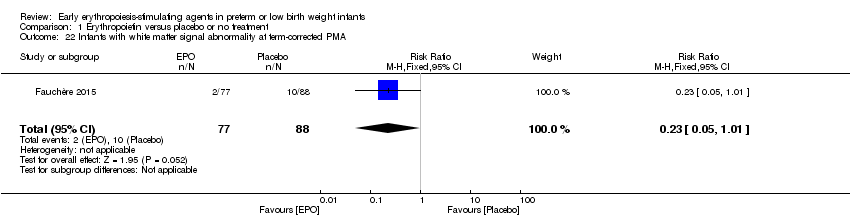 Comparison 1 Erythropoietin versus placebo or no treatment, Outcome 22 Infants with white matter signal abnormality at term‐corrected PMA. | ||||
| 23 Infants with periventricular white matter loss at term‐corrected PMA Show forest plot | 1 | 165 | Risk Ratio (M‐H, Fixed, 95% CI) | 0.55 [0.32, 0.97] |
| Analysis 1.23  Comparison 1 Erythropoietin versus placebo or no treatment, Outcome 23 Infants with periventricular white matter loss at term‐corrected PMA. | ||||
| 24 Infants with grey matter injury at term‐corrected PMA Show forest plot | 1 | 165 | Risk Ratio (M‐H, Fixed, 95% CI) | 0.34 [0.13, 0.87] |
| Analysis 1.24  Comparison 1 Erythropoietin versus placebo or no treatment, Outcome 24 Infants with grey matter injury at term‐corrected PMA. | ||||
| 25 Survivors at discharge from hospital without severe IVH, PVL, ROP Show forest plot | 1 | 443 | Risk Ratio (M‐H, Fixed, 95% CI) | 1.00 [0.93, 1.08] |
| Analysis 1.25  Comparison 1 Erythropoietin versus placebo or no treatment, Outcome 25 Survivors at discharge from hospital without severe IVH, PVL, ROP. | ||||
| 26 Bayley‐II MDI < 70 at 18 to 24 months' corrected age Show forest plot | 4 | 1071 | Risk Ratio (M‐H, Fixed, 95% CI) | 0.55 [0.39, 0.77] |
| Analysis 1.26  Comparison 1 Erythropoietin versus placebo or no treatment, Outcome 26 Bayley‐II MDI < 70 at 18 to 24 months' corrected age. | ||||
| 27 Bayley‐II PDI < 70 at 18 to 22 months' corrected age (in children examined) Show forest plot | 3 | 458 | Risk Ratio (M‐H, Fixed, 95% CI) | 1.43 [0.88, 2.33] |
| Analysis 1.27 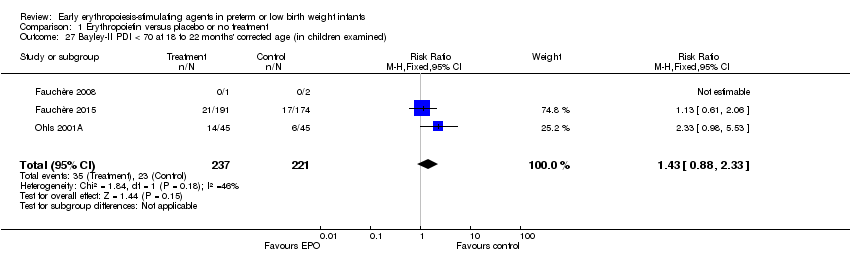 Comparison 1 Erythropoietin versus placebo or no treatment, Outcome 27 Bayley‐II PDI < 70 at 18 to 22 months' corrected age (in children examined). | ||||
| 28 Bayley‐II MDI at 18 to 24 months Show forest plot | 3 | 981 | Mean Difference (IV, Fixed, 95% CI) | 8.22 [6.52, 9.92] |
| Analysis 1.28 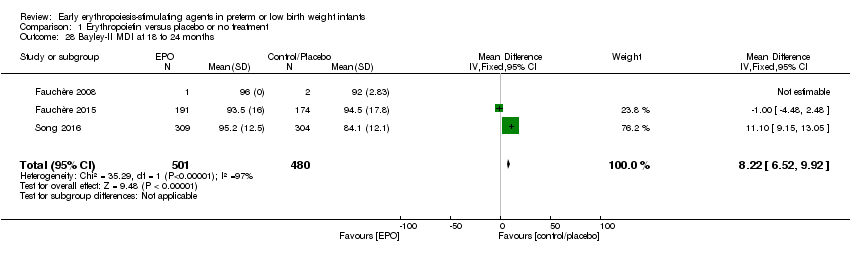 Comparison 1 Erythropoietin versus placebo or no treatment, Outcome 28 Bayley‐II MDI at 18 to 24 months. | ||||
| 29 Bayley‐II PDI at 18 to 24 months Show forest plot | 1 | 3 | Mean Difference (IV, Fixed, 95% CI) | 0.0 [0.0, 0.0] |
| Analysis 1.29  Comparison 1 Erythropoietin versus placebo or no treatment, Outcome 29 Bayley‐II PDI at 18 to 24 months. | ||||
| 30 Cerebral palsy at 18 to 24 months' corrected age Show forest plot | 6 | 1172 | Risk Ratio (M‐H, Fixed, 95% CI) | 0.72 [0.46, 1.13] |
| Analysis 1.30  Comparison 1 Erythropoietin versus placebo or no treatment, Outcome 30 Cerebral palsy at 18 to 24 months' corrected age. | ||||
| 31 Any neurodevelopmental impairment at 18 to 22 months' corrected age (in children examined) Show forest plot | 4 | 1130 | Risk Ratio (M‐H, Fixed, 95% CI) | 0.62 [0.48, 0.80] |
| Analysis 1.31  Comparison 1 Erythropoietin versus placebo or no treatment, Outcome 31 Any neurodevelopmental impairment at 18 to 22 months' corrected age (in children examined). | ||||
| 32 Visual impairment at 18 to 24 months' corrected age Show forest plot | 5 | 1132 | Risk Ratio (M‐H, Fixed, 95% CI) | 0.80 [0.26, 2.49] |
| Analysis 1.32  Comparison 1 Erythropoietin versus placebo or no treatment, Outcome 32 Visual impairment at 18 to 24 months' corrected age. | ||||
| 33 Hearing impairment at 18 to 24 months' corrected age Show forest plot | 5 | 1132 | Risk Ratio (M‐H, Fixed, 95% CI) | 0.41 [0.13, 1.23] |
| Analysis 1.33 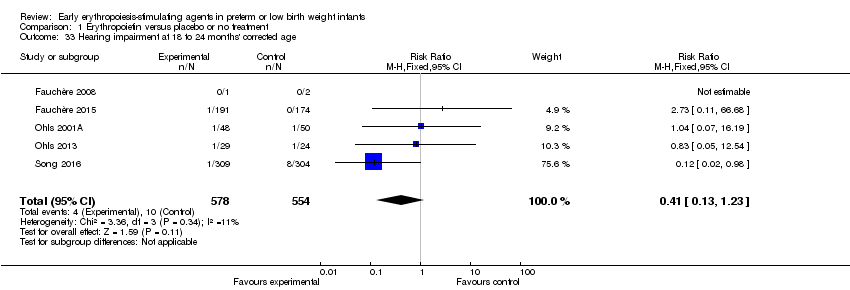 Comparison 1 Erythropoietin versus placebo or no treatment, Outcome 33 Hearing impairment at 18 to 24 months' corrected age. | ||||
| 34 BSID‐III composite cognitive scores at 18 to 22 months Show forest plot | 1 | 53 | Mean Difference (IV, Fixed, 95% CI) | 9.20 [1.70, 16.70] |
| Analysis 1.34  Comparison 1 Erythropoietin versus placebo or no treatment, Outcome 34 BSID‐III composite cognitive scores at 18 to 22 months. | ||||
| 35 BSID‐III composite language score Show forest plot | 1 | 53 | Mean Difference (IV, Fixed, 95% CI) | 6.30 [‐2.20, 14.80] |
| Analysis 1.35  Comparison 1 Erythropoietin versus placebo or no treatment, Outcome 35 BSID‐III composite language score. | ||||
| 36 BSID‐III composite social/emotional score Show forest plot | 1 | 53 | Mean Difference (IV, Fixed, 95% CI) | 2.90 [‐7.84, 13.64] |
| Analysis 1.36  Comparison 1 Erythropoietin versus placebo or no treatment, Outcome 36 BSID‐III composite social/emotional score. | ||||
| 37 BSID‐III object performance (OP) score Show forest plot | 1 | 53 | Mean Difference (IV, Fixed, 95% CI) | 0.20 [‐0.32, 0.72] |
| Analysis 1.37  Comparison 1 Erythropoietin versus placebo or no treatment, Outcome 37 BSID‐III object performance (OP) score. | ||||
| 38 WPPSI‐III FSIQ at 3.5 to 4 years of age Show forest plot | 1 | 38 | Mean Difference (IV, Fixed, 95% CI) | 10.42 [‐1.96, 22.80] |
| Analysis 1.38  Comparison 1 Erythropoietin versus placebo or no treatment, Outcome 38 WPPSI‐III FSIQ at 3.5 to 4 years of age. | ||||
| 39 WPPSI‐III VIQ at 3.5 to 4 years of age Show forest plot | 1 | 38 | Mean Difference (IV, Fixed, 95% CI) | 10.64 [‐0.73, 22.01] |
| Analysis 1.39  Comparison 1 Erythropoietin versus placebo or no treatment, Outcome 39 WPPSI‐III VIQ at 3.5 to 4 years of age. | ||||
| 40 WPPSI‐III PIQ at 3.5 to 4 years of age Show forest plot | 1 | 38 | Mean Difference (IV, Fixed, 95% CI) | 10.12 [‐2.67, 22.91] |
| Analysis 1.40  Comparison 1 Erythropoietin versus placebo or no treatment, Outcome 40 WPPSI‐III PIQ at 3.5 to 4 years of age. | ||||
| 41 WPPSI‐III GLC at 3.5 to 4 years of age Show forest plot | 1 | 38 | Mean Difference (IV, Fixed, 95% CI) | 3.12 [‐8.37, 14.61] |
| Analysis 1.41  Comparison 1 Erythropoietin versus placebo or no treatment, Outcome 41 WPPSI‐III GLC at 3.5 to 4 years of age. | ||||
| 42 Executive function at 3.5 to 4 years of age Show forest plot | 1 | 38 | Mean Difference (IV, Fixed, 95% CI) | 6.82 [‐1.97, 15.61] |
| Analysis 1.42  Comparison 1 Erythropoietin versus placebo or no treatment, Outcome 42 Executive function at 3.5 to 4 years of age. | ||||
| 43 Working memory at 3.5 to 4 years of age Show forest plot | 1 | 38 | Mean Difference (IV, Fixed, 95% CI) | 6.74 [‐4.56, 18.04] |
| Analysis 1.43  Comparison 1 Erythropoietin versus placebo or no treatment, Outcome 43 Working memory at 3.5 to 4 years of age. | ||||
| 44 Inhibition at 3.5 to 4 years of age Show forest plot | 1 | 38 | Mean Difference (IV, Fixed, 95% CI) | 6.86 [‐4.56, 18.28] |
| Analysis 1.44  Comparison 1 Erythropoietin versus placebo or no treatment, Outcome 44 Inhibition at 3.5 to 4 years of age. | ||||
| 45 Griffiths Developmental Scale at 2 years of age Show forest plot | 1 | 19 | Mean Difference (IV, Fixed, 95% CI) | 3.0 [‐3.75, 9.75] |
| Analysis 1.45  Comparison 1 Erythropoietin versus placebo or no treatment, Outcome 45 Griffiths Developmental Scale at 2 years of age. | ||||
| 46 Survival without major neurological or neurodevelopmental disorders at 2 years of age Show forest plot | 2 | 404 | Risk Ratio (M‐H, Fixed, 95% CI) | 0.99 [0.91, 1.08] |
| Analysis 1.46  Comparison 1 Erythropoietin versus placebo or no treatment, Outcome 46 Survival without major neurological or neurodevelopmental disorders at 2 years of age. | ||||
| 47 Death or moderate/severe neurological disability at 18 to 24 months Show forest plot | 1 | 668 | Risk Ratio (M‐H, Fixed, 95% CI) | 0.48 [0.35, 0.67] |
| Analysis 1.47  Comparison 1 Erythropoietin versus placebo or no treatment, Outcome 47 Death or moderate/severe neurological disability at 18 to 24 months. | ||||
| 48 Moderate/severe neurological disability at 18 to 24 months Show forest plot | 1 | 613 | Risk Ratio (M‐H, Fixed, 95% CI) | 0.38 [0.24, 0.60] |
| Analysis 1.48 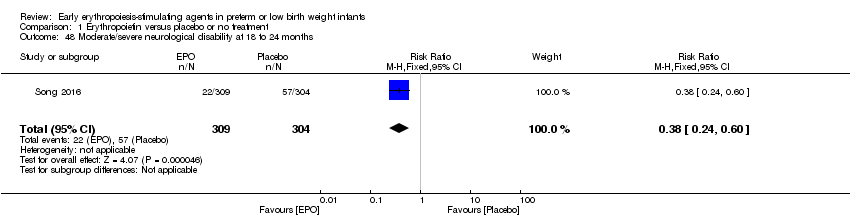 Comparison 1 Erythropoietin versus placebo or no treatment, Outcome 48 Moderate/severe neurological disability at 18 to 24 months. | ||||
| Outcome or subgroup title | No. of studies | No. of participants | Statistical method | Effect size |
| 1 Use of 1 or more red blood cell transfusions Show forest plot | 1 | 66 | Risk Ratio (M‐H, Fixed, 95% CI) | 0.62 [0.38, 1.02] |
| Analysis 2.1  Comparison 2 Darbepoetin alfa versus placebo or no treatment, Outcome 1 Use of 1 or more red blood cell transfusions. | ||||
| 2 Total volume (mL/kg) of blood transfused per infant (all infants) Show forest plot | 1 | 66 | Mean Difference (IV, Fixed, 95% CI) | ‐21.0 [‐50.72, 8.72] |
| Analysis 2.2 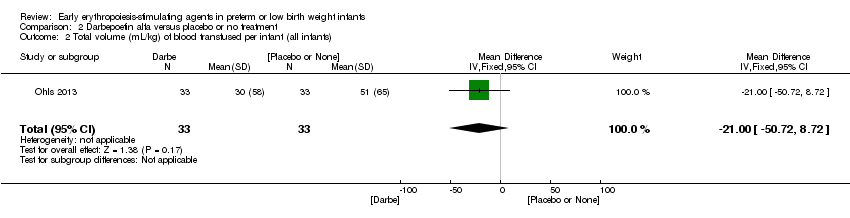 Comparison 2 Darbepoetin alfa versus placebo or no treatment, Outcome 2 Total volume (mL/kg) of blood transfused per infant (all infants). | ||||
| 3 Total volume (mL/kg) of blood transfused in transfused infants only Show forest plot | 1 | 34 | Mean Difference (IV, Fixed, 95% CI) | ‐5.10 [‐53.71, 43.51] |
| Analysis 2.3 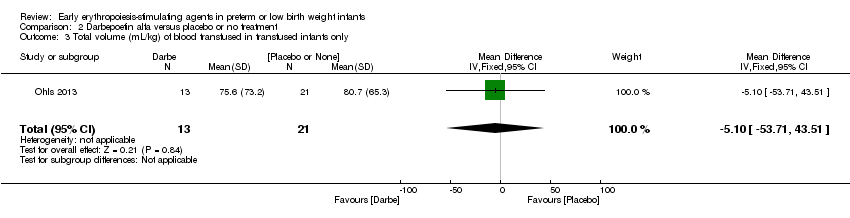 Comparison 2 Darbepoetin alfa versus placebo or no treatment, Outcome 3 Total volume (mL/kg) of blood transfused in transfused infants only. | ||||
| 4 Number of blood transfusions per infant Show forest plot | 1 | 66 | Mean Difference (IV, Fixed, 95% CI) | ‐1.2 [‐2.48, 0.08] |
| Analysis 2.4 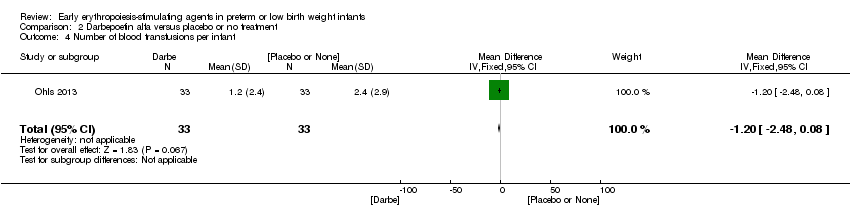 Comparison 2 Darbepoetin alfa versus placebo or no treatment, Outcome 4 Number of blood transfusions per infant. | ||||
| 5 Number of donors the infant was exposed to Show forest plot | 1 | 66 | Mean Difference (IV, Fixed, 95% CI) | ‐0.5 [‐1.10, 0.10] |
| Analysis 2.5  Comparison 2 Darbepoetin alfa versus placebo or no treatment, Outcome 5 Number of donors the infant was exposed to. | ||||
| 6 Mortality during initial hospital stay (all causes of mortality) Show forest plot | 1 | 66 | Risk Ratio (M‐H, Fixed, 95% CI) | 0.67 [0.12, 3.73] |
| Analysis 2.6  Comparison 2 Darbepoetin alfa versus placebo or no treatment, Outcome 6 Mortality during initial hospital stay (all causes of mortality). | ||||
| 7 Retinopathy of prematurity (all stages) Show forest plot | 1 | 62 | Risk Ratio (M‐H, Fixed, 95% CI) | 0.94 [0.50, 1.75] |
| Analysis 2.7 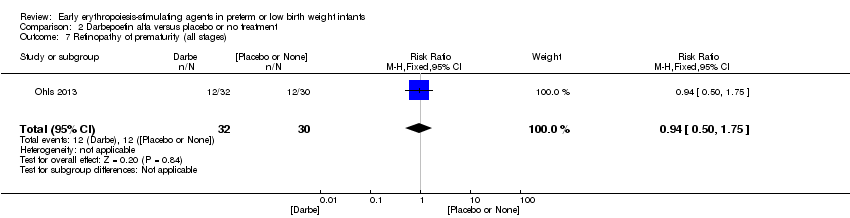 Comparison 2 Darbepoetin alfa versus placebo or no treatment, Outcome 7 Retinopathy of prematurity (all stages). | ||||
| 8 Retinopathy of prematurity (stage ≥ 3) Show forest plot | 1 | 62 | Risk Ratio (M‐H, Fixed, 95% CI) | 0.47 [0.09, 2.37] |
| Analysis 2.8 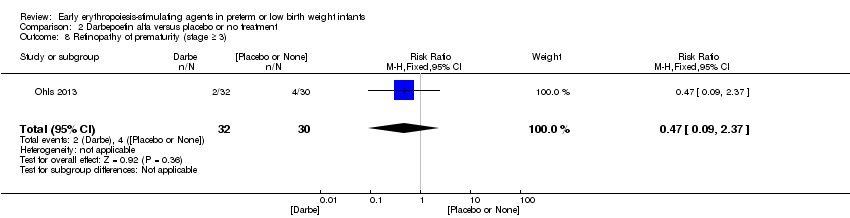 Comparison 2 Darbepoetin alfa versus placebo or no treatment, Outcome 8 Retinopathy of prematurity (stage ≥ 3). | ||||
| 9 Necrotising enterocolitis (> stage 2) Show forest plot | 1 | 62 | Risk Ratio (M‐H, Fixed, 95% CI) | 0.94 [0.14, 6.24] |
| Analysis 2.9  Comparison 2 Darbepoetin alfa versus placebo or no treatment, Outcome 9 Necrotising enterocolitis (> stage 2). | ||||
| 10 Proven sepsis Show forest plot | 1 | 62 | Risk Ratio (M‐H, Fixed, 95% CI) | 1.13 [0.38, 3.30] |
| Analysis 2.10 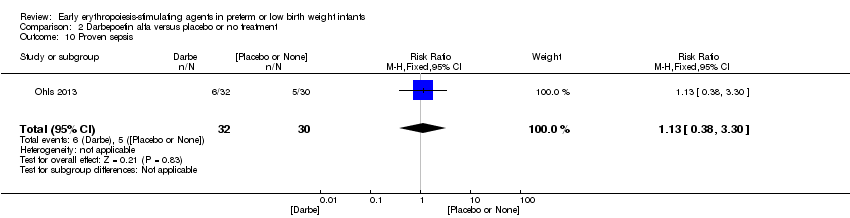 Comparison 2 Darbepoetin alfa versus placebo or no treatment, Outcome 10 Proven sepsis. | ||||
| 11 Intraventricular haemorrhage (grades III and IV) Show forest plot | 1 | 62 | Risk Ratio (M‐H, Fixed, 95% CI) | 0.40 [0.11, 1.41] |
| Analysis 2.11  Comparison 2 Darbepoetin alfa versus placebo or no treatment, Outcome 11 Intraventricular haemorrhage (grades III and IV). | ||||
| 12 Periventricular leukomalacia Show forest plot | 1 | 62 | Risk Ratio (M‐H, Fixed, 95% CI) | 0.0 [0.0, 0.0] |
| Analysis 2.12 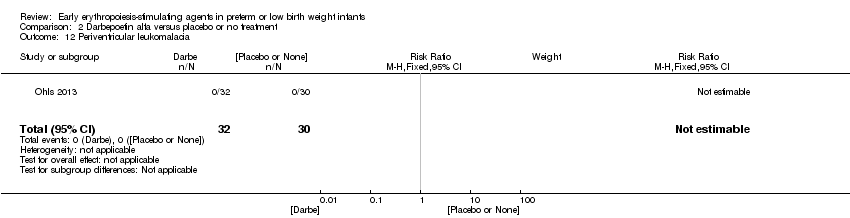 Comparison 2 Darbepoetin alfa versus placebo or no treatment, Outcome 12 Periventricular leukomalacia. | ||||
| 13 Bronchopulmonary dysplasia (supplemental oxygen at 36 weeks' PMA) Show forest plot | 1 | 62 | Risk Ratio (M‐H, Fixed, 95% CI) | 1.03 [0.73, 1.46] |
| Analysis 2.13 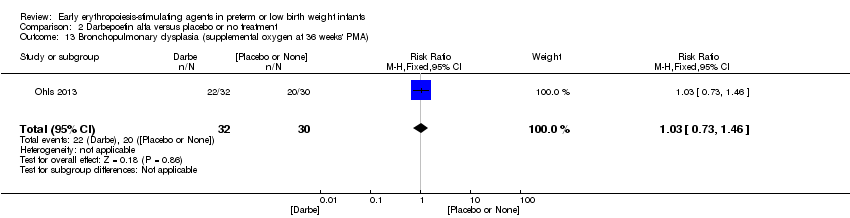 Comparison 2 Darbepoetin alfa versus placebo or no treatment, Outcome 13 Bronchopulmonary dysplasia (supplemental oxygen at 36 weeks' PMA). | ||||
| 14 Length of hospital stay (days) Show forest plot | 1 | 62 | Mean Difference (IV, Fixed, 95% CI) | 2.0 [‐17.84, 21.84] |
| Analysis 2.14 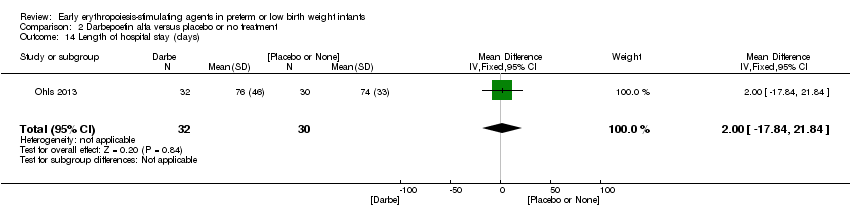 Comparison 2 Darbepoetin alfa versus placebo or no treatment, Outcome 14 Length of hospital stay (days). | ||||
| 15 Neutropenia Show forest plot | 1 | 62 | Risk Ratio (M‐H, Fixed, 95% CI) | 0.0 [0.0, 0.0] |
| Analysis 2.15 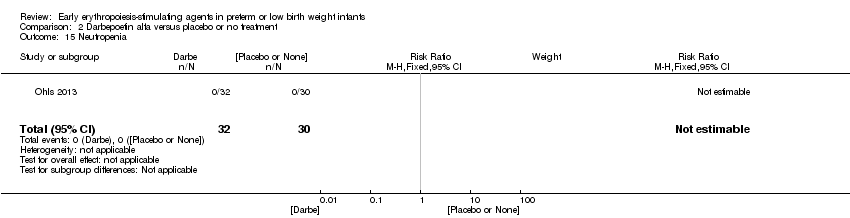 Comparison 2 Darbepoetin alfa versus placebo or no treatment, Outcome 15 Neutropenia. | ||||
| 16 Hypertension Show forest plot | 1 | 62 | Risk Ratio (M‐H, Fixed, 95% CI) | 1.88 [0.18, 19.63] |
| Analysis 2.16  Comparison 2 Darbepoetin alfa versus placebo or no treatment, Outcome 16 Hypertension. | ||||
| 17 Cerebral palsy at 18 to 22 months Show forest plot | 1 | 51 | Risk Ratio (M‐H, Fixed, 95% CI) | 0.08 [0.00, 1.40] |
| Analysis 2.17  Comparison 2 Darbepoetin alfa versus placebo or no treatment, Outcome 17 Cerebral palsy at 18 to 22 months. | ||||
| 18 NDI (with CP, visual defect, hearing defect, or cognitive score < 85) at 18 to 22 months Show forest plot | 1 | 51 | Risk Ratio (M‐H, Fixed, 95% CI) | 0.27 [0.08, 0.86] |
| Analysis 2.18 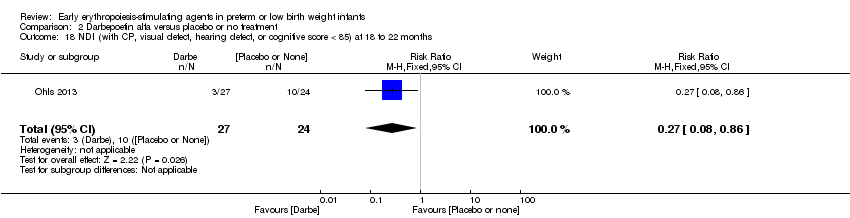 Comparison 2 Darbepoetin alfa versus placebo or no treatment, Outcome 18 NDI (with CP, visual defect, hearing defect, or cognitive score < 85) at 18 to 22 months. | ||||
| 19 BSID‐III composite cognitive score at 18 to 22 months Show forest plot | 1 | 51 | Mean Difference (IV, Fixed, 95% CI) | 7.5 [1.44, 13.56] |
| Analysis 2.19  Comparison 2 Darbepoetin alfa versus placebo or no treatment, Outcome 19 BSID‐III composite cognitive score at 18 to 22 months. | ||||
| 20 BSID‐III composite language score at 18 to 22 months Show forest plot | 1 | 51 | Mean Difference (IV, Fixed, 95% CI) | 8.80 [1.57, 16.03] |
| Analysis 2.20 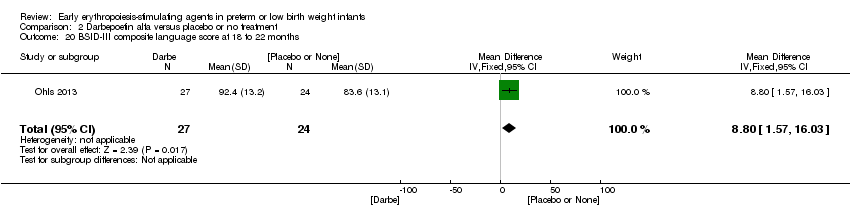 Comparison 2 Darbepoetin alfa versus placebo or no treatment, Outcome 20 BSID‐III composite language score at 18 to 22 months. | ||||
| 21 Bayley‐III social/emotional score at 18 to 22 months Show forest plot | 1 | 51 | Mean Difference (IV, Fixed, 95% CI) | 6.80 [‐3.82, 17.42] |
| Analysis 2.21  Comparison 2 Darbepoetin alfa versus placebo or no treatment, Outcome 21 Bayley‐III social/emotional score at 18 to 22 months. | ||||
| 22 OP score at 18 to 22 months Show forest plot | 1 | 51 | Mean Difference (IV, Fixed, 95% CI) | 0.60 [0.17, 1.03] |
| Analysis 2.22  Comparison 2 Darbepoetin alfa versus placebo or no treatment, Outcome 22 OP score at 18 to 22 months. | ||||
| 23 WPPSI‐III FSIQ at 3.5 to 4 years of age Show forest plot | 1 | 29 | Mean Difference (IV, Fixed, 95% CI) | 15.27 [2.60, 27.94] |
| Analysis 2.23  Comparison 2 Darbepoetin alfa versus placebo or no treatment, Outcome 23 WPPSI‐III FSIQ at 3.5 to 4 years of age. | ||||
| 24 WPPSI‐III VIQ at 3.5 to 4 years of age Show forest plot | 1 | 29 | Mean Difference (IV, Fixed, 95% CI) | 9.17 [‐2.86, 21.20] |
| Analysis 2.24  Comparison 2 Darbepoetin alfa versus placebo or no treatment, Outcome 24 WPPSI‐III VIQ at 3.5 to 4 years of age. | ||||
| 25 WPPSI‐III PIQ at 3.5 to 4 years of age Show forest plot | 1 | 29 | Mean Difference (IV, Fixed, 95% CI) | 14.97 [1.89, 28.05] |
| Analysis 2.25  Comparison 2 Darbepoetin alfa versus placebo or no treatment, Outcome 25 WPPSI‐III PIQ at 3.5 to 4 years of age. | ||||
| 26 WPPSI‐III GLC at 3.5 to 4 years of age Show forest plot | 1 | 29 | Mean Difference (IV, Fixed, 95% CI) | 7.94 [‐4.18, 20.06] |
| Analysis 2.26 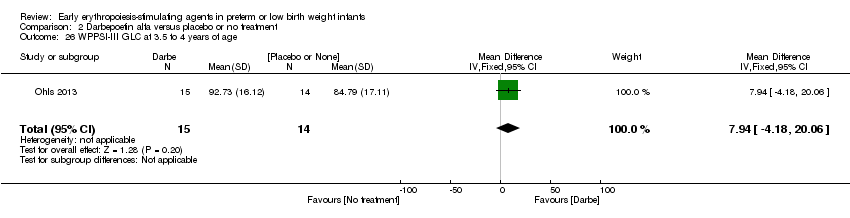 Comparison 2 Darbepoetin alfa versus placebo or no treatment, Outcome 26 WPPSI‐III GLC at 3.5 to 4 years of age. | ||||
| 27 Executive function at 3.5 to 4 years of age Show forest plot | 1 | 29 | Mean Difference (IV, Fixed, 95% CI) | 10.81 [2.83, 18.79] |
| Analysis 2.27  Comparison 2 Darbepoetin alfa versus placebo or no treatment, Outcome 27 Executive function at 3.5 to 4 years of age. | ||||
| 28 Working memory at 3.5 to 4 years of age Show forest plot | 1 | 29 | Mean Difference (IV, Fixed, 95% CI) | 12.77 [2.68, 22.86] |
| Analysis 2.28  Comparison 2 Darbepoetin alfa versus placebo or no treatment, Outcome 28 Working memory at 3.5 to 4 years of age. | ||||
| 29 Inhibition at 3.5 to 4 years of age Show forest plot | 1 | 29 | Mean Difference (IV, Fixed, 95% CI) | 8.77 [‐2.47, 20.01] |
| Analysis 2.29  Comparison 2 Darbepoetin alfa versus placebo or no treatment, Outcome 29 Inhibition at 3.5 to 4 years of age. | ||||
| Outcome or subgroup title | No. of studies | No. of participants | Statistical method | Effect size |
| 1 BSID‐III composite cognitive score at 18 to 22 months Show forest plot | 1 | 80 | Mean Difference (IV, Fixed, 95% CI) | 7.80 [1.65, 13.95] |
| Analysis 3.1 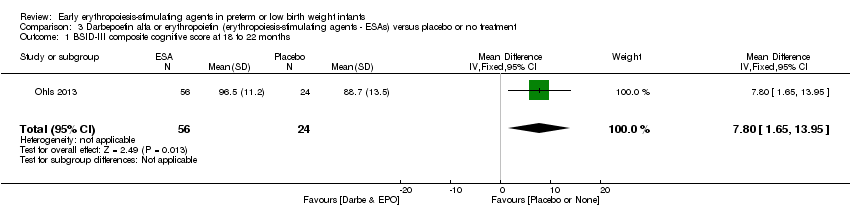 Comparison 3 Darbepoetin alfa or erythropoietin (erythropoiesis‐stimulating agents ‐ ESAs) versus placebo or no treatment, Outcome 1 BSID‐III composite cognitive score at 18 to 22 months. | ||||
| 2 BSID‐III composite language score at 18 to 22 months Show forest plot | 1 | 80 | Mean Difference (IV, Fixed, 95% CI) | 7.10 [0.49, 13.71] |
| Analysis 3.2 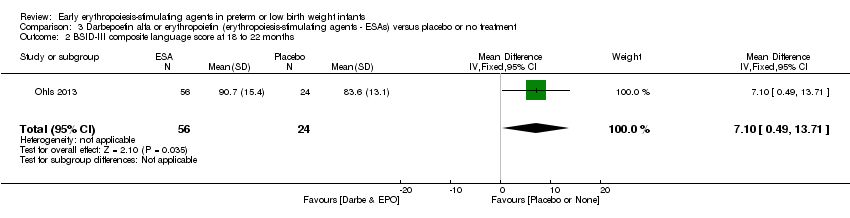 Comparison 3 Darbepoetin alfa or erythropoietin (erythropoiesis‐stimulating agents ‐ ESAs) versus placebo or no treatment, Outcome 2 BSID‐III composite language score at 18 to 22 months. | ||||
| 3 BSID‐III composite social/emotional score at 18 to 22 months Show forest plot | 1 | 80 | Mean Difference (IV, Fixed, 95% CI) | 4.20 [‐5.06, 13.46] |
| Analysis 3.3 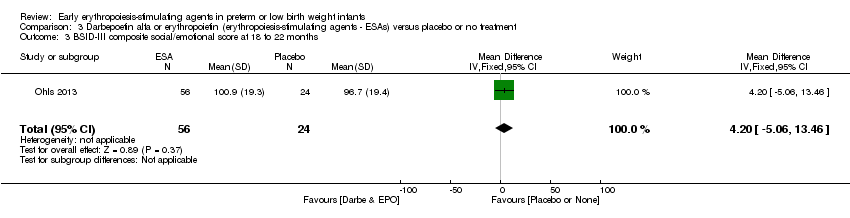 Comparison 3 Darbepoetin alfa or erythropoietin (erythropoiesis‐stimulating agents ‐ ESAs) versus placebo or no treatment, Outcome 3 BSID‐III composite social/emotional score at 18 to 22 months. | ||||
| 4 OP score at 18 to 24 months Show forest plot | 1 | 80 | Mean Difference (IV, Fixed, 95% CI) | 0.40 [‐0.04, 0.84] |
| Analysis 3.4  Comparison 3 Darbepoetin alfa or erythropoietin (erythropoiesis‐stimulating agents ‐ ESAs) versus placebo or no treatment, Outcome 4 OP score at 18 to 24 months. | ||||
| 5 BASC‐2 composite scores at 3.5 to 4 years ‐ adaptive skills Show forest plot | 1 | 49 | Mean Difference (IV, Fixed, 95% CI) | 2.54 [‐3.58, 8.66] |
| Analysis 3.5  Comparison 3 Darbepoetin alfa or erythropoietin (erythropoiesis‐stimulating agents ‐ ESAs) versus placebo or no treatment, Outcome 5 BASC‐2 composite scores at 3.5 to 4 years ‐ adaptive skills. | ||||
| 6 BASC‐2 composite scores at 3.5 to 4 years ‐ behaviour symptoms Show forest plot | 1 | 49 | Mean Difference (IV, Fixed, 95% CI) | ‐8.66 [‐18.01, 0.69] |
| Analysis 3.6 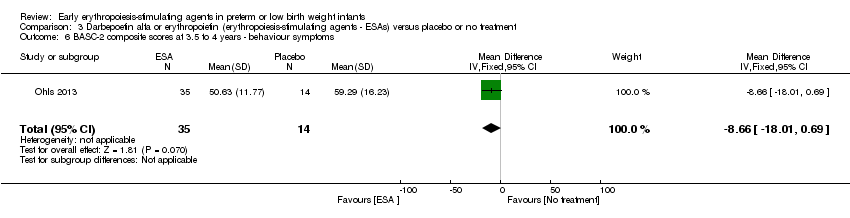 Comparison 3 Darbepoetin alfa or erythropoietin (erythropoiesis‐stimulating agents ‐ ESAs) versus placebo or no treatment, Outcome 6 BASC‐2 composite scores at 3.5 to 4 years ‐ behaviour symptoms. | ||||
| 7 BASC‐2 composite score at 3.5 to 4 years ‐ externalising problems Show forest plot | 1 | 49 | Mean Difference (IV, Fixed, 95% CI) | ‐8.0 [‐15.94, ‐0.06] |
| Analysis 3.7  Comparison 3 Darbepoetin alfa or erythropoietin (erythropoiesis‐stimulating agents ‐ ESAs) versus placebo or no treatment, Outcome 7 BASC‐2 composite score at 3.5 to 4 years ‐ externalising problems. | ||||
| 8 BASC‐2 composite scores at 3.5 to 4 years ‐ internalising problems Show forest plot | 1 | 49 | Mean Difference (IV, Fixed, 95% CI) | ‐2.56 [‐9.25, 4.13] |
| Analysis 3.8  Comparison 3 Darbepoetin alfa or erythropoietin (erythropoiesis‐stimulating agents ‐ ESAs) versus placebo or no treatment, Outcome 8 BASC‐2 composite scores at 3.5 to 4 years ‐ internalising problems. | ||||
| 9 WPPSI‐III FSIQ at 3.5 to 4 years of age Show forest plot | 1 | 53 | Mean Difference (IV, Fixed, 95% CI) | 11.90 [0.76, 23.04] |
| Analysis 3.9  Comparison 3 Darbepoetin alfa or erythropoietin (erythropoiesis‐stimulating agents ‐ ESAs) versus placebo or no treatment, Outcome 9 WPPSI‐III FSIQ at 3.5 to 4 years of age. | ||||
| 10 WPPSI‐III VIQ at 3.5 to 4 years of age Show forest plot | 1 | 53 | Mean Difference (IV, Fixed, 95% CI) | 8.80 [‐1.75, 19.35] |
| Analysis 3.10  Comparison 3 Darbepoetin alfa or erythropoietin (erythropoiesis‐stimulating agents ‐ ESAs) versus placebo or no treatment, Outcome 10 WPPSI‐III VIQ at 3.5 to 4 years of age. | ||||
| 11 WPPSI‐III PIQ at 3.5 to 4 years of age Show forest plot | 1 | 53 | Mean Difference (IV, Fixed, 95% CI) | 13.5 [1.98, 25.02] |
| Analysis 3.11  Comparison 3 Darbepoetin alfa or erythropoietin (erythropoiesis‐stimulating agents ‐ ESAs) versus placebo or no treatment, Outcome 11 WPPSI‐III PIQ at 3.5 to 4 years of age. | ||||
| 12 WPPSI‐III GLC at 3.5 to 4 years of age Show forest plot | 1 | 53 | Mean Difference (IV, Fixed, 95% CI) | 5.13 [‐5.30, 15.56] |
| Analysis 3.12 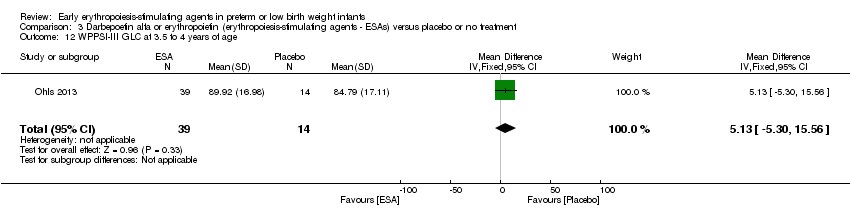 Comparison 3 Darbepoetin alfa or erythropoietin (erythropoiesis‐stimulating agents ‐ ESAs) versus placebo or no treatment, Outcome 12 WPPSI‐III GLC at 3.5 to 4 years of age. | ||||
| 13 Executive function at 3.5 to 4 years Show forest plot | 1 | 53 | Mean Difference (IV, Fixed, 95% CI) | 8.36 [0.51, 16.21] |
| Analysis 3.13 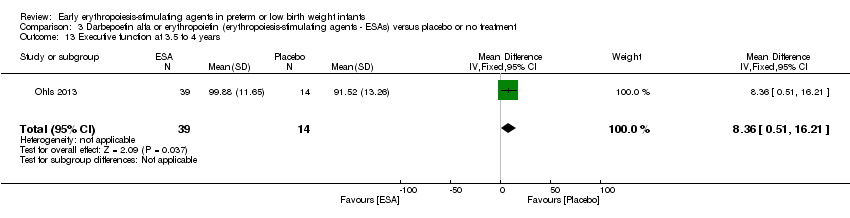 Comparison 3 Darbepoetin alfa or erythropoietin (erythropoiesis‐stimulating agents ‐ ESAs) versus placebo or no treatment, Outcome 13 Executive function at 3.5 to 4 years. | ||||
| 14 Working memory at 3.5 to 4 years Show forest plot | 1 | 53 | Mean Difference (IV, Fixed, 95% CI) | 9.06 [‐1.06, 19.18] |
| Analysis 3.14  Comparison 3 Darbepoetin alfa or erythropoietin (erythropoiesis‐stimulating agents ‐ ESAs) versus placebo or no treatment, Outcome 14 Working memory at 3.5 to 4 years. | ||||
| 15 Inhibition at 3.5 to 4 years Show forest plot | 1 | 53 | Mean Difference (IV, Fixed, 95% CI) | 7.60 [‐2.79, 17.99] |
| Analysis 3.15 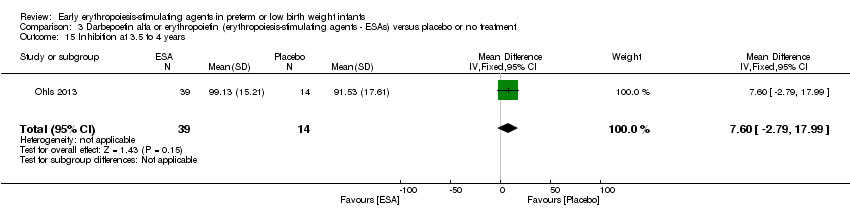 Comparison 3 Darbepoetin alfa or erythropoietin (erythropoiesis‐stimulating agents ‐ ESAs) versus placebo or no treatment, Outcome 15 Inhibition at 3.5 to 4 years. | ||||
| Outcome or subgroup title | No. of studies | No. of participants | Statistical method | Effect size |
| 1 Time to achieve full enteral feeding (days) Show forest plot | 1 | 50 | Mean Difference (IV, Fixed, 95% CI) | ‐2.90 [‐5.77, ‐0.03] |
| Analysis 4.1  Comparison 4 Erythropoietin versus placebo to improve feeding intolerance, Outcome 1 Time to achieve full enteral feeding (days). | ||||

Study flow diagram: review update.

Risk of bias graph: review authors' judgements about each risk of bias item presented as percentages across all included studies.
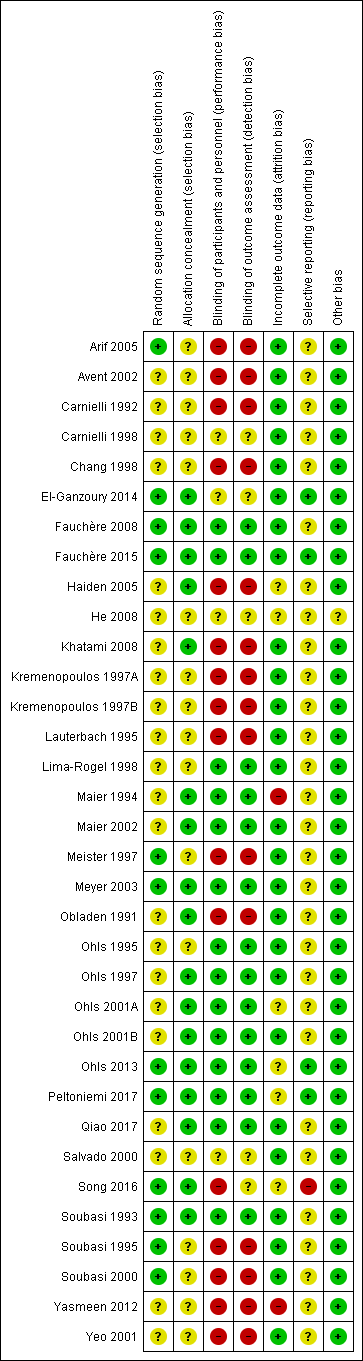
Risk of bias summary: review authors' judgements about each risk of bias item for each included study.
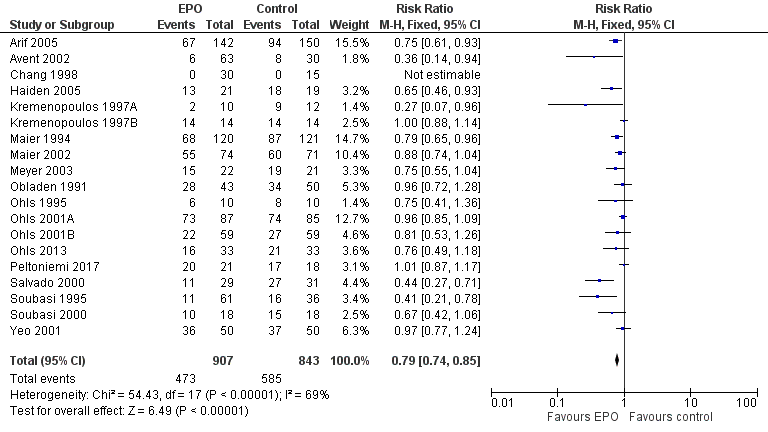
Forest plot of comparison: 1 Erythropoietin versus placebo or no treatment, outcome: 1.1 Use of 1 or more red blood cell transfusions (low and high doses of EPO).
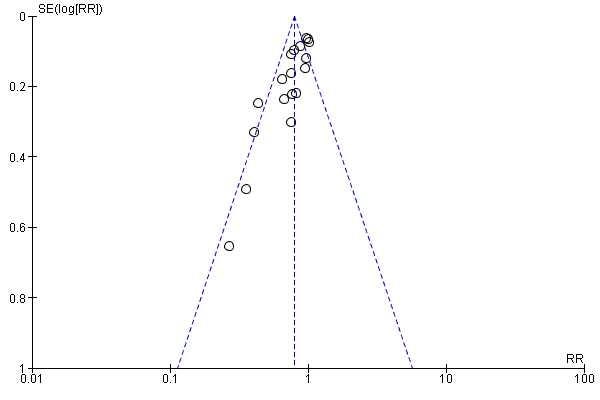
Funnel plot of comparison: 1 Erythropoietin versus placebo or no treatment, outcome: 1.1 Use of 1 or more red blood cell transfusions (low and high doses of EPO).

Comparison 1 Erythropoietin versus placebo or no treatment, Outcome 1 Use of 1 or more red blood cell transfusions (low and high doses of EPO).

Comparison 1 Erythropoietin versus placebo or no treatment, Outcome 2 Use of 1 or more blood transfusions (high dose of EPO).

Comparison 1 Erythropoietin versus placebo or no treatment, Outcome 3 Use of 1 or more red blood cell transfusions (low‐dose EPO).
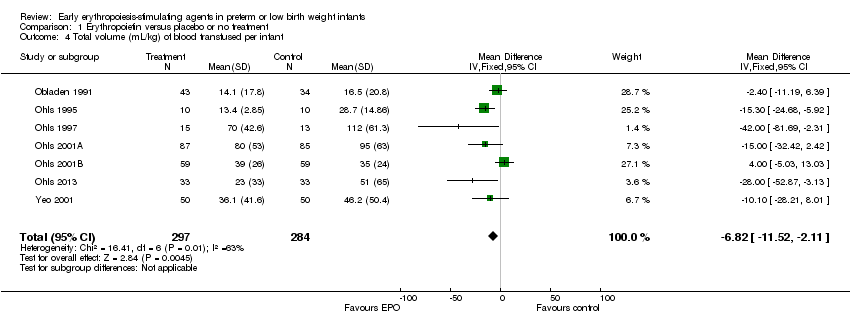
Comparison 1 Erythropoietin versus placebo or no treatment, Outcome 4 Total volume (mL/kg) of blood transfused per infant.
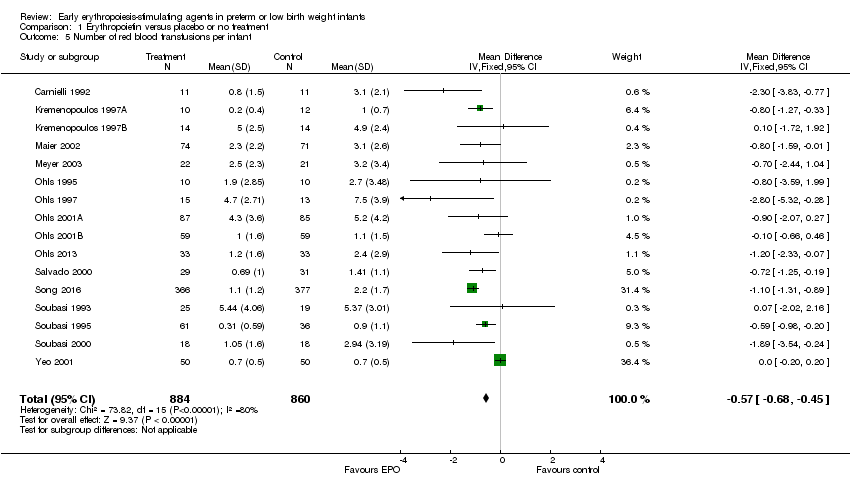
Comparison 1 Erythropoietin versus placebo or no treatment, Outcome 5 Number of red blood transfusions per infant.
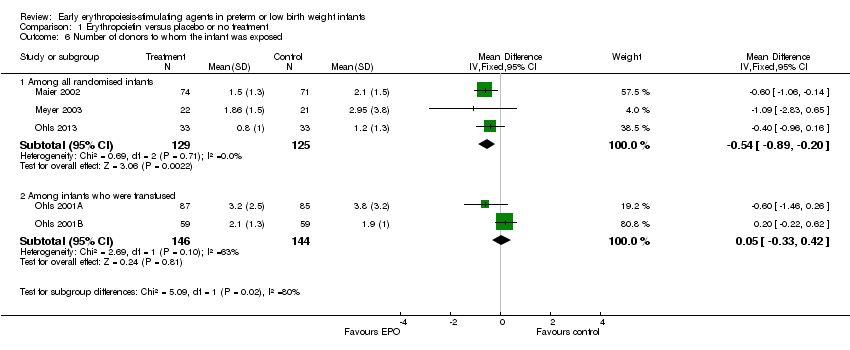
Comparison 1 Erythropoietin versus placebo or no treatment, Outcome 6 Number of donors to whom the infant was exposed.

Comparison 1 Erythropoietin versus placebo or no treatment, Outcome 7 Mortality during initial hospital stay (all causes of mortality).

Comparison 1 Erythropoietin versus placebo or no treatment, Outcome 8 Retinopathy of prematurity (all stages or stage not reported).

Comparison 1 Erythropoietin versus placebo or no treatment, Outcome 9 Retinopathy of prematurity (stage ≥ 3).
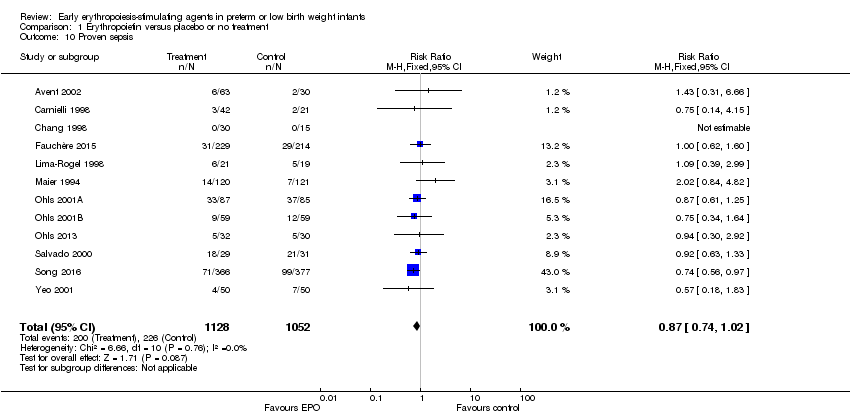
Comparison 1 Erythropoietin versus placebo or no treatment, Outcome 10 Proven sepsis.

Comparison 1 Erythropoietin versus placebo or no treatment, Outcome 11 Necrotising enterocolitis (stage not reported).
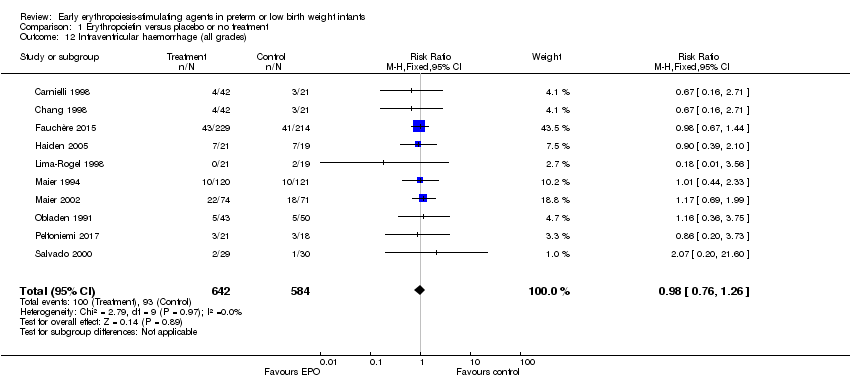
Comparison 1 Erythropoietin versus placebo or no treatment, Outcome 12 Intraventricular haemorrhage (all grades).
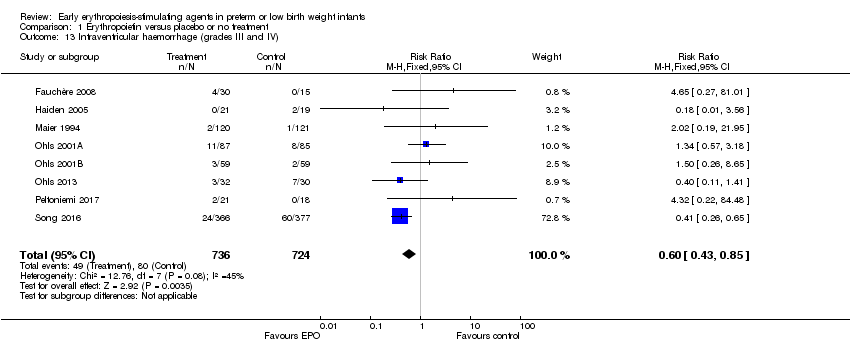
Comparison 1 Erythropoietin versus placebo or no treatment, Outcome 13 Intraventricular haemorrhage (grades III and IV).

Comparison 1 Erythropoietin versus placebo or no treatment, Outcome 14 Periventricular leukomalacia.

Comparison 1 Erythropoietin versus placebo or no treatment, Outcome 15 Length of hospital stay (days).

Comparison 1 Erythropoietin versus placebo or no treatment, Outcome 16 Bronchopulmonary dysplasia.
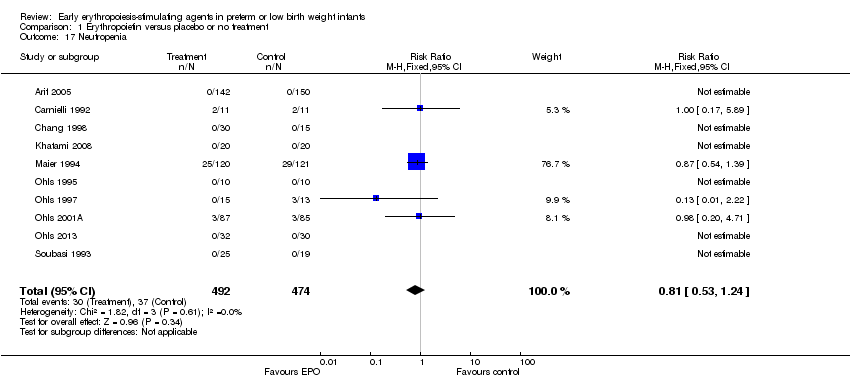
Comparison 1 Erythropoietin versus placebo or no treatment, Outcome 17 Neutropenia.
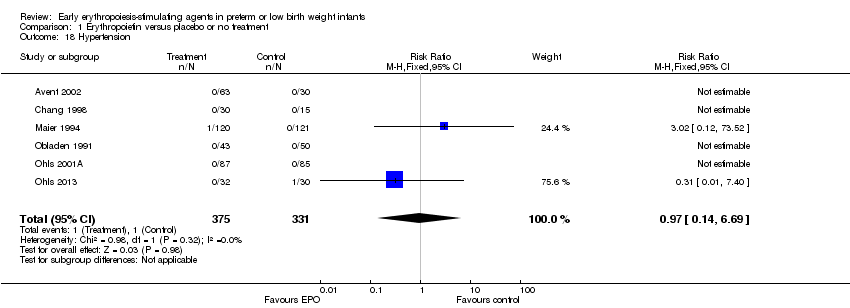
Comparison 1 Erythropoietin versus placebo or no treatment, Outcome 18 Hypertension.
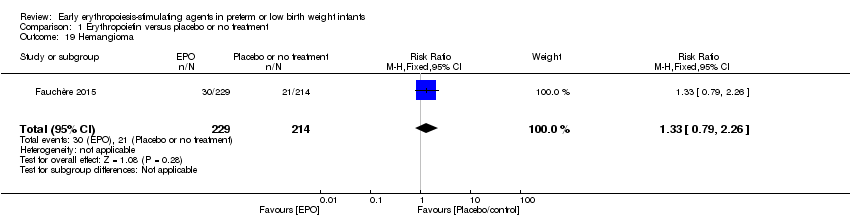
Comparison 1 Erythropoietin versus placebo or no treatment, Outcome 19 Hemangioma.

Comparison 1 Erythropoietin versus placebo or no treatment, Outcome 20 Neonatal Behavioral Neurological Assessment at 40 weeks' PMA.

Comparison 1 Erythropoietin versus placebo or no treatment, Outcome 21 Infants with white matter injury at term‐corrected PMA.

Comparison 1 Erythropoietin versus placebo or no treatment, Outcome 22 Infants with white matter signal abnormality at term‐corrected PMA.
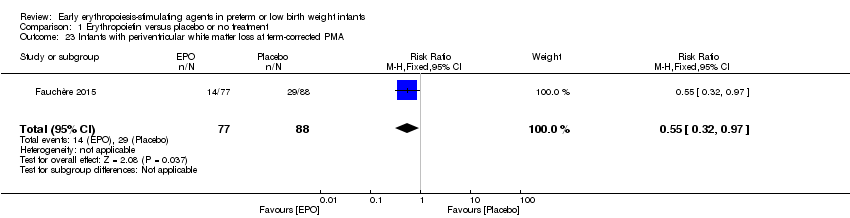
Comparison 1 Erythropoietin versus placebo or no treatment, Outcome 23 Infants with periventricular white matter loss at term‐corrected PMA.
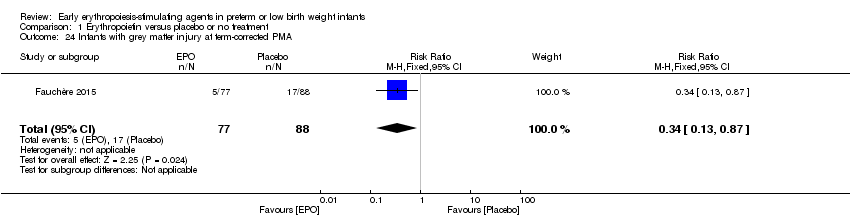
Comparison 1 Erythropoietin versus placebo or no treatment, Outcome 24 Infants with grey matter injury at term‐corrected PMA.

Comparison 1 Erythropoietin versus placebo or no treatment, Outcome 25 Survivors at discharge from hospital without severe IVH, PVL, ROP.

Comparison 1 Erythropoietin versus placebo or no treatment, Outcome 26 Bayley‐II MDI < 70 at 18 to 24 months' corrected age.

Comparison 1 Erythropoietin versus placebo or no treatment, Outcome 27 Bayley‐II PDI < 70 at 18 to 22 months' corrected age (in children examined).

Comparison 1 Erythropoietin versus placebo or no treatment, Outcome 28 Bayley‐II MDI at 18 to 24 months.

Comparison 1 Erythropoietin versus placebo or no treatment, Outcome 29 Bayley‐II PDI at 18 to 24 months.
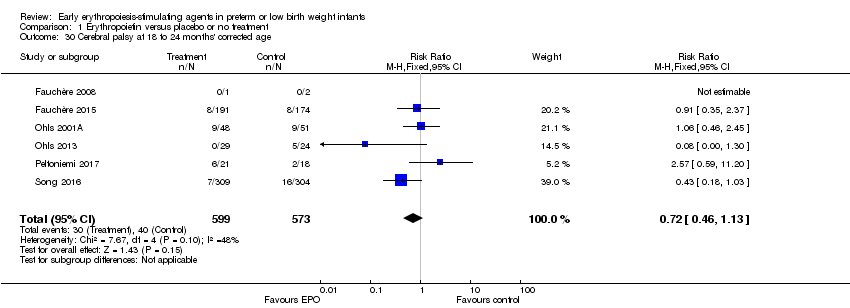
Comparison 1 Erythropoietin versus placebo or no treatment, Outcome 30 Cerebral palsy at 18 to 24 months' corrected age.

Comparison 1 Erythropoietin versus placebo or no treatment, Outcome 31 Any neurodevelopmental impairment at 18 to 22 months' corrected age (in children examined).
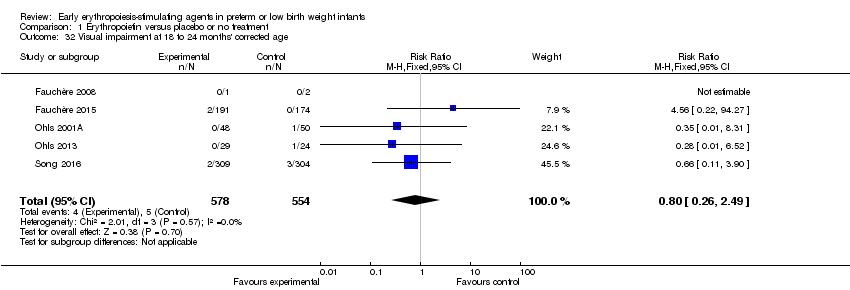
Comparison 1 Erythropoietin versus placebo or no treatment, Outcome 32 Visual impairment at 18 to 24 months' corrected age.

Comparison 1 Erythropoietin versus placebo or no treatment, Outcome 33 Hearing impairment at 18 to 24 months' corrected age.

Comparison 1 Erythropoietin versus placebo or no treatment, Outcome 34 BSID‐III composite cognitive scores at 18 to 22 months.

Comparison 1 Erythropoietin versus placebo or no treatment, Outcome 35 BSID‐III composite language score.

Comparison 1 Erythropoietin versus placebo or no treatment, Outcome 36 BSID‐III composite social/emotional score.
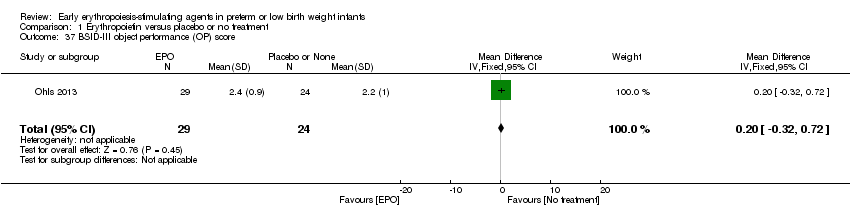
Comparison 1 Erythropoietin versus placebo or no treatment, Outcome 37 BSID‐III object performance (OP) score.

Comparison 1 Erythropoietin versus placebo or no treatment, Outcome 38 WPPSI‐III FSIQ at 3.5 to 4 years of age.

Comparison 1 Erythropoietin versus placebo or no treatment, Outcome 39 WPPSI‐III VIQ at 3.5 to 4 years of age.

Comparison 1 Erythropoietin versus placebo or no treatment, Outcome 40 WPPSI‐III PIQ at 3.5 to 4 years of age.

Comparison 1 Erythropoietin versus placebo or no treatment, Outcome 41 WPPSI‐III GLC at 3.5 to 4 years of age.

Comparison 1 Erythropoietin versus placebo or no treatment, Outcome 42 Executive function at 3.5 to 4 years of age.

Comparison 1 Erythropoietin versus placebo or no treatment, Outcome 43 Working memory at 3.5 to 4 years of age.

Comparison 1 Erythropoietin versus placebo or no treatment, Outcome 44 Inhibition at 3.5 to 4 years of age.

Comparison 1 Erythropoietin versus placebo or no treatment, Outcome 45 Griffiths Developmental Scale at 2 years of age.
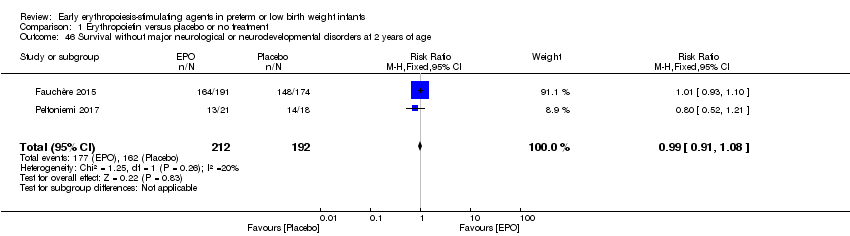
Comparison 1 Erythropoietin versus placebo or no treatment, Outcome 46 Survival without major neurological or neurodevelopmental disorders at 2 years of age.

Comparison 1 Erythropoietin versus placebo or no treatment, Outcome 47 Death or moderate/severe neurological disability at 18 to 24 months.

Comparison 1 Erythropoietin versus placebo or no treatment, Outcome 48 Moderate/severe neurological disability at 18 to 24 months.

Comparison 2 Darbepoetin alfa versus placebo or no treatment, Outcome 1 Use of 1 or more red blood cell transfusions.

Comparison 2 Darbepoetin alfa versus placebo or no treatment, Outcome 2 Total volume (mL/kg) of blood transfused per infant (all infants).

Comparison 2 Darbepoetin alfa versus placebo or no treatment, Outcome 3 Total volume (mL/kg) of blood transfused in transfused infants only.

Comparison 2 Darbepoetin alfa versus placebo or no treatment, Outcome 4 Number of blood transfusions per infant.

Comparison 2 Darbepoetin alfa versus placebo or no treatment, Outcome 5 Number of donors the infant was exposed to.

Comparison 2 Darbepoetin alfa versus placebo or no treatment, Outcome 6 Mortality during initial hospital stay (all causes of mortality).

Comparison 2 Darbepoetin alfa versus placebo or no treatment, Outcome 7 Retinopathy of prematurity (all stages).

Comparison 2 Darbepoetin alfa versus placebo or no treatment, Outcome 8 Retinopathy of prematurity (stage ≥ 3).
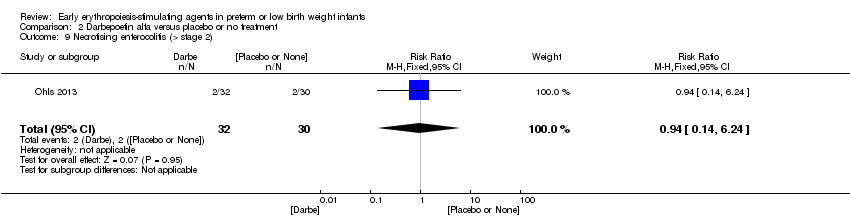
Comparison 2 Darbepoetin alfa versus placebo or no treatment, Outcome 9 Necrotising enterocolitis (> stage 2).

Comparison 2 Darbepoetin alfa versus placebo or no treatment, Outcome 10 Proven sepsis.

Comparison 2 Darbepoetin alfa versus placebo or no treatment, Outcome 11 Intraventricular haemorrhage (grades III and IV).

Comparison 2 Darbepoetin alfa versus placebo or no treatment, Outcome 12 Periventricular leukomalacia.

Comparison 2 Darbepoetin alfa versus placebo or no treatment, Outcome 13 Bronchopulmonary dysplasia (supplemental oxygen at 36 weeks' PMA).

Comparison 2 Darbepoetin alfa versus placebo or no treatment, Outcome 14 Length of hospital stay (days).

Comparison 2 Darbepoetin alfa versus placebo or no treatment, Outcome 15 Neutropenia.

Comparison 2 Darbepoetin alfa versus placebo or no treatment, Outcome 16 Hypertension.
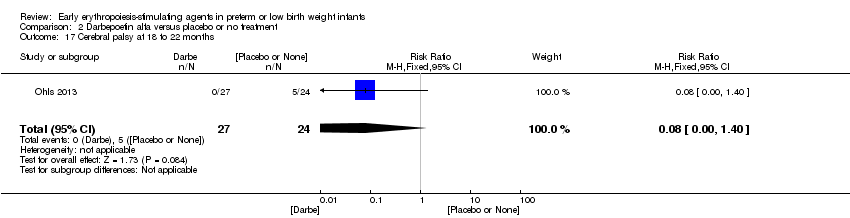
Comparison 2 Darbepoetin alfa versus placebo or no treatment, Outcome 17 Cerebral palsy at 18 to 22 months.

Comparison 2 Darbepoetin alfa versus placebo or no treatment, Outcome 18 NDI (with CP, visual defect, hearing defect, or cognitive score < 85) at 18 to 22 months.

Comparison 2 Darbepoetin alfa versus placebo or no treatment, Outcome 19 BSID‐III composite cognitive score at 18 to 22 months.

Comparison 2 Darbepoetin alfa versus placebo or no treatment, Outcome 20 BSID‐III composite language score at 18 to 22 months.
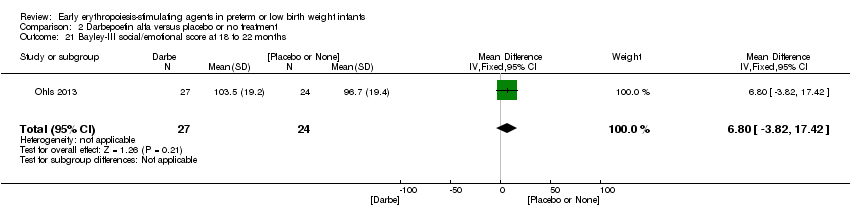
Comparison 2 Darbepoetin alfa versus placebo or no treatment, Outcome 21 Bayley‐III social/emotional score at 18 to 22 months.

Comparison 2 Darbepoetin alfa versus placebo or no treatment, Outcome 22 OP score at 18 to 22 months.

Comparison 2 Darbepoetin alfa versus placebo or no treatment, Outcome 23 WPPSI‐III FSIQ at 3.5 to 4 years of age.

Comparison 2 Darbepoetin alfa versus placebo or no treatment, Outcome 24 WPPSI‐III VIQ at 3.5 to 4 years of age.

Comparison 2 Darbepoetin alfa versus placebo or no treatment, Outcome 25 WPPSI‐III PIQ at 3.5 to 4 years of age.

Comparison 2 Darbepoetin alfa versus placebo or no treatment, Outcome 26 WPPSI‐III GLC at 3.5 to 4 years of age.
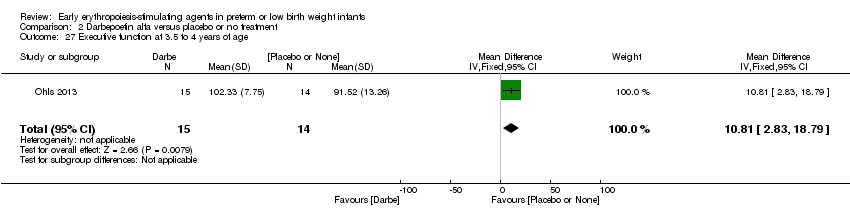
Comparison 2 Darbepoetin alfa versus placebo or no treatment, Outcome 27 Executive function at 3.5 to 4 years of age.

Comparison 2 Darbepoetin alfa versus placebo or no treatment, Outcome 28 Working memory at 3.5 to 4 years of age.

Comparison 2 Darbepoetin alfa versus placebo or no treatment, Outcome 29 Inhibition at 3.5 to 4 years of age.

Comparison 3 Darbepoetin alfa or erythropoietin (erythropoiesis‐stimulating agents ‐ ESAs) versus placebo or no treatment, Outcome 1 BSID‐III composite cognitive score at 18 to 22 months.

Comparison 3 Darbepoetin alfa or erythropoietin (erythropoiesis‐stimulating agents ‐ ESAs) versus placebo or no treatment, Outcome 2 BSID‐III composite language score at 18 to 22 months.

Comparison 3 Darbepoetin alfa or erythropoietin (erythropoiesis‐stimulating agents ‐ ESAs) versus placebo or no treatment, Outcome 3 BSID‐III composite social/emotional score at 18 to 22 months.
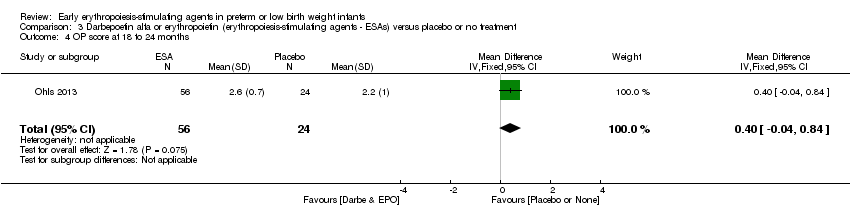
Comparison 3 Darbepoetin alfa or erythropoietin (erythropoiesis‐stimulating agents ‐ ESAs) versus placebo or no treatment, Outcome 4 OP score at 18 to 24 months.

Comparison 3 Darbepoetin alfa or erythropoietin (erythropoiesis‐stimulating agents ‐ ESAs) versus placebo or no treatment, Outcome 5 BASC‐2 composite scores at 3.5 to 4 years ‐ adaptive skills.

Comparison 3 Darbepoetin alfa or erythropoietin (erythropoiesis‐stimulating agents ‐ ESAs) versus placebo or no treatment, Outcome 6 BASC‐2 composite scores at 3.5 to 4 years ‐ behaviour symptoms.

Comparison 3 Darbepoetin alfa or erythropoietin (erythropoiesis‐stimulating agents ‐ ESAs) versus placebo or no treatment, Outcome 7 BASC‐2 composite score at 3.5 to 4 years ‐ externalising problems.
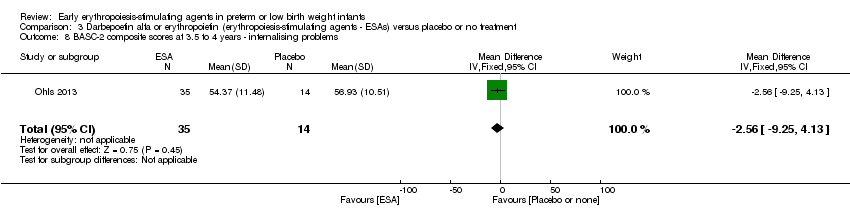
Comparison 3 Darbepoetin alfa or erythropoietin (erythropoiesis‐stimulating agents ‐ ESAs) versus placebo or no treatment, Outcome 8 BASC‐2 composite scores at 3.5 to 4 years ‐ internalising problems.

Comparison 3 Darbepoetin alfa or erythropoietin (erythropoiesis‐stimulating agents ‐ ESAs) versus placebo or no treatment, Outcome 9 WPPSI‐III FSIQ at 3.5 to 4 years of age.

Comparison 3 Darbepoetin alfa or erythropoietin (erythropoiesis‐stimulating agents ‐ ESAs) versus placebo or no treatment, Outcome 10 WPPSI‐III VIQ at 3.5 to 4 years of age.
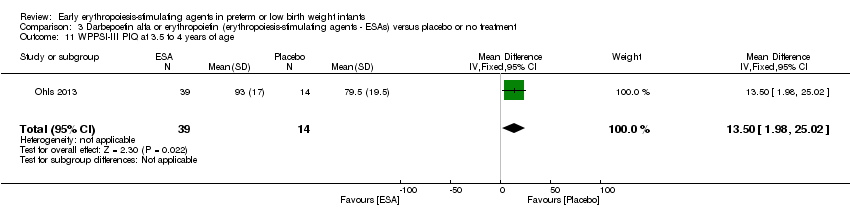
Comparison 3 Darbepoetin alfa or erythropoietin (erythropoiesis‐stimulating agents ‐ ESAs) versus placebo or no treatment, Outcome 11 WPPSI‐III PIQ at 3.5 to 4 years of age.

Comparison 3 Darbepoetin alfa or erythropoietin (erythropoiesis‐stimulating agents ‐ ESAs) versus placebo or no treatment, Outcome 12 WPPSI‐III GLC at 3.5 to 4 years of age.

Comparison 3 Darbepoetin alfa or erythropoietin (erythropoiesis‐stimulating agents ‐ ESAs) versus placebo or no treatment, Outcome 13 Executive function at 3.5 to 4 years.

Comparison 3 Darbepoetin alfa or erythropoietin (erythropoiesis‐stimulating agents ‐ ESAs) versus placebo or no treatment, Outcome 14 Working memory at 3.5 to 4 years.

Comparison 3 Darbepoetin alfa or erythropoietin (erythropoiesis‐stimulating agents ‐ ESAs) versus placebo or no treatment, Outcome 15 Inhibition at 3.5 to 4 years.

Comparison 4 Erythropoietin versus placebo to improve feeding intolerance, Outcome 1 Time to achieve full enteral feeding (days).
| Erythropoietin compared with placebo or no treatment for complications of preterm birth ‐ primary outcomes | ||||||
| Patient or population: preterm infants with low birth weight Settings: NICU Intervention: EPO Comparison: placebo or no treatment | ||||||
| Outcomes | Illustrative comparative risks* (95% CI) | Relative effect | No. of participants | Quality of the evidence | Comments | |
| Assumed risk | Corresponding risk | |||||
| Placebo or no treatment | EPO | |||||
| Use of 1 or more red blood cell transfusions (low and high doses of EPO) | High‐risk population | RR: 0.79 (95% CI 0.74 to 0.85) | 1750 | ⊕⊕⊝⊝ | Bias: We had concerns about performance bias and detection bias in 10 of the studies. We downgraded the quality of the evidence by 1 step. Heterogeneity/Consistency: I2 for the typical RR was 69% and for the typical RD 62% (both moderate quality). We downgraded the quality of the evidence by 1 step. Directness of evidence: Studies were conducted in the target population. Precision: Because of the large sample size (n = 1750), the point estimate was precise with a narrow 95% CI. Presence of publication bias: The funnel plot was symmetrical for all larger studies. | |
| 694 per 1000 | 522 per 1000 | |||||
| Any neurodevelopmental impairment at 18 to 22 months' corrected age (in children examined) | High‐risk population | RR: 0.62 (95% CI 0.48 to 0.80) | 1130 (4) | ⊕⊕⊝⊝ | Bias: We had concerns about performance bias and detection bias in 1 of the studies, the largest (n = 613) (Song 2016). This study carried a weight of 48.7% in the analysis. We downgraded the quality of the evidence by 1 step. Heterogeneity/Consistency: I2 for the typical RR was 76% (high) and for the typical RD 66% (moderate). We downgraded the quality of the evidence by 1 step. Directness of evidence: Studies were conducted in the target population. Precision: Because of the large sample size (n = 1130), the point estimate was precise with a narrow 95% CI. Presence of publication bias: Although only 4 studies were included in the funnel plot, the funnel plot was symmetrical. | |
| 210 per 1000 | 128 per 1000 | |||||
| Bayley‐II MDI at 18 to 24 months Bayley Scales of Infant Development, Second Edition, yields 2 single age‐standardised composite scores (range 50 to 150): a Mental Development Index (MDI), which measures cognition through sensory perception, knowledge, memory, problem‐solving and early language abilities; and a Psychomotor Development Index (PDI), which assesses fine and gross motor skills. | Mean Bayley‐II MDI ranged across control groups from 84.1 to 94.5. | Mean Bayley‐II MDI at 18 to 24 months in the intervention groups was 8.22 higher (95% CI 6.52 to 9.92) | WMD: 8.22 (95% CI 6.52 to 9.92) | 981 | ⊕⊕⊝⊝ | Bias: We had concerns about performance bias and detection bias in one of the studies (Song 2016). We downgraded the quality of the evidence by 1 step. Song 2016 carried a weight in the analysis of 76.2%. Heterogeneity/Consistency: I2 for the WMD was 97% (high). We downgraded the quality of the evidence by 1 step. Directness of evidence: Studies were conducted in the target population. Precision: Because of the large sample size (n = 981), the point estimate was precise with a narrow 95% CI. Presence of publication bias: As only 3 studies were included, we did not prepare a funnel plot. |
| Necrotising enterocolitis (stage not reported) | High‐risk population | RR: 0.69 (95% CI 0.52 to 0.91) | 2639 | ⊕⊕⊕⊝ | Bias: We had concerns about performance bias and detection bias in 6 of the studies, especially for Song 2016, the only study that showed a significant reduction in NEC. It carried a weight in the analysis of 47.8%. We downgraded the quality of the evidence by 1 step. Heterogeneity/Consistency: I2 for the typical RR was 0% and for the typical RD 22% (both low). Directness of evidence: Studies were conducted in the target population. Precision: Because of the large sample size (n = 2639), the point estimate was precise with a narrow 95% CI. Presence of publication bias: The funnel plot was symmetrical. | |
| 84 per 1000 | 57 per 1000 | |||||
| *The basis for the assumed risk (e.g. the median control group risk across studies) is provided in footnotes. The corresponding risk (and its 95% confidence interval) is based on the assumed risk in the comparison group and the relative effect of the intervention (and its 95% CI). | ||||||
| GRADE Working Group grades of evidence. | ||||||
| Erythropoietin compared with placebo or no treatment for complications of preterm birth | ||||||
| Patient or population: preterm infants with low birth weight Settings: NICU Intervention: EPO Comparison: placebo or no treatment | ||||||
| Outcomes | Illustrative comparative risks* (95% CI) | Relative effect | No. of participants | Quality of the evidence | Comments | |
| Assumed risk | Corresponding risk | |||||
| Placebo or no treatment | EPO | |||||
| Mortality during initial hospital stay (all causes of mortality) | High‐risk population | RR: 0.89 (95% CI 0.68 to 1.16) | 2212 | ⊕⊕⊕⊕ | Bias: We had concerns about bias (lack of blinding) in 10 of the included studies, but the outcome of mortality is not likely to be affected by researchers knowing the treatment assignment. We did not downgrade the quality of evidence on this item. Heterogeneity/Consistency: We noted no heterogeneity (I2 = 0%). Directness of evidence: Studies were conducted in the target population. Precision: Because of the large sample size (2212), the point estimate was precise with a narrow 95% CI. Presence of publication bias: The funnel plot was symmetrical. | |
| 92 per 1000 | 82 per 1000 | |||||
| Retinopathy of prematurity (stage ≥ 3) | High‐risk population | RR: 1.24 (95% CI 0.81 to 1.90) | 1283 | ⊕⊕⊕⊕ | Bias: We found no risk of bias in any of the studies, except in the smallest study that enrolled 40 neonates. We did not downgrade the quality of evidence. Heterogeneity/Consistency: We noted no heterogeneity for RR (I2 = 0%) and low (I2 = 34%) heterogeneity for RD. Directness of evidence: Studies were conducted in the target population. Precision: Because of the large sample size (n = 1283), the point estimate was precise with a narrow 95% CI. Presence of publication bias: The funnel plot, which included 8 studies, was symmetrical. | |
| 53 per 1000 | 65 per 1000 | |||||
| Intraventricular haemorrhage (grades III and IV) | High‐risk population | RR: 0.60 (95% CI 0.43 to 0.85) | 1460 | ⊕⊕⊕⊝ | Bias:The intervention was not blinded in the largest study, Song 2016 (n= 743). That study carried a weight of 72.8% in the analysis and was the only individual study that showed a significant reduction in IVH (grades III and IV). We downgraded the quality of the evidence by 1 step. Heterogeneity/Consistency: Heterogeneity was low (I2 = 45%). Directness of evidence: Studies were conducted in the target population. Precision: Because of the large sample size (n = 1460), the point estimate was precise with a narrow 95% CI. Presence of publication bias: The funnel plot, which included 8 studies, was symmetrical. | |
| 111 per 1000 | 67 per 1000 | |||||
| Periventricular leukomalacia | High‐risk population | RR: 0.66 (95% CI 0.48 to 0.92) | 1469 | ⊕⊕⊕⊝ | Bias: The intervention was not blinded in the largest study, Song 2016 (n = 743). That study carried a weight of 89.2% in the analysis and was the only individual study that showed a significant reduction in PVL. We downgraded the quality of the evidence by 1 step. Directness of evidence: Studies were conducted in the target population. Precision: Because of the large sample size (n = 1469), the point estimate was precise with a narrow 95% CI. Presence of publication bias: The funnel plot, which included 6 studies, was symmetrical. | |
| 111 per 1000 | 71 per 1000 | |||||
| Survivors at discharge from hospital without severe IVH, PVL, ROP | High‐risk population | RR: 1.00 (95% CI 0.93 to 1.08) | 443 | ⊕⊕⊕⊕ | Bias: We noted low risk of bias. Heterogeneity/Consistency: N/A, as only 1 study. Directness of evidence: The study was conducted in the target population. Precision: Because of the relatively large sample size (n = 443), the point estimate was precise with a narrow 95% CI. Presence of publication bias: As only 1 study was included, we did not develop a funnel plot. | |
| 855 per 1000 | 856 per 1000 | |||||
| Time to achieve full enteral feeding (days) | Mean time to achieve full enteral feeding was 16.3 days (SD 5.3) in the control group. | Mean time to achieve full enteral feeding in the intervention groups was 2.90 days shorter. | MD: ‐2.90 (95% CI ‐5.77 to ‐0.03) | 50 | ⊕⊕⊝⊝ | Bias: We had concerns about blinding of the intervention and outcome assessments. We downgraded the quality of evidence by 1 step. Heterogeneity/Consistency: N/A, as only 1 study. Directness of evidence: The study was conducted in the target population. Precision: Because of the small sample size (n = 50), the 95% CI around the point estimate was wide. Presence of publication bias: As only 1 study was included, we did not prepare a funnel plot. |
| *The basis for the assumed risk (e.g. the median control group risk across studies) is provided in footnotes. The corresponding risk (and its 95% confidence interval) is based on the assumed risk in the comparison group and the relative effect of the intervention (and its 95% CI). | ||||||
| GRADE Working Group grades of evidence. | ||||||
| Erythropoietin compared with placebo or no treatment for complications of preterm birth ‐ long‐term outcomes | ||||||
| Patient or population: preterm infants with low birth weight Settings: NICU Intervention: EPO Comparison: placebo or no treatment | ||||||
| Outcomes | Illustrative comparative risks* (95% CI) | Relative effect | No. of participants | Quality of the evidence | Comments | |
| Assumed risk | Corresponding risk | |||||
| Placebo | EPO | |||||
| Cerebral palsy at 18 to 24 months' corrected age | High‐risk population | RR: 0.72 (95% CI 0.46 to 1.13) | 1172 | ⊕⊕⊕⊕ | Bias: Low risk of bias. All assessors of long‐term outcomes were blinded in all trials. In Song 2016, treatment allocation was known to caregivers and probably parents, who could have possibly disclosed that information to assessors at long‐term follow‐up. We did not downgrade the quality of the evidence. Heterogeneity/Consistency: Heterogeneity was low for this outcome (I2 = 48%). We did not downgraded the evidence. Directness of evidence: Studies were conducted in the target population. Precision: Because of the large sample size (n = 1172), the point estimate was precise with a narrow 95% CI. Presence of publication bias: We included 6 studies in the analysis; we did prepare a funnel plot, which was symmetrical. | |
| 70 per 1000 | 50 per 1000 | |||||
| *The basis for the assumed risk (e.g. the median control group risk across studies) is provided in footnotes. The corresponding risk (and its 95% confidence interval) is based on the assumed risk in the comparison group and the relative effect of the intervention (and its 95% CI). | ||||||
| GRADE Working Group grades of evidence. | ||||||
| Darbe or EPO (ESA) compared with sham injection for neuro protection ‐ long‐term outcomes | ||||||
| Patient or population: neonates born preterm with low birth weight Settings: NICU Intervention: Darbe or EPO (ESA) Comparison: sham injection | ||||||
| Outcomes | Illustrative comparative risks* (95% CI) | Relative effect | No. of participants | Quality of the evidence | Comments | |
| Assumed risk | Corresponding risk | |||||
| Sham injection | ESA | |||||
| BSID‐III composite cognitive scores at 18 to 22 months The Bayley‐III has 3 main sub tests: the Cognitive Scale, which includes items such as attention to familiar and unfamiliar objects, looking for a fallen object, and pretend play; the Language Scale, which taps understanding and expression of language, for example, recognising objects and people, following directions, and naming objects and pictures; and the Motor Scale, which assesses gross and fine motor skills such as grasping, sitting, stacking blocks, and climbing stairs. | Mean BSID‐III in the control group was 88.7 units (SD 13.5). | Mean BSID‐III in the intervention group was 7.80 units higher. | MD 7.80 (95% CI 1.65 to 13.95) | 80 | ⊕⊕⊕⊝ | Bias: Risk of bias was low, but the sample followed was small. We did not reduce the quality of evidence. Heterogeneity/Consistency: Only 1 study was included, so the test for heterogeneity was N/A. Directness of evidence: The study was conducted in the target population. Precision: Because of the small sample size (n = 80), the point estimate had a wide 95% CI. We downgraded the quality of evidence by 1 step. Presence of publication bias: N/A, as only 1 study was included. |
| WPPSI‐III FSIQ at 3.5 to 4 years of age Composite scores have a mean of 100 and a standard deviation of 15. Average is 90 to 109. | Mean WPPSI‐III FSIQ in the control group was 79.2 units (SD 18,5). | Mean WPPSI‐III FSIQ in the intervention group was 11.90 units higher. | MD 11.90 (95% CI 0.76 to 23.04) | 53 | ⊕⊕⊝⊝ | Bias: Risk of bias was low, but the sample followed was even smaller than at 18 to 22 months of age (n = 53). We did reduce the quality of evidence by 1 step. Heterogeneity/Consistency: Only 1 study was included, so the test for heterogeneity was N/A. Directness of evidence: The study was conducted in the target population. Precision: Because of the small sample size (n = 53), the point estimate had a large 95% CI. We downgraded the quality of evidence by 1 step. Presence of publication bias: N/A, as only 1 study was included, |
| *The basis for the assumed risk (e.g. the median control group risk across studies) is provided in footnotes. The corresponding risk (and its 95% confidence interval) is based on the assumed risk in the comparison group and the relative effect of the intervention (and its 95% CI). | ||||||
| GRADE Working Group grades of evidence. | ||||||
| Reference | Indications |
| Infants with Hgb concentrations < 7 g/dL and with a reticulocyte count lower than < 100,000/µL or Hgb concentrations < 8 g/dL having bradycardia, tachypnoea, or apnoea, or who were not able to gain weight despite adequate calorie intake, were chosen as candidates for blood transfusion. | |
| Infants received blood transfusions if they met the following criteria: | |
| Infants were transfused during the first week of life with packed erythrocytes if the Hct level was < 42% or 36%, depending on whether or not the patient was receiving supplemental oxygen. After the first week of life, indications for transfusions were Hct < 36% for oxygen‐dependent patients and 32% if breathing room air. Anaemia was the only indication for giving packed erythrocytes to all infants. | |
| Infants received transfusions of packed cells during the first week of life if their peripheral Hct (heel stick) was < 42% or 36%, depending on whether or not the patient was receiving supplemental oxygen. | |
| Transfusion guidelines not provided | |
| Transfusion guidelines not provided | |
| Transfusion guidelines not provided | |
| Transfusion guidelines not provided | |
| Infants were transfused at Hct < 20%: | |
| Transfusion guidelines are not reported in the English abstract of this study. We have requested the full text in Chinese from trial authors. | |
| "Guidelines for red‐cell transfusions were based on the relatively strict existing policy in the nursery which was used to administer transfusions during the study period". | |
| Transfusions were ordered by the clinicians caring for each infant without consulting the investigators, based on general guidelines for erythrocyte transfusions. According to these guidelines, neonates who were well received transfusions if their hematocrit was < 30% during the third week, < 25% during the fourth week, and < 23% after the first month of life, combined with signs referable to their anaemia, such as poor weight gain, episodes of persistent bradycardia or tachycardia, and apnoea. Neonates with severe respiratory disease (bronchopulmonary dysplasia), particularly those requiring oxygen and/or ventilator support, were given transfusions to maintain their hematocrit level at > 40%. | |
| See Kremenopoulos 1997A, | |
| Transfusion was given when the Hct level reached 28% and if clinical symptoms of tachypnoea, tachycardia, and bradycardia were present at Hct of 0.32. | |
| According to criteria published by Klaus and Fanaroff (see text for more info) | |
| Infants who were receiving ventilation or who were less than 2 weeks old and had signs of anaemia were given transfusions if their Hct fell below 40%, their Hgb concentration fell below 14 g/dL (8.7 mmol/L), or blood samples totaling at least 9 mL/kg had been obtained from them since their previous transfusion. | |
| Infants with artificial ventilation or > 40% of inspired oxygen were not transfused unless Hct dropped below 0.40. | |
| Infants more than 2 weeks old who had been breathing spontaneously and whose FiO2 was less than 0.40 were given transfusions if they had signs of anaemia and their Hct fell below 11 g/dL (6.8 mmol/L); if they had no signs of anaemia, corresponding cutoff values were 27% and 9 g/dL (5.6 mmol/L). | |
| Indications for transfusions were: | |
| Indications for transfusion of packed red cells: | |
| Transfusions were given during the first 3 weeks of life if Hct was < 33%, and if the infant had 1 or more symptoms thought to be due strictly to anaemia. Symptoms were defined as tachycardia (heart rate > 160 beats/min, calculated as the average of all heart rates recorded by the bedside nurse during the preceding 24‐hour period), an increasing oxygen requirement (an increase in fraction of inspired oxygen of > 0.20 during a 24‐hour period), "lethargy" as assessed by the primary caregiver, or an increase in the number of episodes of bradycardia requiring stimulation to increase the heart rate from less than 60 beats/min (an increase of such episodes by 3 or more per day). Infants in both groups whose Hct were > 33% and yet whose phlebotomy losses exceeded 10 mL/kg body weight received an infusion of 5% albumin, administered in aliquots of not less than 10 mL/kg. Infants were not given transfusions if they were free of symptoms, even if Hct fell to < 33%. | |
| Transfusions were administered in both groups according to standardised transfusion criteria: For infants requiring mechanical ventilation, transfusions were given if Hct fell below 33%. For infants not receiving ventilatory support, transfusions were given if Hct fell below 28%, and if the infant was experiencing symptoms. Symptoms were defined as tachycardia (heart rate > 160 beats/min, calculated as the average of all heart rates recorded by the bedside nurse over the preceding 24‐hour period), an increasing oxygen requirement (an increase in FiO2 of > 0.20 over a 24‐hour period, or an elevated lactate level (> 2.5 mmol/L). In some instances, a new donor would be used each day for the newborn intensive care unit (University of Florida), and in other instances, a unit would be dedicated to a single infant for the life of the unit (University of New Mexico and University of Utah). | |
| If Hct ≤ 35%/Hgb ≤ 11 g/dL, transfuse infants requiring moderate or significant mechanical ventilation (MAP > 8 cmH2O and FiO2 > 0.4). | |
| See Ohls 2001A. | |
| The PRBC volume transfused was based on Hct/Hgb, respiratory support, and/or symptoms. If Hct ≤ 30/Hgb ≤ 10 and the infant required moderate/significant ventilation (MAP > 8 cmH2O and FiO2 > 0.4), the PRBC volume to be transfused was 15 to 20 mL/kg. PRBC volume to be transfused was 20 mL/kg. If Hct ≤18/Hgb ≤ 6 and the infant was asymptomatic and absolute reticulocyte count (ARC) was < 100,000 cells/µL, the PRBC volume to be transfused was 20 mL/kg. | |
| Infants with the following respiratory needs received 10 to 15 mL/kg of RBC volume based on Hct: | |
| Transfusion guidelines not reported | |
| Preterm infants with Hct < 20% | |
| Blood transfusion criteria followed strict clinical criteria as used by Vázquez López 2011. | |
| Neonates who were well were transfused if their Hct was < 25% combined with signs referable to their anaemia, such as poor weight gain, persistent episodes of bradycardia or tachypnoea, and apnoea. Neonates with severe respiratory disease (BPD), particularly those requiring oxygen and/or ventilator support, received transfusions to maintain Hct level at > 40%. | |
| Infants who were receiving mechanical ventilation or who were less than 2 weeks old were given transfusion if their Hct fell below 40%. Spontaneously breathing infants more than 2 weeks old whose FiO2 was less than 0.35 were given transfusion if they had signs of anaemia and their Hct fell below 30%; if they had no signs of anaemia, transfusion was given if Hct fell below 0.25. Growing, asymptomatic infants were transfused if Hct fell below 20%. Signs of anaemia included tachycardia, (> 170 beats/min) or tachypnoea (> 70/min) sustained over a 24‐hour period or associated with acute cardiac decompression; recurrent apnoea (respirations absent for 20 seconds) or bradycardia (heart rate < 100 beats/min) in a 24‐hour period not due to other causes and not responsive to methylxanthine treatment; an increase in fractional oxygen requirement by 20% or more over a 24‐hour period; or weight gain < 10 g/d averaged over a 1‐week period while on adequate caloric intake. | |
| Neonates were transfused when Hct was < 20%, if they were asymptomatic, or < 30% if they were receiving O2 < 0.35 and/or unexplained breathing disorders combined with signs referable to their anaemia, such as poor weight gain, episodes of persistent bradycardia or tachycardia. | |
| After discharge from hospital, any patient with Hgb level ≤ 7 g/dL was readmitted to the hospital and managed with packed red cell transfusion. | |
| Infants who were receiving mechanical ventilation or who were less than 2 weeks old were given transfusion if their Hct fell below 40%. Spontaneously breathing infants more than 2 weeks old whose FiO2 was less than 35% were given transfusion if they had signs of anaemia and their Hct fell below 30%; if they had no signs of anaemia, transfusion was given if Hct fell below 25%. Growing, asymptomatic infants were transfused if Hct fell below 20%. Signs of anaemia included tachycardia, (> 170 beats/min) or tachypnoea (> 70/min) sustained over a 24‐hour period or associated with acute cardiac decompression; recurrent apnoea (respirations absent for 20 seconds) or bradycardia (heart rate < 100 beats/min) in a 24‐hour period not due to other causes and not responsive to methylxanthine treatment; increased fractional oxygen requirement by 20% or more over a 24‐hour period; or weight gain < 10 g/d averaged over a 1‐week period while on adequate caloric intake. | |
| ARC: absolute reticulocyte count. | |
| Outcome or subgroup title | No. of studies | No. of participants | Statistical method | Effect size |
| 1 Use of 1 or more red blood cell transfusions (low and high doses of EPO) Show forest plot | 19 | 1750 | Risk Ratio (M‐H, Fixed, 95% CI) | 0.79 [0.74, 0.85] |
| 2 Use of 1 or more blood transfusions (high dose of EPO) Show forest plot | 17 | 1317 | Risk Ratio (M‐H, Fixed, 95% CI) | 0.79 [0.74, 0.86] |
| 2.1 High‐dose iron | 11 | 863 | Risk Ratio (M‐H, Fixed, 95% CI) | 0.84 [0.77, 0.92] |
| 2.2 Low‐dose iron | 6 | 454 | Risk Ratio (M‐H, Fixed, 95% CI) | 0.71 [0.62, 0.82] |
| 3 Use of 1 or more red blood cell transfusions (low‐dose EPO) Show forest plot | 4 | 484 | Risk Ratio (M‐H, Fixed, 95% CI) | 0.77 [0.65, 0.91] |
| 3.1 High‐dose iron | 2 | 322 | Risk Ratio (M‐H, Fixed, 95% CI) | 0.75 [0.61, 0.93] |
| 3.2 Low‐dose iron | 2 | 162 | Risk Ratio (M‐H, Fixed, 95% CI) | 0.80 [0.60, 1.07] |
| 4 Total volume (mL/kg) of blood transfused per infant Show forest plot | 7 | 581 | Mean Difference (IV, Fixed, 95% CI) | ‐6.82 [‐11.52, ‐2.11] |
| 5 Number of red blood transfusions per infant Show forest plot | 16 | 1744 | Mean Difference (IV, Fixed, 95% CI) | ‐0.57 [‐0.68, ‐0.45] |
| 6 Number of donors to whom the infant was exposed Show forest plot | 5 | Mean Difference (IV, Fixed, 95% CI) | Subtotals only | |
| 6.1 Among all randomised infants | 3 | 254 | Mean Difference (IV, Fixed, 95% CI) | ‐0.54 [‐0.89, ‐0.20] |
| 6.2 Among infants who were transfused | 2 | 290 | Mean Difference (IV, Fixed, 95% CI) | 0.05 [‐0.33, 0.42] |
| 7 Mortality during initial hospital stay (all causes of mortality) Show forest plot | 20 | 2212 | Risk Ratio (M‐H, Fixed, 95% CI) | 0.89 [0.68, 1.16] |
| 8 Retinopathy of prematurity (all stages or stage not reported) Show forest plot | 11 | 2185 | Risk Ratio (M‐H, Fixed, 95% CI) | 0.92 [0.79, 1.08] |
| 9 Retinopathy of prematurity (stage ≥ 3) Show forest plot | 8 | 1283 | Risk Ratio (M‐H, Fixed, 95% CI) | 1.24 [0.81, 1.90] |
| 10 Proven sepsis Show forest plot | 12 | 2180 | Risk Ratio (M‐H, Fixed, 95% CI) | 0.87 [0.74, 1.02] |
| 11 Necrotising enterocolitis (stage not reported) Show forest plot | 15 | 2639 | Risk Ratio (M‐H, Fixed, 95% CI) | 0.69 [0.52, 0.91] |
| 12 Intraventricular haemorrhage (all grades) Show forest plot | 10 | 1226 | Risk Ratio (M‐H, Fixed, 95% CI) | 0.98 [0.76, 1.26] |
| 13 Intraventricular haemorrhage (grades III and IV) Show forest plot | 8 | 1460 | Risk Ratio (M‐H, Fixed, 95% CI) | 0.60 [0.43, 0.85] |
| 14 Periventricular leukomalacia Show forest plot | 6 | 1469 | Risk Ratio (M‐H, Fixed, 95% CI) | 0.66 [0.48, 0.92] |
| 15 Length of hospital stay (days) Show forest plot | 8 | 970 | Mean Difference (IV, Fixed, 95% CI) | ‐3.20 [‐5.34, ‐1.06] |
| 16 Bronchopulmonary dysplasia Show forest plot | 13 | Risk Ratio (M‐H, Fixed, 95% CI) | Subtotals only | |
| 16.1 Supplemental oxygen at 28 days of age | 2 | 136 | Risk Ratio (M‐H, Fixed, 95% CI) | 0.86 [0.50, 1.47] |
| 16.2 Supplemental oxygen at 36 weeks | 7 | 1719 | Risk Ratio (M‐H, Fixed, 95% CI) | 0.95 [0.81, 1.11] |
| 16.3 Age at diagnosis not stated | 5 | 528 | Risk Ratio (M‐H, Fixed, 95% CI) | 0.98 [0.61, 1.56] |
| 17 Neutropenia Show forest plot | 10 | 966 | Risk Ratio (M‐H, Fixed, 95% CI) | 0.81 [0.53, 1.24] |
| 18 Hypertension Show forest plot | 6 | 706 | Risk Ratio (M‐H, Fixed, 95% CI) | 0.97 [0.14, 6.69] |
| 19 Hemangioma Show forest plot | 1 | 443 | Risk Ratio (M‐H, Fixed, 95% CI) | 1.33 [0.79, 2.26] |
| 20 Neonatal Behavioral Neurological Assessment at 40 weeks' PMA Show forest plot | 1 | 44 | Mean Difference (IV, Fixed, 95% CI) | 1.80 [1.26, 2.34] |
| 21 Infants with white matter injury at term‐corrected PMA Show forest plot | 1 | 165 | Risk Ratio (M‐H, Fixed, 95% CI) | 0.61 [0.37, 1.00] |
| 22 Infants with white matter signal abnormality at term‐corrected PMA Show forest plot | 1 | 165 | Risk Ratio (M‐H, Fixed, 95% CI) | 0.23 [0.05, 1.01] |
| 23 Infants with periventricular white matter loss at term‐corrected PMA Show forest plot | 1 | 165 | Risk Ratio (M‐H, Fixed, 95% CI) | 0.55 [0.32, 0.97] |
| 24 Infants with grey matter injury at term‐corrected PMA Show forest plot | 1 | 165 | Risk Ratio (M‐H, Fixed, 95% CI) | 0.34 [0.13, 0.87] |
| 25 Survivors at discharge from hospital without severe IVH, PVL, ROP Show forest plot | 1 | 443 | Risk Ratio (M‐H, Fixed, 95% CI) | 1.00 [0.93, 1.08] |
| 26 Bayley‐II MDI < 70 at 18 to 24 months' corrected age Show forest plot | 4 | 1071 | Risk Ratio (M‐H, Fixed, 95% CI) | 0.55 [0.39, 0.77] |
| 27 Bayley‐II PDI < 70 at 18 to 22 months' corrected age (in children examined) Show forest plot | 3 | 458 | Risk Ratio (M‐H, Fixed, 95% CI) | 1.43 [0.88, 2.33] |
| 28 Bayley‐II MDI at 18 to 24 months Show forest plot | 3 | 981 | Mean Difference (IV, Fixed, 95% CI) | 8.22 [6.52, 9.92] |
| 29 Bayley‐II PDI at 18 to 24 months Show forest plot | 1 | 3 | Mean Difference (IV, Fixed, 95% CI) | 0.0 [0.0, 0.0] |
| 30 Cerebral palsy at 18 to 24 months' corrected age Show forest plot | 6 | 1172 | Risk Ratio (M‐H, Fixed, 95% CI) | 0.72 [0.46, 1.13] |
| 31 Any neurodevelopmental impairment at 18 to 22 months' corrected age (in children examined) Show forest plot | 4 | 1130 | Risk Ratio (M‐H, Fixed, 95% CI) | 0.62 [0.48, 0.80] |
| 32 Visual impairment at 18 to 24 months' corrected age Show forest plot | 5 | 1132 | Risk Ratio (M‐H, Fixed, 95% CI) | 0.80 [0.26, 2.49] |
| 33 Hearing impairment at 18 to 24 months' corrected age Show forest plot | 5 | 1132 | Risk Ratio (M‐H, Fixed, 95% CI) | 0.41 [0.13, 1.23] |
| 34 BSID‐III composite cognitive scores at 18 to 22 months Show forest plot | 1 | 53 | Mean Difference (IV, Fixed, 95% CI) | 9.20 [1.70, 16.70] |
| 35 BSID‐III composite language score Show forest plot | 1 | 53 | Mean Difference (IV, Fixed, 95% CI) | 6.30 [‐2.20, 14.80] |
| 36 BSID‐III composite social/emotional score Show forest plot | 1 | 53 | Mean Difference (IV, Fixed, 95% CI) | 2.90 [‐7.84, 13.64] |
| 37 BSID‐III object performance (OP) score Show forest plot | 1 | 53 | Mean Difference (IV, Fixed, 95% CI) | 0.20 [‐0.32, 0.72] |
| 38 WPPSI‐III FSIQ at 3.5 to 4 years of age Show forest plot | 1 | 38 | Mean Difference (IV, Fixed, 95% CI) | 10.42 [‐1.96, 22.80] |
| 39 WPPSI‐III VIQ at 3.5 to 4 years of age Show forest plot | 1 | 38 | Mean Difference (IV, Fixed, 95% CI) | 10.64 [‐0.73, 22.01] |
| 40 WPPSI‐III PIQ at 3.5 to 4 years of age Show forest plot | 1 | 38 | Mean Difference (IV, Fixed, 95% CI) | 10.12 [‐2.67, 22.91] |
| 41 WPPSI‐III GLC at 3.5 to 4 years of age Show forest plot | 1 | 38 | Mean Difference (IV, Fixed, 95% CI) | 3.12 [‐8.37, 14.61] |
| 42 Executive function at 3.5 to 4 years of age Show forest plot | 1 | 38 | Mean Difference (IV, Fixed, 95% CI) | 6.82 [‐1.97, 15.61] |
| 43 Working memory at 3.5 to 4 years of age Show forest plot | 1 | 38 | Mean Difference (IV, Fixed, 95% CI) | 6.74 [‐4.56, 18.04] |
| 44 Inhibition at 3.5 to 4 years of age Show forest plot | 1 | 38 | Mean Difference (IV, Fixed, 95% CI) | 6.86 [‐4.56, 18.28] |
| 45 Griffiths Developmental Scale at 2 years of age Show forest plot | 1 | 19 | Mean Difference (IV, Fixed, 95% CI) | 3.0 [‐3.75, 9.75] |
| 46 Survival without major neurological or neurodevelopmental disorders at 2 years of age Show forest plot | 2 | 404 | Risk Ratio (M‐H, Fixed, 95% CI) | 0.99 [0.91, 1.08] |
| 47 Death or moderate/severe neurological disability at 18 to 24 months Show forest plot | 1 | 668 | Risk Ratio (M‐H, Fixed, 95% CI) | 0.48 [0.35, 0.67] |
| 48 Moderate/severe neurological disability at 18 to 24 months Show forest plot | 1 | 613 | Risk Ratio (M‐H, Fixed, 95% CI) | 0.38 [0.24, 0.60] |
| Outcome or subgroup title | No. of studies | No. of participants | Statistical method | Effect size |
| 1 Use of 1 or more red blood cell transfusions Show forest plot | 1 | 66 | Risk Ratio (M‐H, Fixed, 95% CI) | 0.62 [0.38, 1.02] |
| 2 Total volume (mL/kg) of blood transfused per infant (all infants) Show forest plot | 1 | 66 | Mean Difference (IV, Fixed, 95% CI) | ‐21.0 [‐50.72, 8.72] |
| 3 Total volume (mL/kg) of blood transfused in transfused infants only Show forest plot | 1 | 34 | Mean Difference (IV, Fixed, 95% CI) | ‐5.10 [‐53.71, 43.51] |
| 4 Number of blood transfusions per infant Show forest plot | 1 | 66 | Mean Difference (IV, Fixed, 95% CI) | ‐1.2 [‐2.48, 0.08] |
| 5 Number of donors the infant was exposed to Show forest plot | 1 | 66 | Mean Difference (IV, Fixed, 95% CI) | ‐0.5 [‐1.10, 0.10] |
| 6 Mortality during initial hospital stay (all causes of mortality) Show forest plot | 1 | 66 | Risk Ratio (M‐H, Fixed, 95% CI) | 0.67 [0.12, 3.73] |
| 7 Retinopathy of prematurity (all stages) Show forest plot | 1 | 62 | Risk Ratio (M‐H, Fixed, 95% CI) | 0.94 [0.50, 1.75] |
| 8 Retinopathy of prematurity (stage ≥ 3) Show forest plot | 1 | 62 | Risk Ratio (M‐H, Fixed, 95% CI) | 0.47 [0.09, 2.37] |
| 9 Necrotising enterocolitis (> stage 2) Show forest plot | 1 | 62 | Risk Ratio (M‐H, Fixed, 95% CI) | 0.94 [0.14, 6.24] |
| 10 Proven sepsis Show forest plot | 1 | 62 | Risk Ratio (M‐H, Fixed, 95% CI) | 1.13 [0.38, 3.30] |
| 11 Intraventricular haemorrhage (grades III and IV) Show forest plot | 1 | 62 | Risk Ratio (M‐H, Fixed, 95% CI) | 0.40 [0.11, 1.41] |
| 12 Periventricular leukomalacia Show forest plot | 1 | 62 | Risk Ratio (M‐H, Fixed, 95% CI) | 0.0 [0.0, 0.0] |
| 13 Bronchopulmonary dysplasia (supplemental oxygen at 36 weeks' PMA) Show forest plot | 1 | 62 | Risk Ratio (M‐H, Fixed, 95% CI) | 1.03 [0.73, 1.46] |
| 14 Length of hospital stay (days) Show forest plot | 1 | 62 | Mean Difference (IV, Fixed, 95% CI) | 2.0 [‐17.84, 21.84] |
| 15 Neutropenia Show forest plot | 1 | 62 | Risk Ratio (M‐H, Fixed, 95% CI) | 0.0 [0.0, 0.0] |
| 16 Hypertension Show forest plot | 1 | 62 | Risk Ratio (M‐H, Fixed, 95% CI) | 1.88 [0.18, 19.63] |
| 17 Cerebral palsy at 18 to 22 months Show forest plot | 1 | 51 | Risk Ratio (M‐H, Fixed, 95% CI) | 0.08 [0.00, 1.40] |
| 18 NDI (with CP, visual defect, hearing defect, or cognitive score < 85) at 18 to 22 months Show forest plot | 1 | 51 | Risk Ratio (M‐H, Fixed, 95% CI) | 0.27 [0.08, 0.86] |
| 19 BSID‐III composite cognitive score at 18 to 22 months Show forest plot | 1 | 51 | Mean Difference (IV, Fixed, 95% CI) | 7.5 [1.44, 13.56] |
| 20 BSID‐III composite language score at 18 to 22 months Show forest plot | 1 | 51 | Mean Difference (IV, Fixed, 95% CI) | 8.80 [1.57, 16.03] |
| 21 Bayley‐III social/emotional score at 18 to 22 months Show forest plot | 1 | 51 | Mean Difference (IV, Fixed, 95% CI) | 6.80 [‐3.82, 17.42] |
| 22 OP score at 18 to 22 months Show forest plot | 1 | 51 | Mean Difference (IV, Fixed, 95% CI) | 0.60 [0.17, 1.03] |
| 23 WPPSI‐III FSIQ at 3.5 to 4 years of age Show forest plot | 1 | 29 | Mean Difference (IV, Fixed, 95% CI) | 15.27 [2.60, 27.94] |
| 24 WPPSI‐III VIQ at 3.5 to 4 years of age Show forest plot | 1 | 29 | Mean Difference (IV, Fixed, 95% CI) | 9.17 [‐2.86, 21.20] |
| 25 WPPSI‐III PIQ at 3.5 to 4 years of age Show forest plot | 1 | 29 | Mean Difference (IV, Fixed, 95% CI) | 14.97 [1.89, 28.05] |
| 26 WPPSI‐III GLC at 3.5 to 4 years of age Show forest plot | 1 | 29 | Mean Difference (IV, Fixed, 95% CI) | 7.94 [‐4.18, 20.06] |
| 27 Executive function at 3.5 to 4 years of age Show forest plot | 1 | 29 | Mean Difference (IV, Fixed, 95% CI) | 10.81 [2.83, 18.79] |
| 28 Working memory at 3.5 to 4 years of age Show forest plot | 1 | 29 | Mean Difference (IV, Fixed, 95% CI) | 12.77 [2.68, 22.86] |
| 29 Inhibition at 3.5 to 4 years of age Show forest plot | 1 | 29 | Mean Difference (IV, Fixed, 95% CI) | 8.77 [‐2.47, 20.01] |
| Outcome or subgroup title | No. of studies | No. of participants | Statistical method | Effect size |
| 1 BSID‐III composite cognitive score at 18 to 22 months Show forest plot | 1 | 80 | Mean Difference (IV, Fixed, 95% CI) | 7.80 [1.65, 13.95] |
| 2 BSID‐III composite language score at 18 to 22 months Show forest plot | 1 | 80 | Mean Difference (IV, Fixed, 95% CI) | 7.10 [0.49, 13.71] |
| 3 BSID‐III composite social/emotional score at 18 to 22 months Show forest plot | 1 | 80 | Mean Difference (IV, Fixed, 95% CI) | 4.20 [‐5.06, 13.46] |
| 4 OP score at 18 to 24 months Show forest plot | 1 | 80 | Mean Difference (IV, Fixed, 95% CI) | 0.40 [‐0.04, 0.84] |
| 5 BASC‐2 composite scores at 3.5 to 4 years ‐ adaptive skills Show forest plot | 1 | 49 | Mean Difference (IV, Fixed, 95% CI) | 2.54 [‐3.58, 8.66] |
| 6 BASC‐2 composite scores at 3.5 to 4 years ‐ behaviour symptoms Show forest plot | 1 | 49 | Mean Difference (IV, Fixed, 95% CI) | ‐8.66 [‐18.01, 0.69] |
| 7 BASC‐2 composite score at 3.5 to 4 years ‐ externalising problems Show forest plot | 1 | 49 | Mean Difference (IV, Fixed, 95% CI) | ‐8.0 [‐15.94, ‐0.06] |
| 8 BASC‐2 composite scores at 3.5 to 4 years ‐ internalising problems Show forest plot | 1 | 49 | Mean Difference (IV, Fixed, 95% CI) | ‐2.56 [‐9.25, 4.13] |
| 9 WPPSI‐III FSIQ at 3.5 to 4 years of age Show forest plot | 1 | 53 | Mean Difference (IV, Fixed, 95% CI) | 11.90 [0.76, 23.04] |
| 10 WPPSI‐III VIQ at 3.5 to 4 years of age Show forest plot | 1 | 53 | Mean Difference (IV, Fixed, 95% CI) | 8.80 [‐1.75, 19.35] |
| 11 WPPSI‐III PIQ at 3.5 to 4 years of age Show forest plot | 1 | 53 | Mean Difference (IV, Fixed, 95% CI) | 13.5 [1.98, 25.02] |
| 12 WPPSI‐III GLC at 3.5 to 4 years of age Show forest plot | 1 | 53 | Mean Difference (IV, Fixed, 95% CI) | 5.13 [‐5.30, 15.56] |
| 13 Executive function at 3.5 to 4 years Show forest plot | 1 | 53 | Mean Difference (IV, Fixed, 95% CI) | 8.36 [0.51, 16.21] |
| 14 Working memory at 3.5 to 4 years Show forest plot | 1 | 53 | Mean Difference (IV, Fixed, 95% CI) | 9.06 [‐1.06, 19.18] |
| 15 Inhibition at 3.5 to 4 years Show forest plot | 1 | 53 | Mean Difference (IV, Fixed, 95% CI) | 7.60 [‐2.79, 17.99] |
| Outcome or subgroup title | No. of studies | No. of participants | Statistical method | Effect size |
| 1 Time to achieve full enteral feeding (days) Show forest plot | 1 | 50 | Mean Difference (IV, Fixed, 95% CI) | ‐2.90 [‐5.77, ‐0.03] |