Early erythropoiesis‐stimulating agents in preterm or low birth weight infants
Información
- DOI:
- https://doi.org/10.1002/14651858.CD004863.pub5Copiar DOI

- Base de datos:
-
- Cochrane Database of Systematic Reviews
- Versión publicada:
-
- 16 noviembre 2017see what's new
- Tipo:
-
- Intervention
- Etapa:
-
- Review
- Grupo Editorial Cochrane:
-
Grupo Cochrane de Neonatología
- Copyright:
-
- Copyright © 2017 The Cochrane Collaboration. Published by John Wiley & Sons, Ltd.
Cifras del artículo
Altmetric:
Citado por:
Autores
Contributions of authors
Sanjay Aher (SA) and Arne Ohlsson (AO) contributed equally to all sections of the protocol for this review.
The literature search of databases was conducted with the help of an experienced librarian. Both review authors identified potentially eligible studies from the printouts and agreed on which trials should be included. Data collection forms were designed and agreed upon by the two review authors. Quality assessments were conducted and data were abstracted by both review authors independently and were compared. One review author (AO) entered the data into RevMan 5.3, and the other review author (SA) checked the data for accuracy. One review author (AO) wrote sections of the full review, and the other review author (SA) read these sections and made changes. Both review authors made changes after receiving feedback from the editors of the review group.
One review author (AO) conducted the July 2009 update of the review.
One review author (AO) conducted the May 2012 update of the review.
Both review authors (AO, SMA) conducted the June 2013 update of the review.
Both review authors (AO, SMA) conducted the March 2017 update of the review.
Sources of support
Internal sources
-
Mount Sinai Hospital, Toronto, Canada.
External sources
-
No sources of support supplied
Declarations of interest
None.
Acknowledgements
We are thankful to Dr. Rolf Maier, Zentrum für Kinder‐ und Jugendmedizin, Philipps‐Universität, Marburg, Germany; Dr. Gulcan Türker, University of Kocaeli, Kocaeli, Turkey; Dr. Robin K. Ohls, University of New Mexico, Albuquerque, New Mexico, USA; Dr. Constantion Romagnoli, Division of Neonatology, Catholic University of Rome, Rome, Italy; Dr. Outi Peltoniemi, PEDEGPO Research Unit, Medical Research Center Oulu, University of Oulu, Finland; Dr. Jean‐Claude Fauchère, Division of Neonatology, University Hospital Zurich, University of Zurich, Zurich, Switzerland; and Dr. Patricia Bernice Bolado‐Garcia, Unidad Médica de Alta Especialidad, Hospital de Especialidades CMN “Ignacio García Téllez”, Instituto Mexicano del Seguro Social, Mérida, Yucatán, México; who provided us with additional information regarding their studies.
We would like to thank Ms. Elizabeth Uleryk, Chief Librarian, The Hospital for Sick Children (SickKids), Toronto, Ontario, Canada, for developing the search strategy for the original protocol and review.
Ms. Yolanda R. Brosseau, Managing Editor, Cochrane Neonatal, conducted the literature searches in 2012. She and Ms. Colleen M. Ovelman, Trial Search Co‐ordinator and Webmaster, Cochrane Neonatal, conducted the literature searches in July 2013.
Ms. Jennifer Spano, Information Specialist, Cochrane Neonatal, conducted the literature searches in 2017.
Dr. Silvio Gonzalez, Departmental Fellow, Division of Neonatology, The Hospital for Sick Children (SickKids), Toronto, Ontario, Canada, helped with translation of sections of two papers from Spanish to English. Mrs. Eva Ohlsson, Toronto, Ontario, Canada, helped with translation of sections of one paper from Polish to English.
Version history
| Published | Title | Stage | Authors | Version |
| 2020 Feb 11 | Early erythropoiesis‐stimulating agents in preterm or low birth weight infants | Review | Arne Ohlsson, Sanjay M Aher | |
| 2017 Nov 16 | Early erythropoiesis‐stimulating agents in preterm or low birth weight infants | Review | Arne Ohlsson, Sanjay M Aher | |
| 2014 Apr 26 | Early erythropoietin for preventing red blood cell transfusion in preterm and/or low birth weight infants | Review | Arne Ohlsson, Sanjay M Aher | |
| 2012 Sep 12 | Early erythropoietin for preventing red blood cell transfusion in preterm and/or low birth weight infants | Review | Arne Ohlsson, Sanjay M Aher | |
| 2006 Jul 19 | Early erythropoietin for preventing red blood cell transfusion in preterm and/or low birth weight infants | Review | Arne Ohlsson, Sanjay M Aher | |
| 2004 Jul 19 | Early erythropoietin for preventing red blood cell transfusion in preterm and/or low birth weight infants | Protocol | Sanjay M Aher, Arne Ohlsson | |
Differences between protocol and review
The protocol was published in 2004.
In the 2013 update, we included one study that used Darbe in one of the two treatment arms. The other arms used EPO and sham injection.
In the same update in 2013, we included the results of three studies in a post hoc analysis of stage ≥ 3 ROP from the late EPO review (treatment initiated at ≥ 8 days) that reported on this outcome. From the 2017 update, we excluded that analysis and the post hoc analyses on the basis of perceived study quality.
In the 2017 update, we included studies that were used to study EPO/Darbe for neuro protection and for improved feeding tolerance and prevention of NEC.
For the 2017 update, we changed the review title to "Early erythropoiesis‐stimulating agents in preterm or low birth weight infants".
Keywords
MeSH
Medical Subject Headings (MeSH) Keywords
- Anemia, Neonatal [blood, prevention & control];
- Enterocolitis, Necrotizing [blood, prevention & control];
- Erythropoiesis;
- Erythropoietin [administration & dosage, blood];
- Hematinics [*administration & dosage];
- Infant, Low Birth Weight [*blood];
- Infant, Premature [*blood];
- Randomized Controlled Trials as Topic;
- Retinopathy of Prematurity [blood, prevention & control];
Medical Subject Headings Check Words
Humans; Infant, Newborn;
PICO

Study flow diagram: review update.

Risk of bias graph: review authors' judgements about each risk of bias item presented as percentages across all included studies.
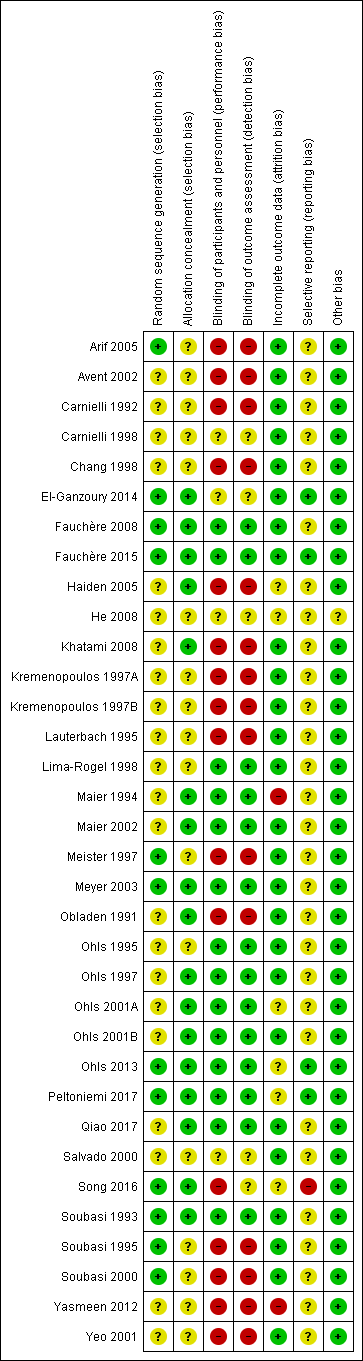
Risk of bias summary: review authors' judgements about each risk of bias item for each included study.
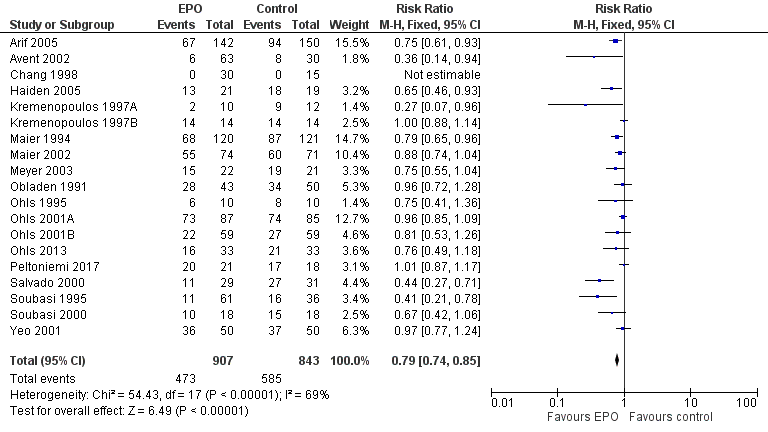
Forest plot of comparison: 1 Erythropoietin versus placebo or no treatment, outcome: 1.1 Use of 1 or more red blood cell transfusions (low and high doses of EPO).
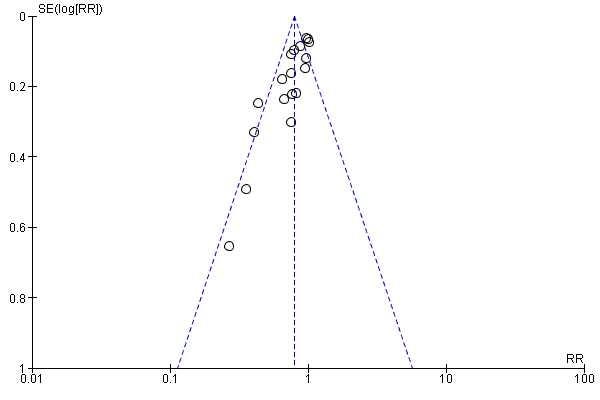
Funnel plot of comparison: 1 Erythropoietin versus placebo or no treatment, outcome: 1.1 Use of 1 or more red blood cell transfusions (low and high doses of EPO).

Comparison 1 Erythropoietin versus placebo or no treatment, Outcome 1 Use of 1 or more red blood cell transfusions (low and high doses of EPO).

Comparison 1 Erythropoietin versus placebo or no treatment, Outcome 2 Use of 1 or more blood transfusions (high dose of EPO).

Comparison 1 Erythropoietin versus placebo or no treatment, Outcome 3 Use of 1 or more red blood cell transfusions (low‐dose EPO).
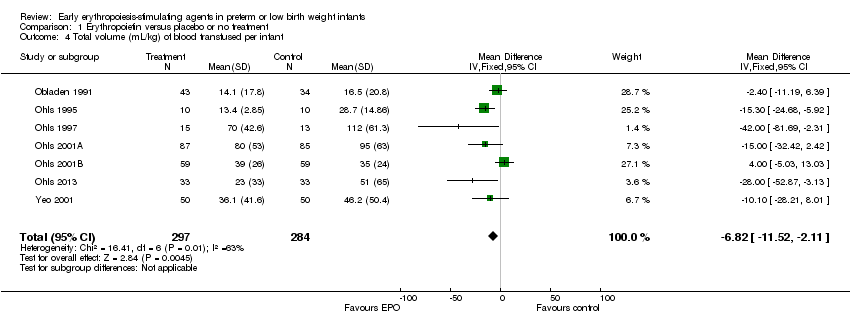
Comparison 1 Erythropoietin versus placebo or no treatment, Outcome 4 Total volume (mL/kg) of blood transfused per infant.
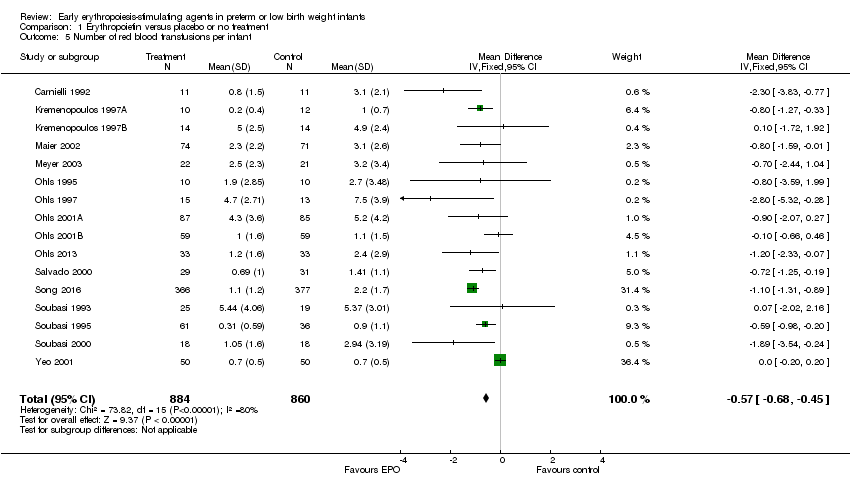
Comparison 1 Erythropoietin versus placebo or no treatment, Outcome 5 Number of red blood transfusions per infant.
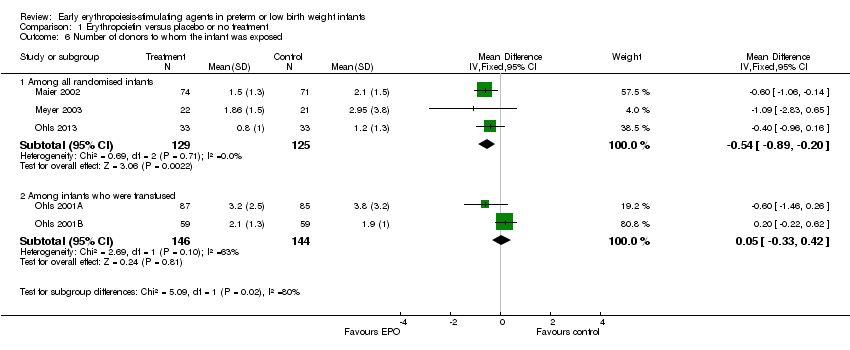
Comparison 1 Erythropoietin versus placebo or no treatment, Outcome 6 Number of donors to whom the infant was exposed.
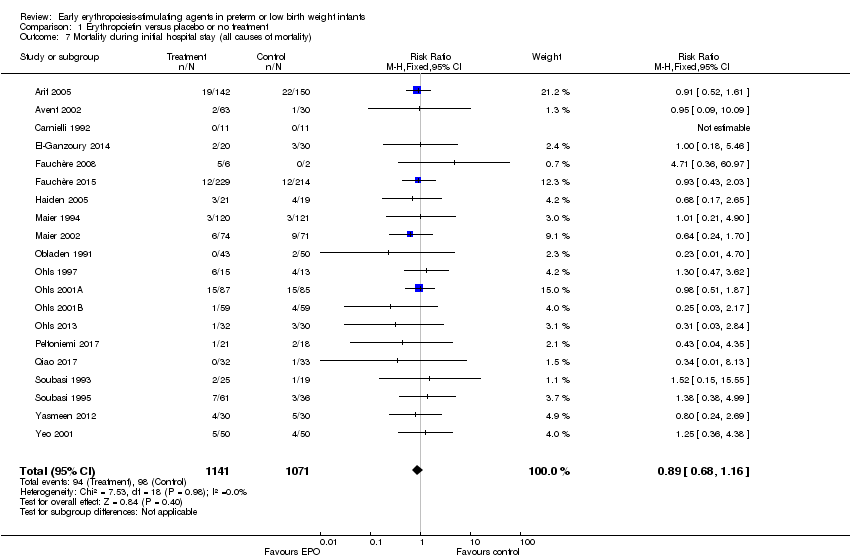
Comparison 1 Erythropoietin versus placebo or no treatment, Outcome 7 Mortality during initial hospital stay (all causes of mortality).

Comparison 1 Erythropoietin versus placebo or no treatment, Outcome 8 Retinopathy of prematurity (all stages or stage not reported).

Comparison 1 Erythropoietin versus placebo or no treatment, Outcome 9 Retinopathy of prematurity (stage ≥ 3).
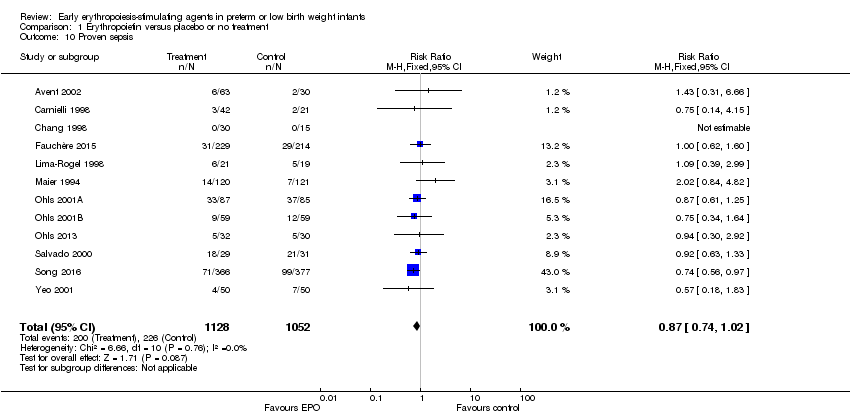
Comparison 1 Erythropoietin versus placebo or no treatment, Outcome 10 Proven sepsis.

Comparison 1 Erythropoietin versus placebo or no treatment, Outcome 11 Necrotising enterocolitis (stage not reported).
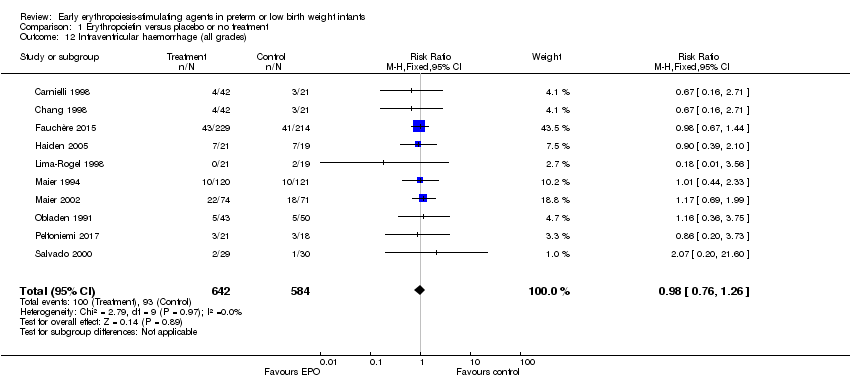
Comparison 1 Erythropoietin versus placebo or no treatment, Outcome 12 Intraventricular haemorrhage (all grades).
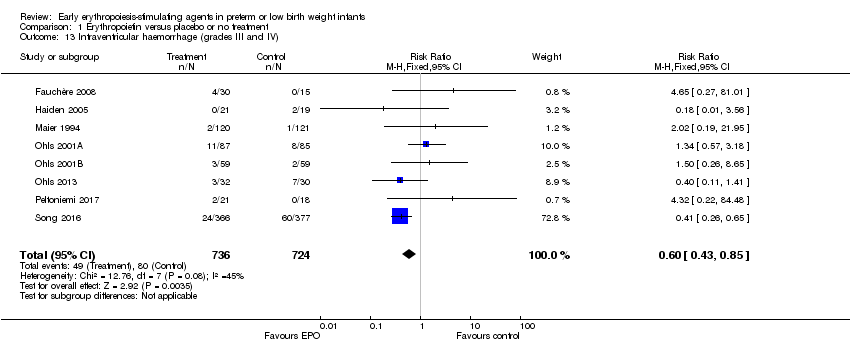
Comparison 1 Erythropoietin versus placebo or no treatment, Outcome 13 Intraventricular haemorrhage (grades III and IV).

Comparison 1 Erythropoietin versus placebo or no treatment, Outcome 14 Periventricular leukomalacia.

Comparison 1 Erythropoietin versus placebo or no treatment, Outcome 15 Length of hospital stay (days).

Comparison 1 Erythropoietin versus placebo or no treatment, Outcome 16 Bronchopulmonary dysplasia.
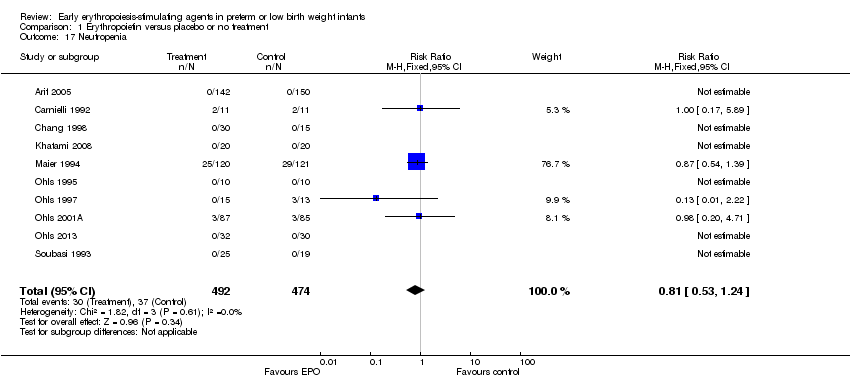
Comparison 1 Erythropoietin versus placebo or no treatment, Outcome 17 Neutropenia.
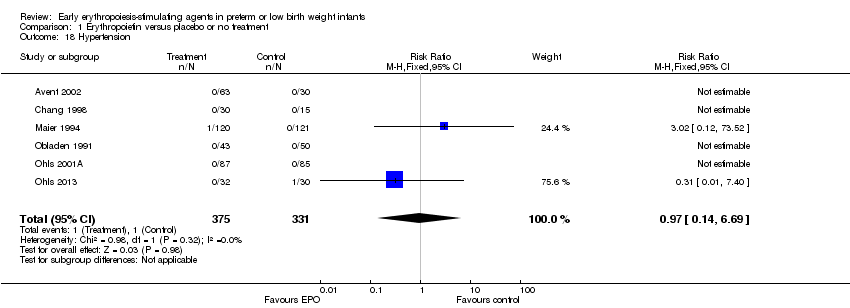
Comparison 1 Erythropoietin versus placebo or no treatment, Outcome 18 Hypertension.
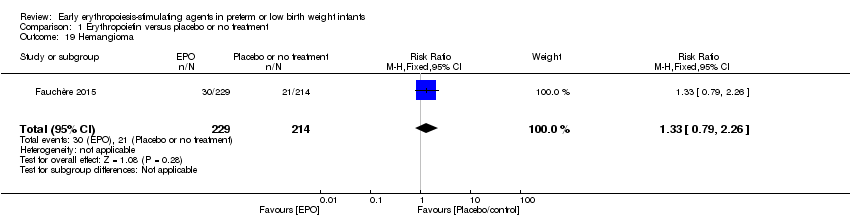
Comparison 1 Erythropoietin versus placebo or no treatment, Outcome 19 Hemangioma.

Comparison 1 Erythropoietin versus placebo or no treatment, Outcome 20 Neonatal Behavioral Neurological Assessment at 40 weeks' PMA.

Comparison 1 Erythropoietin versus placebo or no treatment, Outcome 21 Infants with white matter injury at term‐corrected PMA.

Comparison 1 Erythropoietin versus placebo or no treatment, Outcome 22 Infants with white matter signal abnormality at term‐corrected PMA.
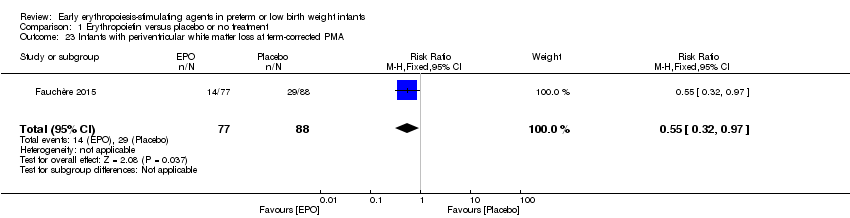
Comparison 1 Erythropoietin versus placebo or no treatment, Outcome 23 Infants with periventricular white matter loss at term‐corrected PMA.
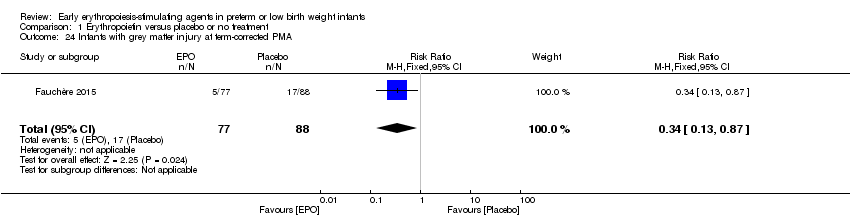
Comparison 1 Erythropoietin versus placebo or no treatment, Outcome 24 Infants with grey matter injury at term‐corrected PMA.

Comparison 1 Erythropoietin versus placebo or no treatment, Outcome 25 Survivors at discharge from hospital without severe IVH, PVL, ROP.

Comparison 1 Erythropoietin versus placebo or no treatment, Outcome 26 Bayley‐II MDI < 70 at 18 to 24 months' corrected age.

Comparison 1 Erythropoietin versus placebo or no treatment, Outcome 27 Bayley‐II PDI < 70 at 18 to 22 months' corrected age (in children examined).
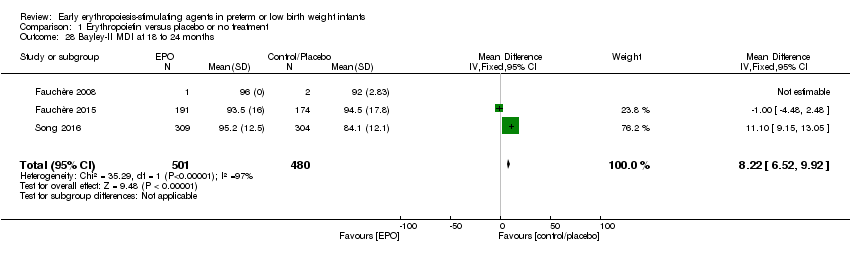
Comparison 1 Erythropoietin versus placebo or no treatment, Outcome 28 Bayley‐II MDI at 18 to 24 months.

Comparison 1 Erythropoietin versus placebo or no treatment, Outcome 29 Bayley‐II PDI at 18 to 24 months.
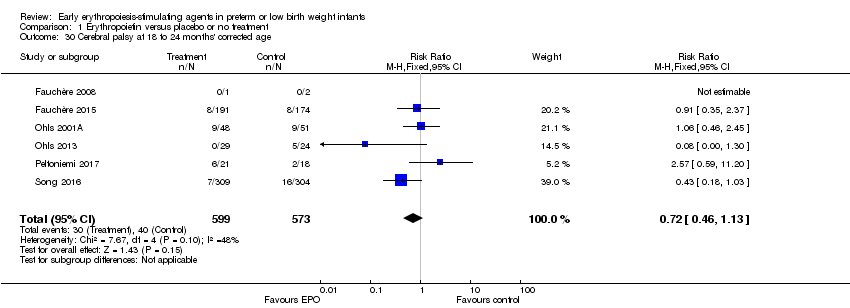
Comparison 1 Erythropoietin versus placebo or no treatment, Outcome 30 Cerebral palsy at 18 to 24 months' corrected age.

Comparison 1 Erythropoietin versus placebo or no treatment, Outcome 31 Any neurodevelopmental impairment at 18 to 22 months' corrected age (in children examined).
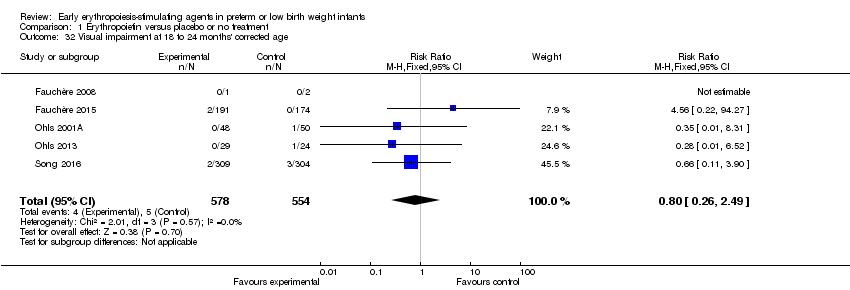
Comparison 1 Erythropoietin versus placebo or no treatment, Outcome 32 Visual impairment at 18 to 24 months' corrected age.
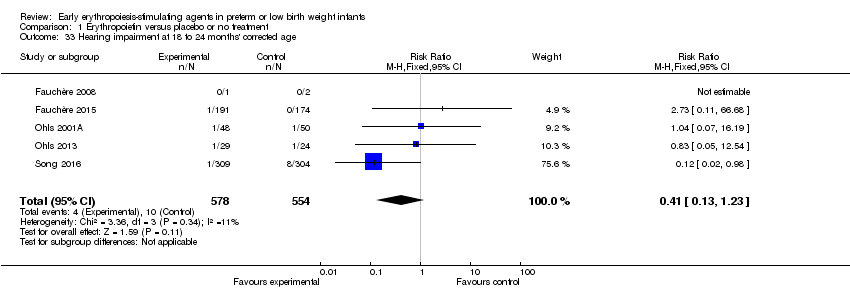
Comparison 1 Erythropoietin versus placebo or no treatment, Outcome 33 Hearing impairment at 18 to 24 months' corrected age.

Comparison 1 Erythropoietin versus placebo or no treatment, Outcome 34 BSID‐III composite cognitive scores at 18 to 22 months.

Comparison 1 Erythropoietin versus placebo or no treatment, Outcome 35 BSID‐III composite language score.

Comparison 1 Erythropoietin versus placebo or no treatment, Outcome 36 BSID‐III composite social/emotional score.
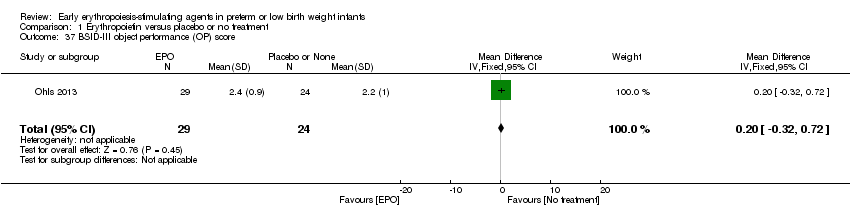
Comparison 1 Erythropoietin versus placebo or no treatment, Outcome 37 BSID‐III object performance (OP) score.

Comparison 1 Erythropoietin versus placebo or no treatment, Outcome 38 WPPSI‐III FSIQ at 3.5 to 4 years of age.
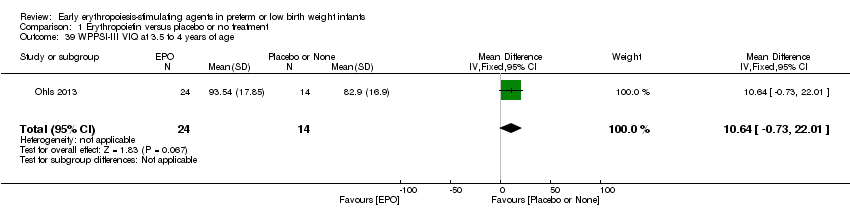
Comparison 1 Erythropoietin versus placebo or no treatment, Outcome 39 WPPSI‐III VIQ at 3.5 to 4 years of age.

Comparison 1 Erythropoietin versus placebo or no treatment, Outcome 40 WPPSI‐III PIQ at 3.5 to 4 years of age.

Comparison 1 Erythropoietin versus placebo or no treatment, Outcome 41 WPPSI‐III GLC at 3.5 to 4 years of age.

Comparison 1 Erythropoietin versus placebo or no treatment, Outcome 42 Executive function at 3.5 to 4 years of age.

Comparison 1 Erythropoietin versus placebo or no treatment, Outcome 43 Working memory at 3.5 to 4 years of age.

Comparison 1 Erythropoietin versus placebo or no treatment, Outcome 44 Inhibition at 3.5 to 4 years of age.

Comparison 1 Erythropoietin versus placebo or no treatment, Outcome 45 Griffiths Developmental Scale at 2 years of age.
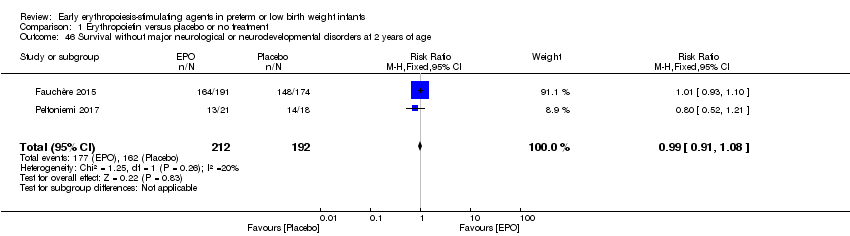
Comparison 1 Erythropoietin versus placebo or no treatment, Outcome 46 Survival without major neurological or neurodevelopmental disorders at 2 years of age.

Comparison 1 Erythropoietin versus placebo or no treatment, Outcome 47 Death or moderate/severe neurological disability at 18 to 24 months.
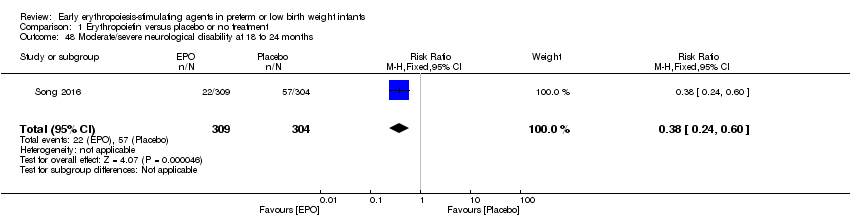
Comparison 1 Erythropoietin versus placebo or no treatment, Outcome 48 Moderate/severe neurological disability at 18 to 24 months.

Comparison 2 Darbepoetin alfa versus placebo or no treatment, Outcome 1 Use of 1 or more red blood cell transfusions.

Comparison 2 Darbepoetin alfa versus placebo or no treatment, Outcome 2 Total volume (mL/kg) of blood transfused per infant (all infants).

Comparison 2 Darbepoetin alfa versus placebo or no treatment, Outcome 3 Total volume (mL/kg) of blood transfused in transfused infants only.

Comparison 2 Darbepoetin alfa versus placebo or no treatment, Outcome 4 Number of blood transfusions per infant.

Comparison 2 Darbepoetin alfa versus placebo or no treatment, Outcome 5 Number of donors the infant was exposed to.

Comparison 2 Darbepoetin alfa versus placebo or no treatment, Outcome 6 Mortality during initial hospital stay (all causes of mortality).

Comparison 2 Darbepoetin alfa versus placebo or no treatment, Outcome 7 Retinopathy of prematurity (all stages).

Comparison 2 Darbepoetin alfa versus placebo or no treatment, Outcome 8 Retinopathy of prematurity (stage ≥ 3).
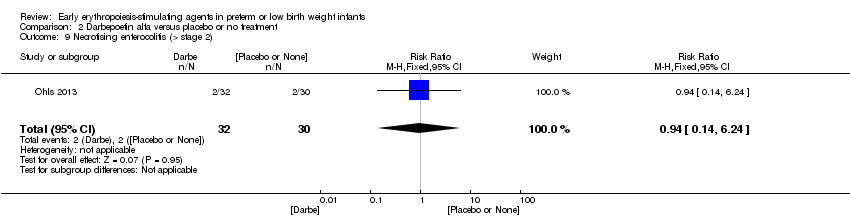
Comparison 2 Darbepoetin alfa versus placebo or no treatment, Outcome 9 Necrotising enterocolitis (> stage 2).
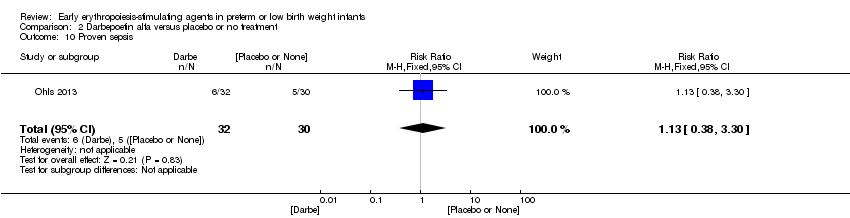
Comparison 2 Darbepoetin alfa versus placebo or no treatment, Outcome 10 Proven sepsis.

Comparison 2 Darbepoetin alfa versus placebo or no treatment, Outcome 11 Intraventricular haemorrhage (grades III and IV).
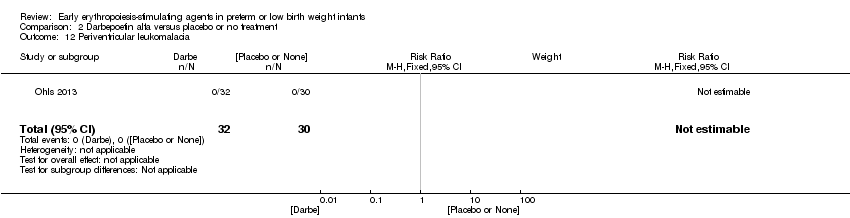
Comparison 2 Darbepoetin alfa versus placebo or no treatment, Outcome 12 Periventricular leukomalacia.
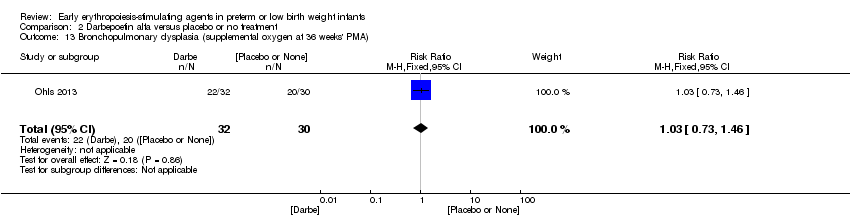
Comparison 2 Darbepoetin alfa versus placebo or no treatment, Outcome 13 Bronchopulmonary dysplasia (supplemental oxygen at 36 weeks' PMA).
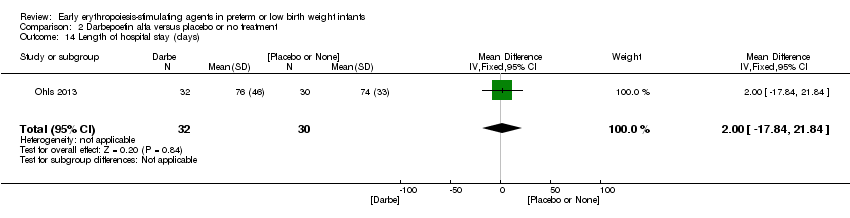
Comparison 2 Darbepoetin alfa versus placebo or no treatment, Outcome 14 Length of hospital stay (days).
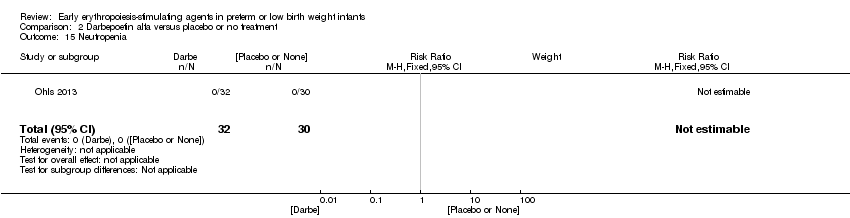
Comparison 2 Darbepoetin alfa versus placebo or no treatment, Outcome 15 Neutropenia.

Comparison 2 Darbepoetin alfa versus placebo or no treatment, Outcome 16 Hypertension.
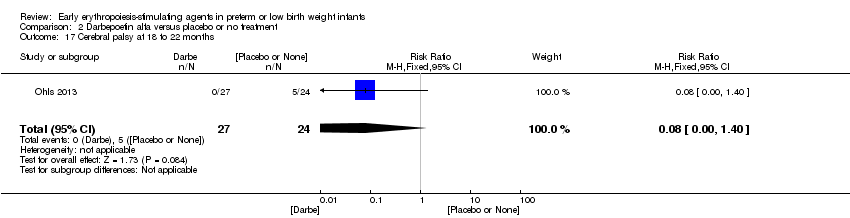
Comparison 2 Darbepoetin alfa versus placebo or no treatment, Outcome 17 Cerebral palsy at 18 to 22 months.

Comparison 2 Darbepoetin alfa versus placebo or no treatment, Outcome 18 NDI (with CP, visual defect, hearing defect, or cognitive score < 85) at 18 to 22 months.

Comparison 2 Darbepoetin alfa versus placebo or no treatment, Outcome 19 BSID‐III composite cognitive score at 18 to 22 months.

Comparison 2 Darbepoetin alfa versus placebo or no treatment, Outcome 20 BSID‐III composite language score at 18 to 22 months.
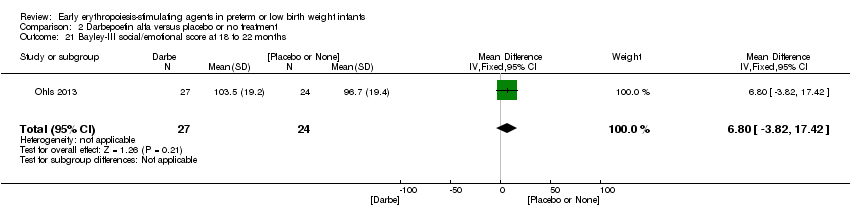
Comparison 2 Darbepoetin alfa versus placebo or no treatment, Outcome 21 Bayley‐III social/emotional score at 18 to 22 months.

Comparison 2 Darbepoetin alfa versus placebo or no treatment, Outcome 22 OP score at 18 to 22 months.

Comparison 2 Darbepoetin alfa versus placebo or no treatment, Outcome 23 WPPSI‐III FSIQ at 3.5 to 4 years of age.

Comparison 2 Darbepoetin alfa versus placebo or no treatment, Outcome 24 WPPSI‐III VIQ at 3.5 to 4 years of age.

Comparison 2 Darbepoetin alfa versus placebo or no treatment, Outcome 25 WPPSI‐III PIQ at 3.5 to 4 years of age.

Comparison 2 Darbepoetin alfa versus placebo or no treatment, Outcome 26 WPPSI‐III GLC at 3.5 to 4 years of age.
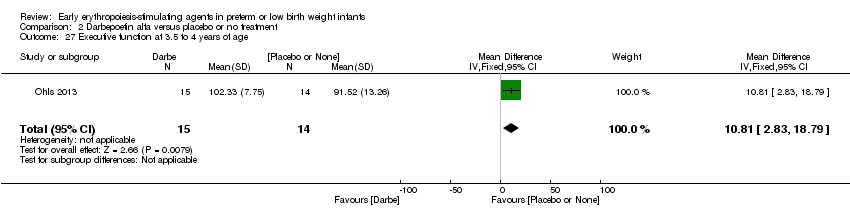
Comparison 2 Darbepoetin alfa versus placebo or no treatment, Outcome 27 Executive function at 3.5 to 4 years of age.

Comparison 2 Darbepoetin alfa versus placebo or no treatment, Outcome 28 Working memory at 3.5 to 4 years of age.

Comparison 2 Darbepoetin alfa versus placebo or no treatment, Outcome 29 Inhibition at 3.5 to 4 years of age.
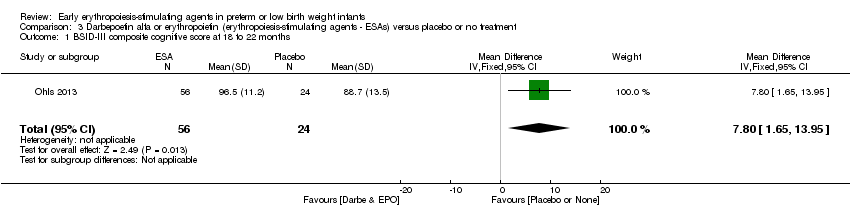
Comparison 3 Darbepoetin alfa or erythropoietin (erythropoiesis‐stimulating agents ‐ ESAs) versus placebo or no treatment, Outcome 1 BSID‐III composite cognitive score at 18 to 22 months.
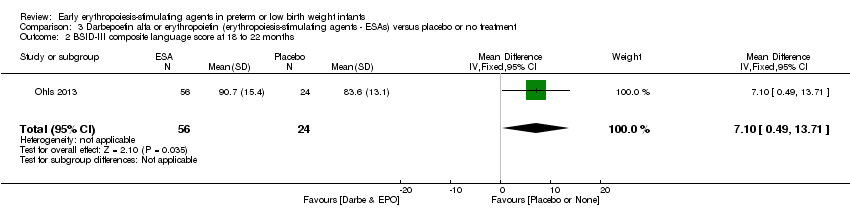
Comparison 3 Darbepoetin alfa or erythropoietin (erythropoiesis‐stimulating agents ‐ ESAs) versus placebo or no treatment, Outcome 2 BSID‐III composite language score at 18 to 22 months.
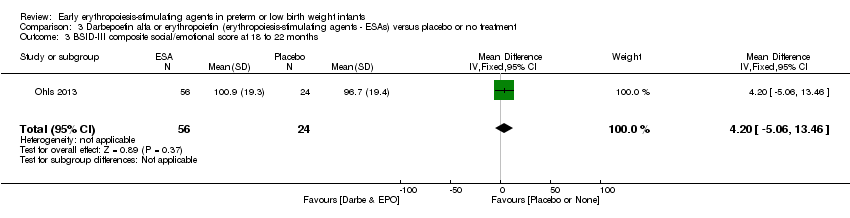
Comparison 3 Darbepoetin alfa or erythropoietin (erythropoiesis‐stimulating agents ‐ ESAs) versus placebo or no treatment, Outcome 3 BSID‐III composite social/emotional score at 18 to 22 months.
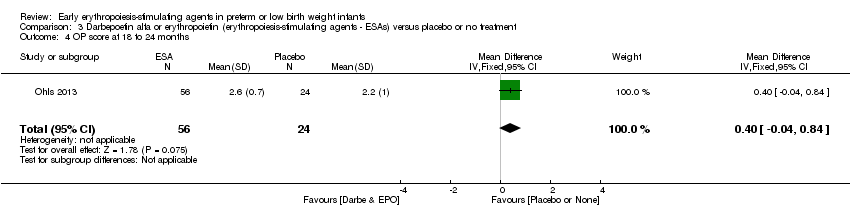
Comparison 3 Darbepoetin alfa or erythropoietin (erythropoiesis‐stimulating agents ‐ ESAs) versus placebo or no treatment, Outcome 4 OP score at 18 to 24 months.

Comparison 3 Darbepoetin alfa or erythropoietin (erythropoiesis‐stimulating agents ‐ ESAs) versus placebo or no treatment, Outcome 5 BASC‐2 composite scores at 3.5 to 4 years ‐ adaptive skills.
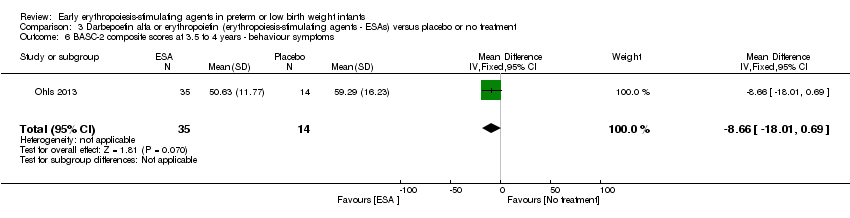
Comparison 3 Darbepoetin alfa or erythropoietin (erythropoiesis‐stimulating agents ‐ ESAs) versus placebo or no treatment, Outcome 6 BASC‐2 composite scores at 3.5 to 4 years ‐ behaviour symptoms.

Comparison 3 Darbepoetin alfa or erythropoietin (erythropoiesis‐stimulating agents ‐ ESAs) versus placebo or no treatment, Outcome 7 BASC‐2 composite score at 3.5 to 4 years ‐ externalising problems.
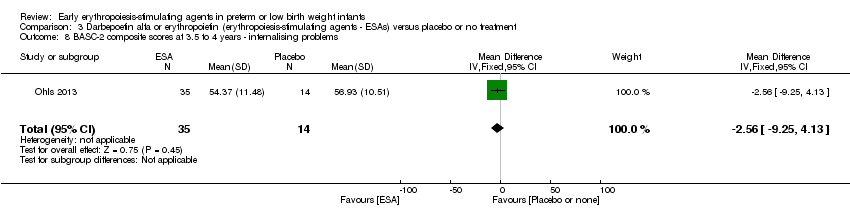
Comparison 3 Darbepoetin alfa or erythropoietin (erythropoiesis‐stimulating agents ‐ ESAs) versus placebo or no treatment, Outcome 8 BASC‐2 composite scores at 3.5 to 4 years ‐ internalising problems.

Comparison 3 Darbepoetin alfa or erythropoietin (erythropoiesis‐stimulating agents ‐ ESAs) versus placebo or no treatment, Outcome 9 WPPSI‐III FSIQ at 3.5 to 4 years of age.

Comparison 3 Darbepoetin alfa or erythropoietin (erythropoiesis‐stimulating agents ‐ ESAs) versus placebo or no treatment, Outcome 10 WPPSI‐III VIQ at 3.5 to 4 years of age.
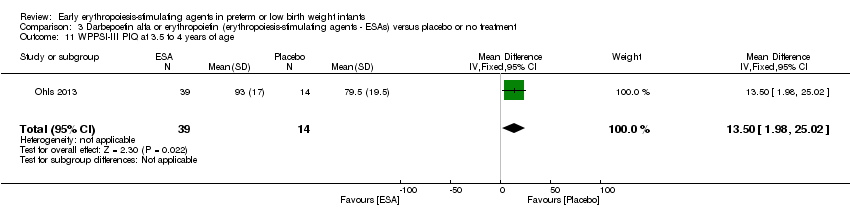
Comparison 3 Darbepoetin alfa or erythropoietin (erythropoiesis‐stimulating agents ‐ ESAs) versus placebo or no treatment, Outcome 11 WPPSI‐III PIQ at 3.5 to 4 years of age.

Comparison 3 Darbepoetin alfa or erythropoietin (erythropoiesis‐stimulating agents ‐ ESAs) versus placebo or no treatment, Outcome 12 WPPSI‐III GLC at 3.5 to 4 years of age.

Comparison 3 Darbepoetin alfa or erythropoietin (erythropoiesis‐stimulating agents ‐ ESAs) versus placebo or no treatment, Outcome 13 Executive function at 3.5 to 4 years.

Comparison 3 Darbepoetin alfa or erythropoietin (erythropoiesis‐stimulating agents ‐ ESAs) versus placebo or no treatment, Outcome 14 Working memory at 3.5 to 4 years.
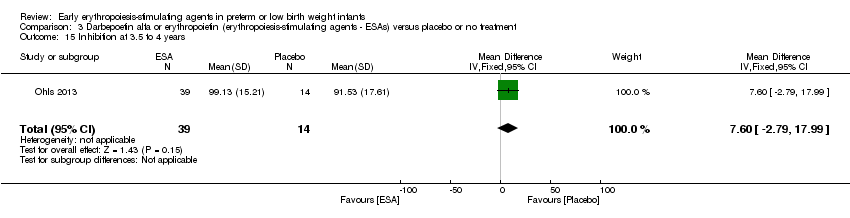
Comparison 3 Darbepoetin alfa or erythropoietin (erythropoiesis‐stimulating agents ‐ ESAs) versus placebo or no treatment, Outcome 15 Inhibition at 3.5 to 4 years.

Comparison 4 Erythropoietin versus placebo to improve feeding intolerance, Outcome 1 Time to achieve full enteral feeding (days).
| Erythropoietin compared with placebo or no treatment for complications of preterm birth ‐ primary outcomes | ||||||
| Patient or population: preterm infants with low birth weight Settings: NICU Intervention: EPO Comparison: placebo or no treatment | ||||||
| Outcomes | Illustrative comparative risks* (95% CI) | Relative effect | No. of participants | Quality of the evidence | Comments | |
| Assumed risk | Corresponding risk | |||||
| Placebo or no treatment | EPO | |||||
| Use of 1 or more red blood cell transfusions (low and high doses of EPO) | High‐risk population | RR: 0.79 (95% CI 0.74 to 0.85) | 1750 | ⊕⊕⊝⊝ | Bias: We had concerns about performance bias and detection bias in 10 of the studies. We downgraded the quality of the evidence by 1 step. Heterogeneity/Consistency: I2 for the typical RR was 69% and for the typical RD 62% (both moderate quality). We downgraded the quality of the evidence by 1 step. Directness of evidence: Studies were conducted in the target population. Precision: Because of the large sample size (n = 1750), the point estimate was precise with a narrow 95% CI. Presence of publication bias: The funnel plot was symmetrical for all larger studies. | |
| 694 per 1000 | 522 per 1000 | |||||
| Any neurodevelopmental impairment at 18 to 22 months' corrected age (in children examined) | High‐risk population | RR: 0.62 (95% CI 0.48 to 0.80) | 1130 (4) | ⊕⊕⊝⊝ | Bias: We had concerns about performance bias and detection bias in 1 of the studies, the largest (n = 613) (Song 2016). This study carried a weight of 48.7% in the analysis. We downgraded the quality of the evidence by 1 step. Heterogeneity/Consistency: I2 for the typical RR was 76% (high) and for the typical RD 66% (moderate). We downgraded the quality of the evidence by 1 step. Directness of evidence: Studies were conducted in the target population. Precision: Because of the large sample size (n = 1130), the point estimate was precise with a narrow 95% CI. Presence of publication bias: Although only 4 studies were included in the funnel plot, the funnel plot was symmetrical. | |
| 210 per 1000 | 128 per 1000 | |||||
| Bayley‐II MDI at 18 to 24 months Bayley Scales of Infant Development, Second Edition, yields 2 single age‐standardised composite scores (range 50 to 150): a Mental Development Index (MDI), which measures cognition through sensory perception, knowledge, memory, problem‐solving and early language abilities; and a Psychomotor Development Index (PDI), which assesses fine and gross motor skills. | Mean Bayley‐II MDI ranged across control groups from 84.1 to 94.5. | Mean Bayley‐II MDI at 18 to 24 months in the intervention groups was 8.22 higher (95% CI 6.52 to 9.92) | WMD: 8.22 (95% CI 6.52 to 9.92) | 981 | ⊕⊕⊝⊝ | Bias: We had concerns about performance bias and detection bias in one of the studies (Song 2016). We downgraded the quality of the evidence by 1 step. Song 2016 carried a weight in the analysis of 76.2%. Heterogeneity/Consistency: I2 for the WMD was 97% (high). We downgraded the quality of the evidence by 1 step. Directness of evidence: Studies were conducted in the target population. Precision: Because of the large sample size (n = 981), the point estimate was precise with a narrow 95% CI. Presence of publication bias: As only 3 studies were included, we did not prepare a funnel plot. |
| Necrotising enterocolitis (stage not reported) | High‐risk population | RR: 0.69 (95% CI 0.52 to 0.91) | 2639 | ⊕⊕⊕⊝ | Bias: We had concerns about performance bias and detection bias in 6 of the studies, especially for Song 2016, the only study that showed a significant reduction in NEC. It carried a weight in the analysis of 47.8%. We downgraded the quality of the evidence by 1 step. Heterogeneity/Consistency: I2 for the typical RR was 0% and for the typical RD 22% (both low). Directness of evidence: Studies were conducted in the target population. Precision: Because of the large sample size (n = 2639), the point estimate was precise with a narrow 95% CI. Presence of publication bias: The funnel plot was symmetrical. | |
| 84 per 1000 | 57 per 1000 | |||||
| *The basis for the assumed risk (e.g. the median control group risk across studies) is provided in footnotes. The corresponding risk (and its 95% confidence interval) is based on the assumed risk in the comparison group and the relative effect of the intervention (and its 95% CI). | ||||||
| GRADE Working Group grades of evidence. | ||||||
| Erythropoietin compared with placebo or no treatment for complications of preterm birth | ||||||
| Patient or population: preterm infants with low birth weight Settings: NICU Intervention: EPO Comparison: placebo or no treatment | ||||||
| Outcomes | Illustrative comparative risks* (95% CI) | Relative effect | No. of participants | Quality of the evidence | Comments | |
| Assumed risk | Corresponding risk | |||||
| Placebo or no treatment | EPO | |||||
| Mortality during initial hospital stay (all causes of mortality) | High‐risk population | RR: 0.89 (95% CI 0.68 to 1.16) | 2212 | ⊕⊕⊕⊕ | Bias: We had concerns about bias (lack of blinding) in 10 of the included studies, but the outcome of mortality is not likely to be affected by researchers knowing the treatment assignment. We did not downgrade the quality of evidence on this item. Heterogeneity/Consistency: We noted no heterogeneity (I2 = 0%). Directness of evidence: Studies were conducted in the target population. Precision: Because of the large sample size (2212), the point estimate was precise with a narrow 95% CI. Presence of publication bias: The funnel plot was symmetrical. | |
| 92 per 1000 | 82 per 1000 | |||||
| Retinopathy of prematurity (stage ≥ 3) | High‐risk population | RR: 1.24 (95% CI 0.81 to 1.90) | 1283 | ⊕⊕⊕⊕ | Bias: We found no risk of bias in any of the studies, except in the smallest study that enrolled 40 neonates. We did not downgrade the quality of evidence. Heterogeneity/Consistency: We noted no heterogeneity for RR (I2 = 0%) and low (I2 = 34%) heterogeneity for RD. Directness of evidence: Studies were conducted in the target population. Precision: Because of the large sample size (n = 1283), the point estimate was precise with a narrow 95% CI. Presence of publication bias: The funnel plot, which included 8 studies, was symmetrical. | |
| 53 per 1000 | 65 per 1000 | |||||
| Intraventricular haemorrhage (grades III and IV) | High‐risk population | RR: 0.60 (95% CI 0.43 to 0.85) | 1460 | ⊕⊕⊕⊝ | Bias:The intervention was not blinded in the largest study, Song 2016 (n= 743). That study carried a weight of 72.8% in the analysis and was the only individual study that showed a significant reduction in IVH (grades III and IV). We downgraded the quality of the evidence by 1 step. Heterogeneity/Consistency: Heterogeneity was low (I2 = 45%). Directness of evidence: Studies were conducted in the target population. Precision: Because of the large sample size (n = 1460), the point estimate was precise with a narrow 95% CI. Presence of publication bias: The funnel plot, which included 8 studies, was symmetrical. | |
| 111 per 1000 | 67 per 1000 | |||||
| Periventricular leukomalacia | High‐risk population | RR: 0.66 (95% CI 0.48 to 0.92) | 1469 | ⊕⊕⊕⊝ | Bias: The intervention was not blinded in the largest study, Song 2016 (n = 743). That study carried a weight of 89.2% in the analysis and was the only individual study that showed a significant reduction in PVL. We downgraded the quality of the evidence by 1 step. Directness of evidence: Studies were conducted in the target population. Precision: Because of the large sample size (n = 1469), the point estimate was precise with a narrow 95% CI. Presence of publication bias: The funnel plot, which included 6 studies, was symmetrical. | |
| 111 per 1000 | 71 per 1000 | |||||
| Survivors at discharge from hospital without severe IVH, PVL, ROP | High‐risk population | RR: 1.00 (95% CI 0.93 to 1.08) | 443 | ⊕⊕⊕⊕ | Bias: We noted low risk of bias. Heterogeneity/Consistency: N/A, as only 1 study. Directness of evidence: The study was conducted in the target population. Precision: Because of the relatively large sample size (n = 443), the point estimate was precise with a narrow 95% CI. Presence of publication bias: As only 1 study was included, we did not develop a funnel plot. | |
| 855 per 1000 | 856 per 1000 | |||||
| Time to achieve full enteral feeding (days) | Mean time to achieve full enteral feeding was 16.3 days (SD 5.3) in the control group. | Mean time to achieve full enteral feeding in the intervention groups was 2.90 days shorter. | MD: ‐2.90 (95% CI ‐5.77 to ‐0.03) | 50 | ⊕⊕⊝⊝ | Bias: We had concerns about blinding of the intervention and outcome assessments. We downgraded the quality of evidence by 1 step. Heterogeneity/Consistency: N/A, as only 1 study. Directness of evidence: The study was conducted in the target population. Precision: Because of the small sample size (n = 50), the 95% CI around the point estimate was wide. Presence of publication bias: As only 1 study was included, we did not prepare a funnel plot. |
| *The basis for the assumed risk (e.g. the median control group risk across studies) is provided in footnotes. The corresponding risk (and its 95% confidence interval) is based on the assumed risk in the comparison group and the relative effect of the intervention (and its 95% CI). | ||||||
| GRADE Working Group grades of evidence. | ||||||
| Erythropoietin compared with placebo or no treatment for complications of preterm birth ‐ long‐term outcomes | ||||||
| Patient or population: preterm infants with low birth weight Settings: NICU Intervention: EPO Comparison: placebo or no treatment | ||||||
| Outcomes | Illustrative comparative risks* (95% CI) | Relative effect | No. of participants | Quality of the evidence | Comments | |
| Assumed risk | Corresponding risk | |||||
| Placebo | EPO | |||||
| Cerebral palsy at 18 to 24 months' corrected age | High‐risk population | RR: 0.72 (95% CI 0.46 to 1.13) | 1172 | ⊕⊕⊕⊕ | Bias: Low risk of bias. All assessors of long‐term outcomes were blinded in all trials. In Song 2016, treatment allocation was known to caregivers and probably parents, who could have possibly disclosed that information to assessors at long‐term follow‐up. We did not downgrade the quality of the evidence. Heterogeneity/Consistency: Heterogeneity was low for this outcome (I2 = 48%). We did not downgraded the evidence. Directness of evidence: Studies were conducted in the target population. Precision: Because of the large sample size (n = 1172), the point estimate was precise with a narrow 95% CI. Presence of publication bias: We included 6 studies in the analysis; we did prepare a funnel plot, which was symmetrical. | |
| 70 per 1000 | 50 per 1000 | |||||
| *The basis for the assumed risk (e.g. the median control group risk across studies) is provided in footnotes. The corresponding risk (and its 95% confidence interval) is based on the assumed risk in the comparison group and the relative effect of the intervention (and its 95% CI). | ||||||
| GRADE Working Group grades of evidence. | ||||||
| Darbe or EPO (ESA) compared with sham injection for neuro protection ‐ long‐term outcomes | ||||||
| Patient or population: neonates born preterm with low birth weight Settings: NICU Intervention: Darbe or EPO (ESA) Comparison: sham injection | ||||||
| Outcomes | Illustrative comparative risks* (95% CI) | Relative effect | No. of participants | Quality of the evidence | Comments | |
| Assumed risk | Corresponding risk | |||||
| Sham injection | ESA | |||||
| BSID‐III composite cognitive scores at 18 to 22 months The Bayley‐III has 3 main sub tests: the Cognitive Scale, which includes items such as attention to familiar and unfamiliar objects, looking for a fallen object, and pretend play; the Language Scale, which taps understanding and expression of language, for example, recognising objects and people, following directions, and naming objects and pictures; and the Motor Scale, which assesses gross and fine motor skills such as grasping, sitting, stacking blocks, and climbing stairs. | Mean BSID‐III in the control group was 88.7 units (SD 13.5). | Mean BSID‐III in the intervention group was 7.80 units higher. | MD 7.80 (95% CI 1.65 to 13.95) | 80 | ⊕⊕⊕⊝ | Bias: Risk of bias was low, but the sample followed was small. We did not reduce the quality of evidence. Heterogeneity/Consistency: Only 1 study was included, so the test for heterogeneity was N/A. Directness of evidence: The study was conducted in the target population. Precision: Because of the small sample size (n = 80), the point estimate had a wide 95% CI. We downgraded the quality of evidence by 1 step. Presence of publication bias: N/A, as only 1 study was included. |
| WPPSI‐III FSIQ at 3.5 to 4 years of age Composite scores have a mean of 100 and a standard deviation of 15. Average is 90 to 109. | Mean WPPSI‐III FSIQ in the control group was 79.2 units (SD 18,5). | Mean WPPSI‐III FSIQ in the intervention group was 11.90 units higher. | MD 11.90 (95% CI 0.76 to 23.04) | 53 | ⊕⊕⊝⊝ | Bias: Risk of bias was low, but the sample followed was even smaller than at 18 to 22 months of age (n = 53). We did reduce the quality of evidence by 1 step. Heterogeneity/Consistency: Only 1 study was included, so the test for heterogeneity was N/A. Directness of evidence: The study was conducted in the target population. Precision: Because of the small sample size (n = 53), the point estimate had a large 95% CI. We downgraded the quality of evidence by 1 step. Presence of publication bias: N/A, as only 1 study was included, |
| *The basis for the assumed risk (e.g. the median control group risk across studies) is provided in footnotes. The corresponding risk (and its 95% confidence interval) is based on the assumed risk in the comparison group and the relative effect of the intervention (and its 95% CI). | ||||||
| GRADE Working Group grades of evidence. | ||||||
| Reference | Indications |
| Infants with Hgb concentrations < 7 g/dL and with a reticulocyte count lower than < 100,000/µL or Hgb concentrations < 8 g/dL having bradycardia, tachypnoea, or apnoea, or who were not able to gain weight despite adequate calorie intake, were chosen as candidates for blood transfusion. | |
| Infants received blood transfusions if they met the following criteria: | |
| Infants were transfused during the first week of life with packed erythrocytes if the Hct level was < 42% or 36%, depending on whether or not the patient was receiving supplemental oxygen. After the first week of life, indications for transfusions were Hct < 36% for oxygen‐dependent patients and 32% if breathing room air. Anaemia was the only indication for giving packed erythrocytes to all infants. | |
| Infants received transfusions of packed cells during the first week of life if their peripheral Hct (heel stick) was < 42% or 36%, depending on whether or not the patient was receiving supplemental oxygen. | |
| Transfusion guidelines not provided | |
| Transfusion guidelines not provided | |
| Transfusion guidelines not provided | |
| Transfusion guidelines not provided | |
| Infants were transfused at Hct < 20%: | |
| Transfusion guidelines are not reported in the English abstract of this study. We have requested the full text in Chinese from trial authors. | |
| "Guidelines for red‐cell transfusions were based on the relatively strict existing policy in the nursery which was used to administer transfusions during the study period". | |
| Transfusions were ordered by the clinicians caring for each infant without consulting the investigators, based on general guidelines for erythrocyte transfusions. According to these guidelines, neonates who were well received transfusions if their hematocrit was < 30% during the third week, < 25% during the fourth week, and < 23% after the first month of life, combined with signs referable to their anaemia, such as poor weight gain, episodes of persistent bradycardia or tachycardia, and apnoea. Neonates with severe respiratory disease (bronchopulmonary dysplasia), particularly those requiring oxygen and/or ventilator support, were given transfusions to maintain their hematocrit level at > 40%. | |
| See Kremenopoulos 1997A, | |
| Transfusion was given when the Hct level reached 28% and if clinical symptoms of tachypnoea, tachycardia, and bradycardia were present at Hct of 0.32. | |
| According to criteria published by Klaus and Fanaroff (see text for more info) | |
| Infants who were receiving ventilation or who were less than 2 weeks old and had signs of anaemia were given transfusions if their Hct fell below 40%, their Hgb concentration fell below 14 g/dL (8.7 mmol/L), or blood samples totaling at least 9 mL/kg had been obtained from them since their previous transfusion. | |
| Infants with artificial ventilation or > 40% of inspired oxygen were not transfused unless Hct dropped below 0.40. | |
| Infants more than 2 weeks old who had been breathing spontaneously and whose FiO2 was less than 0.40 were given transfusions if they had signs of anaemia and their Hct fell below 11 g/dL (6.8 mmol/L); if they had no signs of anaemia, corresponding cutoff values were 27% and 9 g/dL (5.6 mmol/L). | |
| Indications for transfusions were: | |
| Indications for transfusion of packed red cells: | |
| Transfusions were given during the first 3 weeks of life if Hct was < 33%, and if the infant had 1 or more symptoms thought to be due strictly to anaemia. Symptoms were defined as tachycardia (heart rate > 160 beats/min, calculated as the average of all heart rates recorded by the bedside nurse during the preceding 24‐hour period), an increasing oxygen requirement (an increase in fraction of inspired oxygen of > 0.20 during a 24‐hour period), "lethargy" as assessed by the primary caregiver, or an increase in the number of episodes of bradycardia requiring stimulation to increase the heart rate from less than 60 beats/min (an increase of such episodes by 3 or more per day). Infants in both groups whose Hct were > 33% and yet whose phlebotomy losses exceeded 10 mL/kg body weight received an infusion of 5% albumin, administered in aliquots of not less than 10 mL/kg. Infants were not given transfusions if they were free of symptoms, even if Hct fell to < 33%. | |
| Transfusions were administered in both groups according to standardised transfusion criteria: For infants requiring mechanical ventilation, transfusions were given if Hct fell below 33%. For infants not receiving ventilatory support, transfusions were given if Hct fell below 28%, and if the infant was experiencing symptoms. Symptoms were defined as tachycardia (heart rate > 160 beats/min, calculated as the average of all heart rates recorded by the bedside nurse over the preceding 24‐hour period), an increasing oxygen requirement (an increase in FiO2 of > 0.20 over a 24‐hour period, or an elevated lactate level (> 2.5 mmol/L). In some instances, a new donor would be used each day for the newborn intensive care unit (University of Florida), and in other instances, a unit would be dedicated to a single infant for the life of the unit (University of New Mexico and University of Utah). | |
| If Hct ≤ 35%/Hgb ≤ 11 g/dL, transfuse infants requiring moderate or significant mechanical ventilation (MAP > 8 cmH2O and FiO2 > 0.4). | |
| See Ohls 2001A. | |
| The PRBC volume transfused was based on Hct/Hgb, respiratory support, and/or symptoms. If Hct ≤ 30/Hgb ≤ 10 and the infant required moderate/significant ventilation (MAP > 8 cmH2O and FiO2 > 0.4), the PRBC volume to be transfused was 15 to 20 mL/kg. PRBC volume to be transfused was 20 mL/kg. If Hct ≤18/Hgb ≤ 6 and the infant was asymptomatic and absolute reticulocyte count (ARC) was < 100,000 cells/µL, the PRBC volume to be transfused was 20 mL/kg. | |
| Infants with the following respiratory needs received 10 to 15 mL/kg of RBC volume based on Hct: | |
| Transfusion guidelines not reported | |
| Preterm infants with Hct < 20% | |
| Blood transfusion criteria followed strict clinical criteria as used by Vázquez López 2011. | |
| Neonates who were well were transfused if their Hct was < 25% combined with signs referable to their anaemia, such as poor weight gain, persistent episodes of bradycardia or tachypnoea, and apnoea. Neonates with severe respiratory disease (BPD), particularly those requiring oxygen and/or ventilator support, received transfusions to maintain Hct level at > 40%. | |
| Infants who were receiving mechanical ventilation or who were less than 2 weeks old were given transfusion if their Hct fell below 40%. Spontaneously breathing infants more than 2 weeks old whose FiO2 was less than 0.35 were given transfusion if they had signs of anaemia and their Hct fell below 30%; if they had no signs of anaemia, transfusion was given if Hct fell below 0.25. Growing, asymptomatic infants were transfused if Hct fell below 20%. Signs of anaemia included tachycardia, (> 170 beats/min) or tachypnoea (> 70/min) sustained over a 24‐hour period or associated with acute cardiac decompression; recurrent apnoea (respirations absent for 20 seconds) or bradycardia (heart rate < 100 beats/min) in a 24‐hour period not due to other causes and not responsive to methylxanthine treatment; an increase in fractional oxygen requirement by 20% or more over a 24‐hour period; or weight gain < 10 g/d averaged over a 1‐week period while on adequate caloric intake. | |
| Neonates were transfused when Hct was < 20%, if they were asymptomatic, or < 30% if they were receiving O2 < 0.35 and/or unexplained breathing disorders combined with signs referable to their anaemia, such as poor weight gain, episodes of persistent bradycardia or tachycardia. | |
| After discharge from hospital, any patient with Hgb level ≤ 7 g/dL was readmitted to the hospital and managed with packed red cell transfusion. | |
| Infants who were receiving mechanical ventilation or who were less than 2 weeks old were given transfusion if their Hct fell below 40%. Spontaneously breathing infants more than 2 weeks old whose FiO2 was less than 35% were given transfusion if they had signs of anaemia and their Hct fell below 30%; if they had no signs of anaemia, transfusion was given if Hct fell below 25%. Growing, asymptomatic infants were transfused if Hct fell below 20%. Signs of anaemia included tachycardia, (> 170 beats/min) or tachypnoea (> 70/min) sustained over a 24‐hour period or associated with acute cardiac decompression; recurrent apnoea (respirations absent for 20 seconds) or bradycardia (heart rate < 100 beats/min) in a 24‐hour period not due to other causes and not responsive to methylxanthine treatment; increased fractional oxygen requirement by 20% or more over a 24‐hour period; or weight gain < 10 g/d averaged over a 1‐week period while on adequate caloric intake. | |
| ARC: absolute reticulocyte count. | |
| Outcome or subgroup title | No. of studies | No. of participants | Statistical method | Effect size |
| 1 Use of 1 or more red blood cell transfusions (low and high doses of EPO) Show forest plot | 19 | 1750 | Risk Ratio (M‐H, Fixed, 95% CI) | 0.79 [0.74, 0.85] |
| 2 Use of 1 or more blood transfusions (high dose of EPO) Show forest plot | 17 | 1317 | Risk Ratio (M‐H, Fixed, 95% CI) | 0.79 [0.74, 0.86] |
| 2.1 High‐dose iron | 11 | 863 | Risk Ratio (M‐H, Fixed, 95% CI) | 0.84 [0.77, 0.92] |
| 2.2 Low‐dose iron | 6 | 454 | Risk Ratio (M‐H, Fixed, 95% CI) | 0.71 [0.62, 0.82] |
| 3 Use of 1 or more red blood cell transfusions (low‐dose EPO) Show forest plot | 4 | 484 | Risk Ratio (M‐H, Fixed, 95% CI) | 0.77 [0.65, 0.91] |
| 3.1 High‐dose iron | 2 | 322 | Risk Ratio (M‐H, Fixed, 95% CI) | 0.75 [0.61, 0.93] |
| 3.2 Low‐dose iron | 2 | 162 | Risk Ratio (M‐H, Fixed, 95% CI) | 0.80 [0.60, 1.07] |
| 4 Total volume (mL/kg) of blood transfused per infant Show forest plot | 7 | 581 | Mean Difference (IV, Fixed, 95% CI) | ‐6.82 [‐11.52, ‐2.11] |
| 5 Number of red blood transfusions per infant Show forest plot | 16 | 1744 | Mean Difference (IV, Fixed, 95% CI) | ‐0.57 [‐0.68, ‐0.45] |
| 6 Number of donors to whom the infant was exposed Show forest plot | 5 | Mean Difference (IV, Fixed, 95% CI) | Subtotals only | |
| 6.1 Among all randomised infants | 3 | 254 | Mean Difference (IV, Fixed, 95% CI) | ‐0.54 [‐0.89, ‐0.20] |
| 6.2 Among infants who were transfused | 2 | 290 | Mean Difference (IV, Fixed, 95% CI) | 0.05 [‐0.33, 0.42] |
| 7 Mortality during initial hospital stay (all causes of mortality) Show forest plot | 20 | 2212 | Risk Ratio (M‐H, Fixed, 95% CI) | 0.89 [0.68, 1.16] |
| 8 Retinopathy of prematurity (all stages or stage not reported) Show forest plot | 11 | 2185 | Risk Ratio (M‐H, Fixed, 95% CI) | 0.92 [0.79, 1.08] |
| 9 Retinopathy of prematurity (stage ≥ 3) Show forest plot | 8 | 1283 | Risk Ratio (M‐H, Fixed, 95% CI) | 1.24 [0.81, 1.90] |
| 10 Proven sepsis Show forest plot | 12 | 2180 | Risk Ratio (M‐H, Fixed, 95% CI) | 0.87 [0.74, 1.02] |
| 11 Necrotising enterocolitis (stage not reported) Show forest plot | 15 | 2639 | Risk Ratio (M‐H, Fixed, 95% CI) | 0.69 [0.52, 0.91] |
| 12 Intraventricular haemorrhage (all grades) Show forest plot | 10 | 1226 | Risk Ratio (M‐H, Fixed, 95% CI) | 0.98 [0.76, 1.26] |
| 13 Intraventricular haemorrhage (grades III and IV) Show forest plot | 8 | 1460 | Risk Ratio (M‐H, Fixed, 95% CI) | 0.60 [0.43, 0.85] |
| 14 Periventricular leukomalacia Show forest plot | 6 | 1469 | Risk Ratio (M‐H, Fixed, 95% CI) | 0.66 [0.48, 0.92] |
| 15 Length of hospital stay (days) Show forest plot | 8 | 970 | Mean Difference (IV, Fixed, 95% CI) | ‐3.20 [‐5.34, ‐1.06] |
| 16 Bronchopulmonary dysplasia Show forest plot | 13 | Risk Ratio (M‐H, Fixed, 95% CI) | Subtotals only | |
| 16.1 Supplemental oxygen at 28 days of age | 2 | 136 | Risk Ratio (M‐H, Fixed, 95% CI) | 0.86 [0.50, 1.47] |
| 16.2 Supplemental oxygen at 36 weeks | 7 | 1719 | Risk Ratio (M‐H, Fixed, 95% CI) | 0.95 [0.81, 1.11] |
| 16.3 Age at diagnosis not stated | 5 | 528 | Risk Ratio (M‐H, Fixed, 95% CI) | 0.98 [0.61, 1.56] |
| 17 Neutropenia Show forest plot | 10 | 966 | Risk Ratio (M‐H, Fixed, 95% CI) | 0.81 [0.53, 1.24] |
| 18 Hypertension Show forest plot | 6 | 706 | Risk Ratio (M‐H, Fixed, 95% CI) | 0.97 [0.14, 6.69] |
| 19 Hemangioma Show forest plot | 1 | 443 | Risk Ratio (M‐H, Fixed, 95% CI) | 1.33 [0.79, 2.26] |
| 20 Neonatal Behavioral Neurological Assessment at 40 weeks' PMA Show forest plot | 1 | 44 | Mean Difference (IV, Fixed, 95% CI) | 1.80 [1.26, 2.34] |
| 21 Infants with white matter injury at term‐corrected PMA Show forest plot | 1 | 165 | Risk Ratio (M‐H, Fixed, 95% CI) | 0.61 [0.37, 1.00] |
| 22 Infants with white matter signal abnormality at term‐corrected PMA Show forest plot | 1 | 165 | Risk Ratio (M‐H, Fixed, 95% CI) | 0.23 [0.05, 1.01] |
| 23 Infants with periventricular white matter loss at term‐corrected PMA Show forest plot | 1 | 165 | Risk Ratio (M‐H, Fixed, 95% CI) | 0.55 [0.32, 0.97] |
| 24 Infants with grey matter injury at term‐corrected PMA Show forest plot | 1 | 165 | Risk Ratio (M‐H, Fixed, 95% CI) | 0.34 [0.13, 0.87] |
| 25 Survivors at discharge from hospital without severe IVH, PVL, ROP Show forest plot | 1 | 443 | Risk Ratio (M‐H, Fixed, 95% CI) | 1.00 [0.93, 1.08] |
| 26 Bayley‐II MDI < 70 at 18 to 24 months' corrected age Show forest plot | 4 | 1071 | Risk Ratio (M‐H, Fixed, 95% CI) | 0.55 [0.39, 0.77] |
| 27 Bayley‐II PDI < 70 at 18 to 22 months' corrected age (in children examined) Show forest plot | 3 | 458 | Risk Ratio (M‐H, Fixed, 95% CI) | 1.43 [0.88, 2.33] |
| 28 Bayley‐II MDI at 18 to 24 months Show forest plot | 3 | 981 | Mean Difference (IV, Fixed, 95% CI) | 8.22 [6.52, 9.92] |
| 29 Bayley‐II PDI at 18 to 24 months Show forest plot | 1 | 3 | Mean Difference (IV, Fixed, 95% CI) | 0.0 [0.0, 0.0] |
| 30 Cerebral palsy at 18 to 24 months' corrected age Show forest plot | 6 | 1172 | Risk Ratio (M‐H, Fixed, 95% CI) | 0.72 [0.46, 1.13] |
| 31 Any neurodevelopmental impairment at 18 to 22 months' corrected age (in children examined) Show forest plot | 4 | 1130 | Risk Ratio (M‐H, Fixed, 95% CI) | 0.62 [0.48, 0.80] |
| 32 Visual impairment at 18 to 24 months' corrected age Show forest plot | 5 | 1132 | Risk Ratio (M‐H, Fixed, 95% CI) | 0.80 [0.26, 2.49] |
| 33 Hearing impairment at 18 to 24 months' corrected age Show forest plot | 5 | 1132 | Risk Ratio (M‐H, Fixed, 95% CI) | 0.41 [0.13, 1.23] |
| 34 BSID‐III composite cognitive scores at 18 to 22 months Show forest plot | 1 | 53 | Mean Difference (IV, Fixed, 95% CI) | 9.20 [1.70, 16.70] |
| 35 BSID‐III composite language score Show forest plot | 1 | 53 | Mean Difference (IV, Fixed, 95% CI) | 6.30 [‐2.20, 14.80] |
| 36 BSID‐III composite social/emotional score Show forest plot | 1 | 53 | Mean Difference (IV, Fixed, 95% CI) | 2.90 [‐7.84, 13.64] |
| 37 BSID‐III object performance (OP) score Show forest plot | 1 | 53 | Mean Difference (IV, Fixed, 95% CI) | 0.20 [‐0.32, 0.72] |
| 38 WPPSI‐III FSIQ at 3.5 to 4 years of age Show forest plot | 1 | 38 | Mean Difference (IV, Fixed, 95% CI) | 10.42 [‐1.96, 22.80] |
| 39 WPPSI‐III VIQ at 3.5 to 4 years of age Show forest plot | 1 | 38 | Mean Difference (IV, Fixed, 95% CI) | 10.64 [‐0.73, 22.01] |
| 40 WPPSI‐III PIQ at 3.5 to 4 years of age Show forest plot | 1 | 38 | Mean Difference (IV, Fixed, 95% CI) | 10.12 [‐2.67, 22.91] |
| 41 WPPSI‐III GLC at 3.5 to 4 years of age Show forest plot | 1 | 38 | Mean Difference (IV, Fixed, 95% CI) | 3.12 [‐8.37, 14.61] |
| 42 Executive function at 3.5 to 4 years of age Show forest plot | 1 | 38 | Mean Difference (IV, Fixed, 95% CI) | 6.82 [‐1.97, 15.61] |
| 43 Working memory at 3.5 to 4 years of age Show forest plot | 1 | 38 | Mean Difference (IV, Fixed, 95% CI) | 6.74 [‐4.56, 18.04] |
| 44 Inhibition at 3.5 to 4 years of age Show forest plot | 1 | 38 | Mean Difference (IV, Fixed, 95% CI) | 6.86 [‐4.56, 18.28] |
| 45 Griffiths Developmental Scale at 2 years of age Show forest plot | 1 | 19 | Mean Difference (IV, Fixed, 95% CI) | 3.0 [‐3.75, 9.75] |
| 46 Survival without major neurological or neurodevelopmental disorders at 2 years of age Show forest plot | 2 | 404 | Risk Ratio (M‐H, Fixed, 95% CI) | 0.99 [0.91, 1.08] |
| 47 Death or moderate/severe neurological disability at 18 to 24 months Show forest plot | 1 | 668 | Risk Ratio (M‐H, Fixed, 95% CI) | 0.48 [0.35, 0.67] |
| 48 Moderate/severe neurological disability at 18 to 24 months Show forest plot | 1 | 613 | Risk Ratio (M‐H, Fixed, 95% CI) | 0.38 [0.24, 0.60] |
| Outcome or subgroup title | No. of studies | No. of participants | Statistical method | Effect size |
| 1 Use of 1 or more red blood cell transfusions Show forest plot | 1 | 66 | Risk Ratio (M‐H, Fixed, 95% CI) | 0.62 [0.38, 1.02] |
| 2 Total volume (mL/kg) of blood transfused per infant (all infants) Show forest plot | 1 | 66 | Mean Difference (IV, Fixed, 95% CI) | ‐21.0 [‐50.72, 8.72] |
| 3 Total volume (mL/kg) of blood transfused in transfused infants only Show forest plot | 1 | 34 | Mean Difference (IV, Fixed, 95% CI) | ‐5.10 [‐53.71, 43.51] |
| 4 Number of blood transfusions per infant Show forest plot | 1 | 66 | Mean Difference (IV, Fixed, 95% CI) | ‐1.2 [‐2.48, 0.08] |
| 5 Number of donors the infant was exposed to Show forest plot | 1 | 66 | Mean Difference (IV, Fixed, 95% CI) | ‐0.5 [‐1.10, 0.10] |
| 6 Mortality during initial hospital stay (all causes of mortality) Show forest plot | 1 | 66 | Risk Ratio (M‐H, Fixed, 95% CI) | 0.67 [0.12, 3.73] |
| 7 Retinopathy of prematurity (all stages) Show forest plot | 1 | 62 | Risk Ratio (M‐H, Fixed, 95% CI) | 0.94 [0.50, 1.75] |
| 8 Retinopathy of prematurity (stage ≥ 3) Show forest plot | 1 | 62 | Risk Ratio (M‐H, Fixed, 95% CI) | 0.47 [0.09, 2.37] |
| 9 Necrotising enterocolitis (> stage 2) Show forest plot | 1 | 62 | Risk Ratio (M‐H, Fixed, 95% CI) | 0.94 [0.14, 6.24] |
| 10 Proven sepsis Show forest plot | 1 | 62 | Risk Ratio (M‐H, Fixed, 95% CI) | 1.13 [0.38, 3.30] |
| 11 Intraventricular haemorrhage (grades III and IV) Show forest plot | 1 | 62 | Risk Ratio (M‐H, Fixed, 95% CI) | 0.40 [0.11, 1.41] |
| 12 Periventricular leukomalacia Show forest plot | 1 | 62 | Risk Ratio (M‐H, Fixed, 95% CI) | 0.0 [0.0, 0.0] |
| 13 Bronchopulmonary dysplasia (supplemental oxygen at 36 weeks' PMA) Show forest plot | 1 | 62 | Risk Ratio (M‐H, Fixed, 95% CI) | 1.03 [0.73, 1.46] |
| 14 Length of hospital stay (days) Show forest plot | 1 | 62 | Mean Difference (IV, Fixed, 95% CI) | 2.0 [‐17.84, 21.84] |
| 15 Neutropenia Show forest plot | 1 | 62 | Risk Ratio (M‐H, Fixed, 95% CI) | 0.0 [0.0, 0.0] |
| 16 Hypertension Show forest plot | 1 | 62 | Risk Ratio (M‐H, Fixed, 95% CI) | 1.88 [0.18, 19.63] |
| 17 Cerebral palsy at 18 to 22 months Show forest plot | 1 | 51 | Risk Ratio (M‐H, Fixed, 95% CI) | 0.08 [0.00, 1.40] |
| 18 NDI (with CP, visual defect, hearing defect, or cognitive score < 85) at 18 to 22 months Show forest plot | 1 | 51 | Risk Ratio (M‐H, Fixed, 95% CI) | 0.27 [0.08, 0.86] |
| 19 BSID‐III composite cognitive score at 18 to 22 months Show forest plot | 1 | 51 | Mean Difference (IV, Fixed, 95% CI) | 7.5 [1.44, 13.56] |
| 20 BSID‐III composite language score at 18 to 22 months Show forest plot | 1 | 51 | Mean Difference (IV, Fixed, 95% CI) | 8.80 [1.57, 16.03] |
| 21 Bayley‐III social/emotional score at 18 to 22 months Show forest plot | 1 | 51 | Mean Difference (IV, Fixed, 95% CI) | 6.80 [‐3.82, 17.42] |
| 22 OP score at 18 to 22 months Show forest plot | 1 | 51 | Mean Difference (IV, Fixed, 95% CI) | 0.60 [0.17, 1.03] |
| 23 WPPSI‐III FSIQ at 3.5 to 4 years of age Show forest plot | 1 | 29 | Mean Difference (IV, Fixed, 95% CI) | 15.27 [2.60, 27.94] |
| 24 WPPSI‐III VIQ at 3.5 to 4 years of age Show forest plot | 1 | 29 | Mean Difference (IV, Fixed, 95% CI) | 9.17 [‐2.86, 21.20] |
| 25 WPPSI‐III PIQ at 3.5 to 4 years of age Show forest plot | 1 | 29 | Mean Difference (IV, Fixed, 95% CI) | 14.97 [1.89, 28.05] |
| 26 WPPSI‐III GLC at 3.5 to 4 years of age Show forest plot | 1 | 29 | Mean Difference (IV, Fixed, 95% CI) | 7.94 [‐4.18, 20.06] |
| 27 Executive function at 3.5 to 4 years of age Show forest plot | 1 | 29 | Mean Difference (IV, Fixed, 95% CI) | 10.81 [2.83, 18.79] |
| 28 Working memory at 3.5 to 4 years of age Show forest plot | 1 | 29 | Mean Difference (IV, Fixed, 95% CI) | 12.77 [2.68, 22.86] |
| 29 Inhibition at 3.5 to 4 years of age Show forest plot | 1 | 29 | Mean Difference (IV, Fixed, 95% CI) | 8.77 [‐2.47, 20.01] |
| Outcome or subgroup title | No. of studies | No. of participants | Statistical method | Effect size |
| 1 BSID‐III composite cognitive score at 18 to 22 months Show forest plot | 1 | 80 | Mean Difference (IV, Fixed, 95% CI) | 7.80 [1.65, 13.95] |
| 2 BSID‐III composite language score at 18 to 22 months Show forest plot | 1 | 80 | Mean Difference (IV, Fixed, 95% CI) | 7.10 [0.49, 13.71] |
| 3 BSID‐III composite social/emotional score at 18 to 22 months Show forest plot | 1 | 80 | Mean Difference (IV, Fixed, 95% CI) | 4.20 [‐5.06, 13.46] |
| 4 OP score at 18 to 24 months Show forest plot | 1 | 80 | Mean Difference (IV, Fixed, 95% CI) | 0.40 [‐0.04, 0.84] |
| 5 BASC‐2 composite scores at 3.5 to 4 years ‐ adaptive skills Show forest plot | 1 | 49 | Mean Difference (IV, Fixed, 95% CI) | 2.54 [‐3.58, 8.66] |
| 6 BASC‐2 composite scores at 3.5 to 4 years ‐ behaviour symptoms Show forest plot | 1 | 49 | Mean Difference (IV, Fixed, 95% CI) | ‐8.66 [‐18.01, 0.69] |
| 7 BASC‐2 composite score at 3.5 to 4 years ‐ externalising problems Show forest plot | 1 | 49 | Mean Difference (IV, Fixed, 95% CI) | ‐8.0 [‐15.94, ‐0.06] |
| 8 BASC‐2 composite scores at 3.5 to 4 years ‐ internalising problems Show forest plot | 1 | 49 | Mean Difference (IV, Fixed, 95% CI) | ‐2.56 [‐9.25, 4.13] |
| 9 WPPSI‐III FSIQ at 3.5 to 4 years of age Show forest plot | 1 | 53 | Mean Difference (IV, Fixed, 95% CI) | 11.90 [0.76, 23.04] |
| 10 WPPSI‐III VIQ at 3.5 to 4 years of age Show forest plot | 1 | 53 | Mean Difference (IV, Fixed, 95% CI) | 8.80 [‐1.75, 19.35] |
| 11 WPPSI‐III PIQ at 3.5 to 4 years of age Show forest plot | 1 | 53 | Mean Difference (IV, Fixed, 95% CI) | 13.5 [1.98, 25.02] |
| 12 WPPSI‐III GLC at 3.5 to 4 years of age Show forest plot | 1 | 53 | Mean Difference (IV, Fixed, 95% CI) | 5.13 [‐5.30, 15.56] |
| 13 Executive function at 3.5 to 4 years Show forest plot | 1 | 53 | Mean Difference (IV, Fixed, 95% CI) | 8.36 [0.51, 16.21] |
| 14 Working memory at 3.5 to 4 years Show forest plot | 1 | 53 | Mean Difference (IV, Fixed, 95% CI) | 9.06 [‐1.06, 19.18] |
| 15 Inhibition at 3.5 to 4 years Show forest plot | 1 | 53 | Mean Difference (IV, Fixed, 95% CI) | 7.60 [‐2.79, 17.99] |
| Outcome or subgroup title | No. of studies | No. of participants | Statistical method | Effect size |
| 1 Time to achieve full enteral feeding (days) Show forest plot | 1 | 50 | Mean Difference (IV, Fixed, 95% CI) | ‐2.90 [‐5.77, ‐0.03] |