Administración temprana de agentes estimulantes de la eritropoyesis en lactantes prematuros o de bajo peso al nacer
Resumen
Antecedentes
Los lactantes prematuros presentan niveles bajos de eritropoyetina (EPO) en plasma, lo cual proporciona un motivo para usar agentes estimulantes de la eritropoyesis (AEE) para prevenir o tratar la anemia y para proporcionar neuroprotección y protección contra la enterocolitis necrosante (ECN). La darbepoyetina (Darbe) y la EPO son AEE actualmente disponibles.
Objetivos
Evaluar la efectividad y la seguridad de la administración temprana (antes de los ocho días después del nacimiento) de AEE (eritropoyetina [EPO] o Darbe) en comparación con placebo o ninguna intervención para reducir las transfusiones de eritrocitos, los resultados neurológicos adversos y la intolerancia a la alimentación incluida la enterocolitis necrosante (ECN) en los lactantes prematuros o de bajo peso al nacer.
Objetivo primario para los estudios que investigan principalmente la efectividad y la seguridad de la administración temprana de AEE para reducir las transfusiones de eritrocitos:
Evaluar la efectividad y la seguridad de la administración temprana de AEE para reducir las transfusiones de eritrocitos en los lactantes prematuros.
Objetivos secundarios:
Los autores de la revisión realizaron análisis de subgrupos de las dosis bajas (≤ 500 UI/kg/semana) y altas (> 500 UI/kg/semana) de EPO y la cantidad de suplementos de hierro proporcionados: ninguna, baja (≤ 5 mg/kg/d) y alta (> 5 mg/kg/d).
Objetivo primario para los estudios que investigan principalmente la efectividad neuroprotectora de los AEE:
Evaluar la efectividad y la seguridad de la administración temprana de AEE para reducir los resultados neurológicos adversos en los lactantes prematuros.
Objetivo primario para los estudios que principalmente investigan la efectividad de la EPO o la Darbe administradas de forma temprana para reducir la intolerancia a la alimentación:
Evaluar la efectividad y la seguridad de la administración temprana de AEE para reducir la intolerancia a la alimentación (y la ECN) en los lactantes prematuros.
Otros objetivos secundarios:
Comparar la efectividad de los AEE para reducir la incidencia de eventos adversos y mejorar los resultados del desarrollo nervioso a largo plazo.
Métodos de búsqueda
Se utilizó la estrategia de búsqueda estándar del Grupo Cochrane de Neonatología en el Registro Cochrane Central de Ensayos Controlados (CENTRAL; 2017, Número 2), MEDLINE vía PubMed (1966 hasta el 10 marzo 2017), Embase (1980 hasta el 10 de marzo 2017) y en Cumulative Index to Nursing and Allied Health Literature (CINAHL; 1982 al 10 de marzo 2017). También se buscaron ensayos controlados aleatorios y cuasialeatorizados en las bases de datos de ensayos clínicos, las actas de congresos y las listas de referencias de los artículos recuperados.
Criterios de selección
Ensayos controlados aleatorizados y cuasialeatorizados de la administración temprana del tratamiento con AEE versus placebo o ninguna intervención en los lactantes prematuros o de bajo peso al nacer.
Obtención y análisis de los datos
Se utilizaron los métodos descritos en el Manual Cochrane para Revisiones Sistemáticas de Intervenciones (Cochrane Handbook for Systematic Reviews of Interventions) y el enfoque GRADE para evaluar la calidad de la evidencia.
Resultados principales
Esta revisión actualizada incluye 34 estudios con 3643 lactantes. Todos los análisis compararon AEE versus un control que constó de placebo o ningún tratamiento.
Los AEE tempranos redujeron el riesgo de "uso de una o más transfusiones de glóbulos rojos" (riesgo relativo típico (RR) 0,79, intervalo de confianza (IC) del 95%: 0,74 a 0,85; diferencia de riesgos típica (DR) ‐0,14, IC del 95%: ‐0,18 a ‐0,10; I2 = 69% para el RR y 62% para la DR (heterogeneidad moderada); número necesario a tratar para un resultado beneficioso adicional (NNTB) 7, IC del 95%: 6 a 10; 19 estudios, 1 750 neonatos). La calidad de la evidencia era baja.
La enterocolitis necrotizante se redujo de forma significativa en el grupo de AEE en comparación con el grupo de placebo (RR típico 0,69; IC del 95%: 0,52 a 0,91; DR típica ‐0,03; IC del 95%: ‐0,05 a ‐0,01; I2 = 0% para RR y 22% para DR (baja heterogeneidad); NNTB 33; IC del 95%: 20 a 100; 15 estudios, 2639 lactantes). La calidad de la evidencia fue moderada.
Los datos mostraron una reducción en “cualquier deficiencia en el desarrollo nervioso a los 18 a 22 meses” de edad corregida en el grupo de AEE (RR típico 0,62; IC del 95%: 0,48 a 0,80; DR típica ‐0,08, IC del 95%: ‐0,12 a ‐0,04; NNTB 13, IC del 95%: 8 a 25. I2 = 76% para el RR [heterogeneidad alta] y 66% para la DR [moderada]; cuatro estudios, 1130 lactantes). La calidad de la evidencia era baja.
Los resultados revelan puntuaciones mayores en el Bayley‐II Mental Development Index (MDI) a los 18 a 24 meses en el grupo de AEE (diferencia de medias ponderada [DMP] 8,22; IC del 95%: 6,52 a 9,92; I2 = 97% (heterogeneidad alta); tres estudios, 981 niños. La calidad de la evidencia era baja.
El volumen total de eritrocitos transfundidos por lactante se redujo en 7 mL/kg. El número de transfusiones de eritrocitos por lactante se redujo de forma mínima, aunque el número de donantes a los que estuvieron expuestos los lactantes que recibieron transfusiones no presentó una reducción significativa. Los datos no muestran diferencias significativas en el riesgo de retinopatía del prematuro (RP) en estadio ≥ 3 con EPO temprana (RR típico 1,24, IC del 95%: 0,81 a 1,90; DR típica 0,01, IC del 95%: ‐0,02 a 0,04; I2 = 0% (sin heterogeneidad) para el RR; I2 = 34% (baja heterogeneidad) para la DR; ocho estudios, 1283 lactantes). La mortalidad no fue afectada, aunque los resultados muestran reducciones significativas en la incidencia de hemorragia intraventricular (HIV) y leucomalacia periventricular (LPV).
Conclusiones de los autores
La administración temprana de AEE reduce el uso de transfusiones de eritrocitos, el volumen de eritrocitos transfundidos y la exposición a donantes después del ingreso al estudio. Es probable que las reducciones pequeñas tengan una importancia clínica limitada. Probablemente no puede evitarse la exposición a los donantes, debido que todos excepto un estudio incluyeron a lactantes que habían recibido transfusiones de eritrocitos antes del ingreso al ensayo. Esta actualización no encontró ninguna diferencia significativa en la tasa de RP (estadio ≥ 3) para los estudios que iniciaron el tratamiento con EPO antes de los ocho días de edad, lo cual ha sido un tema de interés en las versiones anteriores de esta revisión. El tratamiento temprano con EPO redujo de forma significativa las tasas de HIV, LPV, y ECN. Los resultados del desarrollo nervioso a los 18 a 22 meses y posteriormente variaron en los estudios publicados. La investigación en curso debe evaluar las prácticas clínicas actuales que limitarán la exposición a los donantes. Los resultados prometedores pero conflictivos relacionados con el efecto neuroprotector de la administración temprana de EPO requieren estudio adicional. Los resultados muy diferentes de los dos ensayos más grandes publicados y la heterogeneidad alta en los análisis indican que se deben esperar los resultados de dos ensayos grandes en curso antes de establecer conclusiones firmes. La administración de EPO no se recomienda actualmente debido a que hasta la fecha se han identificado beneficios limitados. Se requieren más estudios sobre el uso de la darbepoyetina.
PICO
Resumen en términos sencillos
Administración temprana de agentes estimulantes de la eritropoyesis en lactantes prematuros o de bajo peso al nacer
Preguntas de la revisión: ¿La administración temprana de eritropoyetina o darbepoyetina (iniciada antes de los ocho días después del nacimiento) es efectiva y segura para reducir las transfusiones de eritrocitos entre los lactantes prematuros o de bajo peso al nacer? ¿La administración temprana de eritropoyetina o darbepoyetina presenta una función neuroprotectora? ¿Estos agentes protegen contra la enterocolitis necrozante?
Antecedentes: En todos los neonatos, el número de eritrocitos en circulación desciende después del nacimiento. En los lactantes nacidos antes de término, esta tendencia se ve acentuada por las frecuentes extracciones de sangre, que son necesarias para monitorizar el estado clínico del neonato. Por lo tanto, es probable que los lactantes prematuros requieran transfusiones de eritrocitos. Los bajos niveles de eritropoyetina (EPO), una sustancia en la sangre que estimula la producción de eritrocitos en lactantes prematuros, son el fundamento para el uso de EPO en la prevención y el tratamiento de la anemia. La EPO puede administrarse de manera "temprana" (antes de que el lactante alcance los ocho días de vida) para prevenir o reducir el uso de transfusiones de eritrocitos. Hay cada vez más evidencia que indica que la EPO puede proteger contra el daño neurológico y el daño a los intestinos.
Características de los estudios: Se identificaron 34 estudios que utilizaron este enfoque e incluyeron a un total de 3643 lactantes que nacieron antes de término. Se han realizado estudios de calidad variable en muchos países diferentes.
Resultados clave: El tratamiento temprano con EPO redujo el número de transfusiones de eritrocitos y exposiciones a donantes después de su uso. Sin embargo, el efecto beneficioso general de la EPO puede no ser clínicamente importante, ya que muchos de estos lactantes habían estado expuestos a transfusiones de eritrocitos antes del ingreso a los ensayos. El tratamiento temprano con EPO no altera el riesgo de muerte ni la retinopatía de la prematuridad y puede reducir el riesgo de daño neurológico y el daño a los intestinos. También puede mejorar los resultados a largo plazo.
Calidad de la evidencia: Según GRADE, la calidad de los resultados principales varió de alta a baja.
Conclusiones: Sobre la base de los hallazgos, actualmente no se recomienda la administración temprana habitual de eritropoyetina en los lactantes prematuros. Los estudios en curso pueden brindar aclaraciones sobre la posibilidad de que la eritropoyetina pueda reducir los riesgos de resultados adversos del desarrollo nervioso y la enterocolitis necrosante.
Authors' conclusions
Summary of findings
| Erythropoietin compared with placebo or no treatment for complications of preterm birth ‐ primary outcomes | ||||||
| Patient or population: preterm infants with low birth weight Settings: NICU Intervention: EPO Comparison: placebo or no treatment | ||||||
| Outcomes | Illustrative comparative risks* (95% CI) | Relative effect | No. of participants | Quality of the evidence | Comments | |
| Assumed risk | Corresponding risk | |||||
| Placebo or no treatment | EPO | |||||
| Use of 1 or more red blood cell transfusions (low and high doses of EPO) | High‐risk population | RR: 0.79 (95% CI 0.74 to 0.85) | 1750 | ⊕⊕⊝⊝ | Bias: We had concerns about performance bias and detection bias in 10 of the studies. We downgraded the quality of the evidence by 1 step. Heterogeneity/Consistency: I2 for the typical RR was 69% and for the typical RD 62% (both moderate quality). We downgraded the quality of the evidence by 1 step. Directness of evidence: Studies were conducted in the target population. Precision: Because of the large sample size (n = 1750), the point estimate was precise with a narrow 95% CI. Presence of publication bias: The funnel plot was symmetrical for all larger studies. | |
| 694 per 1000 | 522 per 1000 | |||||
| Any neurodevelopmental impairment at 18 to 22 months' corrected age (in children examined) | High‐risk population | RR: 0.62 (95% CI 0.48 to 0.80) | 1130 (4) | ⊕⊕⊝⊝ | Bias: We had concerns about performance bias and detection bias in 1 of the studies, the largest (n = 613) (Song 2016). This study carried a weight of 48.7% in the analysis. We downgraded the quality of the evidence by 1 step. Heterogeneity/Consistency: I2 for the typical RR was 76% (high) and for the typical RD 66% (moderate). We downgraded the quality of the evidence by 1 step. Directness of evidence: Studies were conducted in the target population. Precision: Because of the large sample size (n = 1130), the point estimate was precise with a narrow 95% CI. Presence of publication bias: Although only 4 studies were included in the funnel plot, the funnel plot was symmetrical. | |
| 210 per 1000 | 128 per 1000 | |||||
| Bayley‐II MDI at 18 to 24 months Bayley Scales of Infant Development, Second Edition, yields 2 single age‐standardised composite scores (range 50 to 150): a Mental Development Index (MDI), which measures cognition through sensory perception, knowledge, memory, problem‐solving and early language abilities; and a Psychomotor Development Index (PDI), which assesses fine and gross motor skills. | Mean Bayley‐II MDI ranged across control groups from 84.1 to 94.5. | Mean Bayley‐II MDI at 18 to 24 months in the intervention groups was 8.22 higher (95% CI 6.52 to 9.92) | WMD: 8.22 (95% CI 6.52 to 9.92) | 981 | ⊕⊕⊝⊝ | Bias: We had concerns about performance bias and detection bias in one of the studies (Song 2016). We downgraded the quality of the evidence by 1 step. Song 2016 carried a weight in the analysis of 76.2%. Heterogeneity/Consistency: I2 for the WMD was 97% (high). We downgraded the quality of the evidence by 1 step. Directness of evidence: Studies were conducted in the target population. Precision: Because of the large sample size (n = 981), the point estimate was precise with a narrow 95% CI. Presence of publication bias: As only 3 studies were included, we did not prepare a funnel plot. |
| Necrotising enterocolitis (stage not reported) | High‐risk population | RR: 0.69 (95% CI 0.52 to 0.91) | 2639 | ⊕⊕⊕⊝ | Bias: We had concerns about performance bias and detection bias in 6 of the studies, especially for Song 2016, the only study that showed a significant reduction in NEC. It carried a weight in the analysis of 47.8%. We downgraded the quality of the evidence by 1 step. Heterogeneity/Consistency: I2 for the typical RR was 0% and for the typical RD 22% (both low). Directness of evidence: Studies were conducted in the target population. Precision: Because of the large sample size (n = 2639), the point estimate was precise with a narrow 95% CI. Presence of publication bias: The funnel plot was symmetrical. | |
| 84 per 1000 | 57 per 1000 | |||||
| *The basis for the assumed risk (e.g. the median control group risk across studies) is provided in footnotes. The corresponding risk (and its 95% confidence interval) is based on the assumed risk in the comparison group and the relative effect of the intervention (and its 95% CI). | ||||||
| GRADE Working Group grades of evidence. | ||||||
| Erythropoietin compared with placebo or no treatment for complications of preterm birth | ||||||
| Patient or population: preterm infants with low birth weight Settings: NICU Intervention: EPO Comparison: placebo or no treatment | ||||||
| Outcomes | Illustrative comparative risks* (95% CI) | Relative effect | No. of participants | Quality of the evidence | Comments | |
| Assumed risk | Corresponding risk | |||||
| Placebo or no treatment | EPO | |||||
| Mortality during initial hospital stay (all causes of mortality) | High‐risk population | RR: 0.89 (95% CI 0.68 to 1.16) | 2212 | ⊕⊕⊕⊕ | Bias: We had concerns about bias (lack of blinding) in 10 of the included studies, but the outcome of mortality is not likely to be affected by researchers knowing the treatment assignment. We did not downgrade the quality of evidence on this item. Heterogeneity/Consistency: We noted no heterogeneity (I2 = 0%). Directness of evidence: Studies were conducted in the target population. Precision: Because of the large sample size (2212), the point estimate was precise with a narrow 95% CI. Presence of publication bias: The funnel plot was symmetrical. | |
| 92 per 1000 | 82 per 1000 | |||||
| Retinopathy of prematurity (stage ≥ 3) | High‐risk population | RR: 1.24 (95% CI 0.81 to 1.90) | 1283 | ⊕⊕⊕⊕ | Bias: We found no risk of bias in any of the studies, except in the smallest study that enrolled 40 neonates. We did not downgrade the quality of evidence. Heterogeneity/Consistency: We noted no heterogeneity for RR (I2 = 0%) and low (I2 = 34%) heterogeneity for RD. Directness of evidence: Studies were conducted in the target population. Precision: Because of the large sample size (n = 1283), the point estimate was precise with a narrow 95% CI. Presence of publication bias: The funnel plot, which included 8 studies, was symmetrical. | |
| 53 per 1000 | 65 per 1000 | |||||
| Intraventricular haemorrhage (grades III and IV) | High‐risk population | RR: 0.60 (95% CI 0.43 to 0.85) | 1460 | ⊕⊕⊕⊝ | Bias:The intervention was not blinded in the largest study, Song 2016 (n= 743). That study carried a weight of 72.8% in the analysis and was the only individual study that showed a significant reduction in IVH (grades III and IV). We downgraded the quality of the evidence by 1 step. Heterogeneity/Consistency: Heterogeneity was low (I2 = 45%). Directness of evidence: Studies were conducted in the target population. Precision: Because of the large sample size (n = 1460), the point estimate was precise with a narrow 95% CI. Presence of publication bias: The funnel plot, which included 8 studies, was symmetrical. | |
| 111 per 1000 | 67 per 1000 | |||||
| Periventricular leukomalacia | High‐risk population | RR: 0.66 (95% CI 0.48 to 0.92) | 1469 | ⊕⊕⊕⊝ | Bias: The intervention was not blinded in the largest study, Song 2016 (n = 743). That study carried a weight of 89.2% in the analysis and was the only individual study that showed a significant reduction in PVL. We downgraded the quality of the evidence by 1 step. Directness of evidence: Studies were conducted in the target population. Precision: Because of the large sample size (n = 1469), the point estimate was precise with a narrow 95% CI. Presence of publication bias: The funnel plot, which included 6 studies, was symmetrical. | |
| 111 per 1000 | 71 per 1000 | |||||
| Survivors at discharge from hospital without severe IVH, PVL, ROP | High‐risk population | RR: 1.00 (95% CI 0.93 to 1.08) | 443 | ⊕⊕⊕⊕ | Bias: We noted low risk of bias. Heterogeneity/Consistency: N/A, as only 1 study. Directness of evidence: The study was conducted in the target population. Precision: Because of the relatively large sample size (n = 443), the point estimate was precise with a narrow 95% CI. Presence of publication bias: As only 1 study was included, we did not develop a funnel plot. | |
| 855 per 1000 | 856 per 1000 | |||||
| Time to achieve full enteral feeding (days) | Mean time to achieve full enteral feeding was 16.3 days (SD 5.3) in the control group. | Mean time to achieve full enteral feeding in the intervention groups was 2.90 days shorter. | MD: ‐2.90 (95% CI ‐5.77 to ‐0.03) | 50 | ⊕⊕⊝⊝ | Bias: We had concerns about blinding of the intervention and outcome assessments. We downgraded the quality of evidence by 1 step. Heterogeneity/Consistency: N/A, as only 1 study. Directness of evidence: The study was conducted in the target population. Precision: Because of the small sample size (n = 50), the 95% CI around the point estimate was wide. Presence of publication bias: As only 1 study was included, we did not prepare a funnel plot. |
| *The basis for the assumed risk (e.g. the median control group risk across studies) is provided in footnotes. The corresponding risk (and its 95% confidence interval) is based on the assumed risk in the comparison group and the relative effect of the intervention (and its 95% CI). | ||||||
| GRADE Working Group grades of evidence. | ||||||
| Erythropoietin compared with placebo or no treatment for complications of preterm birth ‐ long‐term outcomes | ||||||
| Patient or population: preterm infants with low birth weight Settings: NICU Intervention: EPO Comparison: placebo or no treatment | ||||||
| Outcomes | Illustrative comparative risks* (95% CI) | Relative effect | No. of participants | Quality of the evidence | Comments | |
| Assumed risk | Corresponding risk | |||||
| Placebo | EPO | |||||
| Cerebral palsy at 18 to 24 months' corrected age | High‐risk population | RR: 0.72 (95% CI 0.46 to 1.13) | 1172 | ⊕⊕⊕⊕ | Bias: Low risk of bias. All assessors of long‐term outcomes were blinded in all trials. In Song 2016, treatment allocation was known to caregivers and probably parents, who could have possibly disclosed that information to assessors at long‐term follow‐up. We did not downgrade the quality of the evidence. Heterogeneity/Consistency: Heterogeneity was low for this outcome (I2 = 48%). We did not downgraded the evidence. Directness of evidence: Studies were conducted in the target population. Precision: Because of the large sample size (n = 1172), the point estimate was precise with a narrow 95% CI. Presence of publication bias: We included 6 studies in the analysis; we did prepare a funnel plot, which was symmetrical. | |
| 70 per 1000 | 50 per 1000 | |||||
| *The basis for the assumed risk (e.g. the median control group risk across studies) is provided in footnotes. The corresponding risk (and its 95% confidence interval) is based on the assumed risk in the comparison group and the relative effect of the intervention (and its 95% CI). | ||||||
| GRADE Working Group grades of evidence. | ||||||
| Darbe or EPO (ESA) compared with sham injection for neuro protection ‐ long‐term outcomes | ||||||
| Patient or population: neonates born preterm with low birth weight Settings: NICU Intervention: Darbe or EPO (ESA) Comparison: sham injection | ||||||
| Outcomes | Illustrative comparative risks* (95% CI) | Relative effect | No. of participants | Quality of the evidence | Comments | |
| Assumed risk | Corresponding risk | |||||
| Sham injection | ESA | |||||
| BSID‐III composite cognitive scores at 18 to 22 months The Bayley‐III has 3 main sub tests: the Cognitive Scale, which includes items such as attention to familiar and unfamiliar objects, looking for a fallen object, and pretend play; the Language Scale, which taps understanding and expression of language, for example, recognising objects and people, following directions, and naming objects and pictures; and the Motor Scale, which assesses gross and fine motor skills such as grasping, sitting, stacking blocks, and climbing stairs. | Mean BSID‐III in the control group was 88.7 units (SD 13.5). | Mean BSID‐III in the intervention group was 7.80 units higher. | MD 7.80 (95% CI 1.65 to 13.95) | 80 | ⊕⊕⊕⊝ | Bias: Risk of bias was low, but the sample followed was small. We did not reduce the quality of evidence. Heterogeneity/Consistency: Only 1 study was included, so the test for heterogeneity was N/A. Directness of evidence: The study was conducted in the target population. Precision: Because of the small sample size (n = 80), the point estimate had a wide 95% CI. We downgraded the quality of evidence by 1 step. Presence of publication bias: N/A, as only 1 study was included. |
| WPPSI‐III FSIQ at 3.5 to 4 years of age Composite scores have a mean of 100 and a standard deviation of 15. Average is 90 to 109. | Mean WPPSI‐III FSIQ in the control group was 79.2 units (SD 18,5). | Mean WPPSI‐III FSIQ in the intervention group was 11.90 units higher. | MD 11.90 (95% CI 0.76 to 23.04) | 53 | ⊕⊕⊝⊝ | Bias: Risk of bias was low, but the sample followed was even smaller than at 18 to 22 months of age (n = 53). We did reduce the quality of evidence by 1 step. Heterogeneity/Consistency: Only 1 study was included, so the test for heterogeneity was N/A. Directness of evidence: The study was conducted in the target population. Precision: Because of the small sample size (n = 53), the point estimate had a large 95% CI. We downgraded the quality of evidence by 1 step. Presence of publication bias: N/A, as only 1 study was included, |
| *The basis for the assumed risk (e.g. the median control group risk across studies) is provided in footnotes. The corresponding risk (and its 95% confidence interval) is based on the assumed risk in the comparison group and the relative effect of the intervention (and its 95% CI). | ||||||
| GRADE Working Group grades of evidence. | ||||||
Background
Description of the condition
After birth, the haemoglobin concentration of newborn infants normally falls to minimal levels of 11 g/dL in term infants by 8 to 12 weeks of age, and to 7.0 to 10.0 g/dL in preterm infants by 6 weeks of age (Stockman 1978). This process is called 'physiological anaemia of infancy' (Strauss 1986). In very low birth weight (VLBW) infants, hematocrit falls to approximately 24% in infants weighing 1.0 to 1.5 kg, and to 21% in infants weighing less than 1.0 kg, at birth (Stockman 1986). In extremely low birth weight (ELBW) infants, this decline in hematocrit to levels below 7.0 to 10.0 g/dL is called 'anaemia of prematurity' and is associated with clinical findings such as pallor, poor weight gain, decreased activity, tachypnoea, tachycardia, and feeding problems that prompt red blood cell (RBC) transfusions. Repeated blood draws, shortened RBC survival, rapid growth, and attenuated erythropoietin (EPO) response all contribute to anaemia of prematurity. To our knowledge, the diagnostic accuracy of different clinical signs and laboratory findings has not been studied (Cohen 1998). It is still unknown how low hematocrit levels can fall before clinical signs of anaemia of prematurity occur, and what minimal hematocrit level is acceptable in infants requiring supplemental oxygen (Ohls 2002). A rational guide for transfusion therapy for all anaemic neonates, whether ventilated or not, is not available (Cohen 1998). Nevertheless, 'top‐up' transfusions are frequently used to treat low haemoglobin or low hematocrit levels. As many as 80% of VLBW infants and 95% of ELBW infants receive blood transfusions during hospitalisation (Widness 1996). A Cochrane review titled 'Low versus high haemoglobin concentration threshold for blood transfusion for preventing morbidity and mortality in very low birth weight infants' concludes, "The use of restrictive as compared to liberal haemoglobin thresholds in infants of very low birth weight results in modest reductions in exposure to transfusion and in haemoglobin levels. Restrictive practice does not appear to have a significant impact on death or major morbidities at first hospital discharge or at follow‐up" (Whyte 2011).
Preterm birth and hypoxic Ischaemic encephalopathy (HIE) are conditions that frequently result in death or mental or physical impairment among survivors (Juul 2012). Several reviews examining the neuro protective and neurodegenerative effects of EPO/darbepoetin (Darbe) in the brain have been published, and evidence of its effectiveness is growing (Limperopoulos 2010; Kumral 2011; Juul 2012; Messier 2014; Rangarajan 2014; Patel 2015).
The intestinal barrier is maintained by tight junctions formed between adjacent intestinal epithelial cells. Disruption of tight junctions and loss of barrier function are associated with various gastrointestinal diseases, including neonatal necrotising enterocolitis (NEC) ‐ the leading cause of death from gastrointestinal disease in preterm infants (Shiou 2011).
Description of the intervention
The primary goal of EPO therapy is to reduce the number of transfusions. Most transfusions are given during the first three to four weeks of life. The larger or stable preterm infants, who respond best to EPO, receive few transfusions. ELBW infants, who are sick and have the greatest need for RBC transfusions shortly after birth, have not consistently responded to EPO. This suggests that EPO is a more effective erythropoietic stimulator in more mature neonates. ELBW neonates are more likely to need transfusions even if their erythropoiesis is stimulated by EPO (Kotto‐Kome 2004). In addition, ELBW neonates have a smaller blood volume, and the relatively larger phlebotomy volumes that are required during hospital stay often necessitate 'early' transfusions. In contrast, 'late' transfusions more often are given because of anaemia of prematurity (Garcia 2002). Most preterm infants who require blood transfusions receive their first transfusion in the first two weeks of life (Zipursky 2000). Reducing the number of RBC transfusions reduces the risk of transmission of viral infections and may reduce costs. Frequent RBC transfusions may be associated with retinopathy of prematurity (ROP) (Hesse 1997) and bronchopulmonary dysplasia (BPD).
Preterm infants need iron for erythropoiesis. As neonatal blood volume expands with rapid growth, infants produce large amounts of haemoglobin. Several studies have observed a decrease in serum ferritin concentration during EPO treatment ‐ an indication of iron deficiency (Finch 1982). Use of higher, more effective doses of EPO might be expected to increase iron demand and risk of iron deficiency. Iron supplementation during EPO treatment has been observed to reduce the risk of development of iron deficiency (Shannon 1995a). Iron doses are given to EPO‐treated infants at dosages between 1 mg/kg/d and 10 mg/kg/d (Kotto‐Kome 2004).
How the intervention might work
EPO, with the addition of iron, effectively stimulates erythropoiesis. Plasma EPO levels in neonates are lower than those in older children and adults. Brown and colleagues reported that at between 2 and 30 days of life, the mean EPO concentration was 10 mIU/mL as compared with 15 mIU/mL in concurrently studied adults (Brown 1983). A low plasma EPO level is an important reason that nadir hematocrit values of preterm infants are lower than those of term infants (Dallman 1981; Stockman 1986). Low plasma EPO levels provide a rationale for use of EPO in prevention or treatment of anaemia of prematurity. Studies in newborn monkeys and sheep have demonstrated that neonates have a large volume of distribution and more rapid elimination of EPO, necessitating the use of higher doses than those required for adults. A systematic review of EPO administration in VLBW infants noted a wide range of doses used ‐ from 90 to 1400 IU/kg/week (Kotto‐Kome 2004). Side effects following EPO use in adults include hypertension, bone pain, rash, and, rarely, seizures. Only transient neutropenia has been reported in neonates (Ohls 2000).
"Mechanisms of Epo neuro protection include receptor‐mediated, cell‐specific effects that occur both early and late in the healing process, and non‐specific effects that also modulate the response to injury. EPO has anti‐inflammatory, anti‐excitotoxic, antioxidant and anti‐apoptotic effects on neurons and oligodendrocytes, and promotes neurogenesis and angiogenesis, which are essential for injury repair and normal neurodevelopment. EPO effects are dose dependent, and multiple doses are more effective than single doses" (Juul 2012).
Human milk is protective against NEC, and the human milk factor EPO has been shown to protect endothelial cell‐cell barriers (Shiou 2011). In a rat NEC model, oral administration of EPO statistically significantly lowered the incidence of NEC from 45% to 23% (Shiou 2011).
Why it is important to do this review
The efficacy of EPO in anaemia of prematurity has been systematically reviewed (Vamvakas 2001; Garcia 2002; Kotto‐Kome 2004). Vamvakas and coworkers concluded that variation in results of EPO studies is extreme, and stated that until this variation is better understood, it is too early to recommend EPO as standard treatment for anaemia of prematurity (Vamvakas 2001). Garcia 2002 concluded that administering EPO to VLBW neonates can result in a modest reduction in late erythrocyte transfusions, and that this effect is dependent on the dosage of EPO used. Kotto‐Kome 2004 concluded that if EPO is begun during the first week of life, a moderate reduction can be expected in the proportion of VLBW neonates transfused. This reduction is less significant for early than for late transfusion.
EPO has been found to have important non‐hematopoietic functions in the brain and other organs during development (Juul 2002). Administration of EPO could potentially have a neuro protective effect in preterm infants, especially among those with perinatal asphyxia (Dame 2001; Juul 2002). This aspect of EPO use in neonates with asphyxia will be systematically reviewed separately. In this update of the review, we include administration of EPO/Darbe early in life as neuro protective agents and for protection against NEC.
We therefore performed a series of Cochrane reviews on the use of EPO in preterm infants, including "Early erythropoietin (EPO) for preventing red blood cell transfusion in preterm or low birth weight infants" (starting in infants ≤ 7 days of age; < 8 days of age), versus placebo or no treatment (this review), "Late EPO (starting in infants > 7 days of age; ≥ 8 days of age) versus placebo/no treatment" (Aher 2006a) and "Early versus late EPO" (as per previous definitions) (Aher 2006b). These reviews were all updated in 2009 and 2012 (Aher 2012; Aher 2012a; Ohlsson 2012). We chose the cutoff of ≤ 7 days of age for early and > 7 days of age for late treatment with EPO, although somewhat arbitrary, on the basis of previously published meta‐analyses (Garcia 2002; Kotto‐Kome 2004), to allow us to compare results of our reviews versus results of previously published reviews.
This review concerns early administration of EPO (starting in infants ≤ 7 days of age). The main rationale for such EPO therapy is to reduce exposure of neonates to red blood cell transfusion and its associated risks. Between 60% and 100% of preterm infants are transfused before three weeks of age (Shannon 1995a; Juul 1999; Zipursky 2000), and EPO administered during this period might decrease the need for RBC transfusions (Brown 1990; Kotto‐Kome 2004). Several studies have concentrated on the effectiveness of EPO, beginning in the first week of life, in reducing or eliminating these 'early' transfusions. We conducted a systematic review to evaluate all available studies in which investigators started EPO treatment during the first week of life to assess its effect on erythrocyte transfusions. For this update, we include early use of EPO for neuro protection and for prevention of NEC.
A slightly modified long‐acting version of EPO, darbepoetin alfa (Darbe), has been introduced (Egrie 2001). Darbepoetin was created by modifying five amino acids of the original EPO protein to generate two additional carbohydrate‐binding sites, thereby significantly increasing circulating half‐life and effectiveness. Compared with EPO, darbepoetin has an approximately three‐fold longer serum half‐life and greater in vivo potency, and can be administered less frequently to obtain the same biological response. A single subcutaneous dose of Darbe has been shown to accelerate erythropoiesis in preterm infants (Warwood 2005).
Objectives
To assess the effectiveness and safety of erythropoiesis‐stimulating agents (ESAs) (erythropoietin (EPO) and/or Darbe) initiated early (before eight days after birth) compared with placebo or no intervention in reducing red blood cell (RBC) transfusions, adverse neurological outcomes, and feeding intolerance and necrotising enterocolitis (NEC) in preterm and/or low birth weight infants.
Primary objective for studies that primarily investigate the effectiveness and safety of EPO or Darbe administered early in reducing red blood cell transfusions
To assess the effectiveness and safety of EPO or Darbe initiated early (before eight days after birth) in reducing red blood cell transfusions in preterm and/or low birth weight infants.
Secondary objectives
Review authors performed subgroup analyses of low (≤ 500 IU/kg/week) and high (> 500 IU/kg/week) doses of EPO and the amount of iron supplementation provided: none, low (≤ 5 mg/kg/d), and high (> 5 mg/kg/d).
Primary objective for studies that primarily investigate the neuro protective effectiveness of EPO or Darbe
To assess the effectiveness and safety of EPO or Darbe initiated early (before eight days after birth) in reducing adverse neurological outcomes in preterm and/or low birth weight infants.
Primary objective for studies that primarily investigate the effectiveness of EPO or Darbe administered early in reducing feeding intolerance
To assess the effectiveness and safety of EPO or Darbe administered early (before eight days after birth) in reducing feeding intolerance (and NEC) in preterm and/or low birth weight infants.
Other secondary objectives
To compare the effectiveness of ESAs in reducing the incidence of adverse events and improving long‐term neurodevelopmental outcomes.
Métodos
Obtención y análisis de los datos
Evaluación del riesgo de sesgo de los estudios incluidos
Results
Description of studies
Results of the search
We have presented results of our searches in the 'Study flow diagram' (Figure 1). Two studies reported on two separate populations in the same study; we treated these reports as separate studies for purposes of analysis (Kremenopoulos 1997A; Kremenopoulos 1997B; and Ohls 2001A; Ohls 2001B). We included seven new studies in the 2017 update (Kremenopoulos 1997A; Kremenopoulos 1997B; El‐Ganzoury 2014; Fauchère 2015; Song 2016; Peltoniemi 2017; Qiao 2017). We identified six new long‐term follow‐up reports from previously published original studies. They are listed under the primary study reports (Fauchère 2015; Ohls 2013). Song 2016 included long‐term follow‐up in the primary report.

Study flow diagram: review update.
We included in this update 34 studies randomising 3643 infants, representing an increase of 1434 participants from the 2014 update. Studies were performed in 22 countries (Austria, Bangladesh, Belgium, Chile, China, Egypt, Finland, France, Germany, Greece, Iran, Italy, Mexico, Netherlands, New Zealand, Poland, Singapore, South Africa, Switzerland, Turkey, UK, and USA). Ohls 2013 randomised 102 infants to darebpoetin alfa (Darbe), EPO, or sham injection. This was the first study conducted to assess the effectiveness and safety of Darbe. We report separately on three comparisons in that study: Darbe versus no treatment, EPO versus no treatment, and EPO and Darbe (ESA) versus no treatment.
We excluded three additional studies from this 2017 update (Al Mofada 1994; Basiri 2015; López‐Catzín 2015). Al Mofada 1994 reported the volume of RBC transfusions in mL/week averaged over the study period ‐ not as total volume (mL/kg) of blood transfused per infant. In Basiri 2015, infants were > 6 days old at enrolment, and we will include this study in the update of the 'Late EPO' review. When contacted, one of the trial authors confirmed that López‐Catzín 2015 was not an RCT.
All included studies fulfilled our inclusion criteria of gestational age < 37 weeks and/or birth weight < 2500 grams. Inclusion of infants in the studies was based on postmenstrual age (PMA) or birth weight or a combination of the two. The highest cutoff for birth weight was 1800 grams, and the highest cutoff for PMA was 35 weeks (Chang 1998). The lowest cutoff for birth weight was 401 grams (Ohls 2001A). Most studies used an upper cutoff for birth weight of 1500 grams and a PMA of 32 to 33 weeks.
EPO was administered subcutaneously (SC) or intravenously (IV), or IV then SC, when intravenous access was no longer available. Dosage ranged from 70 IU/kg/week in Obladen 1991 to 2100 IU/kg/week in Haiden 2005. The duration of EPO treatment ranged from two weeks in Ohls 1995 and Ohls 1997 to nine weeks in Maier 2002 or to discharge from hospital (several studies). Fauchère 2008 and Fauchère 2015 were designed to ascertain whether IV administration of high‐dose EPO (3000 IU rhEPO/kg body weight) at three to six, 12 to 18, and 36 to 42 hours after birth would have a neuro protective effect. In those studies, no infant was treated at a later time with EPO.
Researchers used many different EPO preparations: EPREX 2000, Santa‐Farma‐Gurel, Istanbul (Arif 2005); Eprex, Cilag, Italy (Carnielli 1998); Cilag A.G., Zug, Switzerland (Kremenopoulos 1997A; Kremenopoulos 1997B; Soubasi 1993; Soubasi 1995; Soubasi 2000); Eprex 4000, Cilag de Mexico S.A. de C.V. (Lima‐Rogel 1998); Eprex, Janssen‐Cilag, Auckland, New Zealand (Meyer 2003); Eprex, Cilag comp (Khatami 2008); Eprex (Peltoniemi 2017); Recormon, Boehringer (Lauterbach 1995; Avent 2002); NeoRecormon, F. Hoffman‐La Roche, Basel, Switzerland (Maier 2002); Epoetin beta, Boehringer‐Mannheim, GmbH, Germany (Obladen 1991; Maier 1994); Kirin Brewery, Co., Ltd., Japan (Chang 1998); unnamed product (Carnielli 1992; Ohls 1995; Ohls 1997; Yeo 2001; Ohls 2001A; Ohls 2001B; He 2008; Yasmeen 2012; Ohls 2013; Song 2016; Qiao 2017); Erypo, Janssen‐Cilag Pharmaceuticals, Vienna, Austria (Meister 1997; Haiden 2005); Eritropoyetina del Laboratorio Andromaco, Penalolen, Chile (Salvado 2000); Epoietin beta, Roche, Basel, Switzerland (Fauchère 2008; Fauchère 2015); Epoetin, SEDICO Pharmaceuticals, 6th of October City, Egypt (El‐Ganzoury 2014).
One study stated previous donor exposure as an exclusion criterion (Arif 2005). Maier 1994 included 28 infants (23%) in the EPO group and 17 (14%) in the control group, who had received RBC transfusions before study entry. Maier 2002 reported that 24 (32%) of the infants in the early EPO group and 22 (31%) in the control group were exposed to donor blood before they entered the study. Ohls 2013 reported that 17% of infants were transfused before study entry. Authors of the remaining studies reported their specific exclusion criteria but did not list prior transfusion as an exclusion criterion. We assumed that infants who had received prior RBC transfusions were included.
We have provided details of the transfusion guidelines in the Additional tables (Table 1. Transfusion guidelines). As noted in the table, transfusion guidelines were based on various hematocrit (Hct) or haemoglobin (Hgb) levels. In addition, researchers used many other criteria, such as need for assisted ventilation, supplemental oxygen, age of the infant, weight gain, clinical condition, and physiological or biochemical signs thought to be associated with anaemia. For a few studies, we were unable to categorise different guidelines that could be used meaningfully for secondary analyses. We excluded from this update analyses based on transfusion information.
| Reference | Indications |
| Infants with Hgb concentrations < 7 g/dL and with a reticulocyte count lower than < 100,000/µL or Hgb concentrations < 8 g/dL having bradycardia, tachypnoea, or apnoea, or who were not able to gain weight despite adequate calorie intake, were chosen as candidates for blood transfusion. | |
| Infants received blood transfusions if they met the following criteria: | |
| Infants were transfused during the first week of life with packed erythrocytes if the Hct level was < 42% or 36%, depending on whether or not the patient was receiving supplemental oxygen. After the first week of life, indications for transfusions were Hct < 36% for oxygen‐dependent patients and 32% if breathing room air. Anaemia was the only indication for giving packed erythrocytes to all infants. | |
| Infants received transfusions of packed cells during the first week of life if their peripheral Hct (heel stick) was < 42% or 36%, depending on whether or not the patient was receiving supplemental oxygen. | |
| Transfusion guidelines not provided | |
| Transfusion guidelines not provided | |
| Transfusion guidelines not provided | |
| Transfusion guidelines not provided | |
| Infants were transfused at Hct < 20%: | |
| Transfusion guidelines are not reported in the English abstract of this study. We have requested the full text in Chinese from trial authors. | |
| "Guidelines for red‐cell transfusions were based on the relatively strict existing policy in the nursery which was used to administer transfusions during the study period". | |
| Transfusions were ordered by the clinicians caring for each infant without consulting the investigators, based on general guidelines for erythrocyte transfusions. According to these guidelines, neonates who were well received transfusions if their hematocrit was < 30% during the third week, < 25% during the fourth week, and < 23% after the first month of life, combined with signs referable to their anaemia, such as poor weight gain, episodes of persistent bradycardia or tachycardia, and apnoea. Neonates with severe respiratory disease (bronchopulmonary dysplasia), particularly those requiring oxygen and/or ventilator support, were given transfusions to maintain their hematocrit level at > 40%. | |
| See Kremenopoulos 1997A, | |
| Transfusion was given when the Hct level reached 28% and if clinical symptoms of tachypnoea, tachycardia, and bradycardia were present at Hct of 0.32. | |
| According to criteria published by Klaus and Fanaroff (see text for more info) | |
| Infants who were receiving ventilation or who were less than 2 weeks old and had signs of anaemia were given transfusions if their Hct fell below 40%, their Hgb concentration fell below 14 g/dL (8.7 mmol/L), or blood samples totaling at least 9 mL/kg had been obtained from them since their previous transfusion. | |
| Infants with artificial ventilation or > 40% of inspired oxygen were not transfused unless Hct dropped below 0.40. | |
| Infants more than 2 weeks old who had been breathing spontaneously and whose FiO2 was less than 0.40 were given transfusions if they had signs of anaemia and their Hct fell below 11 g/dL (6.8 mmol/L); if they had no signs of anaemia, corresponding cutoff values were 27% and 9 g/dL (5.6 mmol/L). | |
| Indications for transfusions were: | |
| Indications for transfusion of packed red cells: | |
| Transfusions were given during the first 3 weeks of life if Hct was < 33%, and if the infant had 1 or more symptoms thought to be due strictly to anaemia. Symptoms were defined as tachycardia (heart rate > 160 beats/min, calculated as the average of all heart rates recorded by the bedside nurse during the preceding 24‐hour period), an increasing oxygen requirement (an increase in fraction of inspired oxygen of > 0.20 during a 24‐hour period), "lethargy" as assessed by the primary caregiver, or an increase in the number of episodes of bradycardia requiring stimulation to increase the heart rate from less than 60 beats/min (an increase of such episodes by 3 or more per day). Infants in both groups whose Hct were > 33% and yet whose phlebotomy losses exceeded 10 mL/kg body weight received an infusion of 5% albumin, administered in aliquots of not less than 10 mL/kg. Infants were not given transfusions if they were free of symptoms, even if Hct fell to < 33%. | |
| Transfusions were administered in both groups according to standardised transfusion criteria: For infants requiring mechanical ventilation, transfusions were given if Hct fell below 33%. For infants not receiving ventilatory support, transfusions were given if Hct fell below 28%, and if the infant was experiencing symptoms. Symptoms were defined as tachycardia (heart rate > 160 beats/min, calculated as the average of all heart rates recorded by the bedside nurse over the preceding 24‐hour period), an increasing oxygen requirement (an increase in FiO2 of > 0.20 over a 24‐hour period, or an elevated lactate level (> 2.5 mmol/L). In some instances, a new donor would be used each day for the newborn intensive care unit (University of Florida), and in other instances, a unit would be dedicated to a single infant for the life of the unit (University of New Mexico and University of Utah). | |
| If Hct ≤ 35%/Hgb ≤ 11 g/dL, transfuse infants requiring moderate or significant mechanical ventilation (MAP > 8 cmH2O and FiO2 > 0.4). | |
| See Ohls 2001A. | |
| The PRBC volume transfused was based on Hct/Hgb, respiratory support, and/or symptoms. If Hct ≤ 30/Hgb ≤ 10 and the infant required moderate/significant ventilation (MAP > 8 cmH2O and FiO2 > 0.4), the PRBC volume to be transfused was 15 to 20 mL/kg. PRBC volume to be transfused was 20 mL/kg. If Hct ≤18/Hgb ≤ 6 and the infant was asymptomatic and absolute reticulocyte count (ARC) was < 100,000 cells/µL, the PRBC volume to be transfused was 20 mL/kg. | |
| Infants with the following respiratory needs received 10 to 15 mL/kg of RBC volume based on Hct: | |
| Transfusion guidelines not reported | |
| Preterm infants with Hct < 20% | |
| Blood transfusion criteria followed strict clinical criteria as used by Vázquez López 2011. | |
| Neonates who were well were transfused if their Hct was < 25% combined with signs referable to their anaemia, such as poor weight gain, persistent episodes of bradycardia or tachypnoea, and apnoea. Neonates with severe respiratory disease (BPD), particularly those requiring oxygen and/or ventilator support, received transfusions to maintain Hct level at > 40%. | |
| Infants who were receiving mechanical ventilation or who were less than 2 weeks old were given transfusion if their Hct fell below 40%. Spontaneously breathing infants more than 2 weeks old whose FiO2 was less than 0.35 were given transfusion if they had signs of anaemia and their Hct fell below 30%; if they had no signs of anaemia, transfusion was given if Hct fell below 0.25. Growing, asymptomatic infants were transfused if Hct fell below 20%. Signs of anaemia included tachycardia, (> 170 beats/min) or tachypnoea (> 70/min) sustained over a 24‐hour period or associated with acute cardiac decompression; recurrent apnoea (respirations absent for 20 seconds) or bradycardia (heart rate < 100 beats/min) in a 24‐hour period not due to other causes and not responsive to methylxanthine treatment; an increase in fractional oxygen requirement by 20% or more over a 24‐hour period; or weight gain < 10 g/d averaged over a 1‐week period while on adequate caloric intake. | |
| Neonates were transfused when Hct was < 20%, if they were asymptomatic, or < 30% if they were receiving O2 < 0.35 and/or unexplained breathing disorders combined with signs referable to their anaemia, such as poor weight gain, episodes of persistent bradycardia or tachycardia. | |
| After discharge from hospital, any patient with Hgb level ≤ 7 g/dL was readmitted to the hospital and managed with packed red cell transfusion. | |
| Infants who were receiving mechanical ventilation or who were less than 2 weeks old were given transfusion if their Hct fell below 40%. Spontaneously breathing infants more than 2 weeks old whose FiO2 was less than 35% were given transfusion if they had signs of anaemia and their Hct fell below 30%; if they had no signs of anaemia, transfusion was given if Hct fell below 25%. Growing, asymptomatic infants were transfused if Hct fell below 20%. Signs of anaemia included tachycardia, (> 170 beats/min) or tachypnoea (> 70/min) sustained over a 24‐hour period or associated with acute cardiac decompression; recurrent apnoea (respirations absent for 20 seconds) or bradycardia (heart rate < 100 beats/min) in a 24‐hour period not due to other causes and not responsive to methylxanthine treatment; increased fractional oxygen requirement by 20% or more over a 24‐hour period; or weight gain < 10 g/d averaged over a 1‐week period while on adequate caloric intake. |
ARC: absolute reticulocyte count.
BPD: bronchopulmonary dysplasia.
CPAP: continuous positive airway pressure.
FiO2: fraction of inspired oxygen.
Hct: hematocrit.
Hgb: haemoglobin.
MAP: mean airway pressure.
PRBC: packed red blood cells.
RBC: red blood cell.
RR: respiratory rate.
All but six studies reported that transfusion guidelines were in place (Chang 1998; Fauchère 2008; He 2008; El‐Ganzoury 2014; Fauchère 2015; Qiao 2017). Lima‐Rogel 1998 referred to the third Spanish edition of 'Care of the high‐risk neonate' by Klaus and Fanaroff for the guidelines they adhered to (Klaus 1987). We were not able to locate that book, but in the third English edition of the book, we could not find transfusion guidelines for preterm infants (Klaus 1986).
In Carnielli 1998, all infants received dedicated units of RBCs. Ohls 1997 stated, "In some instances a new donor would be used each day for the newborn intensive care unit (University of Florida) and in other instances a unit would be dedicated to a single infant for the life of the unit (University of New Mexico and University of Utah)". These two studies did not report on our primary outcome of 'use of one or more RBC transfusions'. In Maier 2002, 12 of the 14 centres used satellite packs of the original red cell pack to reduce donor exposure. In Ohls 2001A and Ohls 2001B), study authors noted, "Whenever possible designated donor units that were capable of providing at least four transfusions were assigned to each infant (available in six of the eight participating centres)". In a secondary (post hoc) analysis, we combined the results of these three studies. Ohls 2013 assigned each infant a matched, leuko‐reduced, citrate‐phosphate‐dextrose adenine anticoagulant‐preserved donor unit, made available in a sterile docking device capable of 50 mL aliquots of packed red blood cells (PRBCs) with four or more transfusions per unit, and a shelf life of 28 days.
Three studies did not administer iron (Fauchère 2008; Fauchère 2015; Peltoniemi 2017). We are awaiting information from He 2008, as the abstract did not mention use of iron. In most studies, both EPO and control groups received iron, but often the dosage given to the control groups was lower. In Carnielli 1992 and Carnielli 1998, infants in the control groups did not receive iron.
Included studies
For details, see the Characteristics of included studies table.
Studies primarily designed to assess the effectiveness and safety of EPO or Darbe initiated early (before eight days after birth) in reducing red blood cell transfusions in preterm and/or low birth weight infants
Arif 2005 was a single‐centre study performed in Istanbul, Turkey.
-
Objective: to determine whether EPO would prevent anaemia of prematurity and reduce the need for transfusion.
-
Population: preterm infants < 33 weeks' gestational age (GA), birth weight < 1500 grams, seven days old, with no previous blood transfusion.
-
Intervention: The EPO group received EPO 200 IU/kg SC from the seventh day of life and continued twice weekly (low dose) for six weeks. Placebo was not given to the control group. Both groups received iron (3 to 5 mg/kg/d orally) (low dose).
-
Outcomes assessed: use of one or more RBC transfusions, mortality, NEC, ROP, BPD, neutropenia, side effects.
Avent 2002 was a two‐centre study performed in South Africa.
-
Objective: to evaluate the effectiveness of early treatment with EPO (both high and low doses) in comparison with conventional treatment with packed RBC transfusions for management of anaemia of prematurity in a country with limited resources.
-
Population: preterm infants < seven days of age, in room air or requiring up to 30% oxygen at study entry, with birth weight between 900 and 1500 grams. Infants were stratified by weight < 1250 grams and > 1250 grams.
-
Intervention: One group received EPO 400 IU/kg SC three times a week (high dose), and a second group received EPO 250 IU/kg SC three times a week (high dose). All infants received a therapeutic dose of 6 mg/kg (high dose) elemental iron orally every day; this dosage was increased to 8 to 10 mg/kg (high‐dose iron) if the hypochromic cells became 20% or more of the total cell population.
-
Outcomes assessed: use of one or more RBC transfusions, total volume (mL/kg) of blood transfused per infant, number of blood transfusions per infant, mortality, sepsis.
Carnielli 1992 was a single‐centre study performed in Italy.
-
Objective: to determine whether early administration of a high dose of recombinant human erythropoietin (rHuEPO) and iron to premature infants would be well tolerated and would reduce the need for blood transfusions.
-
Population: preterm infants with birth weight ≤ 1750 grams and GA ≤ 32 weeks, two days old.
-
Intervention: The EPO group received EPO 400 IU, three times weekly (high dose) IV or SC, and iron 20 mg/kg once a week IV (high‐dose iron) from second day of life until discharge. The control group did not receive either EPO or iron.
-
Outcomes assessed: number and volume of transfusions, number of donor exposures, mortality during hospital stay, neutropenia, hospital stay in days.
Carnielli 1998 was a single‐centre study performed in Italy.
-
Objective: to determine whether iron supplementation would enhance erythropoiesis in preterm infants treated with EPO.
-
Population: birth weight ≤ 1750 grams and gestational age ≤ 32 weeks, two days old.
-
Intervention: The EPO + iron group received 400 IU/kg EPO three times a week (high dose) and 20 mg/kg/week of IV iron (high dose). The EPO + no iron group received EPO 400 IU/kg three times a week (high dose) without iron (no iron); infants in the control group received either no treatment or placebo.
-
Outcomes assessed: number of donor exposures, BPD, IVH, sepsis, ROP, days on ventilator, days of oxygen, days in hospital, days to regain birth weight, weight gain from birth to eight weeks.
Chang 1998 was a single‐centre study performed in China.
-
Objective: to assess the efficacy and optimum dose of EPO for anaemia of prematurity.
-
Population: infants with GA ≤ 35 weeks, birth weight ≤ 1800 grams, age one day, and no rhesus (Rh) or ABO (blood group) incompatibility.
-
Intervention: Infants in EPO group 1 received EPO 150 IU/kg three times a week for six weeks (low dose). Infants in EPO group 2 received EPO 250 IU/kg three times a week for six weeks (high dose). Infants in the control group (group 3) received no EPO treatment. Infants in all three treatment groups received oral iron 20 mg/kg/d (high dose) from day seven after birth
-
Outcomes assessed: use of one or more RBC transfusions, hypertension, side effects.
Haiden 2005 was a multi‐centre study performed at NICUs of the Department of Pediatrics, University of Vienna, Austria.
-
Objective: to evaluate effects of EPO therapy on platelet reactivity and thrombopoiesis in ELBW infants.
-
Population: preterm infants with BW ≤ 800 grams and GA ≤ 32 weeks, < 8 days old.
-
Intervention: The EPO group received 300 IU/kg/d of EPO IV (as long as IV access was available) or 700 IU/kg three times per week (2100 IU/kg/week, high dose), and iron dextran 1.5 mg/kg/d IV or iron polymerase complex 9 mg/kg/d orally (high dose).
-
Outcomes assessed: use of one or more RBC transfusions, number of donors, mortality, NEC, PVL, IVH (grade I to II), IVH (grade III to IV), hospital stay, BPD (age not stated), ROP (stage I to II), ROP (stage III to IV).
Khatami 2008 was a single‐centre study performed at Ghaem Medical Center in Tehran, Iran.
-
Objective: to evaluate whether EPO therapy would decrease the need for RBC transfusions and prevent anaemia of prematurity.
-
Population: preterm infants with BW > 1000 grams but < 1750 grams and GA > 28 weeks but < 34 weeks, and between 48 and 96 hours old at the time of study entry.
-
Intervention: The EPO group received 500 IU/kg/d of EPO SC twice weekly (1000 IU/kg/week, high dose) and iron (ferrous sulphate) 3 mg/kg/d enterally (low dose).
-
Outcomes assessed: number of RBC transfusions per participant, weight gain, hospital stay.
Kremenopoulos 1997A; & Kremenopoulos 1997B
-
Objective: to determine the best timing of EPO administration in infants with anaemia of prematurity.
-
Population: 50 neonates with BW ≤ 1500 grams, PMA ≤ 31 weeks. Infants who had received transfusion before enrolment were included.
-
Intervention: The EPO group received rHuEPO (Cilag A.G., Zug, Switzerland) 3 × 250 U/kg/week SC (750 U/kg/week – high dose) (n = 24). Treatment was given for 6 weeks. The control group (n = 26) received no intervention. All infants received elemental iron 3 mg/kg/d. Treatment was initiated at three to seven days.
-
Outcomes assessed: transfusions/patient, patients receiving transfusions.
-
Retrospectively, infants were divided into those without complications (without or with minimal signs of respiratory distress and no signs of sepsis) and those with complications requiring mechanical ventilation (respiratory distress syndrome (RDS) and sepsis with positive blood culture) for longer than three days (were characterized as having complications). Outcomes were reported separately for infants without complications (we listed those outcomes under Kremenopoulos 1997A) and for infants with complications (we listed those outcomes under Kremenopoulos 1997B). An additional group of 35 infants (Group B) were enrolled at three to eight weeks and will be included in the 'Late EPO' review. No information was provided regarding transfusion guidelines for either group.
Lauterbach 1995 was a single‐centre study conducted in Poland.
-
Objective: to evaluate the role of EPO for treatment of infants with anaemia of prematurity.
-
Population: preterm infants with GA < 35 weeks and birth weight ≤ 1500 grams, seven days old.
-
Interventions: Infants in EPO group 1 received EPO 100 IU/kg twice a week between days seven and 37 (low dose), and infants in EPO group 2 received 400 IU/kg twice weekly (high dose) during the same time period; the control group received no treatment or placebo. Both EPO groups and the control group received 10 mg/kg/week of iron IV (high dose).
-
Outcomes assessed: total volume (mL/kg) of blood transfused between days seven and 37.
Lima‐Rogel 1998 was a single‐centre study performed in Mexico.
-
Objective: to determine the efficacy of EPO in VLBW newborns at less than 72 hours of age.
-
Population: infants with birth weight between 750 and 1500 grams, < 72 hours old.
-
Intervention: Infants in the EPO group received EPO 150 IU/kg/d (high dose) during the first six weeks, and infants in the control group received placebo. Both groups received iron 4 mg/kg/d (low dose).
-
Outcomes assessed: number of transfusions per group, sepsis, NEC, IVH, BPD.
Maier 1994 was a multi‐centre trial conducted at 12 centres in six European countries (Belgium, France, Germany, Netherlands, Switzerland, UK).
-
Objective: to determine whether EPO would prevent anaemia and reduce the need for transfusion in infants with VLBW.
-
Population: infants with birth weight 750 to 1499 grams, and three days old.
-
Intervention: The EPO group received 250 IU of EPO/kg IM three times per week (750 IU/kg/week, high dose). Treatment continued until day 40 to 42 for a total of 17 doses. Infants in the control group did not receive placebo, but adhesive tape was placed on both thighs and remained there until the next visit. Oral iron 2 mg/kg/d was started on day 14 for all infants (low dose).
-
Outcomes assessed: use of one or more RBC transfusions, number of transfusions per infant, mortality, ROP, sepsis, NEC, IVH all grades, neutropenia, hypertension, side effects, weight gain, costs.
Maier 2002 was a multi‐centre trial conducted at 14 centres in four European countries (Belgium, France, Germany, Switzerland).
-
Objective: to investigate whether EPO reduced the need for transfusion in ELBW infants and to determine the optimal time for treatment.
-
Population: infants with birth weight between 500 and 999 grams, three to five days old.
-
Intervention: The EPO group received EPO 250 IU/kg, IV or SC, three times a week (high dose) starting on day three to five of life, for nine weeks. The control group received sham injections. Enteral iron 3 mg/kg was given to all infants from days three to five (low dose) and was increased at days 12 to 14 to 6 mg/kg/d (high dose) and to 9 mg/kg/d (high dose) at days 24 to 26 of life.
-
Outcomes assessed: use of one or more RBC transfusions, number of donors the infant was exposed to, number of transfusions per infant, mortality during hospital stay, NEC, IVH, PVL, ROP, BPD, growth, days in oxygen, days in NICU, and days in hospital.
Meister 1997 was a single‐centre trial conducted in Austria.
-
Objective: to evaluate effects of EPO on circulating hematopoietic progenitor cells in anaemic premature infants.
-
Population: preterm infants with birth weight of 750 to 1499 grams, at the age of 5 to 10 days.
-
Intervention: The EPO group received EPO 300 IU/kg SC three times a week (high dose) for four weeks. The control group did not receive the drug and did not receive placebo. Oral iron administration was started with a dose of 6 mg/kg/d (high dose) and was increased after two weeks to 8 mg/kg/d (high dose). The control group received iron alone.
-
Outcomes assessed: cumulative volume of blood transfused/kg.
Meyer 2003 was a single‐centre trial conducted in New Zealand.
-
Objective: to comprehensively identify preterm infants likely to require blood transfusion, and to investigate the effectiveness of EPO in this high‐risk subgroup.
-
Population: preterm infants with gestation < 33 weeks and birth weight < 1700 grams, at the age of 48 hours.
-
Intervention: Infants in the treatment group received EPO 1200 IU/kg/week SC in three divided doses (high dose) until three weeks of age, then the dose was reduced to 600 IU/kg/week until 34 weeks' corrected GA, or for a minimum of three weeks. Infants in the control group received sham treatment. Both groups received elemental iron. Twenty‐one infants in the control group received sham treatment to avoid subcutaneous injection. Iron at a dose of 6 mg/kg/d (high dose) was given to the EPO group once they had attained a postnatal age of two weeks and were receiving at least 50% energy intake orally. Those in the control group received 2 mg/kg/d iron (low dose) from the same age in a more dilute preparation, so that an equivalent volume was given.
-
Outcomes assessed: use of one or more RBC transfusions, number of donors the infant was exposed to.
Obladen 1991 was a multi‐centre study conducted at five centres in three European countries (Germany (FRG), Germany (GDR), UK).
-
Objective: to investigate whether treatment with EPO reduced anaemia of prematurity and thus the need for transfusion by one‐third in preterm infants.
-
Population: preterm infants with GA 28 to 32 completed weeks, three days old.
-
Intervention: The EPO group received EPO 30 IU/kg (low dose) every third day from the fourth to 25th day of life. The control group did not receive study drug and did not receive placebo. Iron treatment 2 mg/kg (low dose) orally was started on day 14 if there was no feeding intolerance.
-
Outcomes assessed: use of one or more RBC transfusions, total volume of blood transfused per infant, mortality, chronic lung disease, IVH, NEC, BPD, hypertension.
Ohls 1995 was a single‐centre trial conducted in the USA.
-
Objective: to determine whether administering EPO to ill VLBW infants, beginning on the first or second day of life, would reduce blood transfusions and would be cost‐effective.
-
Population: infants at less than 48 hours of age with birth weight 750 and 1500 grams and GA > 27 weeks.
-
Intervention: The EPO group received EPO 200 IU/kg/d (high dose) IV for 14 consecutive days. The control group received a similar volume of 0.9% saline solution in similar fashion as placebo. Infants in both groups received iron 2 mg/kg/d (low dose) orally when they were taking 70 mL/kg/d enterally, which was increased to 6 mg/kg/day (high dose) when infants were receiving more than 100 mL/kg per day of feeds.
-
Outcomes assessed: use of one or more RBC transfusions, total volume of blood transfused per infant, number of transfusions per infant, neutropenia, thrombocytopenia, neutrophilia, NEC, IVH.
Ohls 1997 was a multi‐centre trial conducted in the USA.
-
Objective: to evaluate effects of EPO on the transfusion requirements of preterm infants weighing 750 grams or less.
-
Population: infants with birth weight 750 grams or less at 72 hours of age or younger.
-
Intervention: The EPO group received EPO 200 IU/kg/d (high dose) IV, for 14 consecutive days. The control group received placebo as an equivalent volume of diluent in similar fashion. All infants received 1 mg/kg/d iron dextran in total parenteral nutrition (TPN) solution during treatment period (high dose).
-
Outcomes assessed: total volume of blood transfused per infant, number of transfusions per infant, mortality, sepsis, IVH, BPD, ROP.
Ohls 2001A was a multi‐centre trial conducted in the USA.
-
Objective: to evaluate effects of early EPO therapy on the transfusion requirements of preterm infants weighing less than 1000 grams.
-
Population: infants with birth weight 401 to 1000 grams, GA < 32 weeks, between 24 and 96 hours of age at the time of study entry.
-
Intervention: The EPO group received 400 IU/kg EPO three times weekly (high dose) IV or SC when IV access was not available. The placebo or control group received sham SC injections when IV access was not available. Treatment was continued until discharge, transfer, death, or 35 completed weeks' corrected gestational age. EPO‐treated infants received a weekly IV infusion of 5 mg/kg iron dextran (high dose) until they had an enteral intake of 60 mL/kg/d. Placebo or control infants received 1 mg/kg iron dextran (high dose) once a week, administered in a similar manner. Once infants in both groups had an enteral intake of 60 mg/kg/d, they were given iron at a dose of 3 mg/kg/d (low dose). The dose was gradually increased to 6 mg/kg/d (high dose) depending on enteral intake.
-
Outcomes assessed: use of one or more RBC transfusions, mean number of erythrocyte transfusions per infant, number of donors to whom the infant was exposed, total volume of blood transfused per infant, late‐onset sepsis, mortality, chronic lung disease, ROP, severe IVH, NEC > Bell's stage II, BPD, neutropenia, hypertension. In a follow‐up study of the 72 EPO‐treated and 70 placebo control infants surviving to discharge, follow‐up data at 18 to 22 months' corrected age were collected on 51 EPO ‐treated infants (71%) and 51 placebo controls (73%). Outcomes assessed were growth, psychomotor development, rehospitalization, and transfusions.
Ohls 2001B was a multi‐centre trial conducted in the USA.
-
Objective: to evaluate effects of early EPO therapy on the transfusion requirements of preterm infants weighing less than 1250 grams.
-
Population: infants with birth weight between 1001 grams and 1250 grams, GA < 32 weeks, between 24 and 96 hours of age at the time of study entry.
-
Intervention: The EPO group received 400 IU/kg EPO three times weekly (high dose) IV or SC when IV access was not available. The placebo control group received sham SC injections when IV access was not available. Treatment was continued until discharge, transfer, death, or 35 completed weeks' corrected GA. EPO‐treated infants received a weekly IV infusion of 5 mg/kg iron dextran (high dose) until they had an enteral intake of 60 mL/kg/d. Placebo control infants received 1 mg/kg iron dextran (high dose) once a week, administered in a similar manner. Once infants in both groups had enteral intake of 60 mg/kg/d, they were given iron at a dose of 3 mg/kg/d (low dose). The dose was gradually increased to 6 mg/kg/d (high dose) depending on enteral intake.
-
Outcomes assessed: use of one or more RBC transfusions, mean number of erythrocyte transfusions per infant, number of donors to whom the infant was exposed, total volume of blood transfused per infant, late‐onset sepsis, mortality, chronic lung disease, ROP, severe IVH, NEC > Bell's stage II, BPD, neutropenia, hypertension.
Ohls 2013 was a multi‐centre study conducted in the USA.
-
Objective: to assess whether infants would respond to Darbe by reducing transfusion needs compared with no treatment, with less frequent dosing than erythropoietin.
-
Population: preterm infants with birth weight of 500 to 1250 grams at < 48 hours of age.I
-
Intervention: The Darbe group received 10 µg/kg one time per week SC. The EPO group received 400 U/kg three times per week SC. The control group received sham dosing. Injections continued through 35 weeks’ PMA. All infants (regardless of treatment arm) received supplemental iron, folate (50 mg per day oral), and vitamin E (15 IU per day oral). Iron dextran 3 mg/kg once a week was added to parenteral nutrition while infants were receiving 60 mL/kg/d enteral feedings. Oral iron 3 mg/kg/d was started when feedings were ≥ 60 mL/kg/d, and was increased to 6 mg/kg/d when feedings reached 120 mL/kg/day (high dose).
-
Outcomes assessed: use of one or more RBC transfusions, total volume (mL/kg) of blood transfused per infant, number of blood transfusions per infant, number of donors the infant was exposed to, mortality during initial hospital stay, ROP all stages and stages ≥ 3, late‐onset sepsis, NEC stage > 2, IVH grade ≥ 3, PVL, length of hospital stay, BPD (oxygen dependency at 36 weeks' PMA), neutropenia, hypertension. In supplementary studies, long‐term neurodevelopmental outcomes were reported until the age of 3.5 to 4 years in limited samples.
Peltoniemi 2017 was a single‐centre study conducted in Finland.
-
Objective: to determine whether administration of EPO without iron supplementation decreases iron load and morbidity.
-
Population: 39 preterm infants (BW 700 to 1500 grams, PMA ≤ 30.0 weeks).
-
Intervention: EPO 250 IU/kg daily during the first 6 days of life (high dose). The control group received a similar volume of isotonic saline solution in similar fashion. Iron was not administered in either of the two groups.
-
Outcomes assessed: Primary outcome was the oxygen index (OI) calculated from the need for supplemental oxygen and mechanical ventilation during the first six days of life (OI = mean airway pressure × FiO2 × 100/PaO2). Secondary outcomes included requirement for red blood cell transfusions during the first two weeks of life. The incidence of mild BPD was defined as the need for supplementary oxygen at 28 days. The incidence of moderate to severe BPD was defined as the need for supplementary oxygen at 28 days and at 36 postconceptional weeks. For the diagnosis of retinopathy of prematurity (ROP), the ophthalmoscopic examination was repeated until retinas were mature and the highest stage of retinopathy was reported. Severity of ROP was graded according to the international classification. IVH grades III and IV and periventricular leukomalacia (PVL). Number of days on assisted ventilation, use of supplemental oxygen, use of postnatal corticosteroid treatment for prevention of BPD and treatment of hypotension, length of hospital stay. Nosocomial sepsis was defined as a positive blood culture after day 3 of life. Diagnostic data on hyperglycaemia, hypotension, or hypertension requiring therapy, patent ductus arteriosus (PDA) treated with prostaglandin inhibitor therapy or surgery, NEC, and intestinal perforations. Follow‐up at 2 years' corrected age. Overall development was evaluated using the Griffiths Developmental Score. Cerebral palsy was defined as described by Rosenbaum 2002. The child's growth characteristics were reported.
-
Notes: We received clarifying information from Dr. Peltoniemi regarding this study and its results.
Qiao 2017 was a single‐centre study conducted in China.
-
Objective: to evaluate effects of early parenteral iron supplementation combined with EPO for prevention of anaemia in preterm infants.
-
Population: 96 preterm infants, PMA 28 to 34 weeks.
-
Intervention: A control group receiving standard parenteral nutrition (group 1: n = 31), an iron‐supplemented group (iron sucrose IS) (group 2: IS, n = 33), and an iron‐supplemented combined erythropoietin group (group 3: IS + EPO, n = 32). The IS + EPO group received EPO 400 IU/kg twice a week for two weeks; total dose 800 IU/kg/week (1600 IU/kg in two weeks) (high dose). The IS group and the IS + EPO group received iron 200 µg/kg/d until 2 weeks after birth.
-
Outcomes assessed: mortality, NEC, ROP.
-
Notes: For outcome analyses, we included the IS group and the IS + EPO group.
Salvado 2000 was a single‐centre trial conducted in Chile.
-
Objective: to assess benefits of early EPO administration to reduce the requirement for blood transfusion in VLBW infants.
-
Population: newborn infants with birth weight less than 1500 grams. Treatment started before 12 days of age (mean age EPO group 7.75 days, control group 7.96 days).
-
Intervention: The EPO group received EPO 200 IU/kg SC three times a week (high dose) over four weeks. The control group received a similar volume of isotonic saline solution in similar fashion. All infants received oral iron at a dose of 3 mg/kg/d (low dose).
-
Outcomes assessed: number of transfusions per infant, sepsis, IVH, days on ventilator.
Soubasi 1993 was a single‐centre study conducted in Greece.
-
Objective: to assess whether EPO treatment is safe and reduces the need for transfusion.
-
Population: infants with GA ≤ 31 weeks, birth weight ≤ 1500 grams, age one to seven days, no history of haemolytic disease, who were clinically stable.
-
Intervention: The EPO group received 150 IU/kg/dose of EPO twice a week (low dose) during four weeks. The control group received no placebo. From the 15th day of life, iron was started at 3 mg/kg/d (low dose) for all infants.
-
Outcomes assessed: use of one or more RBC transfusions, number of transfusions per infant, mortality, sepsis, neutropenia, weight gain, hospital stay.
Soubasi 1995 was a single‐centre study conducted in Greece.
-
Objective: to follow up with VLBW infants after EPO treatment.
-
Population: infants with GA ≤ 31 weeks, birth weight ≤ 1500 grams, age one to seven days, no history of haemolytic disease, who were clinically stable.
-
Intervention: The EPO 300 group received EPO 150 IU/kg twice weekly (low dose), and the EPO 750 group received EPO 250 IU/kg three times a week (high dose). The control group did not receive any study drug and did not receive placebo. All infants received oral elemental iron 3 mg/kg/d from day 15 of life (low dose).
-
Outcomes assessed: use of one or more RBC transfusions, number of blood transfusions per infant, mortality, follow‐up to one year of age, weight gain, hospital stay.
Soubasi 2000 was a single‐centre trial conducted in Greece.
-
Objective: to investigate effects of EPO on oxygen affinity and adequate oxygen delivery to the tissues of stable preterm infants.
-
Population: infants with GA ≤ 31 weeks and birth weight ≤ 1300 grams with clinical stability at the time of entry. Although trial authors did not state age at entry, we assumed from a graph (Figure 6) in the publication that age was seven days.
-
Intervention: The EPO group received 200 IU/kg every alternate day (high dose) SC. The control group did not receive EPO and did not receive placebo. Infants received oral iron at a dose of 12 mg/kg/d (high dose) in the EPO group and 4 mg/kg/d (low dose) in the control group.
-
Outcomes assessed: use of one or more RBC transfusions, number of transfusions per infant.
Yasmeen 2012 was a single‐centre study conducted in Dhaka, Bangladesh.
-
Objective: to investigate effects of short‐term administration of EPO with iron and folic acid in prevention of anaemia of prematurity and reduction in the number of transfusions in preterm VLBW infants.
-
Population: infants with GA < 35 weeks, birth weight < 1500 grams, and age < 7 days.
-
Intervention: The EPO group received 200 IU/kg three times/week (high dose) SC. The control group did not receive EPO and did not receive placebo. All infants received oral iron at a dose of 6 mg/kg/d (high dose) and 0.5 mg of folic acid every alternate day up to 12 weeks of life. Administration of both iron and folic acid started from day 14 of life, or as soon as enteral feeding was initiated after day 14.
-
Outcome assessed: mortality.
Yeo 2001 was a single‐centre study conducted in Singapore.
-
Objective: to study the efficacy, safety, and cost‐effectiveness of EPO in reducing transfusion needs among VLBW infants.
-
Population: VLBW infants with GA ≤ 33 weeks, age five days.
-
Intervention: The EPO group received EPO 250 IU/kg/dose SC three times a week (high dose) from day 5 to day 40. Infants in the control group did not receive placebo. Infants in both groups received elemental iron 3 mg/kg/d (low dose) orally from day 10, increased to 6 mg/kg/d (high dose) when full feeds were well tolerated.
-
Outcomes assessed: use of one or more RBC transfusions, mean number of erythrocyte transfusions per infant, total volume of blood transfused per infant, mortality, ROP, sepsis, NEC, BPD, hypertension, BPD, costs.
Studies designed to primarily assess the effectiveness of EPO administered early as a neuro protective agent
He 2008 was a single‐centre study performed in the Department of Neonatology, Zhangzhou Municipal Hospital, Zhangzhou, Fujian, China.
-
Objective: to evaluate effects of early EPO therapy on neuro behavioural development in preterm infants.
-
Population: preterm infants, seven days old.
-
Intervention: The EPO group received 250 IU/kg/d three times weekly IV for four weeks (750 IU/kg/week, high dose). The use of iron was not stated.
-
Outcomes assessed: Neonatal Behavioral Neurological Assessment at 40 weeks PMA, Gesell Developmental Schedule at 6 and 12 months after birth.
Fauchère 2008 was a single‐centre study performed in Switzerland.
-
Objective: to investigate whether high‐dose EPO administered to very preterm infants shortly after birth and subsequently during the first two days was safe in terms of short‐term outcomes and may reduce perinatal brain injury (IVH and PVL).
-
Population: preterm infants with GA 24 0/7 to 31 6/7 weeks.
-
Intervention: Infants in EPO group received 3000 IU rhEpo/kg IV 3 to 6, 12 to 18, and 36 to 42 hours after birth. The placebo group received an equal volume of normal saline. Iron was not administered.
-
Outcomes assessed: mortality, IVH (all grades and grades III to IV), persistent periventricular echodensity (included in the analysis for periventricular leukomalacia (PVL)), ROP (at all stages and at stages 3 to 4), sepsis, NEC (stage not reported), BPD (36 weeks' PMA), side effects.
-
Notes: All infants who were born at 26 weeks' PMA or later were reported on in Fauchère 2015. From the 2008 study, we reported only on infants who were < 26 weeks' PMA. We received additional information on these eight infants from Dr. Fauchère.
Fauchère 2015 was a multi‐centre study performed in Switzerland.
-
Objective: to investigate the safety and short‐term outcome of high‐dose EPO given shortly after birth and subsequently over the first two days for neuro protection to very preterm infants.
-
Population: preterm infants with PMA of 26 0/7 to 31 6/7 weeks.
-
Intervention: infants in EPO group received 3000 IU rhEpo/kg IV 3 to 6, 12 to 18, and 36 to 42 hours after birth. The placebo group received an equal volume of normal saline. Iron was not administered.
-
Outcomes assessed: mortality, IVH (all grades and grades III to IV), persistent periventricular echodensity (included in the analysis for periventricular leukomalacia (PVL)), ROP (at all stages and at stage 3 to 4), sepsis, NEC (stage not reported), BPD (36 weeks' PMA), side effects. Brain MRI abnormalities at term‐equivalent age and long‐term outcomes at two years of age reported separately.
Song 2016 was a single‐centre study conducted in Zhengzhou, China.
-
Objective: to evaluate the efficacy and safety of repeated low‐dose EPO for improvement of neurological outcomes in very preterm infants.
-
Population: preterm infants with GA ≤ 32 weeks, enrolled within 72 hours after birth.
-
Intervention: The EPO group received rhEPO at 500 U/kg IV every other day for 2 weeks. Cumulative dose of 3500 U/kg. First dose within 72 hours after birth. Placebo group received an equivalent volume of normal saline.
-
Outcomes assessed: Primary outcome was death or moderate to severe neurological disability assessed at 18 months' corrected age. Moderate or severe disabilities were defined as survival with at least 1 of the following complications: cerebral palsy, MDI < 70, deafness (defined as a hearing disability that required amplification, or blindness defined as visual corrected acuity of, 20/200). Secondary outcomes at 18 months' corrected age were individual components of the composite outcome. Short‐term outcomes included intraventricular haemorrhage grade III to IV, PVL, ROP (grade not stated), NEC, BPD (at 36 weeks' PMA), sepsis.
Studies designed to primarily assess the effectiveness of EPO administered early in improving feeding tolerance
El‐Ganzoury 2014 was a single‐centre study conducted in Cairo, Egypt.
-
Objective: to evaluate the efficacy and safety of enteral recombinant granulocyte colony‐stimulating factor (rh‐CSF) and recombinant human erythropoietin (rhEPO) in preventing feeding intolerance.
-
Population: preterm infants with PMA ≤ 33 weeks.
-
Intervention: Neonates were assigned to four groups: 20 received rhG‐CSF, 20 received rhEPO, 20 received both, and 30 received distilled water (placebo control).
-
Outcomes assessed: time to achieve full enteral feeding (150 mL/kg/d), mortality, NEC, duration of hospital stay.
-
Notes: We included in analyses the 20 infants who received EPO and the 30 infants who received placebo.
Excluded studies
We excluded 22 studies (see Characteristics of excluded studies table).
Risk of bias in included studies
The risk of bias graph (Figure 2) shows our evaluations of individual studies, which are summarised in the 'Risk of bias' summary (Figure 3).

Risk of bias graph: review authors' judgements about each risk of bias item presented as percentages across all included studies.

Risk of bias summary: review authors' judgements about each risk of bias item for each included study.
Allocation
Information regarding whether the allocation was concealed was often missing. Twelve studies reported proper random sequence generation (Soubasi 1993; Soubasi 1995; Meister 1997; Soubasi 2000; Meyer 2003; Arif 2005; Fauchère 2008; Ohls 2013; El‐Ganzoury 2014; Fauchère 2015; Song 2016; Peltoniemi 2017). We interpreted allocation to study groups as concealed in 17 studies (Obladen 1991; Soubasi 1993; Maier 1994; Ohls 1997; Ohls 2001A; Ohls 2001B; Maier 2002; Meyer 2003; Haiden 2005; Fauchère 2008; Khatami 2008; Ohls 2013; El‐Ganzoury 2014; Fauchère 2015; Song 2016; Peltoniemi 2017; Qiao 2017). Fourteen studies used placebo or sham injections (Soubasi 1993; Maier 1994; Ohls 1995; Ohls 1997; Lima‐Rogel 1998; Ohls 2001A; Ohls 2001B; Maier 2002; Meyer 2003; Fauchère 2008; Ohls 2013; Fauchère 2015; Peltoniemi 2017; Qiao 2017).
Blinding
Fourteen studies blinded personnel (Soubasi 1993; Maier 1994; Ohls 1995; Ohls 1997; Lima‐Rogel 1998; Ohls 2001A; Ohls 2001B; Maier 2002; Meyer 2003; Fauchère 2008; Ohls 2013; Fauchère 2015; Peltoniemi 2017; Qiao 2017). We interpreted that blinding of outcome assessment was appropriate in 14 studies (Soubasi 1993; Maier 1994; Ohls 1995; Ohls 1997; Lima‐Rogel 1998; Ohls 2001A; Ohls 2001B; Maier 2002; Meyer 2003; Fauchère 2008; Ohls 2013; Fauchère 2015; Peltoniemi 2017; Qiao 2017).
Incomplete outcome data
Risk of attrition bias was clear in two studies (Maier 1994; Yasmeen 2012). Six studies reported long‐term (18 to 22/24 months' corrected age) outcomes (Ohls 2001A; Ohls 2013; Fauchère 2008; Fauchère 2015; Peltoniemi 2017; Song 2016). In Ohls 2001A, follow‐up rates were low; among 72 EPO‐treated and 70 placebo control infants surviving to discharge, follow‐up data at 18 to 22 months' corrected age were collected on 51 of 72 EPO‐treated infants (71%) and 51 of 70 placebo/controls (73%). Ohls 2013 enrolled 102 infants and at the end of hospitalisation evaluated 94 infants. These investigators evaluated 80 children at follow‐up at corrected age of 18 to 22 months (Darbe n = 27 (84%), EPO n = 29 (91%), placebo/sham injection n = 24 (80%)). A report of preschool assessment (at age 3.5 to 4 years) was published in 2016 (Ohls 2016, follow up to Ohls 2013). This study assessed 53 children (Darbe n = 15 (47%), EPO n = 24 (75%), placebo n =14 (47%)). In 2017, Lowe 2017 (follow up to Ohls 2013) reported on behavioural measures in 49 children (Darbe or EPO n = 35 (55%), placebo n = 14 (47%)). The two groups given Darbe and EPO were combined and were referred to as the erythropoiesis‐stimulating agents (ESA) group. Percentages are based on the number of infants evaluated at the end of hospitalisation. Follow‐up rates beyond 18 to 22 months were low. For Fauchère 2008, we obtained information from the first author on outcomes of eight infants born at < 26 weeks' PMA; five deaths and long‐term follow‐up were reported on three surviving infants. In Fauchère 2015, long‐term outcomes were reported for 365 infants (81%): 191 infants (83%) assigned to the EPO group and 174 infants (79%) assigned to the placebo group. In Peltoniemi 2017, of 20 surviving children at two years of age, 19 were enrolled and 10 (50%) were evaluated by Griffiths Developmental Scale. Of 16 surviving placebo group children at 2 years of age, all were enrolled and 9 (56%) were evaluated by Griffiths Developmental Scale. Follow‐up rates for Griffiths Developmental Scale were low. In the large study Song 2016, all 743 randomised infants were accounted for in short‐term outcomes. For outcomes at 18 months, 309 children in the EPO group and 304 in the placebo group were assessed. In the EPO group, 36 children had been lost to follow‐up, as were 39 children in the control group. Twenty‐one infants in the EPO group had died, as had 34 children in the control group. Follow‐up rate at 18 months was 90% in the EPO group and 87% in the control group.
Selective reporting
For most included studies, the study protocol was not available to us. Therefore we could not ascertain whether deviations from the protocol occurred. We were able to locate study protocols for Ohls 2013; El‐Ganzoury 2014; Fauchère 2015; Song 2016; and Peltoniemi 2017. Ohls 2013 was registered as NCT00334737 in June 2006 and showed no major deviations from the protocol, except that primary outcomes included MDI at 18 to 22 months and Psychomotor Development Index (PDI) as a secondary outcome. MDI and PDI are not reported in the primary publication. Fauchère 2008 was registered as NCT00413946 in December 2006 after the last patient had been enrolled in November 2006. Registration applies to the larger study published in 2015 (Fauchère 2015). The protocol for the early part of the study was not available to us; therefore we cannot ascertain whether deviations from the protocol occurred. We noted no deviations from the protocol in Fauchère 2015. Song 2016 was registered as NCT02036073 in December 2013, after recruitment had been completed. This study started to recruit patients in January 2009. Therefore, we were unable to detect any deviations from a study protocol established before the start of the study. In the protocol, the primary outcome measured was incidence of MDI < 70 at corrected age of 18 months, and secondary outcome measures were incidence of ROP at corrected age 42 weeks. In the full report, primary outcomes are listed as death, disability, or death + disability at 18 months' corrected age. ROP is listed as a neonatal complication. The protocol for Peltoniemi 2017 was written in Finnish. We contacted Dr. Peltoniemi, who contacted Dr. Antilla, a co‐author, who assured us that no deviations from the protocol occurred.
All studies accounted for all enrolled infants.
Other potential sources of bias
We did not identify any other sources of potential bias. Sample sizes were generally small, ranging from 19 infants enrolled in Lauterbach 1995 to 743 in Song 2016. Three original studies (Fauchère 2015; Song 2016; Peltoniemi 2017) reported study details as required by the CONSORT statement (Begg 1996).
Effects of interventions
See: Summary of findings for the main comparison ; Summary of findings 2 ; Summary of findings 3 ; Summary of findings 4
Studies designed to primarily investigate the effectiveness and safety of EPO or Darbe administered early in reducing red blood cell transfusions or providing neuro protection or protection against necrotising enterocolitis
Erythropoietin versus placebo or no treatment (Comparison 1)
All analyses reported for Comparison 1 compared EPO versus placebo or no intervention (sham injection).
We indicated the primary outcomes and noted that those not indicated as such were secondary outcomes. For outcomes included in 'Summary of findings' tables, we included our assessments of evidence quality according to GRADE.
Use of one or more red blood cell transfusions (low (< 500 IU/kg/week) and high (> 500 IU/kg/week) doses of EPO) ‐ Primary outcome (Outcome 1.1)
A total of 19 studies enrolling 1750 infants reported on the use of one or more RBC transfusions. Early EPO significantly reduced the proportion of infants who received one or more RBC transfusions (typical risk ratio (RR) 0.79, 95% confidence interval (CI) 0.74 to 0.85; typical risk difference (RD) ‐0.14, 95% CI ‐0.18 to ‐0.10; number needed to treat for an additional beneficial outcome (NNTB) 7, 95% CI 6 to 10). Heterogeneity for this outcome was moderate (RR: I2 = 69%; RD: I2 = 62%) (Analysis 1.1; Figure 4). The funnel plot was asymmetrical with relative absence of smaller studies not having a protective effect (Figure 5). The quality of the evidence was low.

Forest plot of comparison: 1 Erythropoietin versus placebo or no treatment, outcome: 1.1 Use of 1 or more red blood cell transfusions (low and high doses of EPO).

Funnel plot of comparison: 1 Erythropoietin versus placebo or no treatment, outcome: 1.1 Use of 1 or more red blood cell transfusions (low and high doses of EPO).
We conducted further analyses by including studies that used a high dose of EPO (> 500 U/kg/week) or a low dose of EPO (≤ 500 U/kg/week).
Use of one or more red blood cell transfusions (high dose of EPO (> 500 U/kg/week)) (Outcome 1.2)
A total of 17 studies enrolling 1317 patients testing a high dose of EPO reported on this outcome. A high dose of EPO significantly reduced the proportion of infants who received one or more RBC transfusions (typical RR 0.79, 95% CI 0.74 to 0.86; typical RD ‐0.15, 95% CI ‐0.19 to ‐0.10; NNTB 7, 95% CI 5 to 10). Heterogeneity for this outcome was moderate (RR: I2 = 71%; RD: I2 = 64%) (Analysis 1.2).
We conducted a subgroup analysis for a high dose of EPO in combination with a high dose of iron (Outcome Table 1.2.1). A total of 11 studies enrolling 863 infants reported on this outcome. A high dose of EPO given with a high dose of iron significantly reduced the proportion of infants who received one or more RBC transfusions (typical RR 0.84, 95% CI 0.77 to 0.92; typical RD ‐0.11, 95% CI ‐0.16 to ‐0.05; NNTB 9, 95% CI 6 to 20). We noted low or no heterogeneity for this outcome (RR: I2 = 32%; RD: I2 = 22%).
A total of six studies enrolling 454 infants testing a high dose of EPO and a low dose of iron (Outcome Table 1.2.2) reported on this outcome. A high dose of EPO and a low dose of iron significantly reduced the proportion of infants who received one or more RBC transfusions (typical RR 0.71, 95% CI 0.62 to 0.82; typical RD ‐0.21, 95% CI ‐0.29 to ‐0.14; NNTB 5, 95% CI 3 to 7). Heterogeneity for this outcome was high for RR (I2 = 91%) and RD (I2 = 84%).
Use of one or more red blood cell transfusions (low dose of EPO (< 500 U/kg/week)) (Outcome 1.3)
A total of four studies including 484 participants testing a low dose of EPO reported on this outcome. A low dose of EPO resulted in a significant reduction in the proportion of infants who received one or more RBC transfusions (typical RR 0.77, 95% CI 0.65 to 0.91; typical RD ‐0.13, 95% CI ‐0.22 to ‐0.05; NNTB 8, 95% CI 5 to 20). Heterogeneity was low and moderate for this outcome (RR: I2 = 47%; RD: I2 = 55%) (Analysis 1.3).
We conducted a subgroup analysis for a low dose of EPO in combination with a high dose of iron (Outcome Table 1.3.1). Two studies enrolling 322 infants reported on this outcome. One of these studies reported no outcomes for either group. The significant RR was 0.75 (95% CI 0.61 to 0.93); the test for heterogeneity was not applicable. The significant typical RD was ‐0.14 (95% CI ‐0.24 to ‐0.04). Heterogeneity was not applicable for RR and was high for RD (I2 = 81%). The NNTB was 7 (95% CI 4 to 25).
Two studies enrolling 162 infants tested the effectiveness of a low dose of EPO in combination with a low dose of iron (Outcome Table 1.3.2) and reported on this outcome. A low dose of EPO combined with a low dose of iron did not significantly reduce the proportion of infants who received one or more RBC transfusions (typical RR 0.80, 95% CI 0.60 to 1.07; typical RD ‐0.12, 95% CI ‐0.26 to 0.03). Heterogeneity was moderate (I2 = 70%) for RR and low for RD (I2 = 48%).
Only one study included a group that received no iron (Carnielli 1998); however, this study did not report on the primary outcome of interest: 'use of one or more RBC transfusions'. In Fauchère 2008 and Fauchère 2015, no group received iron. These studies did not report on the primary outcome of interest: 'use of one or more RBC transfusions'.
Total volume (mL/kg) of red blood cells transfused per infant (Outcome 1.4)
Seven studies enrolling 581 infants reported on the total volume of RBCs transfused per infant. The significant weighted mean difference (WMD) was a reduction of 6.8 mL/kg of blood transfused per infant (95% CI ‐11.5 to ‐ 2.1). Heterogeneity was moderate for this outcome (I2 = 63%) (Analysis 1.4).
Carnielli 1998 reported on the mean volume of blood (mL/kg) transfused for the three groups: EPO + iron 16.7 (95% CI 4.9 to 28.6); EPO only 20.1 (95% CI 6.2 to 34.2), and control 44.4 (95% CI 29.0 to 59.7) (EPO vs control P = 0.028; EPO + iron vs control P = 0.009) (P values according to trial authors).
Lauterbach 1995 reported that infants treated with 800 IU of EPO/kg/week required a statistically significantly lower volume (mL/kg) of packed erythrocytes in comparison with untreated infants both between days 7 and 37 of life (18.6 mL vs 46.8 mL) and between day seven of life and the day of discharge (35.8 mL vs 94.2 mL) (P < 0.04 for both comparisons).
Maier 2002 reported on the mean (SD) volume of blood transfused as mL/kg/d: early EPO group 0.7 (1.2) and control group 1.1 (1.2) (P value not provided). Meister 1997 reported on the median (first and third quartile) volume of blood transfused as mL/kg/d: EPO group 0 (0 to 0.47) and control group 0.86 (0.5 to 1.1).
Number of red blood cell transfusions per infant (Outcome 1.5)
A total of 16 studies enrolling 1744 infants reported on the number of RBC transfusions per infant. The significant weighted mean difference (WMD) for the number of RBC transfusions per infant was ‐0.57 (95% CI ‐0.68 to ‐0.45). Heterogeneity was high for this outcome (I2 = 80%) (Analysis 1.5).
Carnielli 1998 reported on the mean number of RBC transfusions for three groups: EPO + iron 1.0 (95% CI 0.28 to 1.18); EPO only 1.3 (95% CI 0.54 to 2.06); and control 2.9 (95% CI 1.84 to 3.88) (control vs EPO P = 0.065; control vs EPO + iron P = 0.035) (P values according to trial authors).
Avent 2002 reported the median and range of number of transfusions across three groups: low‐dose EPO 0 (0 to 1); high‐dose EPO 0 (0 to 2); and control 0 (0 to 4) (P = 0.03 across the three groups). Haiden 2005 reported the number of transfusions: EPO 2 (0 to 15) and control 4.5 (0 to 12) (not statistically significant according to trial authors).
Number of donors to whom the infant was exposed (Outcome 1.6)
Number of donors the infant was exposed to among all randomised infants (Outcome 1.6.1)
Three studies enrolling 254 infants reported on this outcome as means and standard deviations (SDs). The significant WMD for the number of donors to whom the infant was exposed was ‐0.54 (95% CI ‐0.89 to ‐0.20). We noted no heterogeneity for this outcome (I2 = 0%) (Analysis 1.6).
Number of donors the infant was exposed to among infants who were transfused (Outcome 1.6.2)
Two studies enrolling 290 infants reported on this outcome. The non‐significant WMD for the number of donors the infant was exposed to among infants who were transfused was 0.05 (95% CI ‐0.33 to 0.42). Heterogeneity was moderate for this outcome (I2 = 63%) (Analysis 1.6).
Carnielli 1992 reported that the number of donor exposures ranged from zero to five in the EPO group and from zero to six in the control group (P value not provided). Haiden 2005 reported on this outcome in a similar fashion: EPO group 1 donor (0 to 10), control group 3 donors (0 to 5) (not statistically significant according to trial authors).
Mortality during initial hospital stay (all causes of mortality) (Outcome 1.7)
A total of 20 studies enrolling 2212 infants reported on this outcome. Mortality was not significantly altered by the use of EPO (typical RR 0.89, 95% CI 0.68 to 1.16; typical RD ‐0.01, 95% CI ‐0.03 to 0.01). We noted no heterogeneity for this outcome (RR and RD: I2 = 0%) (Analysis 1.7). The quality of the evidence was high.
Retinopathy of prematurity (ROP) (all stages or stage not stated by trial authors) (Outcome 1.8)
A total of 11 studies enrolling 2185 infants reported on ROP. We obtained unpublished data from Maier 2002 on the highest grade of ROP recorded during the study among examined survivors. Data show no significant difference in the incidence of ROP (all stages or stage not stated by trial authors) (typical RR 0.92, 95% CI 0.79 to 1.08; typical RD ‐0.02, 95% CI ‐0.05 to 0.02). We noted no heterogeneity for this outcome (RR and RD: I2 = 0%) (Analysis 1.8).
Retinopathy of prematurity (ROP) (stage ≥ 3) (Outcome 1.9)
A total of eight studies enrolling 1283 infants reported on severe ROP (stage ≥ 3). Data show no significant differences in ROP (stage ≥ 3) between groups (typical RR 1.24, 94% CI 0.81 to 1.90; typical RD 0.01, 95% CI ‐0.01 to 0.04). We noted no heterogeneity for this outcome for RR (I2 = 0%) and low heterogeneity for RD (I2 = 34%) (Analysis 1.9). The quality of the evidence was high.
Ohls 1997 reported no differences in ROP (stage ≥ 3) rates between groups (data not provided).
Proven sepsis (clinical symptoms and signs of sepsis and positive blood culture for bacteria or fungi) (Outcome 1.10)
Twelve studies including 2180 infants reported on this outcome. EPO did not significantly change rates of proven sepsis (typical RR 0.87, 95% CI 0.74 to 1.02; typical RD ‐0.03, 95% CI ‐0.06 to 0.00). We noted no heterogeneity (RR and RD: I2 = 0%) (Analysis 1.10).
Necrotising enterocolitis (NEC) (stage > 2 or stage not reported) (Outcome 1.11)
We included in this analysis any outcome stated as NEC. We include 15 studies reporting on 2639 infants. EPO significantly reduced the rate of NEC (typical RR 0.69, 95% CI 0.52 to 0.91; typical RD ‐0.03, 95% CI ‐0.05 to ‐0.01). We noted no heterogeneity for this outcome (RR: I2 = 0%, RD: I2 = 22%; NNTB 33, 95% CI 20 to 100) (Analysis 1.11). The quality of evidence was moderate.
Ohls 1995 reported no differences in NEC rates between groups (data not provided). The quality of the evidence was low.
Intraventricular haemorrhage (IVH); all grades (Outcome 1.12)
Many trial authors did not state the grade of IVH. We included in this outcome studies in which authors did not state the grade and excluded IVH grades III and IV when known. A total of ten studies including 1226 infants reported on this outcome. EPO did not significantly change the rate of IVH (all grades) (typical RR 0.98, 95% CI 0.76 to 1.26; typical RD ‐0.00, 95% CI ‐0.04 to 0.04) (Analysis 1.12). We noted no heterogeneity for this outcome for RR and RD (I2 = 0%). Ohls 1995 and Ohls 1997 reported no differences in IVH rates between groups (data not provided).
Intraventricular haemorrhage (IVH); grades III and IV (Outcome 1.13)
Eight studies enrolling 1460 infants reported on this outcome. EPO significantly reduced the rate of IVH (grades III and IV) (typical RR 0.60, 95% CI 0.43 to 0.85; typical RD ‐0.04, 95% CI ‐0.07 to ‐0.02; NNTB 25, 95% CI 14 to 50). Heterogeneity was low for this outcome for RR (I2 = 45%) but high for RD (I2 = 79%) (Analysis 1.13). The quality of the evidence was moderate.
Periventricular leukomalacia (PVL); cystic changes in periventricular areas (Outcome 1.14)
Six studies enrolling 1469 infants reported on PVL. EPO significantly reduced the rate of PVL (typical RR 0.66, 95% CI 0.48 to 0.92; typical RD ‐0.04, 95% CI ‐0.07 to ‐0.01; NNTB 25, 95% CI 14 to 100). We noted no heterogeneity for this outcome for RR (I2 = 5%) but high heterogeneity for RD (I2 = 79%) (Analysis 1.14). The quality of the evidence was moderate.
Length of hospital stay (days) (Outcome 1.15)
Eight studies enrolling 970 infants reported on length of hospital stay. EPO significantly reduced length of hospital stay (typical MD ‐3.20 days, 95% CI ‐5.34 to ‐1.06). Heterogeneity was moderate for this outcome (I2 = 58%) (Analysis 1.15).
Avent 2002 reported the median and range (days) for hospital stay across three groups: low‐dose EPO 32 (5 to 54), high‐dose EPO 32 (16 to 74), and control 30 (14 to 46) (P = 0.10 across the three groups). Haiden 2005 reported on hospital stay (days, median and range): EPO group 97 (59 to 162) and control group 89 (77 to157) (not statistically significant according to trial authors). Maier 2002 reported on the median (quartiles) for hospital stay: early EPO 87 (73 to 107), control 87 (69 to 108).
Bronchopulmonary dysplasia (BPD) (Outcome 1.16)
Bronchopulmonary dysplasia (BPD) (supplemental oxygen at 28 days of age) (Outcomes Table 1.16.1)
Two studies enrolling 136 infants reported on use of supplemental oxygen at 28 days. EPO did not significantly change the rate of BPD (supplemental oxygen at 28 days of age) (RR 0.86, 95% CI 0.50 to 1.47; RD ‐0.04, 95% CI ‐0.19 to 0.10). We noted no heterogeneity for this outcome (RR and RD: I2 = 0%) (Analysis 1.16).
Ohls 1995 and Ohls 1997 reported no differences in BPD rates between groups (data not provided).
Bronchopulmonary dysplasia (BPD) (supplemental oxygen at 36 weeks' postmenstrual age (PMA)) (Outcomes Table 1.16.2)
Seven studies enrolling 1719 infants reported on use of supplemental oxygen at 36 weeks' PMA. EPO did not significantly change the rate of BPD (supplementary oxygen at 36 weeks' PMA) (typical RR 0.95, 95% CI 0.81 to 1.11; typical RD ‐0.01, 95% CI ‐0.05 to 0.02). We noted no heterogeneity for this outcome (RR and RD: I2 = 0%) (Analysis 1.16).
Bronchopulmonary dysplasia (BPD) (age at diagnosis not stated) (Outcomes Table 1.16.3)
A total of five studies enrolling 528 infants reported on this outcome. EPO did not significantly change the rate of BPD (age at diagnosis not stated) (typical RR 0.98, 95% CI 0.61 to 1.56; typical RD ‐0.00, 95% CI ‐0.05 to 0.05). We noted no heterogeneity for this outcome (RR and RD: I2 = 0%) (Analysis 1.16).
Neutropenia (Outcome 1.17)
Ten studies including 966 infants reported on neutropenia. The non‐significant typical RR was 0.81 (95% CI 0.53 to 1.24); the typical RD was ‐0.01 (95% CI ‐0.05 to 0.02). We noted no heterogeneity for this outcome (RR and RD: I2 = 0%) (Analysis 1.17).
Hypertension (Outcome 1.18)
A total of six studies enrolling 706 infants reported on hypertension. Five studies reported no outcomes in treatment or control groups. Therefore, these five studies did not provide information for the typical RR estimate. The typical RR was 0.97 (95% CI 0.14 to 6.69). All six studies were included in the typical RD of ‐0.00 (95% CI ‐0.02 to 0.02). We noted no heterogeneity for this outcome (RR: I2 = 0%; RD: I2 = 0%) (Analysis 1.18).
Hemangioma (Outcome 1.19)
One study reported on hemangioma among 443 infants. The RR was 1.33 (95% CI 0.79 to 2.26), and the RD was 0.03 (95% CI ‐0.03 to 0.09). Tests for heterogeneity were not applicable (Analysis 1.19).
Neonatal Behavioural Neurological Assessment (NBNA) at 40 weeks' PMA (Outcome 1.20)
One study reported on NBNA at 40 weeks' PMA in 44 infants. The significant MD was 1.80 (95% CI 1.26 to 2.34) favouring the EPO group. Tests for heterogeneity were not applicable (Analysis 1.20).
Infants with white matter injury at term‐corrected PMA (Outcome 1.21)
One study reported on 165 infants. Data show a non‐significant reduction in white matter injury in the EPO group compared with the control group (RR 0.61, 95% CI 0.37 to 1.00; NS) but significant reduction in the RD (‐0.14, 95% CI ‐0.28 to ‐0.01; NNTB 7, 95% CI 4 to 100; tests for heterogeneity N/A) (Analysis 1.21).
Infants with white matter signal abnormality injury at term‐corrected PMA (Outcome 1.22)
One study reported on 165 infants. Study authors described a non‐significant reduction in white matter signal abnormality in the EPO group compared with the control group (RR 0.23, 95% CI 0.05 to 1.01; NS) but a significant reduction in the RD (‐0.09, 95% CI ‐0.16 to ‐0.01; NNTB 11, 95% CI 6 to 100; tests for heterogeneity N/A) (Analysis 1.22).
Infants with periventricular white matter loss at term‐corrected PMA (Outcome 1.23)
One study reported on 165 infants and noted a significant reduction in periventricular white matter loss in the EPO group compared with the control group (RR 0.55, 95% CI 0.32 to 0.97; RD ‐0.15, 95% CI ‐0.28 to ‐0.02; NNTB 7, 95% CI 4 to 50; tests for heterogeneity N/A) (Analysis 1.23).
Infants with grey matter injury at term‐corrected PMA (Outcome 1.24)
One study reported on 165 infants and noted a significant reduction in grey matter injury in the EPO group compared with the control group (RR 0.34, 95% CI 0.13 to 0.87; RD ‐0.13, 95% CI ‐0.23 to ‐0.03; NNTB 8, 95% CI 4 to 33; tests for heterogeneity N/A) (Analysis 1.24).
Survivors at discharge from hospital without severe IVH, PVL, or ROP (Outcome 1.25)
One study reported on 443 infants and noted no significant differences between groups for the outcome 'Survivors at discharge from hospital without severe IVH, PVL, or ROP' (RR 1.00, 95% CI 0.93 to 1.08; RD 0.00, 95% CI ‐0.06 to 0.07). Tests for heterogeneity were not applicable (Analysis 1.25). The quality of the evidence was high.
Long‐term outcomes assessed at any age beyond one year of age by a validated cognitive, motor, language, or behavioural, school, and social interaction adaptation test
Bayley‐II Mental Development Index (MDI) < 70 at 18 to 24 months' corrected age (Outcome 1.26)
Four studies reported on 1071 children. Data show a significant reduction in infants with MDI < 70 at 18 to 24 months' corrected age (typical RR 0.55, 95% CI 0.39 to 0.77; typical RD ‐0.07, 95% CI ‐0.11 to ‐ 0.03; NNTB 14, 95% CI 9 to 33). Heterogeneity was moderate for RR (I2 = 60%) and low for RD (I2 = 31%) (Analysis 1.26).
Psychomotor Developmental Index (PDI) < 70 at 18 to 22 months' corrected age (Outcome 1.27)
Three studies reported on this outcome in 458 children following EPO treatment, noting no significant effects of EPO compared with control. The typical RR was 1.43 (95% CI 0.88 to 2.33); the typical RD was 0.04 (95% CI ‐0.02 to 0.11). Heterogeneity was low for RR (I2 = 46%) and for RD (I2 = 42%) (Analysis 1.27).
Bayley‐II MDI at 18 to 24 months (Outcome 1.28)
Three studies reported on this outcome in 981 children following EPO treatment. Data show a significant increase in Bayley‐II MDI at 18 to 24 months in the EPO group compared with the control group. The WMD was 8.22 (95% CI 6.52 to 9.92). Heterogeneity was high for this outcome (I2 = 97%) (Analysis 1.28). The quality of the evidence was low.
Bayley‐II PDI at 18 to 24 months (Outcome 1.29)
Fauchère 2008 reported on this outcome in three infants. We obtained unpublished data from the trial author and were not able to use the data in RevMan (RevMan 2014; Analysis 1.29).
Cerebral palsy at 18 to 22 months' corrected age (Outcome 1.30)
Six studies reported on this outcome in 1172 children following EPO treatment. The non‐significant typical RR was 0.72 (95% CI 0.46 to 1.13); RD was ‐0.02 (95% CI ‐0.05 to 0.01). Heterogeneity was low (RR: I2 = 48%; RD: I2 = 41%) (Analysis 1.30). The quality of the evidence was high.
Any neurodevelopmental impairment at 18 to 22 months' corrected age (Outcome 1.31)
Four studies reported on this outcome in 1130 children following EPO treatment. The typical RR was 0.62 (95% CI 0.48 to 0.80); typical RD was ‐0.08 (95% CI ‐0.12 to ‐0.04); NNTB was 13 (95 % CI 8 to 25). Heterogeneity was high for RR (I2 = 76%) and moderate for RD (I2 = 66%) (Analysis 1.31). The quality of the evidence was low.
Visual impairment at 18 to 22 months' corrected age (Outcome 1.32)
Five studies reported on this outcome in 1132 children following EPO treatment. Data show no significant differences between groups (typical RR 0.80, 95% CI 0.26 to 2.49; RD ‐0.00, 95% CI ‐0.01 to 0.01). We noted no heterogeneity for this outcome (I2 = 0% for both RR and RD) (Analysis 1.32).
Hearing impairment at 18 to 22 months' corrected age (Outcome 1.33)
Five studies reported on this outcome in 1132 children following EPO treatment. Data show no significant differences between groups (typical RR 0.41, 95% CI 0.13 to 1.23; RD ‐0.01, 95% CI ‐0.02 to 0.00). We noted no heterogeneity for RR (I2 = 11%) and low heterogeneity for RD (I2 = 38%) (Analysis 1.33).
Bayley Scales of Infant Development (BSID‐III) cognitive scores at 18 to 22 months (Outcome 1.34)
One study reported on this outcome in 53 infants. Scores were significantly higher in the group that received EPO (mean difference (MD) 9.2, 95% CI 1.70 to 16.70). Tests for heterogeneity were not applicable (Analysis 1.34).
Ohls 2013, with small sample sizes at both times of follow‐up, reported secondary outcomes (53 and 38 children, respectively) for which none of the results reached statistical significance. Results are presented in the analyses: BSID‐III composite language score (Analysis 1.35), BSID‐III composite social/emotional score (Analysis 1.36), BSID‐III object performance (OP) score (Analysis 1.37), Wechsler Preschool and Primary Scale of Intelligence ‐ Third Edition Full‐Scale Intelligence Quotient (WPPSI‐III FSIQ) at 3.5 to 4 years of age (Analysis 1.38), WPPSI‐III Verbal Intelligence Quotient (VIQ) at 3.5 to 4 years of age (Analysis 1.39), WPPSI‐III Performance Intelligence Quotient (PIQ) at 3.5 to 4 years of age (Analysis 1.40), WPPSI‐III General Language Composite score (GLC) at 3.5 to 4 years of age (Analysis 1.41), Executive function at 3.5 to 4 years of age (Analysis 1.42), Working memory at 3.5 to 4 years of age (Analysis 1.43), and Inhibition at 3.5 to 4 years of age (Analysis 1.44). In addition, Peltoniemi 2017 reported on the Griffiths Developmental Scale at two years of age for 19 infants, noting no statistical differences between groups (Analysis 1.45).
Survival without major neurological or neurodevelopmental disorders at two years of age (Outcome 1.46)
Two studies reported on this outcome in 404 children. Data show no statistically significant differences between EPO and control groups (typical RR 0.99, 95% CI 0.91 to 1.08; RD ‐0.01, 95% CI ‐0.08 to 0.06). We noted no heterogeneity for this outcome (RR: I2 = 20%, RD: I2 = 22%) (Analysis 1.46).
Death or moderate/severe neurological disability at 18 to 24 months (Outcome 1.47)
One study reported on this outcome in 668 children. Data show a significantly reduced rate of this outcome in the EPO group (RR 0.48, 95% CI 0.35 to 0.67; RD ‐0.14, 95% CI ‐0.20 to ‐0.08; NNTB 7, 95% CI 5 to 13). Tests for heterogeneity were not applicable (Analysis 1.47).
Moderate/severe neurological disability at 18 to 24 months (Outcome 1.48)
One study reported on this outcome in 613 children, noting a significantly reduced rate of this outcome in the EPO group (RR 0.38, 95% CI 0.24 to 0.60; RD ‐0.12, 95% CI ‐0.17 to ‐0.06; NNTB 8, 95% CI 6 to 17). Tests for heterogeneity were not applicable (Analysis 1.48).
Any side effects reported in these trials (no outcomes table)
Nine trials specifically reported that side effects did not occur (Carnielli 1992; Maier 1994; Lauterbach 1995; Ohls 1995; Meister 1997; Chang 1998; Lima‐Rogel 1998; Fauchère 2008; Khatami 2008). Ohls 2013 reported that side effects were minimal and were not different between groups.
Darbepoetin alfa versus placebo or no treatment (Comparison 2)
We identified only one study for this comparison (Ohls 2013); therefore tests for heterogeneity were not applicable for any of the analyses.
We indicate the primary outcome. All other analyses were performed for secondary outcomes.
Use of one or more red blood cell transfusions (Outcome 2.1) ‐ Primary outcome
One study including 66 infants reported on this outcome. The RR of 0.62 (95% CI 0.38 to 1.02) was not significantly reduced, but the RD of ‐0.24 was significantly reduced (95% CI ‐0.48 to ‐0.01; NNTB 4, 95% CI 2 to 100) (Analysis 2.1).
Ohls 2013 reported the following secondary outcomes, which were not statistically significantly different between Darbe and no treatment groups: Total volume (mL/kg) of blood transfused per infant (all infants) (Outcome 2.2) (Analysis 2.2); Total volume (mL/kg) of blood transfused in transfused infants only (Outcome 2.3) (Analysis 2.3); Number of blood transfusions per infant (Outcome 2.4) (Analysis 2.4); Number of donors the infant was exposed to (Outcome 2.5) (Analysis 2.5); Mortality during initial hospital stay (all causes of mortality) (Outcome 2.6) (Analysis 2.6); Retinopathy of prematurity (all stages) (Outcome 2.7) (Analysis 2.7); Retinopathy of prematurity (stage ≥ 3) (Outcome 2.8) (Analysis 2.8); Necrotising enterocolitis (stage > 2) (Outcome 2.9) (Analysis 2.9); Proven sepsis (Outcome 2.10) (Analysis 2.10); Intraventricular haemorrhage (grades III and IV) (Outcome 2.11) (Analysis 2.11); Periventricular leukomalacia (Outcome 2.12) (Analysis 2.12); Bronchopulmonary dysplasia (supplemental oxygen at 36 weeks' PMA) (Outcome 2.13) (Analysis 2.13); Length of hospital stay (days) (Outcome 2.14) (Analysis 2.14); Neutropenia (Outcome 2.15) (Analysis 2.15); and Hypertension (Outcome 2.16) (Analysis 2.16).
Cerebral palsy (CP) at 18 to 22 months (Outcome 2.17)
One study including 51 infants reported on this outcome. The non‐significant RR was 0.08 (95% CI 0.00 to 1.40; P = 0.08), and the significantly reduced RD in favour of Darbe was ‐0.21 (95% CI ‐0.38 to ‐0.04; P = 0.02); the NNTB was 5 (95% CI 3 to 25) (Analysis 2.17).
Neurodevelopmental impairment (NDI) (having CP, visual defect, or cognitive score < 85) at 18 to 22 months (Outcome 2.18)
One study including 51 infants reported on this outcome. The significantly reduced RR was 0.27 (95% CI 0.08 to 0.86), and the significantly reduced RD was ‐0.31 (95% CI ‐0.54 to ‐0.08); the NNTB was 3 (95% CI 2 to 13) in favour of Darbe (Analysis 2.18).
BSID‐III composite cognitive scores at 18 to 22 months (Outcome 2.19)
One study including 51 infants reported on this outcome. The significantly increased MD in favour of Darbe was 7.50 (95% CI 1.44 to 13.56) (Analysis 2.19).
BSID‐III composite language score at 18 to 22 months (Outcome 2.20)
One study including 51 infants reported on this outcome. The significantly increased MD in favour of Darbe was 8.80 (95% CI 1.57 to 16.03) (Analysis 2.20).
BSID‐III social/emotional score at 18 to 22 months (Outcome 2.21)
One study including 51 infants reported on this outcome. The non‐significant MD was 6.80 (95% CI ‐3.82 to 17.42) (Analysis 2.21).
Object performance (OP) score at 18 to 22 months (Outcome 2.22)
One study including 51 infants reported on this outcome. The significant MD in favour of Darbe was 0.60 (95% CI 0.17 to 1.03) (Analysis 2.22).
WPPSI‐III FSIQ at 3.5 to 4 years of age (Outcome 2.23)
One study reported on this outcome in 29 infants. The significant MD in favour of Darbe was 15.27 (95% CI 2.60 to 27.94) (Analysis 2.23).
WPPSI‐III VIQ at 3.5 to 4 years of age (Outcome 2.24)
One study reported on this outcome in 29 infants. The non‐significant MD was 9.17 (95% CI ‐2.86 to 21.20) (Analysis 2.24).
WPPSI‐III PIQ at 3.5 to 4 years of age (Outcome 2.25)
One study reported on this outcome in 29 infants. The significant MD in favour of Darbe was 14.97 (95% CI 1.89 to 28.05) (Analysis 2.25).
WPPSI‐III GLC at 3.5 to 4 years of age (Outcome 2.26)
One study reported on this outcome in 29 infants. The non‐significant MD was 7.94 (95% CI ‐4.18 to 20.06) (Analysis 2.26).
Executive function at 3.5 to 4 years (Outcome 2.27)
One study reported on this outcome in 29 infants. The significant MD in favour of Darbe was 10.81 (95% CI 2.83 to 18.79) (Analysis 2.27).
Working memory at 3.5 to 4 years (Outcome 2.27)
One study reported on this outcome in 29 infants. The significant MD in favour of Darbe was 12.77 (95% CI 2.68 to 22.86) (Analysis 2.28).
Inhibition at 3.5 to 4 years of age (Outcome 2.28)
One study reported on this outcome in 29 infants. The non‐significant MD was 8.77 (95% CI ‐2.47 to 20.01) (Analysis 2.28).
Darbepoietin alfa or erythropoietin (ESA) versus placebo or no treatment (Comparison 3)
We identified only one study for this comparison (Ohls 2013); therefore tests for heterogeneity were not applicable for any of these analyses.
We indicate the primary outcome. All other analyses were performed for secondary outcomes.
BSID‐III composite cognitive scores at 18 to 22 months (Outcome 3.1) ‐ Primary outcome
One study including 80 infants reported on this outcome. The significantly increased MD in favour of ESA was 7.80 (95% CI 1.65 to 13.95) (Analysis 3.1). The quality of the evidence was moderate.
BSID‐III composite language score at 18 to 22 months (Outcome 3.2)
One study including 80 infants reported on this outcome. The significantly increased MD in favour of ESA was 7.10 (95% CI 0.49 to 13.71) (Analysis 3.2).
BSID‐III social/emotional score at 18 to 22 months (Outcome 3.3)
One study including 80 infants reported on this outcome. The non‐significant MD was 4.20 (95% CI ‐5.06 to 13.46) (Analysis 3.3).
OP score at 18 to 22 months (Outcome 3.4)
One study including 80 infants reported on this outcome. The non‐significant MD was 0.40 (95% CI ‐0.04 to 0.84) (Analysis 3.4).
Behavior Assessment System for Children (BASC‐2) composite scores at 3.5 to 4 years ‐ Adaptive skills (Outcome 3.5)
One study including 49 infants reported on this outcome. The non‐significant MD was 2.54 (95% CI ‐3.58 to 8.66) (Analysis 3.5).
BASC‐2 composite scores at 3.5 to 4 years ‐ Behaviour symptoms (Outcome 3.6)
One study including 49 infants reported on this outcome. The non‐significant MD was ‐8.66 (95% CI ‐18.01 to 0.69) (Analysis 3.6).
BASC‐2 composite scores at 3.5 to 4 years ‐ Externalising problems (Outcome 3.7)
One study including 49 infants reported on this outcome. The significantly reduced MD in favour of ESA was ‐8.00 (95% CI ‐15.94 to ‐0.06) (Analysis 3.7).
BASC‐2 composite scores at 3.5 to 4 years ‐ Internalising problems (Outcome 3.8)
One study including 49 infants reported on this outcome. The non‐significant MD was ‐2.56 (95% CI ‐9.25 to 4.13) (Analysis 3.8).
WPPSI‐III FSIQ at 3.5 to 4 years of age (Outcome 3.9) ‐ Primary outcome
One study reported on this outcome in 53 infants. The significantly increased MD in favour of ESA was 11.90 (95% CI 0.76 to 23.04) (Analysis 3.9). The quality of the evidence was low.
WPPSI‐III VIQ at 3.5 to 4 years of age (Outcome 3.10)
One study reported on this outcome in 53 infants. The non‐significant MD in favour of ESA was 8.80 (95% CI ‐1.75 to 19.35) (Analysis 3.10).
WPPSI‐III PIQ at 3.5 to 4 years of age (Outcome 3.11)
One study reported on this outcome in 53 infants. The significant MD in favour of ESA was 13.50 (95% CI 1.98 to 25.02) (Analysis 3.11).
WPPSI‐III GLC at 3.5 to 4 years of age (Outcome 3.12)
One study reported on this outcome in 53 infants. The significant MD in favour of ESA was 5.13 (95% CI ‐5.30 to 15.56) (Analysis 3.12).
Executive function at 3.5 to 4 years (Outcome 3.13)
One study reported on this outcome in 53 infants. The significant MD n favour of ESA was 8.36 (95% CI 0.51 to 16.21) (Analysis 3.13).
Working memory at 3.5 to 4 years (Outcome 3.14)
One study reported on this outcome in 53 infants. The non‐significant MD was 9.06 (95% CI ‐1.06 to 19.18) (Analysis 3.14).
Inhibition at 3.5 to 4 years of age (Outcome 3.15)
One study reported on this outcome in 53 infants. The non‐significant MD was 7.60 (95% CI ‐2.79 to 17.99) (Analysis 3.15).
Effectiveness of EPO administered early versus placebo in improving feeding tolerance and decreasing NEC
Erythropoietin versus placebo or no treatment (Comparison 4)
Time to achieve full enteral feeding (days) (Outcome 4.1) ‐ Primary outcome
One study (El‐Ganzoury 2014) reported on this outcome in 50 infants. EPO significantly reduced the time (days) to achieve full enteral feeding (MD ‐2.90 days, 95% CI ‐5.77 to ‐0.03). Testing for heterogeneity was not applicable. The quality of the evidence was low.
The outcome of NEC in this study is reported in Analysis 1.11, the outcome of mortality in Analysis 1.7, and the outcome of length of hospital stay in Analysis 1.15.
Discussion
Summary of main results
Short‐term outcomes
We included in this update 34 studies reporting on 3643 infants, representing an increase of 1434 trial participants from the 2014 update. Studies were performed in 22 countries. We excluded 22 studies. The quality of evidence ranged from high to low, according to GRADE (for specifics, see Quality of the evidence below).
Evidence from 19 of these 34 studies (n = 1750) indicates that early initiation of low or high doses of erythropoietin (EPO) administered at less than eight days of age reduced the need for one or more red blood cell transfusions. The total volume (mL/kg) of blood transfused per infant was reduced, as was the number of donors to whom the infant was exposed, among all randomised infants ‐ but not among infants who were transfused. Most studies included infants who had received transfusions before study entry. Many studies followed guidelines (with tremendous variation between studies) for red blood cell transfusions (see Additional tables, Table 1).
Mortality during initial hospital stay was not affected by EPO treatment (n = 2212).
Most important, good evidence now shows that early EPO does not increase the risk of retinopathy of prematurity (ROP) (stage ≥ 3) (n = 1165), which was a matter of concern in previous versions of this review.
This update of the review reports a significant reduction in the incidence of necrotising enterocolitis (NEC) in a very large sample (n = 2639). In a single small study (n = 50), mean time to achieve full enteral feeds was significantly reduced.
The incidence of intraventricular haemorrhage (IVH) (grades III and IV) (n = 1460) was significantly reduced, as was the incidence of periventricular leukomalacia (PVL) (n = 1469). It has been postulated that early red blood cell transfusions may increase the risk of extension of IVH grade I to higher grades (Baer 2011), and that late red blood cell transfusions may be associated with NEC (Blau 2011). It has been suggested that even small reductions in the number of transfusions given to neonates could have an impact on the occurrence of IVH and NEC (Ohls 2013; Ohls 2013a). As most IVHs and extensions of IVHs occur within the first 72 hours of life (Dolfin 1983), it is difficult to imagine that early EPO treatment with a very small reduction in transfusions over the whole study period (< 1) could have an impact on the incidence of IVH and on extension from a grade I to a grade III or IV haemorrhage. Previously (before the use of EPO for neuro protection), most studies had started the intervention beyond 72 hours of age. Our previous EPO review found no significant reductions in IVH or NEC (Ohlsson 2014). Results showing a possible association between transfusions in neonates and occurrence of transfusion‐associated NEC vary depending on study design (Kirpalani 2012). A lower incidence of NEC was found to be associated with more transfusions in randomised controlled trials ‐ an effect opposite to that seen in observational studies (transfusions are associated with NEC) (Kirpalani 2012).
Length of hospital stay was significantly reduced in the EPO group (n = 970).
Investigators reported no significant differences between EPO and control groups in the incidence of bronchopulmonary dysplasia (BPD) at 36 weeks' postmenstrual age (PMA) (n = 1719), nor in the incidence of proven sepsis (n = 2180).
Ultrasonographic signs of brain injury (IVH, PVL), BPD, severe ROP, and infection strongly predict risk of later death or neurosensory impairment as 18‐month outcomes of extremely low birth weight infants (Schmidt 2003; Bassler 2009). As evidence now suggests that EPO reduces the incidence of IVH and PVL ‐ although not of BPD, ROP, or sepsis ‐ it is possible that early treatment with EPO could have a neuro protective effect among preterm infants. However, data show no significant differences in 'Survivors at discharge from hospital without severe IVH, PVL, or ROP' in a high‐quality study including 443 infants.
Neuroprotection
This aspect of EPO use in neonates has been systematically reviewed outside of Cochrane (see the section Agreements and disagreements with other studies or reviews). Four studies included in this review were designed to assess EPO as a neuro protective agent (Fauchère 2008; He 2008; Fauchère 2015; Song 2016). In addition, Ohls 2013 reported on possible neuro protective effects of EPO and Darbe in follow‐up reports of the original cohort, although the objective of her primary study was to assess whether infants would respond to Darbe with reduced transfusion needs compared with no treatment, with less frequent dosing than with EPO. Fauchère 2008 used early EPO with the goal of providing neuro protection to very preterm infants. The primary hypothesis of this pilot study was that "the rate of survivors without brain injury (IVH and PVL) including ROP [is] not affected by administration of three high doses of EPO early after birth". The percentage of infants who survived without brain injury or ROP was 53% in the EPO group and 60% in the placebo group. However, five infants in the EPO group versus none in the placebo group died. The risk ratio (RR) for mortality was higher in this study when compared with results of other trials.
The purpose of He 2008 was to evaluate the effect of early EPO therapy on neuro behavioural development in preterm seven‐day‐old infants. This study was written in Chinese, and we were able to understand only the abstract, which was available in English (we have contacted trial authors to request additional information but have not received an answer). Neonatal Behavioral Neurological Assessment at 40 weeks' PMA and Gesell Developmental Schedule at 6 and 12 months after birth were used to assess infant participants. Results favoured the EPO group.
In our meta‐analyses, we identified conflicting results for short‐ and long‐term neurological outcomes. Data show significant reductions in white matter injury, signal abnormality, periventricular white matter loss, and grey matter injury among infants at term. At 18 to 24 months of age, incidences of Bayley‐II Mental Development Index (MDI) < 70, but not of Bayley‐II Psychomotor Development Index (PDI) < 70, were reduced. The Bayley‐II MDI at 18 to 24 months (n = 981) was significantly increased in the EPO group compared with the placebo group, but heterogeneity was high (I2 = 97%). The Bayley Scales of Infant Development ‐ Third Edition (BSID‐III) composite cognitive scores at 18 to 22 months were increased in favour of EPO in a small study (n = 53). In the same single study, the BSID‐III composite cognitive score at 18 to 22 months was increased in favour of erythropoiesis‐stimulating agents (ESAs) (n = 80), as was the Wechsler Preschool and Primary Scale of Intelligence ‐ Third Edition Full‐Scale Intelligence Quotient (WPPSI‐III FSIQ) score at 3.5 to 4 years of age (n = 53).
We found no significant difference in the incidence of 'Cerebral palsy at 18 to 24 months' corrected age' between EPO and placebo groups (n = 1172) but a significant reduction in 'Any neurodevelopmental impairment at 18 to 22 months' in the EPO group compared with the placebo group (n = 1130). 'Survival without major neurological or neurodevelopmental disorders at 2 years of age' was not reduced in the EPO group compared with the placebo group (n = 404). Death or moderate/severe neurological disability at 18 to 24 months was significantly reduced in the EPO group in a single study (n = 668), as was 'Moderate/severe disability at 18 to 24 months' (n = 613). The Darbe versus no treatment study (n = 51) reported a significant reduction for risk difference (RD) but not for risk ratio (RR) in 'Cerebral palsy at 18 to 22 months' in favour of Darbe. The same comparison revealed reduced risk of neurological developmental impairment (having cerebral palsy (CP), visual defect, hearing defect, or cognitive score < 85) at 18 to 22 months (n = 51). In the same study, BSID‐III composite cognitive scores, language scores, and objective permanence (OP) scores were significantly increased (n = 51), and in a smaller sample (n = 29), results were significantly better in the Darbe group compared with the no treatment group for WPPSI‐III Full‐Scale Intelligence Quotient (FSIQ), Performance Intelligence Quotient (PIQ), Executive function, and Working memory at 3.5 to 4 years of age.
Overall completeness and applicability of evidence
This review provides evidence that early administration of EPO significantly reduces the 'use of one or more blood transfusions' following study entry with a low number needed to treat for an additional beneficial outcome (NNTB) of 7 and a narrow 95% confidence interval (CI) of 6 to 10. From our results, we cannot make a recommendation with regard to the best combination of a high or low dose of EPO and a high or low dose of iron. We had arbitrarily set a cutoff of ≤ 5 mg/kg/d of oral intake for low and high doses of iron. When we conducted the review, we discovered that several studies started with intravenous administration of iron in variable doses, and we considered any intravenous dose of iron as a high dose. Early EPO significantly reduces the total volume of red blood cells transfused, the number of red blood cell transfusions per infant, and the number of donor exposures. For these outcomes, effect sizes were small and are likely to be of limited clinical importance. Overall, early EPO provides very limited clinical benefit with regards to a reduction in the use of red blood cell transfusion; therefore, its use for this purpose is not recommended.
Good evidence suggests that early use of EPO does not have a statistically significant effect on mortality. This update of the review provides high‐quality evidence obtained by GRADE to show that early EPO does not increase the risk of ROP (stage ≥ 3).
In this update of the review, some important short‐term outcomes are now statistically significantly reduced: IVH (grades III and IV) (Analysis 1.13), PVL (Analysis 1.14), and NEC (Analysis 1.11) (all moderate‐quality evidence by GRADE). In these analyses, the only study that showed a significant reduction in the incidence of these outcomes was Song 2016 ‐ a large study (n = 743) ‐ and in the analyses, this study carried weights of 72.8% for IVH, 89.2% for PVL, and 47.8% for NEC. The second largest included study ‐ Fauchère 2015 (n = 443) ‐ did not show significant differences among these three outcomes. It is expected that results of the two ongoing large studies (NCT01378273; NCT02550054) will shed light on these conflicting results. Until that time, early EPO is not recommended to reduce IVH, PVL, or NEC.
As noted above, results of long‐term follow‐up studies are conflicting; Song 2016 (n = 613) reported a marked increase in the Bayley‐II MDI at 18 to 24 months by 11 points (Analysis 1.28), whereas Fauchère 2015 (n = 365) showed a non‐significant decrease of one point. Heterogeneity for this outcome was extreme (I2 = 97%). For the outcome 'Any neurodevelopmental impairment at 18 to 22 months' corrected age', evidence shows large differences between the two largest studies: Song 2016 (n = 613) showed a highly statistically significant reduction in the outcome, whereas Fauchère 2015 (n = 365) did not.
Again, it is hoped that the ongoing studies referenced above will resolve these conflicting results; until that time, early EPO is not recommended for neuro protection or for improved long‐term neurodevelopmental outcomes.
Quality of the evidence
Evidence shows statistically significant (moderate) heterogeneity for the primary outcome ('use of one or more blood transfusions') as well as for two important secondary outcomes ('total volume of blood transfused per infant' and 'number of transfusions per infant'). In previous versions of this review, we have tried to explain heterogeneity by performing secondary analyses based on perceived study quality and different transfusion practices. As we were not able to present an explanation, we excluded those analyses from this update. We have presented our concerns about heterogeneity both above and in the 'Summary of findings' tables (summary of findings Table for the main comparison; summary of findings Table 2; summary of findings Table 3; summary of findings Table 4).
We have presented in the 'Summary of findings' tables our judgements according to GRADE, regarding quality of the evidence for important primary and secondary outcomes (summary of findings Table for the main comparison; summary of findings Table 2; summary of findings Table 3; summary of findings Table 4).
We rated the quality of evidence (GRADE) as high for 'Mortality during initial hospital stay', 'ROP (stage ≥ 3)', 'Survivors at discharge from hospital without severe IVH, PVL, ROP', and 'Cerebral palsy at 18 to 24 months'. We rated the quality of evidence (GRADE) as moderate for 'NEC', 'IVH', 'PVL', and 'BSID‐III composite cognitive scores at 18 to 22 months'. We rated the quality of evidence (GRADE) as low for 'Use of one or more red blood cell transfusions (low and high doses of EPO)', 'Any neurodevelopmental impairment at 18 to 22 months' corrected age', 'Bayley‐II MDI at 18 to 24 months', 'Time to achieve full enteral feeding', and 'WPPSI‐III FSIQ at 3.5 to 4 years of age'.
Among the few infants studied to date, Darbe appears to have effectiveness similar to that of EPO. Too few infants have been studied for assessment of its safety. Darbepoetin does offer the advantage of fewer injections required, thus reducing painful stimuli for this vulnerable population.
A funnel plot for the primary outcome 'use of one or more red blood cell transfusions' was asymmetrical, with relative absence of smaller studies not having a protective effect (Figure 5). This may indicate that smaller studies with 'negative' results have not been published.
Potential biases in the review process
We are not aware of any potential biases in our review process.
Agreements and disagreements with other studies or reviews
Early systematic reviews (which included fewer studies than were included in our reviews) have not included ROP or other common neonatal outcomes as outcome measures (Vamvakas 2001; Garcia 2002; Kotto‐Kome 2004). Those reviews noted similar effect sizes for transfusion needs and reported on statistically significant between‐study heterogeneity.
Xu 2014 performed a meta‐analysis of EPO and ROP. Review authors included randomised controlled trials (RCTs), observational cohort studies, and retrospective case–control studies. They concluded that EPO treatment is not associated with development of ROP in preterm infants, but this conclusion should be confirmed by further high‐quality research. Chou 2017 performed a systematic review of early and late EPO administration and risk of ROP in preterm infants. These review authors included unpublished data from Maier 2002, which we had obtained from trial authors and had included in our Cochrane review. Results provided in Chou 2017 for the early EPO group correspond to those of our current updated review, except that we included two additional studies (Fauchère 2015; Peltoniemi 2017), thereby increasing the power of our analysis. Their conclusions that EPO administration did not increase the risk of ROP of any stage reported or of stage ≥ 3 are consistent with our findings in this update.
Zhang 2013 performed a review titled "Neuroprotection with erythropoietin in preterm and/or low birth weight infants". These review authors included four studies for the primary outcome of neurodevelopmental disability and concluded that use of EPO, to some extent, is associated with a reduction in neurodevelopmental disability in preterm infants. They included the Bierer 2006 report. One of the authors of this study, Dr. R.K. Ohls, informed us that this study reported on a subgroup of the Ohls 2001A study. All outcomes of Bierer 2006 are included in the 2004 follow‐up publication of the Ohls 2001A study. Thus analyses that include results from both Ohls 2001A (follow‐up, Ohls 2004) and Bierer 2006 are incorrect, as they include the same children twice. Under '2.6. Data extraction' review authors write, "All abstracts and published studies identified as potentially relevant by the literature search were assessed for inclusion by two review authors. Each author extracted data separately on a data extraction form. The information was then compared, and differences were resolved by consensus. One review author (A.O.) entered data into RevMan 5.1 Software (Cochrane Collaboration, Oxford, UK), and the other (S.A.) cross‐checked the printout against his own data extraction forms and any errors were corrected. For the studies identified in abstract form, the primary author was contacted to obtain further information". This paragraph has been directly copied from our previous review, including our initials (A.O. and S.A.). That review included results of the Newton 1999 report. Trial authors followed up to seven years of age 40 infants who had been enrolled in two pilot studies and one multi‐centre study at the University of California, San Francisco. The three included studies enrolled infants at eight or more days, at 10 to 35 days, and at 23 to 24 days of age. Those infants do not meet our inclusion criterion of age less than eight days. One included study was an observational study (Neubauer 2010). Owing to the concerns raised above, the results of this review are not valid.
Wang 2015 performed a meta‐analysis of the protective effect of EPO for neurodevelopment in preterm infants. Review authors concluded that EPO treatment has beneficial effects on neurodevelopmental outcomes without severe adverse side effects. They included two RCTs and three quasi‐randomised trials. They included the Bierer 2006 report, which we know from Dr. Ohls is a duplicate publication of her follow‐up study from 2004 (listed under Ohls 2001A). Thus the seven analyses that include results from both Ohls 2001A (follow‐up of Ohls 2004) and Bierer 2006 are incorrect, and results of this review are not valid.
Fischer 2017 presented a meta‐analysis of prophylactic early EPO in preterm infants. Review authors included four RCTs and referred to follow‐up studies (Ohls 2004, Ohls 2014, Natalucci 2016) of the original reports ‐ not the report of the primary study, except for Song 2016, which included long‐term follow‐up in the original report. We included follow‐up reports under the original studies (Ohls 2001A; Ohls 2013; Fauchère 2015; Song 2016). In addition, we included unpublished information from Fauchère 2008, along with one new study (Peltoniemi 2017). The primary outcome of the meta‐analysis by Fischer 2017 was the number of infants with a Mental Developmental Index (MDI) < 70 on the Bayley Scales of Infant Development ‐ Second Edition (BSID‐II) at 18 to 24 months’ corrected age. If infants were assessed according to the Third Edition (BSID‐III), review authors used cognitive scores < 85 as the primary outcome. We kept analyses for BSID‐II and BSID‐III separate. Sharp 2017 in a randomised cross‐over study found that when severity of delay was classified via standardised cut‐points for moderate and severe developmental delay (1 and 2 SDs below reference norm), 40% of children were classified as less severely delayed with the Bayley‐III cognitive composite score than with the BSID‐II MDI, whereas only one child (< 2%) was classified as more severely delayed with the Bayley‐III. Sharp 2017 concluded that "these findings have critical implications for both the interpretation of clinical research studies and determination of eligibility for services in high‐risk children". Fischer 2017 found that prophylactic EPO improved the cognitive development of very preterm infants as assessed by the MDI at corrected age of 18 to 24 months. However, review authors did not report on the MDI at that age, but on MDI < 70 at corrected age of 18 to 24 months. We found a similar reduction in this outcome and an increase in the WMD in Bayley‐II at 18 to 24 months. Authors of the review state that they followed standard methods of the Cochrane Neonatal Review Group but made two deviations from the Cochrane Neonatal standard method, that is, they used the odds ratio and the random‐effects model when performing these analyses. Review authors concluded that "prophylactic rhEPO improved the cognitive development of very preterm infants, as assessed by the MDI at a corrected age of 18 to 24 months, without affecting other neurodevelopmental outcomes. Current and future RCTs should investigate optimal dosing and timing of prophylactic rhEPO and plan for long‐term neurodevelopmental follow‐up" (Fischer 2017). Like us, Fischer 2017 raised concerns about lack of blinding, late registration, and differences in primary outcomes between the registration document and the final report in Song 2016 (high risk). We found significant results for several neurodevelopmentally related outcomes in infants treated with EPO; and reduced rates of IVH, PVL, white and grey matter injury at term, any neurodevelopmental impairment at 18 to 22 months' corrected age, moderate/severe neurological disability at 18 to 24 months, and death or moderate/severe neurological disability at 18 to 24 months. Many of these results were strongly influenced by results from Song 2016, for which both Fischer 2017 and we were concerned about high risk of bias. It is important that ongoing trials such as NCT01378273 and NCT02550054 are conducted and completed, with long‐term follow‐up provided in a timely fashion.

Study flow diagram: review update.
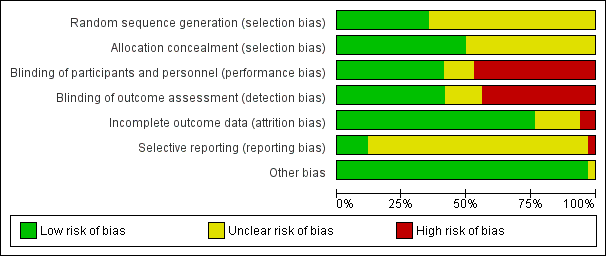
Risk of bias graph: review authors' judgements about each risk of bias item presented as percentages across all included studies.

Risk of bias summary: review authors' judgements about each risk of bias item for each included study.

Forest plot of comparison: 1 Erythropoietin versus placebo or no treatment, outcome: 1.1 Use of 1 or more red blood cell transfusions (low and high doses of EPO).

Funnel plot of comparison: 1 Erythropoietin versus placebo or no treatment, outcome: 1.1 Use of 1 or more red blood cell transfusions (low and high doses of EPO).
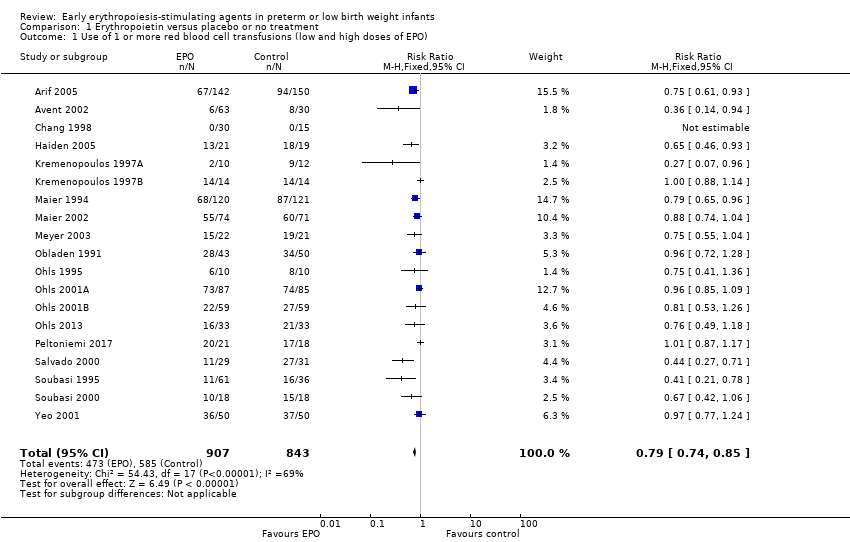
Comparison 1 Erythropoietin versus placebo or no treatment, Outcome 1 Use of 1 or more red blood cell transfusions (low and high doses of EPO).

Comparison 1 Erythropoietin versus placebo or no treatment, Outcome 2 Use of 1 or more blood transfusions (high dose of EPO).
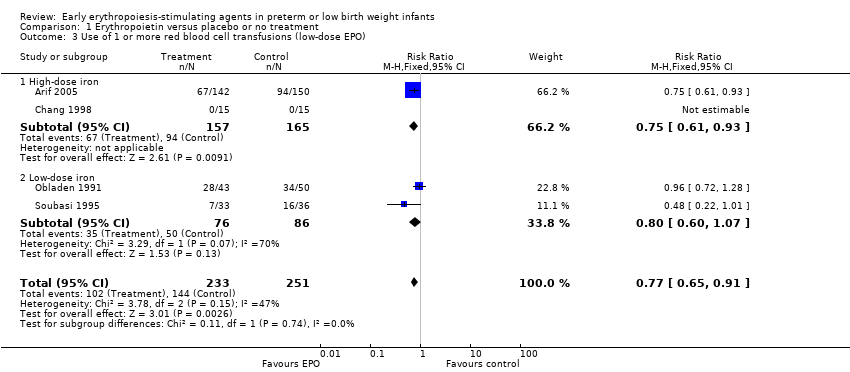
Comparison 1 Erythropoietin versus placebo or no treatment, Outcome 3 Use of 1 or more red blood cell transfusions (low‐dose EPO).

Comparison 1 Erythropoietin versus placebo or no treatment, Outcome 4 Total volume (mL/kg) of blood transfused per infant.
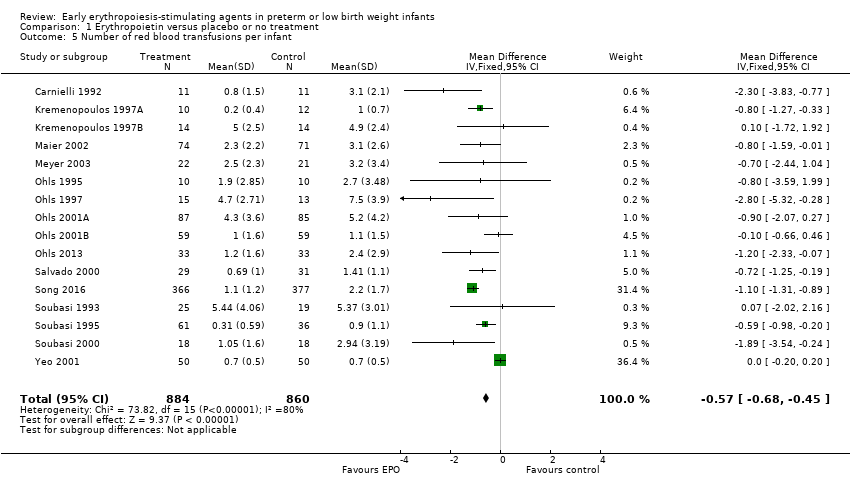
Comparison 1 Erythropoietin versus placebo or no treatment, Outcome 5 Number of red blood transfusions per infant.
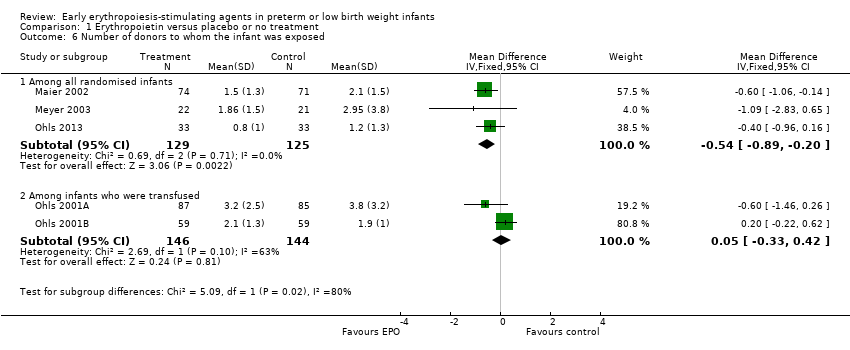
Comparison 1 Erythropoietin versus placebo or no treatment, Outcome 6 Number of donors to whom the infant was exposed.

Comparison 1 Erythropoietin versus placebo or no treatment, Outcome 7 Mortality during initial hospital stay (all causes of mortality).
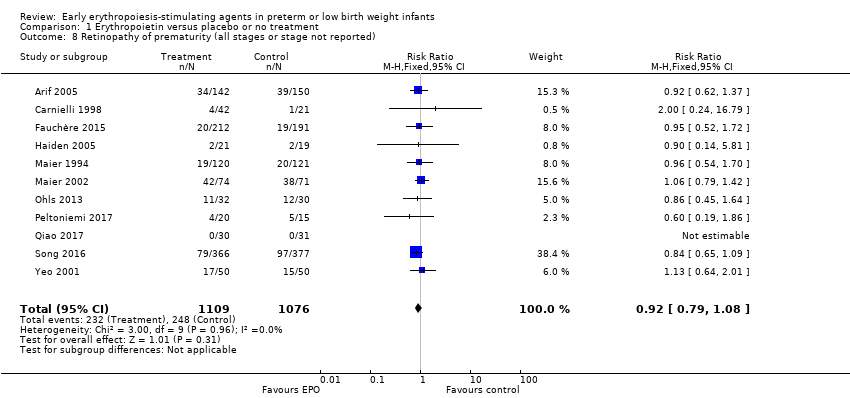
Comparison 1 Erythropoietin versus placebo or no treatment, Outcome 8 Retinopathy of prematurity (all stages or stage not reported).
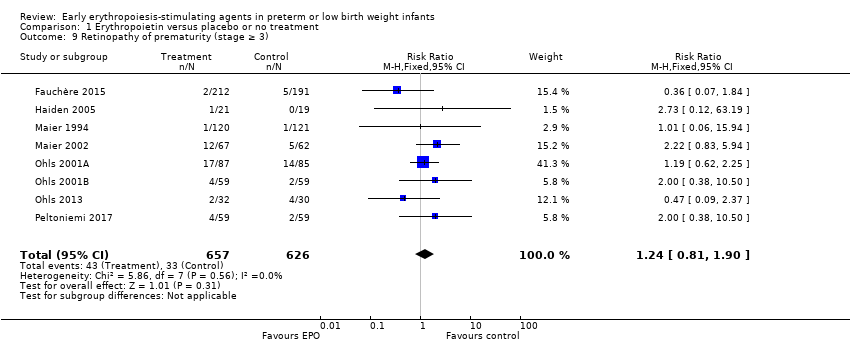
Comparison 1 Erythropoietin versus placebo or no treatment, Outcome 9 Retinopathy of prematurity (stage ≥ 3).

Comparison 1 Erythropoietin versus placebo or no treatment, Outcome 10 Proven sepsis.

Comparison 1 Erythropoietin versus placebo or no treatment, Outcome 11 Necrotising enterocolitis (stage not reported).

Comparison 1 Erythropoietin versus placebo or no treatment, Outcome 12 Intraventricular haemorrhage (all grades).
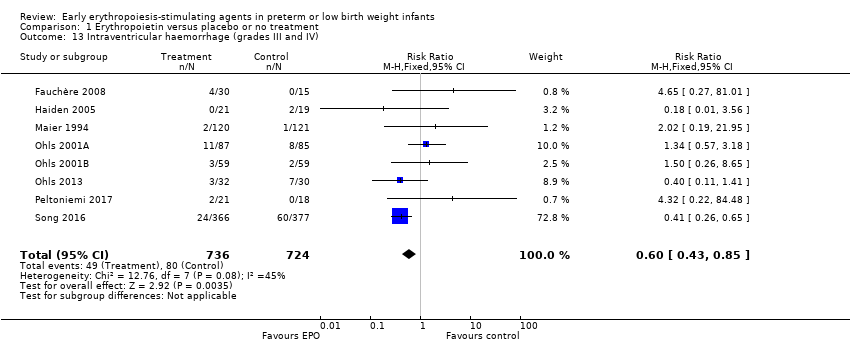
Comparison 1 Erythropoietin versus placebo or no treatment, Outcome 13 Intraventricular haemorrhage (grades III and IV).

Comparison 1 Erythropoietin versus placebo or no treatment, Outcome 14 Periventricular leukomalacia.

Comparison 1 Erythropoietin versus placebo or no treatment, Outcome 15 Length of hospital stay (days).

Comparison 1 Erythropoietin versus placebo or no treatment, Outcome 16 Bronchopulmonary dysplasia.
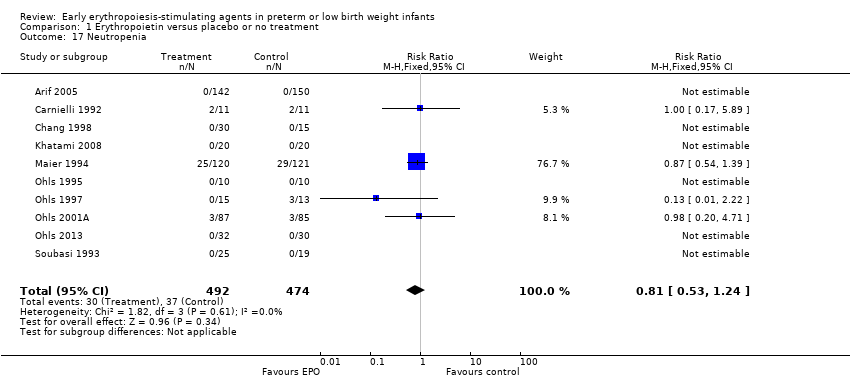
Comparison 1 Erythropoietin versus placebo or no treatment, Outcome 17 Neutropenia.

Comparison 1 Erythropoietin versus placebo or no treatment, Outcome 18 Hypertension.

Comparison 1 Erythropoietin versus placebo or no treatment, Outcome 19 Hemangioma.
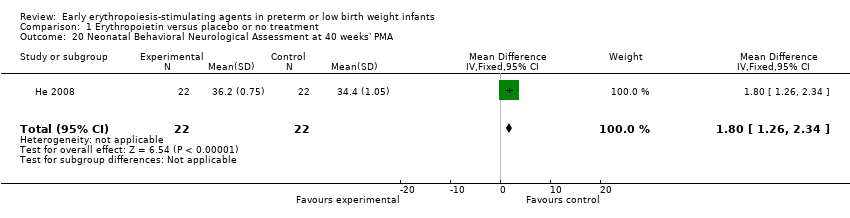
Comparison 1 Erythropoietin versus placebo or no treatment, Outcome 20 Neonatal Behavioral Neurological Assessment at 40 weeks' PMA.
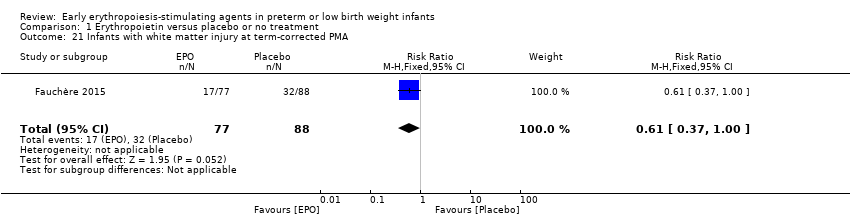
Comparison 1 Erythropoietin versus placebo or no treatment, Outcome 21 Infants with white matter injury at term‐corrected PMA.
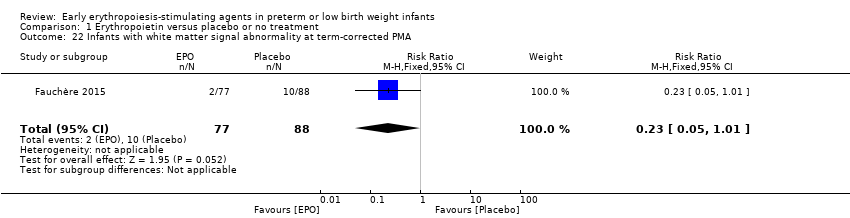
Comparison 1 Erythropoietin versus placebo or no treatment, Outcome 22 Infants with white matter signal abnormality at term‐corrected PMA.
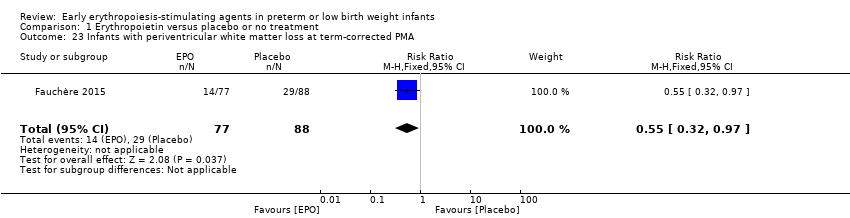
Comparison 1 Erythropoietin versus placebo or no treatment, Outcome 23 Infants with periventricular white matter loss at term‐corrected PMA.

Comparison 1 Erythropoietin versus placebo or no treatment, Outcome 24 Infants with grey matter injury at term‐corrected PMA.

Comparison 1 Erythropoietin versus placebo or no treatment, Outcome 25 Survivors at discharge from hospital without severe IVH, PVL, ROP.

Comparison 1 Erythropoietin versus placebo or no treatment, Outcome 26 Bayley‐II MDI < 70 at 18 to 24 months' corrected age.

Comparison 1 Erythropoietin versus placebo or no treatment, Outcome 27 Bayley‐II PDI < 70 at 18 to 22 months' corrected age (in children examined).
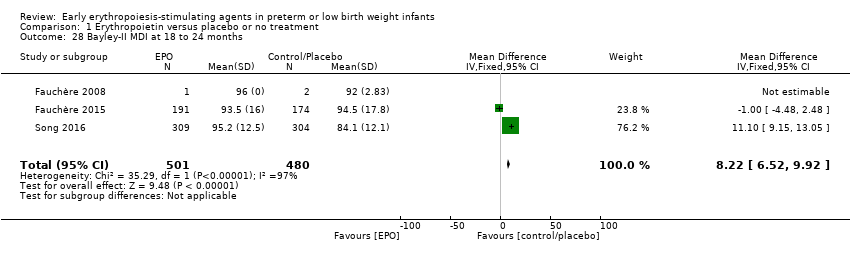
Comparison 1 Erythropoietin versus placebo or no treatment, Outcome 28 Bayley‐II MDI at 18 to 24 months.

Comparison 1 Erythropoietin versus placebo or no treatment, Outcome 29 Bayley‐II PDI at 18 to 24 months.
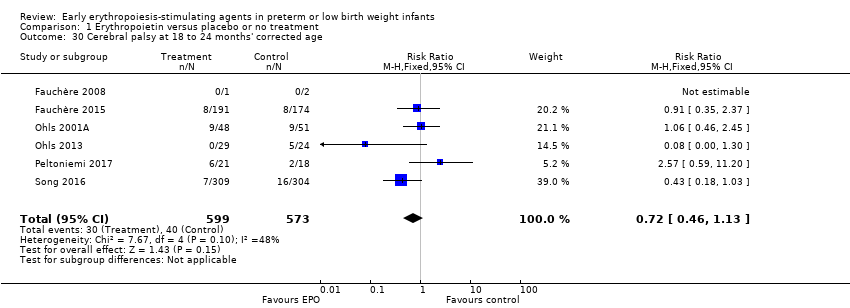
Comparison 1 Erythropoietin versus placebo or no treatment, Outcome 30 Cerebral palsy at 18 to 24 months' corrected age.
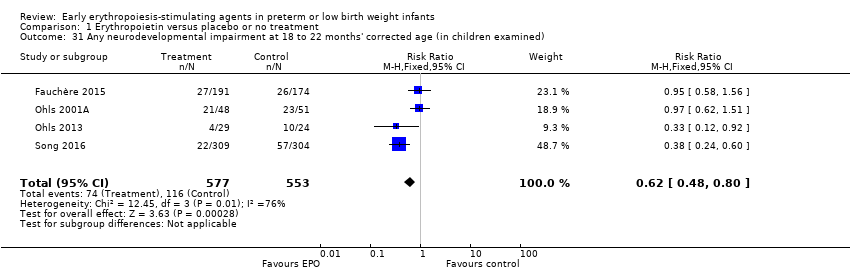
Comparison 1 Erythropoietin versus placebo or no treatment, Outcome 31 Any neurodevelopmental impairment at 18 to 22 months' corrected age (in children examined).

Comparison 1 Erythropoietin versus placebo or no treatment, Outcome 32 Visual impairment at 18 to 24 months' corrected age.

Comparison 1 Erythropoietin versus placebo or no treatment, Outcome 33 Hearing impairment at 18 to 24 months' corrected age.
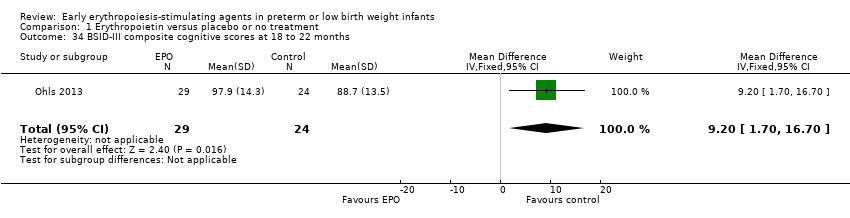
Comparison 1 Erythropoietin versus placebo or no treatment, Outcome 34 BSID‐III composite cognitive scores at 18 to 22 months.
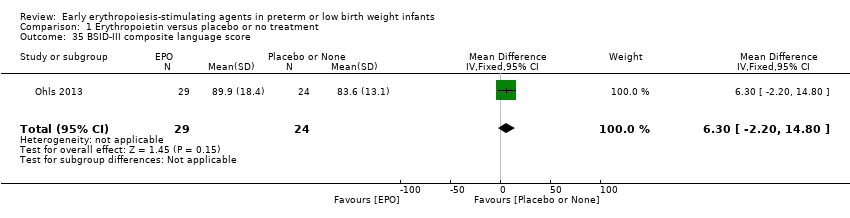
Comparison 1 Erythropoietin versus placebo or no treatment, Outcome 35 BSID‐III composite language score.

Comparison 1 Erythropoietin versus placebo or no treatment, Outcome 36 BSID‐III composite social/emotional score.

Comparison 1 Erythropoietin versus placebo or no treatment, Outcome 37 BSID‐III object performance (OP) score.

Comparison 1 Erythropoietin versus placebo or no treatment, Outcome 38 WPPSI‐III FSIQ at 3.5 to 4 years of age.
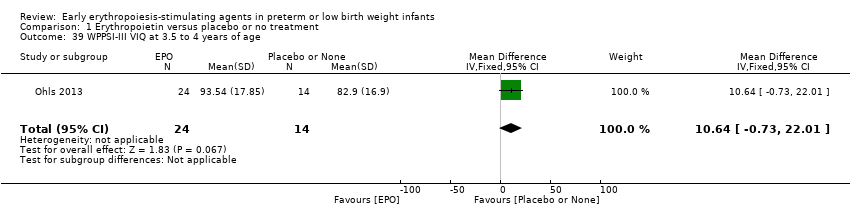
Comparison 1 Erythropoietin versus placebo or no treatment, Outcome 39 WPPSI‐III VIQ at 3.5 to 4 years of age.

Comparison 1 Erythropoietin versus placebo or no treatment, Outcome 40 WPPSI‐III PIQ at 3.5 to 4 years of age.

Comparison 1 Erythropoietin versus placebo or no treatment, Outcome 41 WPPSI‐III GLC at 3.5 to 4 years of age.

Comparison 1 Erythropoietin versus placebo or no treatment, Outcome 42 Executive function at 3.5 to 4 years of age.
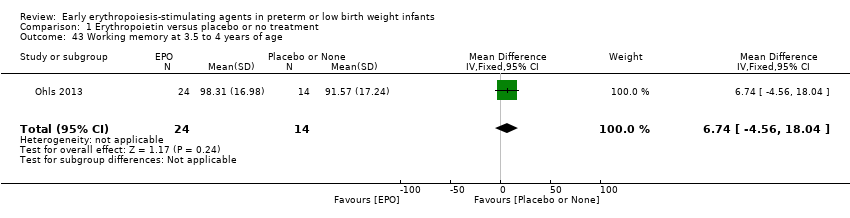
Comparison 1 Erythropoietin versus placebo or no treatment, Outcome 43 Working memory at 3.5 to 4 years of age.
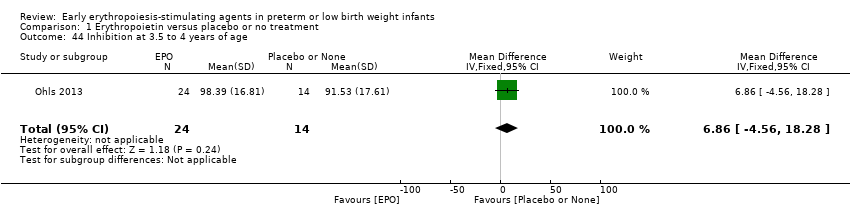
Comparison 1 Erythropoietin versus placebo or no treatment, Outcome 44 Inhibition at 3.5 to 4 years of age.

Comparison 1 Erythropoietin versus placebo or no treatment, Outcome 45 Griffiths Developmental Scale at 2 years of age.
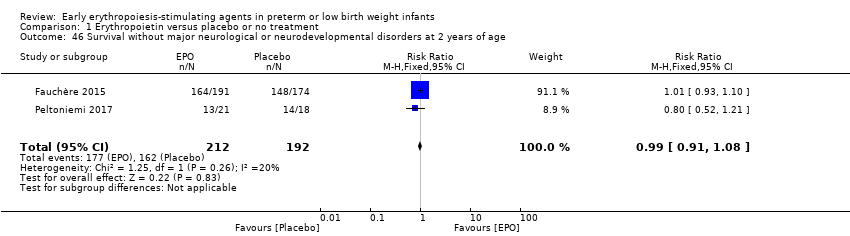
Comparison 1 Erythropoietin versus placebo or no treatment, Outcome 46 Survival without major neurological or neurodevelopmental disorders at 2 years of age.

Comparison 1 Erythropoietin versus placebo or no treatment, Outcome 47 Death or moderate/severe neurological disability at 18 to 24 months.
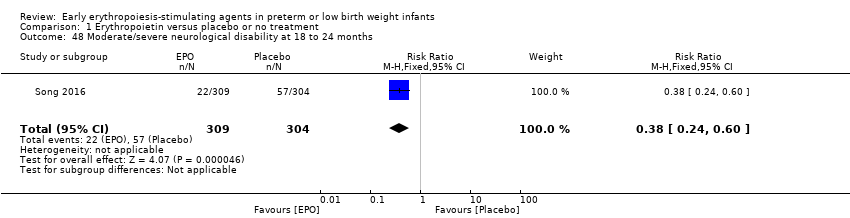
Comparison 1 Erythropoietin versus placebo or no treatment, Outcome 48 Moderate/severe neurological disability at 18 to 24 months.

Comparison 2 Darbepoetin alfa versus placebo or no treatment, Outcome 1 Use of 1 or more red blood cell transfusions.

Comparison 2 Darbepoetin alfa versus placebo or no treatment, Outcome 2 Total volume (mL/kg) of blood transfused per infant (all infants).
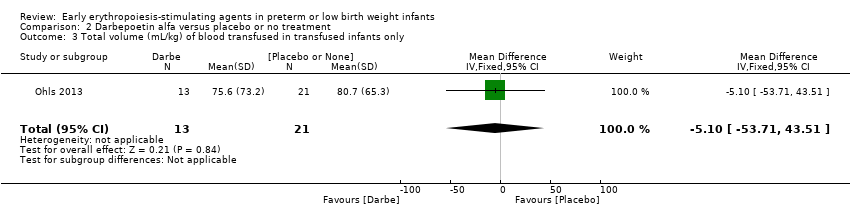
Comparison 2 Darbepoetin alfa versus placebo or no treatment, Outcome 3 Total volume (mL/kg) of blood transfused in transfused infants only.

Comparison 2 Darbepoetin alfa versus placebo or no treatment, Outcome 4 Number of blood transfusions per infant.

Comparison 2 Darbepoetin alfa versus placebo or no treatment, Outcome 5 Number of donors the infant was exposed to.

Comparison 2 Darbepoetin alfa versus placebo or no treatment, Outcome 6 Mortality during initial hospital stay (all causes of mortality).

Comparison 2 Darbepoetin alfa versus placebo or no treatment, Outcome 7 Retinopathy of prematurity (all stages).
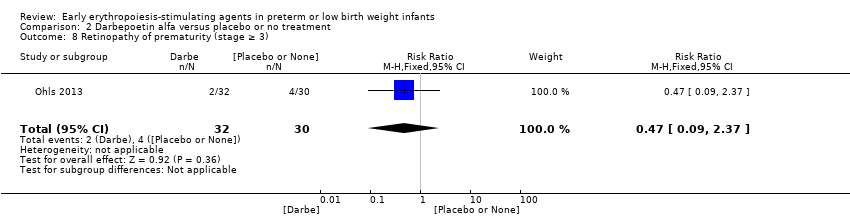
Comparison 2 Darbepoetin alfa versus placebo or no treatment, Outcome 8 Retinopathy of prematurity (stage ≥ 3).

Comparison 2 Darbepoetin alfa versus placebo or no treatment, Outcome 9 Necrotising enterocolitis (> stage 2).

Comparison 2 Darbepoetin alfa versus placebo or no treatment, Outcome 10 Proven sepsis.

Comparison 2 Darbepoetin alfa versus placebo or no treatment, Outcome 11 Intraventricular haemorrhage (grades III and IV).
Comparison 2 Darbepoetin alfa versus placebo or no treatment, Outcome 12 Periventricular leukomalacia.

Comparison 2 Darbepoetin alfa versus placebo or no treatment, Outcome 13 Bronchopulmonary dysplasia (supplemental oxygen at 36 weeks' PMA).

Comparison 2 Darbepoetin alfa versus placebo or no treatment, Outcome 14 Length of hospital stay (days).

Comparison 2 Darbepoetin alfa versus placebo or no treatment, Outcome 15 Neutropenia.

Comparison 2 Darbepoetin alfa versus placebo or no treatment, Outcome 16 Hypertension.

Comparison 2 Darbepoetin alfa versus placebo or no treatment, Outcome 17 Cerebral palsy at 18 to 22 months.
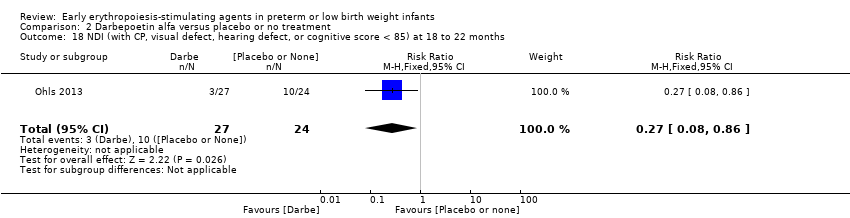
Comparison 2 Darbepoetin alfa versus placebo or no treatment, Outcome 18 NDI (with CP, visual defect, hearing defect, or cognitive score < 85) at 18 to 22 months.

Comparison 2 Darbepoetin alfa versus placebo or no treatment, Outcome 19 BSID‐III composite cognitive score at 18 to 22 months.
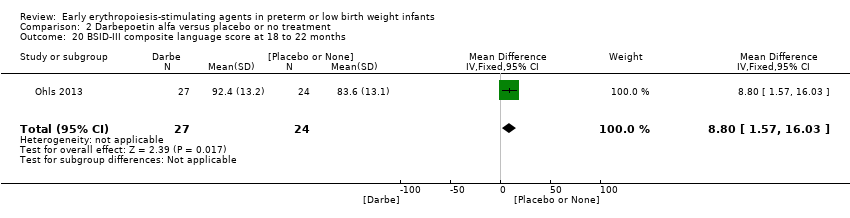
Comparison 2 Darbepoetin alfa versus placebo or no treatment, Outcome 20 BSID‐III composite language score at 18 to 22 months.

Comparison 2 Darbepoetin alfa versus placebo or no treatment, Outcome 21 Bayley‐III social/emotional score at 18 to 22 months.
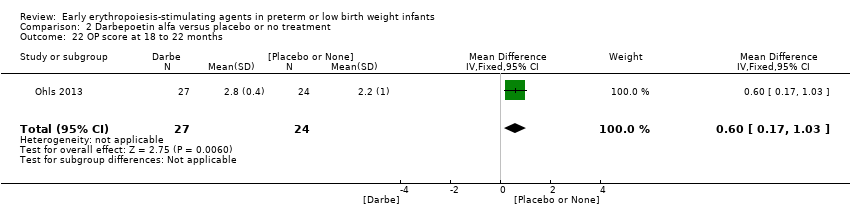
Comparison 2 Darbepoetin alfa versus placebo or no treatment, Outcome 22 OP score at 18 to 22 months.

Comparison 2 Darbepoetin alfa versus placebo or no treatment, Outcome 23 WPPSI‐III FSIQ at 3.5 to 4 years of age.

Comparison 2 Darbepoetin alfa versus placebo or no treatment, Outcome 24 WPPSI‐III VIQ at 3.5 to 4 years of age.

Comparison 2 Darbepoetin alfa versus placebo or no treatment, Outcome 25 WPPSI‐III PIQ at 3.5 to 4 years of age.

Comparison 2 Darbepoetin alfa versus placebo or no treatment, Outcome 26 WPPSI‐III GLC at 3.5 to 4 years of age.

Comparison 2 Darbepoetin alfa versus placebo or no treatment, Outcome 27 Executive function at 3.5 to 4 years of age.

Comparison 2 Darbepoetin alfa versus placebo or no treatment, Outcome 28 Working memory at 3.5 to 4 years of age.

Comparison 2 Darbepoetin alfa versus placebo or no treatment, Outcome 29 Inhibition at 3.5 to 4 years of age.

Comparison 3 Darbepoetin alfa or erythropoietin (erythropoiesis‐stimulating agents ‐ ESAs) versus placebo or no treatment, Outcome 1 BSID‐III composite cognitive score at 18 to 22 months.
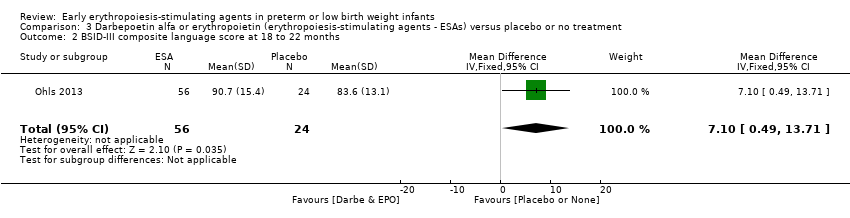
Comparison 3 Darbepoetin alfa or erythropoietin (erythropoiesis‐stimulating agents ‐ ESAs) versus placebo or no treatment, Outcome 2 BSID‐III composite language score at 18 to 22 months.

Comparison 3 Darbepoetin alfa or erythropoietin (erythropoiesis‐stimulating agents ‐ ESAs) versus placebo or no treatment, Outcome 3 BSID‐III composite social/emotional score at 18 to 22 months.

Comparison 3 Darbepoetin alfa or erythropoietin (erythropoiesis‐stimulating agents ‐ ESAs) versus placebo or no treatment, Outcome 4 OP score at 18 to 24 months.
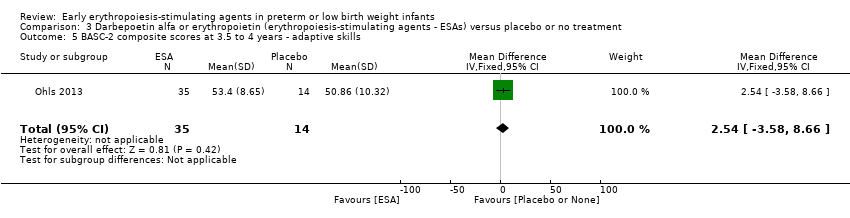
Comparison 3 Darbepoetin alfa or erythropoietin (erythropoiesis‐stimulating agents ‐ ESAs) versus placebo or no treatment, Outcome 5 BASC‐2 composite scores at 3.5 to 4 years ‐ adaptive skills.

Comparison 3 Darbepoetin alfa or erythropoietin (erythropoiesis‐stimulating agents ‐ ESAs) versus placebo or no treatment, Outcome 6 BASC‐2 composite scores at 3.5 to 4 years ‐ behaviour symptoms.
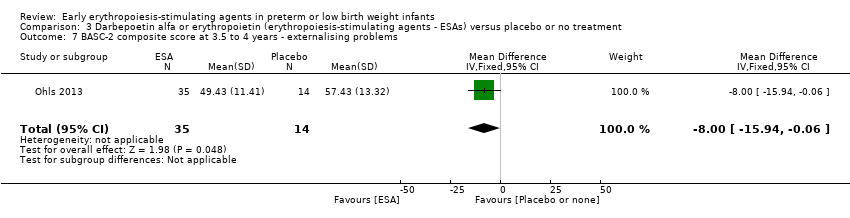
Comparison 3 Darbepoetin alfa or erythropoietin (erythropoiesis‐stimulating agents ‐ ESAs) versus placebo or no treatment, Outcome 7 BASC‐2 composite score at 3.5 to 4 years ‐ externalising problems.

Comparison 3 Darbepoetin alfa or erythropoietin (erythropoiesis‐stimulating agents ‐ ESAs) versus placebo or no treatment, Outcome 8 BASC‐2 composite scores at 3.5 to 4 years ‐ internalising problems.
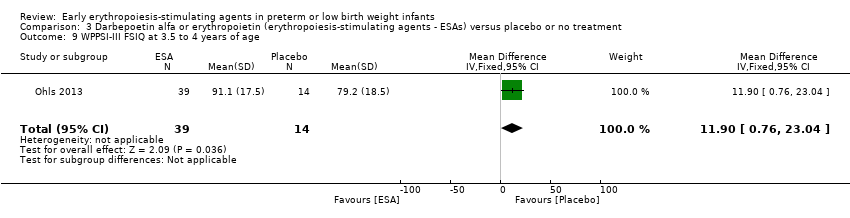
Comparison 3 Darbepoetin alfa or erythropoietin (erythropoiesis‐stimulating agents ‐ ESAs) versus placebo or no treatment, Outcome 9 WPPSI‐III FSIQ at 3.5 to 4 years of age.

Comparison 3 Darbepoetin alfa or erythropoietin (erythropoiesis‐stimulating agents ‐ ESAs) versus placebo or no treatment, Outcome 10 WPPSI‐III VIQ at 3.5 to 4 years of age.
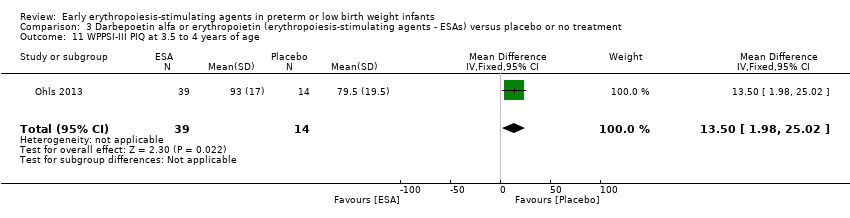
Comparison 3 Darbepoetin alfa or erythropoietin (erythropoiesis‐stimulating agents ‐ ESAs) versus placebo or no treatment, Outcome 11 WPPSI‐III PIQ at 3.5 to 4 years of age.

Comparison 3 Darbepoetin alfa or erythropoietin (erythropoiesis‐stimulating agents ‐ ESAs) versus placebo or no treatment, Outcome 12 WPPSI‐III GLC at 3.5 to 4 years of age.

Comparison 3 Darbepoetin alfa or erythropoietin (erythropoiesis‐stimulating agents ‐ ESAs) versus placebo or no treatment, Outcome 13 Executive function at 3.5 to 4 years.
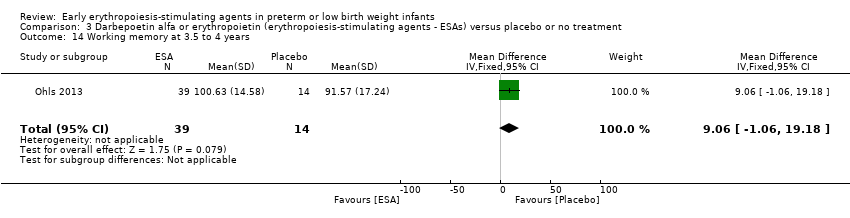
Comparison 3 Darbepoetin alfa or erythropoietin (erythropoiesis‐stimulating agents ‐ ESAs) versus placebo or no treatment, Outcome 14 Working memory at 3.5 to 4 years.
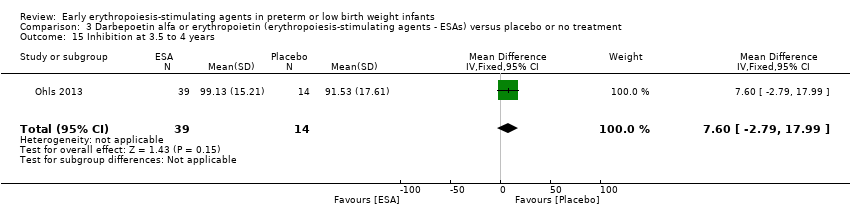
Comparison 3 Darbepoetin alfa or erythropoietin (erythropoiesis‐stimulating agents ‐ ESAs) versus placebo or no treatment, Outcome 15 Inhibition at 3.5 to 4 years.
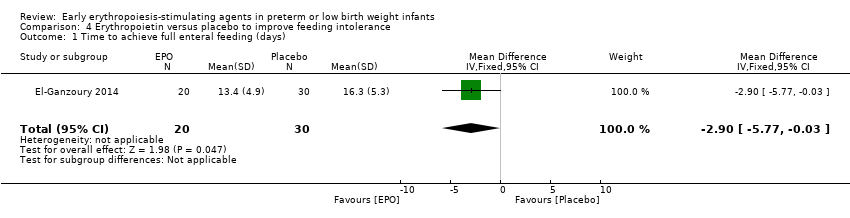
Comparison 4 Erythropoietin versus placebo to improve feeding intolerance, Outcome 1 Time to achieve full enteral feeding (days).
| Erythropoietin compared with placebo or no treatment for complications of preterm birth ‐ primary outcomes | ||||||
| Patient or population: preterm infants with low birth weight Settings: NICU Intervention: EPO Comparison: placebo or no treatment | ||||||
| Outcomes | Illustrative comparative risks* (95% CI) | Relative effect | No. of participants | Quality of the evidence | Comments | |
| Assumed risk | Corresponding risk | |||||
| Placebo or no treatment | EPO | |||||
| Use of 1 or more red blood cell transfusions (low and high doses of EPO) | High‐risk population | RR: 0.79 (95% CI 0.74 to 0.85) | 1750 | ⊕⊕⊝⊝ | Bias: We had concerns about performance bias and detection bias in 10 of the studies. We downgraded the quality of the evidence by 1 step. Heterogeneity/Consistency: I2 for the typical RR was 69% and for the typical RD 62% (both moderate quality). We downgraded the quality of the evidence by 1 step. Directness of evidence: Studies were conducted in the target population. Precision: Because of the large sample size (n = 1750), the point estimate was precise with a narrow 95% CI. Presence of publication bias: The funnel plot was symmetrical for all larger studies. | |
| 694 per 1000 | 522 per 1000 | |||||
| Any neurodevelopmental impairment at 18 to 22 months' corrected age (in children examined) | High‐risk population | RR: 0.62 (95% CI 0.48 to 0.80) | 1130 (4) | ⊕⊕⊝⊝ | Bias: We had concerns about performance bias and detection bias in 1 of the studies, the largest (n = 613) (Song 2016). This study carried a weight of 48.7% in the analysis. We downgraded the quality of the evidence by 1 step. Heterogeneity/Consistency: I2 for the typical RR was 76% (high) and for the typical RD 66% (moderate). We downgraded the quality of the evidence by 1 step. Directness of evidence: Studies were conducted in the target population. Precision: Because of the large sample size (n = 1130), the point estimate was precise with a narrow 95% CI. Presence of publication bias: Although only 4 studies were included in the funnel plot, the funnel plot was symmetrical. | |
| 210 per 1000 | 128 per 1000 | |||||
| Bayley‐II MDI at 18 to 24 months Bayley Scales of Infant Development, Second Edition, yields 2 single age‐standardised composite scores (range 50 to 150): a Mental Development Index (MDI), which measures cognition through sensory perception, knowledge, memory, problem‐solving and early language abilities; and a Psychomotor Development Index (PDI), which assesses fine and gross motor skills. | Mean Bayley‐II MDI ranged across control groups from 84.1 to 94.5. | Mean Bayley‐II MDI at 18 to 24 months in the intervention groups was 8.22 higher (95% CI 6.52 to 9.92) | WMD: 8.22 (95% CI 6.52 to 9.92) | 981 | ⊕⊕⊝⊝ | Bias: We had concerns about performance bias and detection bias in one of the studies (Song 2016). We downgraded the quality of the evidence by 1 step. Song 2016 carried a weight in the analysis of 76.2%. Heterogeneity/Consistency: I2 for the WMD was 97% (high). We downgraded the quality of the evidence by 1 step. Directness of evidence: Studies were conducted in the target population. Precision: Because of the large sample size (n = 981), the point estimate was precise with a narrow 95% CI. Presence of publication bias: As only 3 studies were included, we did not prepare a funnel plot. |
| Necrotising enterocolitis (stage not reported) | High‐risk population | RR: 0.69 (95% CI 0.52 to 0.91) | 2639 | ⊕⊕⊕⊝ | Bias: We had concerns about performance bias and detection bias in 6 of the studies, especially for Song 2016, the only study that showed a significant reduction in NEC. It carried a weight in the analysis of 47.8%. We downgraded the quality of the evidence by 1 step. Heterogeneity/Consistency: I2 for the typical RR was 0% and for the typical RD 22% (both low). Directness of evidence: Studies were conducted in the target population. Precision: Because of the large sample size (n = 2639), the point estimate was precise with a narrow 95% CI. Presence of publication bias: The funnel plot was symmetrical. | |
| 84 per 1000 | 57 per 1000 | |||||
| *The basis for the assumed risk (e.g. the median control group risk across studies) is provided in footnotes. The corresponding risk (and its 95% confidence interval) is based on the assumed risk in the comparison group and the relative effect of the intervention (and its 95% CI). | ||||||
| GRADE Working Group grades of evidence. | ||||||
| Erythropoietin compared with placebo or no treatment for complications of preterm birth | ||||||
| Patient or population: preterm infants with low birth weight Settings: NICU Intervention: EPO Comparison: placebo or no treatment | ||||||
| Outcomes | Illustrative comparative risks* (95% CI) | Relative effect | No. of participants | Quality of the evidence | Comments | |
| Assumed risk | Corresponding risk | |||||
| Placebo or no treatment | EPO | |||||
| Mortality during initial hospital stay (all causes of mortality) | High‐risk population | RR: 0.89 (95% CI 0.68 to 1.16) | 2212 | ⊕⊕⊕⊕ | Bias: We had concerns about bias (lack of blinding) in 10 of the included studies, but the outcome of mortality is not likely to be affected by researchers knowing the treatment assignment. We did not downgrade the quality of evidence on this item. Heterogeneity/Consistency: We noted no heterogeneity (I2 = 0%). Directness of evidence: Studies were conducted in the target population. Precision: Because of the large sample size (2212), the point estimate was precise with a narrow 95% CI. Presence of publication bias: The funnel plot was symmetrical. | |
| 92 per 1000 | 82 per 1000 | |||||
| Retinopathy of prematurity (stage ≥ 3) | High‐risk population | RR: 1.24 (95% CI 0.81 to 1.90) | 1283 | ⊕⊕⊕⊕ | Bias: We found no risk of bias in any of the studies, except in the smallest study that enrolled 40 neonates. We did not downgrade the quality of evidence. Heterogeneity/Consistency: We noted no heterogeneity for RR (I2 = 0%) and low (I2 = 34%) heterogeneity for RD. Directness of evidence: Studies were conducted in the target population. Precision: Because of the large sample size (n = 1283), the point estimate was precise with a narrow 95% CI. Presence of publication bias: The funnel plot, which included 8 studies, was symmetrical. | |
| 53 per 1000 | 65 per 1000 | |||||
| Intraventricular haemorrhage (grades III and IV) | High‐risk population | RR: 0.60 (95% CI 0.43 to 0.85) | 1460 | ⊕⊕⊕⊝ | Bias:The intervention was not blinded in the largest study, Song 2016 (n= 743). That study carried a weight of 72.8% in the analysis and was the only individual study that showed a significant reduction in IVH (grades III and IV). We downgraded the quality of the evidence by 1 step. Heterogeneity/Consistency: Heterogeneity was low (I2 = 45%). Directness of evidence: Studies were conducted in the target population. Precision: Because of the large sample size (n = 1460), the point estimate was precise with a narrow 95% CI. Presence of publication bias: The funnel plot, which included 8 studies, was symmetrical. | |
| 111 per 1000 | 67 per 1000 | |||||
| Periventricular leukomalacia | High‐risk population | RR: 0.66 (95% CI 0.48 to 0.92) | 1469 | ⊕⊕⊕⊝ | Bias: The intervention was not blinded in the largest study, Song 2016 (n = 743). That study carried a weight of 89.2% in the analysis and was the only individual study that showed a significant reduction in PVL. We downgraded the quality of the evidence by 1 step. Directness of evidence: Studies were conducted in the target population. Precision: Because of the large sample size (n = 1469), the point estimate was precise with a narrow 95% CI. Presence of publication bias: The funnel plot, which included 6 studies, was symmetrical. | |
| 111 per 1000 | 71 per 1000 | |||||
| Survivors at discharge from hospital without severe IVH, PVL, ROP | High‐risk population | RR: 1.00 (95% CI 0.93 to 1.08) | 443 | ⊕⊕⊕⊕ | Bias: We noted low risk of bias. Heterogeneity/Consistency: N/A, as only 1 study. Directness of evidence: The study was conducted in the target population. Precision: Because of the relatively large sample size (n = 443), the point estimate was precise with a narrow 95% CI. Presence of publication bias: As only 1 study was included, we did not develop a funnel plot. | |
| 855 per 1000 | 856 per 1000 | |||||
| Time to achieve full enteral feeding (days) | Mean time to achieve full enteral feeding was 16.3 days (SD 5.3) in the control group. | Mean time to achieve full enteral feeding in the intervention groups was 2.90 days shorter. | MD: ‐2.90 (95% CI ‐5.77 to ‐0.03) | 50 | ⊕⊕⊝⊝ | Bias: We had concerns about blinding of the intervention and outcome assessments. We downgraded the quality of evidence by 1 step. Heterogeneity/Consistency: N/A, as only 1 study. Directness of evidence: The study was conducted in the target population. Precision: Because of the small sample size (n = 50), the 95% CI around the point estimate was wide. Presence of publication bias: As only 1 study was included, we did not prepare a funnel plot. |
| *The basis for the assumed risk (e.g. the median control group risk across studies) is provided in footnotes. The corresponding risk (and its 95% confidence interval) is based on the assumed risk in the comparison group and the relative effect of the intervention (and its 95% CI). | ||||||
| GRADE Working Group grades of evidence. | ||||||
| Erythropoietin compared with placebo or no treatment for complications of preterm birth ‐ long‐term outcomes | ||||||
| Patient or population: preterm infants with low birth weight Settings: NICU Intervention: EPO Comparison: placebo or no treatment | ||||||
| Outcomes | Illustrative comparative risks* (95% CI) | Relative effect | No. of participants | Quality of the evidence | Comments | |
| Assumed risk | Corresponding risk | |||||
| Placebo | EPO | |||||
| Cerebral palsy at 18 to 24 months' corrected age | High‐risk population | RR: 0.72 (95% CI 0.46 to 1.13) | 1172 | ⊕⊕⊕⊕ | Bias: Low risk of bias. All assessors of long‐term outcomes were blinded in all trials. In Song 2016, treatment allocation was known to caregivers and probably parents, who could have possibly disclosed that information to assessors at long‐term follow‐up. We did not downgrade the quality of the evidence. Heterogeneity/Consistency: Heterogeneity was low for this outcome (I2 = 48%). We did not downgraded the evidence. Directness of evidence: Studies were conducted in the target population. Precision: Because of the large sample size (n = 1172), the point estimate was precise with a narrow 95% CI. Presence of publication bias: We included 6 studies in the analysis; we did prepare a funnel plot, which was symmetrical. | |
| 70 per 1000 | 50 per 1000 | |||||
| *The basis for the assumed risk (e.g. the median control group risk across studies) is provided in footnotes. The corresponding risk (and its 95% confidence interval) is based on the assumed risk in the comparison group and the relative effect of the intervention (and its 95% CI). | ||||||
| GRADE Working Group grades of evidence. | ||||||
| Darbe or EPO (ESA) compared with sham injection for neuro protection ‐ long‐term outcomes | ||||||
| Patient or population: neonates born preterm with low birth weight Settings: NICU Intervention: Darbe or EPO (ESA) Comparison: sham injection | ||||||
| Outcomes | Illustrative comparative risks* (95% CI) | Relative effect | No. of participants | Quality of the evidence | Comments | |
| Assumed risk | Corresponding risk | |||||
| Sham injection | ESA | |||||
| BSID‐III composite cognitive scores at 18 to 22 months The Bayley‐III has 3 main sub tests: the Cognitive Scale, which includes items such as attention to familiar and unfamiliar objects, looking for a fallen object, and pretend play; the Language Scale, which taps understanding and expression of language, for example, recognising objects and people, following directions, and naming objects and pictures; and the Motor Scale, which assesses gross and fine motor skills such as grasping, sitting, stacking blocks, and climbing stairs. | Mean BSID‐III in the control group was 88.7 units (SD 13.5). | Mean BSID‐III in the intervention group was 7.80 units higher. | MD 7.80 (95% CI 1.65 to 13.95) | 80 | ⊕⊕⊕⊝ | Bias: Risk of bias was low, but the sample followed was small. We did not reduce the quality of evidence. Heterogeneity/Consistency: Only 1 study was included, so the test for heterogeneity was N/A. Directness of evidence: The study was conducted in the target population. Precision: Because of the small sample size (n = 80), the point estimate had a wide 95% CI. We downgraded the quality of evidence by 1 step. Presence of publication bias: N/A, as only 1 study was included. |
| WPPSI‐III FSIQ at 3.5 to 4 years of age Composite scores have a mean of 100 and a standard deviation of 15. Average is 90 to 109. | Mean WPPSI‐III FSIQ in the control group was 79.2 units (SD 18,5). | Mean WPPSI‐III FSIQ in the intervention group was 11.90 units higher. | MD 11.90 (95% CI 0.76 to 23.04) | 53 | ⊕⊕⊝⊝ | Bias: Risk of bias was low, but the sample followed was even smaller than at 18 to 22 months of age (n = 53). We did reduce the quality of evidence by 1 step. Heterogeneity/Consistency: Only 1 study was included, so the test for heterogeneity was N/A. Directness of evidence: The study was conducted in the target population. Precision: Because of the small sample size (n = 53), the point estimate had a large 95% CI. We downgraded the quality of evidence by 1 step. Presence of publication bias: N/A, as only 1 study was included, |
| *The basis for the assumed risk (e.g. the median control group risk across studies) is provided in footnotes. The corresponding risk (and its 95% confidence interval) is based on the assumed risk in the comparison group and the relative effect of the intervention (and its 95% CI). | ||||||
| GRADE Working Group grades of evidence. | ||||||
| Reference | Indications |
| Infants with Hgb concentrations < 7 g/dL and with a reticulocyte count lower than < 100,000/µL or Hgb concentrations < 8 g/dL having bradycardia, tachypnoea, or apnoea, or who were not able to gain weight despite adequate calorie intake, were chosen as candidates for blood transfusion. | |
| Infants received blood transfusions if they met the following criteria: | |
| Infants were transfused during the first week of life with packed erythrocytes if the Hct level was < 42% or 36%, depending on whether or not the patient was receiving supplemental oxygen. After the first week of life, indications for transfusions were Hct < 36% for oxygen‐dependent patients and 32% if breathing room air. Anaemia was the only indication for giving packed erythrocytes to all infants. | |
| Infants received transfusions of packed cells during the first week of life if their peripheral Hct (heel stick) was < 42% or 36%, depending on whether or not the patient was receiving supplemental oxygen. | |
| Transfusion guidelines not provided | |
| Transfusion guidelines not provided | |
| Transfusion guidelines not provided | |
| Transfusion guidelines not provided | |
| Infants were transfused at Hct < 20%: | |
| Transfusion guidelines are not reported in the English abstract of this study. We have requested the full text in Chinese from trial authors. | |
| "Guidelines for red‐cell transfusions were based on the relatively strict existing policy in the nursery which was used to administer transfusions during the study period". | |
| Transfusions were ordered by the clinicians caring for each infant without consulting the investigators, based on general guidelines for erythrocyte transfusions. According to these guidelines, neonates who were well received transfusions if their hematocrit was < 30% during the third week, < 25% during the fourth week, and < 23% after the first month of life, combined with signs referable to their anaemia, such as poor weight gain, episodes of persistent bradycardia or tachycardia, and apnoea. Neonates with severe respiratory disease (bronchopulmonary dysplasia), particularly those requiring oxygen and/or ventilator support, were given transfusions to maintain their hematocrit level at > 40%. | |
| See Kremenopoulos 1997A, | |
| Transfusion was given when the Hct level reached 28% and if clinical symptoms of tachypnoea, tachycardia, and bradycardia were present at Hct of 0.32. | |
| According to criteria published by Klaus and Fanaroff (see text for more info) | |
| Infants who were receiving ventilation or who were less than 2 weeks old and had signs of anaemia were given transfusions if their Hct fell below 40%, their Hgb concentration fell below 14 g/dL (8.7 mmol/L), or blood samples totaling at least 9 mL/kg had been obtained from them since their previous transfusion. | |
| Infants with artificial ventilation or > 40% of inspired oxygen were not transfused unless Hct dropped below 0.40. | |
| Infants more than 2 weeks old who had been breathing spontaneously and whose FiO2 was less than 0.40 were given transfusions if they had signs of anaemia and their Hct fell below 11 g/dL (6.8 mmol/L); if they had no signs of anaemia, corresponding cutoff values were 27% and 9 g/dL (5.6 mmol/L). | |
| Indications for transfusions were: | |
| Indications for transfusion of packed red cells: | |
| Transfusions were given during the first 3 weeks of life if Hct was < 33%, and if the infant had 1 or more symptoms thought to be due strictly to anaemia. Symptoms were defined as tachycardia (heart rate > 160 beats/min, calculated as the average of all heart rates recorded by the bedside nurse during the preceding 24‐hour period), an increasing oxygen requirement (an increase in fraction of inspired oxygen of > 0.20 during a 24‐hour period), "lethargy" as assessed by the primary caregiver, or an increase in the number of episodes of bradycardia requiring stimulation to increase the heart rate from less than 60 beats/min (an increase of such episodes by 3 or more per day). Infants in both groups whose Hct were > 33% and yet whose phlebotomy losses exceeded 10 mL/kg body weight received an infusion of 5% albumin, administered in aliquots of not less than 10 mL/kg. Infants were not given transfusions if they were free of symptoms, even if Hct fell to < 33%. | |
| Transfusions were administered in both groups according to standardised transfusion criteria: For infants requiring mechanical ventilation, transfusions were given if Hct fell below 33%. For infants not receiving ventilatory support, transfusions were given if Hct fell below 28%, and if the infant was experiencing symptoms. Symptoms were defined as tachycardia (heart rate > 160 beats/min, calculated as the average of all heart rates recorded by the bedside nurse over the preceding 24‐hour period), an increasing oxygen requirement (an increase in FiO2 of > 0.20 over a 24‐hour period, or an elevated lactate level (> 2.5 mmol/L). In some instances, a new donor would be used each day for the newborn intensive care unit (University of Florida), and in other instances, a unit would be dedicated to a single infant for the life of the unit (University of New Mexico and University of Utah). | |
| If Hct ≤ 35%/Hgb ≤ 11 g/dL, transfuse infants requiring moderate or significant mechanical ventilation (MAP > 8 cmH2O and FiO2 > 0.4). | |
| See Ohls 2001A. | |
| The PRBC volume transfused was based on Hct/Hgb, respiratory support, and/or symptoms. If Hct ≤ 30/Hgb ≤ 10 and the infant required moderate/significant ventilation (MAP > 8 cmH2O and FiO2 > 0.4), the PRBC volume to be transfused was 15 to 20 mL/kg. PRBC volume to be transfused was 20 mL/kg. If Hct ≤18/Hgb ≤ 6 and the infant was asymptomatic and absolute reticulocyte count (ARC) was < 100,000 cells/µL, the PRBC volume to be transfused was 20 mL/kg. | |
| Infants with the following respiratory needs received 10 to 15 mL/kg of RBC volume based on Hct: | |
| Transfusion guidelines not reported | |
| Preterm infants with Hct < 20% | |
| Blood transfusion criteria followed strict clinical criteria as used by Vázquez López 2011. | |
| Neonates who were well were transfused if their Hct was < 25% combined with signs referable to their anaemia, such as poor weight gain, persistent episodes of bradycardia or tachypnoea, and apnoea. Neonates with severe respiratory disease (BPD), particularly those requiring oxygen and/or ventilator support, received transfusions to maintain Hct level at > 40%. | |
| Infants who were receiving mechanical ventilation or who were less than 2 weeks old were given transfusion if their Hct fell below 40%. Spontaneously breathing infants more than 2 weeks old whose FiO2 was less than 0.35 were given transfusion if they had signs of anaemia and their Hct fell below 30%; if they had no signs of anaemia, transfusion was given if Hct fell below 0.25. Growing, asymptomatic infants were transfused if Hct fell below 20%. Signs of anaemia included tachycardia, (> 170 beats/min) or tachypnoea (> 70/min) sustained over a 24‐hour period or associated with acute cardiac decompression; recurrent apnoea (respirations absent for 20 seconds) or bradycardia (heart rate < 100 beats/min) in a 24‐hour period not due to other causes and not responsive to methylxanthine treatment; an increase in fractional oxygen requirement by 20% or more over a 24‐hour period; or weight gain < 10 g/d averaged over a 1‐week period while on adequate caloric intake. | |
| Neonates were transfused when Hct was < 20%, if they were asymptomatic, or < 30% if they were receiving O2 < 0.35 and/or unexplained breathing disorders combined with signs referable to their anaemia, such as poor weight gain, episodes of persistent bradycardia or tachycardia. | |
| After discharge from hospital, any patient with Hgb level ≤ 7 g/dL was readmitted to the hospital and managed with packed red cell transfusion. | |
| Infants who were receiving mechanical ventilation or who were less than 2 weeks old were given transfusion if their Hct fell below 40%. Spontaneously breathing infants more than 2 weeks old whose FiO2 was less than 35% were given transfusion if they had signs of anaemia and their Hct fell below 30%; if they had no signs of anaemia, transfusion was given if Hct fell below 25%. Growing, asymptomatic infants were transfused if Hct fell below 20%. Signs of anaemia included tachycardia, (> 170 beats/min) or tachypnoea (> 70/min) sustained over a 24‐hour period or associated with acute cardiac decompression; recurrent apnoea (respirations absent for 20 seconds) or bradycardia (heart rate < 100 beats/min) in a 24‐hour period not due to other causes and not responsive to methylxanthine treatment; increased fractional oxygen requirement by 20% or more over a 24‐hour period; or weight gain < 10 g/d averaged over a 1‐week period while on adequate caloric intake. | |
| ARC: absolute reticulocyte count. | |
| Outcome or subgroup title | No. of studies | No. of participants | Statistical method | Effect size |
| 1 Use of 1 or more red blood cell transfusions (low and high doses of EPO) Show forest plot | 19 | 1750 | Risk Ratio (M‐H, Fixed, 95% CI) | 0.79 [0.74, 0.85] |
| 2 Use of 1 or more blood transfusions (high dose of EPO) Show forest plot | 17 | 1317 | Risk Ratio (M‐H, Fixed, 95% CI) | 0.79 [0.74, 0.86] |
| 2.1 High‐dose iron | 11 | 863 | Risk Ratio (M‐H, Fixed, 95% CI) | 0.84 [0.77, 0.92] |
| 2.2 Low‐dose iron | 6 | 454 | Risk Ratio (M‐H, Fixed, 95% CI) | 0.71 [0.62, 0.82] |
| 3 Use of 1 or more red blood cell transfusions (low‐dose EPO) Show forest plot | 4 | 484 | Risk Ratio (M‐H, Fixed, 95% CI) | 0.77 [0.65, 0.91] |
| 3.1 High‐dose iron | 2 | 322 | Risk Ratio (M‐H, Fixed, 95% CI) | 0.75 [0.61, 0.93] |
| 3.2 Low‐dose iron | 2 | 162 | Risk Ratio (M‐H, Fixed, 95% CI) | 0.80 [0.60, 1.07] |
| 4 Total volume (mL/kg) of blood transfused per infant Show forest plot | 7 | 581 | Mean Difference (IV, Fixed, 95% CI) | ‐6.82 [‐11.52, ‐2.11] |
| 5 Number of red blood transfusions per infant Show forest plot | 16 | 1744 | Mean Difference (IV, Fixed, 95% CI) | ‐0.57 [‐0.68, ‐0.45] |
| 6 Number of donors to whom the infant was exposed Show forest plot | 5 | Mean Difference (IV, Fixed, 95% CI) | Subtotals only | |
| 6.1 Among all randomised infants | 3 | 254 | Mean Difference (IV, Fixed, 95% CI) | ‐0.54 [‐0.89, ‐0.20] |
| 6.2 Among infants who were transfused | 2 | 290 | Mean Difference (IV, Fixed, 95% CI) | 0.05 [‐0.33, 0.42] |
| 7 Mortality during initial hospital stay (all causes of mortality) Show forest plot | 20 | 2212 | Risk Ratio (M‐H, Fixed, 95% CI) | 0.89 [0.68, 1.16] |
| 8 Retinopathy of prematurity (all stages or stage not reported) Show forest plot | 11 | 2185 | Risk Ratio (M‐H, Fixed, 95% CI) | 0.92 [0.79, 1.08] |
| 9 Retinopathy of prematurity (stage ≥ 3) Show forest plot | 8 | 1283 | Risk Ratio (M‐H, Fixed, 95% CI) | 1.24 [0.81, 1.90] |
| 10 Proven sepsis Show forest plot | 12 | 2180 | Risk Ratio (M‐H, Fixed, 95% CI) | 0.87 [0.74, 1.02] |
| 11 Necrotising enterocolitis (stage not reported) Show forest plot | 15 | 2639 | Risk Ratio (M‐H, Fixed, 95% CI) | 0.69 [0.52, 0.91] |
| 12 Intraventricular haemorrhage (all grades) Show forest plot | 10 | 1226 | Risk Ratio (M‐H, Fixed, 95% CI) | 0.98 [0.76, 1.26] |
| 13 Intraventricular haemorrhage (grades III and IV) Show forest plot | 8 | 1460 | Risk Ratio (M‐H, Fixed, 95% CI) | 0.60 [0.43, 0.85] |
| 14 Periventricular leukomalacia Show forest plot | 6 | 1469 | Risk Ratio (M‐H, Fixed, 95% CI) | 0.66 [0.48, 0.92] |
| 15 Length of hospital stay (days) Show forest plot | 8 | 970 | Mean Difference (IV, Fixed, 95% CI) | ‐3.20 [‐5.34, ‐1.06] |
| 16 Bronchopulmonary dysplasia Show forest plot | 13 | Risk Ratio (M‐H, Fixed, 95% CI) | Subtotals only | |
| 16.1 Supplemental oxygen at 28 days of age | 2 | 136 | Risk Ratio (M‐H, Fixed, 95% CI) | 0.86 [0.50, 1.47] |
| 16.2 Supplemental oxygen at 36 weeks | 7 | 1719 | Risk Ratio (M‐H, Fixed, 95% CI) | 0.95 [0.81, 1.11] |
| 16.3 Age at diagnosis not stated | 5 | 528 | Risk Ratio (M‐H, Fixed, 95% CI) | 0.98 [0.61, 1.56] |
| 17 Neutropenia Show forest plot | 10 | 966 | Risk Ratio (M‐H, Fixed, 95% CI) | 0.81 [0.53, 1.24] |
| 18 Hypertension Show forest plot | 6 | 706 | Risk Ratio (M‐H, Fixed, 95% CI) | 0.97 [0.14, 6.69] |
| 19 Hemangioma Show forest plot | 1 | 443 | Risk Ratio (M‐H, Fixed, 95% CI) | 1.33 [0.79, 2.26] |
| 20 Neonatal Behavioral Neurological Assessment at 40 weeks' PMA Show forest plot | 1 | 44 | Mean Difference (IV, Fixed, 95% CI) | 1.80 [1.26, 2.34] |
| 21 Infants with white matter injury at term‐corrected PMA Show forest plot | 1 | 165 | Risk Ratio (M‐H, Fixed, 95% CI) | 0.61 [0.37, 1.00] |
| 22 Infants with white matter signal abnormality at term‐corrected PMA Show forest plot | 1 | 165 | Risk Ratio (M‐H, Fixed, 95% CI) | 0.23 [0.05, 1.01] |
| 23 Infants with periventricular white matter loss at term‐corrected PMA Show forest plot | 1 | 165 | Risk Ratio (M‐H, Fixed, 95% CI) | 0.55 [0.32, 0.97] |
| 24 Infants with grey matter injury at term‐corrected PMA Show forest plot | 1 | 165 | Risk Ratio (M‐H, Fixed, 95% CI) | 0.34 [0.13, 0.87] |
| 25 Survivors at discharge from hospital without severe IVH, PVL, ROP Show forest plot | 1 | 443 | Risk Ratio (M‐H, Fixed, 95% CI) | 1.00 [0.93, 1.08] |
| 26 Bayley‐II MDI < 70 at 18 to 24 months' corrected age Show forest plot | 4 | 1071 | Risk Ratio (M‐H, Fixed, 95% CI) | 0.55 [0.39, 0.77] |
| 27 Bayley‐II PDI < 70 at 18 to 22 months' corrected age (in children examined) Show forest plot | 3 | 458 | Risk Ratio (M‐H, Fixed, 95% CI) | 1.43 [0.88, 2.33] |
| 28 Bayley‐II MDI at 18 to 24 months Show forest plot | 3 | 981 | Mean Difference (IV, Fixed, 95% CI) | 8.22 [6.52, 9.92] |
| 29 Bayley‐II PDI at 18 to 24 months Show forest plot | 1 | 3 | Mean Difference (IV, Fixed, 95% CI) | 0.0 [0.0, 0.0] |
| 30 Cerebral palsy at 18 to 24 months' corrected age Show forest plot | 6 | 1172 | Risk Ratio (M‐H, Fixed, 95% CI) | 0.72 [0.46, 1.13] |
| 31 Any neurodevelopmental impairment at 18 to 22 months' corrected age (in children examined) Show forest plot | 4 | 1130 | Risk Ratio (M‐H, Fixed, 95% CI) | 0.62 [0.48, 0.80] |
| 32 Visual impairment at 18 to 24 months' corrected age Show forest plot | 5 | 1132 | Risk Ratio (M‐H, Fixed, 95% CI) | 0.80 [0.26, 2.49] |
| 33 Hearing impairment at 18 to 24 months' corrected age Show forest plot | 5 | 1132 | Risk Ratio (M‐H, Fixed, 95% CI) | 0.41 [0.13, 1.23] |
| 34 BSID‐III composite cognitive scores at 18 to 22 months Show forest plot | 1 | 53 | Mean Difference (IV, Fixed, 95% CI) | 9.20 [1.70, 16.70] |
| 35 BSID‐III composite language score Show forest plot | 1 | 53 | Mean Difference (IV, Fixed, 95% CI) | 6.30 [‐2.20, 14.80] |
| 36 BSID‐III composite social/emotional score Show forest plot | 1 | 53 | Mean Difference (IV, Fixed, 95% CI) | 2.90 [‐7.84, 13.64] |
| 37 BSID‐III object performance (OP) score Show forest plot | 1 | 53 | Mean Difference (IV, Fixed, 95% CI) | 0.20 [‐0.32, 0.72] |
| 38 WPPSI‐III FSIQ at 3.5 to 4 years of age Show forest plot | 1 | 38 | Mean Difference (IV, Fixed, 95% CI) | 10.42 [‐1.96, 22.80] |
| 39 WPPSI‐III VIQ at 3.5 to 4 years of age Show forest plot | 1 | 38 | Mean Difference (IV, Fixed, 95% CI) | 10.64 [‐0.73, 22.01] |
| 40 WPPSI‐III PIQ at 3.5 to 4 years of age Show forest plot | 1 | 38 | Mean Difference (IV, Fixed, 95% CI) | 10.12 [‐2.67, 22.91] |
| 41 WPPSI‐III GLC at 3.5 to 4 years of age Show forest plot | 1 | 38 | Mean Difference (IV, Fixed, 95% CI) | 3.12 [‐8.37, 14.61] |
| 42 Executive function at 3.5 to 4 years of age Show forest plot | 1 | 38 | Mean Difference (IV, Fixed, 95% CI) | 6.82 [‐1.97, 15.61] |
| 43 Working memory at 3.5 to 4 years of age Show forest plot | 1 | 38 | Mean Difference (IV, Fixed, 95% CI) | 6.74 [‐4.56, 18.04] |
| 44 Inhibition at 3.5 to 4 years of age Show forest plot | 1 | 38 | Mean Difference (IV, Fixed, 95% CI) | 6.86 [‐4.56, 18.28] |
| 45 Griffiths Developmental Scale at 2 years of age Show forest plot | 1 | 19 | Mean Difference (IV, Fixed, 95% CI) | 3.0 [‐3.75, 9.75] |
| 46 Survival without major neurological or neurodevelopmental disorders at 2 years of age Show forest plot | 2 | 404 | Risk Ratio (M‐H, Fixed, 95% CI) | 0.99 [0.91, 1.08] |
| 47 Death or moderate/severe neurological disability at 18 to 24 months Show forest plot | 1 | 668 | Risk Ratio (M‐H, Fixed, 95% CI) | 0.48 [0.35, 0.67] |
| 48 Moderate/severe neurological disability at 18 to 24 months Show forest plot | 1 | 613 | Risk Ratio (M‐H, Fixed, 95% CI) | 0.38 [0.24, 0.60] |
| Outcome or subgroup title | No. of studies | No. of participants | Statistical method | Effect size |
| 1 Use of 1 or more red blood cell transfusions Show forest plot | 1 | 66 | Risk Ratio (M‐H, Fixed, 95% CI) | 0.62 [0.38, 1.02] |
| 2 Total volume (mL/kg) of blood transfused per infant (all infants) Show forest plot | 1 | 66 | Mean Difference (IV, Fixed, 95% CI) | ‐21.0 [‐50.72, 8.72] |
| 3 Total volume (mL/kg) of blood transfused in transfused infants only Show forest plot | 1 | 34 | Mean Difference (IV, Fixed, 95% CI) | ‐5.10 [‐53.71, 43.51] |
| 4 Number of blood transfusions per infant Show forest plot | 1 | 66 | Mean Difference (IV, Fixed, 95% CI) | ‐1.2 [‐2.48, 0.08] |
| 5 Number of donors the infant was exposed to Show forest plot | 1 | 66 | Mean Difference (IV, Fixed, 95% CI) | ‐0.5 [‐1.10, 0.10] |
| 6 Mortality during initial hospital stay (all causes of mortality) Show forest plot | 1 | 66 | Risk Ratio (M‐H, Fixed, 95% CI) | 0.67 [0.12, 3.73] |
| 7 Retinopathy of prematurity (all stages) Show forest plot | 1 | 62 | Risk Ratio (M‐H, Fixed, 95% CI) | 0.94 [0.50, 1.75] |
| 8 Retinopathy of prematurity (stage ≥ 3) Show forest plot | 1 | 62 | Risk Ratio (M‐H, Fixed, 95% CI) | 0.47 [0.09, 2.37] |
| 9 Necrotising enterocolitis (> stage 2) Show forest plot | 1 | 62 | Risk Ratio (M‐H, Fixed, 95% CI) | 0.94 [0.14, 6.24] |
| 10 Proven sepsis Show forest plot | 1 | 62 | Risk Ratio (M‐H, Fixed, 95% CI) | 1.13 [0.38, 3.30] |
| 11 Intraventricular haemorrhage (grades III and IV) Show forest plot | 1 | 62 | Risk Ratio (M‐H, Fixed, 95% CI) | 0.40 [0.11, 1.41] |
| 12 Periventricular leukomalacia Show forest plot | 1 | 62 | Risk Ratio (M‐H, Fixed, 95% CI) | 0.0 [0.0, 0.0] |
| 13 Bronchopulmonary dysplasia (supplemental oxygen at 36 weeks' PMA) Show forest plot | 1 | 62 | Risk Ratio (M‐H, Fixed, 95% CI) | 1.03 [0.73, 1.46] |
| 14 Length of hospital stay (days) Show forest plot | 1 | 62 | Mean Difference (IV, Fixed, 95% CI) | 2.0 [‐17.84, 21.84] |
| 15 Neutropenia Show forest plot | 1 | 62 | Risk Ratio (M‐H, Fixed, 95% CI) | 0.0 [0.0, 0.0] |
| 16 Hypertension Show forest plot | 1 | 62 | Risk Ratio (M‐H, Fixed, 95% CI) | 1.88 [0.18, 19.63] |
| 17 Cerebral palsy at 18 to 22 months Show forest plot | 1 | 51 | Risk Ratio (M‐H, Fixed, 95% CI) | 0.08 [0.00, 1.40] |
| 18 NDI (with CP, visual defect, hearing defect, or cognitive score < 85) at 18 to 22 months Show forest plot | 1 | 51 | Risk Ratio (M‐H, Fixed, 95% CI) | 0.27 [0.08, 0.86] |
| 19 BSID‐III composite cognitive score at 18 to 22 months Show forest plot | 1 | 51 | Mean Difference (IV, Fixed, 95% CI) | 7.5 [1.44, 13.56] |
| 20 BSID‐III composite language score at 18 to 22 months Show forest plot | 1 | 51 | Mean Difference (IV, Fixed, 95% CI) | 8.80 [1.57, 16.03] |
| 21 Bayley‐III social/emotional score at 18 to 22 months Show forest plot | 1 | 51 | Mean Difference (IV, Fixed, 95% CI) | 6.80 [‐3.82, 17.42] |
| 22 OP score at 18 to 22 months Show forest plot | 1 | 51 | Mean Difference (IV, Fixed, 95% CI) | 0.60 [0.17, 1.03] |
| 23 WPPSI‐III FSIQ at 3.5 to 4 years of age Show forest plot | 1 | 29 | Mean Difference (IV, Fixed, 95% CI) | 15.27 [2.60, 27.94] |
| 24 WPPSI‐III VIQ at 3.5 to 4 years of age Show forest plot | 1 | 29 | Mean Difference (IV, Fixed, 95% CI) | 9.17 [‐2.86, 21.20] |
| 25 WPPSI‐III PIQ at 3.5 to 4 years of age Show forest plot | 1 | 29 | Mean Difference (IV, Fixed, 95% CI) | 14.97 [1.89, 28.05] |
| 26 WPPSI‐III GLC at 3.5 to 4 years of age Show forest plot | 1 | 29 | Mean Difference (IV, Fixed, 95% CI) | 7.94 [‐4.18, 20.06] |
| 27 Executive function at 3.5 to 4 years of age Show forest plot | 1 | 29 | Mean Difference (IV, Fixed, 95% CI) | 10.81 [2.83, 18.79] |
| 28 Working memory at 3.5 to 4 years of age Show forest plot | 1 | 29 | Mean Difference (IV, Fixed, 95% CI) | 12.77 [2.68, 22.86] |
| 29 Inhibition at 3.5 to 4 years of age Show forest plot | 1 | 29 | Mean Difference (IV, Fixed, 95% CI) | 8.77 [‐2.47, 20.01] |
| Outcome or subgroup title | No. of studies | No. of participants | Statistical method | Effect size |
| 1 BSID‐III composite cognitive score at 18 to 22 months Show forest plot | 1 | 80 | Mean Difference (IV, Fixed, 95% CI) | 7.80 [1.65, 13.95] |
| 2 BSID‐III composite language score at 18 to 22 months Show forest plot | 1 | 80 | Mean Difference (IV, Fixed, 95% CI) | 7.10 [0.49, 13.71] |
| 3 BSID‐III composite social/emotional score at 18 to 22 months Show forest plot | 1 | 80 | Mean Difference (IV, Fixed, 95% CI) | 4.20 [‐5.06, 13.46] |
| 4 OP score at 18 to 24 months Show forest plot | 1 | 80 | Mean Difference (IV, Fixed, 95% CI) | 0.40 [‐0.04, 0.84] |
| 5 BASC‐2 composite scores at 3.5 to 4 years ‐ adaptive skills Show forest plot | 1 | 49 | Mean Difference (IV, Fixed, 95% CI) | 2.54 [‐3.58, 8.66] |
| 6 BASC‐2 composite scores at 3.5 to 4 years ‐ behaviour symptoms Show forest plot | 1 | 49 | Mean Difference (IV, Fixed, 95% CI) | ‐8.66 [‐18.01, 0.69] |
| 7 BASC‐2 composite score at 3.5 to 4 years ‐ externalising problems Show forest plot | 1 | 49 | Mean Difference (IV, Fixed, 95% CI) | ‐8.0 [‐15.94, ‐0.06] |
| 8 BASC‐2 composite scores at 3.5 to 4 years ‐ internalising problems Show forest plot | 1 | 49 | Mean Difference (IV, Fixed, 95% CI) | ‐2.56 [‐9.25, 4.13] |
| 9 WPPSI‐III FSIQ at 3.5 to 4 years of age Show forest plot | 1 | 53 | Mean Difference (IV, Fixed, 95% CI) | 11.90 [0.76, 23.04] |
| 10 WPPSI‐III VIQ at 3.5 to 4 years of age Show forest plot | 1 | 53 | Mean Difference (IV, Fixed, 95% CI) | 8.80 [‐1.75, 19.35] |
| 11 WPPSI‐III PIQ at 3.5 to 4 years of age Show forest plot | 1 | 53 | Mean Difference (IV, Fixed, 95% CI) | 13.5 [1.98, 25.02] |
| 12 WPPSI‐III GLC at 3.5 to 4 years of age Show forest plot | 1 | 53 | Mean Difference (IV, Fixed, 95% CI) | 5.13 [‐5.30, 15.56] |
| 13 Executive function at 3.5 to 4 years Show forest plot | 1 | 53 | Mean Difference (IV, Fixed, 95% CI) | 8.36 [0.51, 16.21] |
| 14 Working memory at 3.5 to 4 years Show forest plot | 1 | 53 | Mean Difference (IV, Fixed, 95% CI) | 9.06 [‐1.06, 19.18] |
| 15 Inhibition at 3.5 to 4 years Show forest plot | 1 | 53 | Mean Difference (IV, Fixed, 95% CI) | 7.60 [‐2.79, 17.99] |
| Outcome or subgroup title | No. of studies | No. of participants | Statistical method | Effect size |
| 1 Time to achieve full enteral feeding (days) Show forest plot | 1 | 50 | Mean Difference (IV, Fixed, 95% CI) | ‐2.90 [‐5.77, ‐0.03] |