Scolaris Content Display Scolaris Content Display

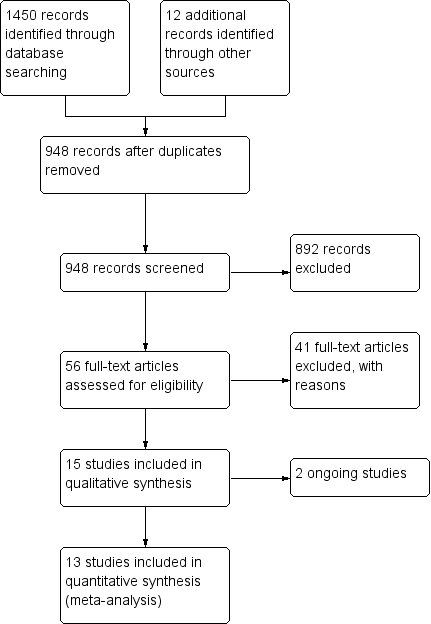
Study flow diagram
Figuras y tablas -
Figure 1

Study flow diagram

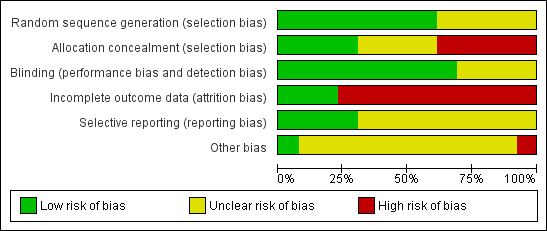
Risk of bias graph: review authors' judgements about each risk of bias item presented as percentages across all included studies.
Figuras y tablas -
Figure 2

Risk of bias graph: review authors' judgements about each risk of bias item presented as percentages across all included studies.

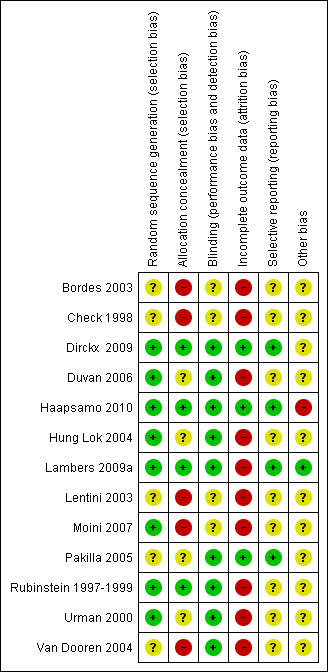
Risk of bias summary: review authors' judgements about each risk of bias item for each included study.
Figuras y tablas -
Figure 3

Risk of bias summary: review authors' judgements about each risk of bias item for each included study.

Forest plot of comparison: 1 Low‐dose aspirin versus placebo or no treatment, outcome: 1.1 Live birth rate per woman or couple.
Figuras y tablas -
Figure 4

Forest plot of comparison: 1 Low‐dose aspirin versus placebo or no treatment, outcome: 1.1 Live birth rate per woman or couple.

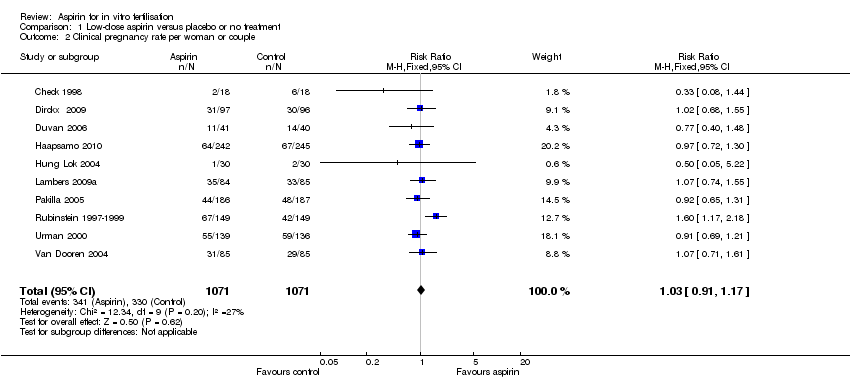
Forest plot of comparison: 1 Low‐dose aspirin versus placebo or no treatment, outcome: 1.2 Clinical pregnancy rate per woman or couple.
Figuras y tablas -
Figure 5

Forest plot of comparison: 1 Low‐dose aspirin versus placebo or no treatment, outcome: 1.2 Clinical pregnancy rate per woman or couple.

Comparison 1 Low‐dose aspirin versus placebo or no treatment, Outcome 1 Live birth rate per woman or couple.
Figuras y tablas -
Analysis 1.1

Comparison 1 Low‐dose aspirin versus placebo or no treatment, Outcome 1 Live birth rate per woman or couple.

Comparison 1 Low‐dose aspirin versus placebo or no treatment, Outcome 2 Clinical pregnancy rate per woman or couple.
Figuras y tablas -
Analysis 1.2

Comparison 1 Low‐dose aspirin versus placebo or no treatment, Outcome 2 Clinical pregnancy rate per woman or couple.

Comparison 1 Low‐dose aspirin versus placebo or no treatment, Outcome 3 Ongoing pregnancy rate (beyond 12 weeks).
Figuras y tablas -
Analysis 1.3

Comparison 1 Low‐dose aspirin versus placebo or no treatment, Outcome 3 Ongoing pregnancy rate (beyond 12 weeks).

Comparison 1 Low‐dose aspirin versus placebo or no treatment, Outcome 4 Multiple pregnancy rate per woman per couple (on ultrasound).
Figuras y tablas -
Analysis 1.4

Comparison 1 Low‐dose aspirin versus placebo or no treatment, Outcome 4 Multiple pregnancy rate per woman per couple (on ultrasound).

Comparison 1 Low‐dose aspirin versus placebo or no treatment, Outcome 5 Multiple pregnancy rate per woman per couple at birth.
Figuras y tablas -
Analysis 1.5

Comparison 1 Low‐dose aspirin versus placebo or no treatment, Outcome 5 Multiple pregnancy rate per woman per couple at birth.

Comparison 1 Low‐dose aspirin versus placebo or no treatment, Outcome 6 Miscarriage rate per woman per couple.
Figuras y tablas -
Analysis 1.6

Comparison 1 Low‐dose aspirin versus placebo or no treatment, Outcome 6 Miscarriage rate per woman per couple.

Comparison 1 Low‐dose aspirin versus placebo or no treatment, Outcome 7 Complications during pregnancy per woman per couple ‐ ectopic pregnancy.
Figuras y tablas -
Analysis 1.7

Comparison 1 Low‐dose aspirin versus placebo or no treatment, Outcome 7 Complications during pregnancy per woman per couple ‐ ectopic pregnancy.

Comparison 1 Low‐dose aspirin versus placebo or no treatment, Outcome 8 Complications during pregnancy per woman/per couple/vaginal bleeding during pregnancy.
Figuras y tablas -
Analysis 1.8

Comparison 1 Low‐dose aspirin versus placebo or no treatment, Outcome 8 Complications during pregnancy per woman/per couple/vaginal bleeding during pregnancy.

Comparison 1 Low‐dose aspirin versus placebo or no treatment, Outcome 9 Clinical pregnancy rate ‐ subgroup analysis ‐ timing of treatment.
Figuras y tablas -
Analysis 1.9

Comparison 1 Low‐dose aspirin versus placebo or no treatment, Outcome 9 Clinical pregnancy rate ‐ subgroup analysis ‐ timing of treatment.

Comparison 1 Low‐dose aspirin versus placebo or no treatment, Outcome 10 Clinical pregnancy rate ‐ sensitivity analysis.
Figuras y tablas -
Analysis 1.10

Comparison 1 Low‐dose aspirin versus placebo or no treatment, Outcome 10 Clinical pregnancy rate ‐ sensitivity analysis.

Summary of findings for the main comparison. Low‐dose aspirin compared to placebo or no treatment for women undergoing ART

Low‐dose aspirin compared to placebo or no treatment for women undergoing ART

Population: Women with subfertility
Settings: Fertility clinics
Intervention: Low‐dose aspirin
Comparison: Placebo or no treatment

Outcomes

Illustrative comparative risks* (95% CI)

Relative effect
(95% CI)

No of Participants
(studies)

Quality of the evidence
(GRADE)

Comments

Assumed risk

Corresponding risk

Placebo or no treatment

Low‐dose aspirin

Live birth

225 per 1000

204 per 1000
(162 to 258)

RR 0.91
(0.72 to 1.15)

1053
(3 studies)

⊕⊕⊕⊝
moderate1

Clinical pregnancy

337 per 1000

347 per 1000
(307 to 395)

RR 1.03
(0.91 to 1.17)

2142
(10 studies)

⊕⊕⊕⊝
moderate2

Multiple pregnancy (on ultrasound)

84 per 1000

56 per 1000
(31 to 105)

RR 0.67

(0.37 to 1.25)

656
(2 studies)

⊕⊕⊝⊝
low4

Miscarriage rate per woman

43 per 1000

47 per 1000
(29 to 76)

RR 1.1
(0.68 to 1.77)

1497
(5 studies)

⊕⊕⊝⊝
low3

Ectopic pregnancy

12 per 1000

23 per 1000
(9 to 56)

RR 1.86
(0.75 to 4.63)

1135
(3 studies)

⊕⊝⊝⊝
very low5

Vaginal bleeding

8 per 1000

8 per 1000

(1 to 58)

RR 1.01

(0.14 to 7.13)

487

(1 study)

⊕⊝⊝⊝
very low6

Other adverse events

Other adverse events (such as preterm birth, antepartum haemorrhage, need for operative delivery) were not reported in the included studies

*The basis for the assumed risk is the median control group risk across studies. The corresponding risk (and its 95% confidence interval) is based on the assumed risk in the comparison group and the relative effect of the intervention (and its 95% CI).
CI: Confidence interval; RR: Risk ratio;

GRADE Working Group grades of evidence
High quality: Further research is very unlikely to change our confidence in the estimate of effect.
Moderate quality: Further research is likely to have an important impact on our confidence in the estimate of effect and may change the estimate.
Low quality: Further research is very likely to have an important impact on our confidence in the estimate of effect and is likely to change the estimate.
Very low quality: We are very uncertain about the estimate.

1 Downgraded one level for serious imprecision with low event rate. Confidence interval compatible with no effect from the intervention or with clinically meaningful benefit in the control group.
2 Downgraded one level for serious risk of bias: half of the studies failed to report sufficient detail about study methods.
3 Serious imprecision with low event rate: Confidence interval compatible with no effect from the intervention or with clinically meaningful benefit in either group. Failure to report sufficient detail about study methods.
4 Very serious imprecision with very low event rate. Confidence interval compatible with no effect from the intervention or with clinically meaningful benefit in the intervention group.
5 Very serious imprecision with very low event rate. Confidence interval compatible with no effect from the intervention or with clinically meaningful benefit in either group. Serious risk of bias: failure to describe study methods in sufficient detail.

6 Single study. Very serious imprecision with very low event rate. Confidence interval compatible with no effect from the intervention or with clinically meaningful benefit in either group.

Figuras y tablas -
Summary of findings for the main comparison. Low‐dose aspirin compared to placebo or no treatment for women undergoing ART
Comparison 1. Low‐dose aspirin versus placebo or no treatment

Outcome or subgroup title

No. of studies

No. of participants

Statistical method

Effect size

1 Live birth rate per woman or couple Show forest plot

3

1053

Risk Ratio (M‐H, Fixed, 95% CI)

0.91 [0.72, 1.15]

2 Clinical pregnancy rate per woman or couple Show forest plot

10

2142

Risk Ratio (M‐H, Fixed, 95% CI)

1.03 [0.91, 1.17]

3 Ongoing pregnancy rate (beyond 12 weeks) Show forest plot

2

339

Risk Ratio (M‐H, Fixed, 95% CI)

0.94 [0.69, 1.27]

4 Multiple pregnancy rate per woman per couple (on ultrasound) Show forest plot

2

656

Risk Ratio (M‐H, Fixed, 95% CI)

0.67 [0.37, 1.25]

5 Multiple pregnancy rate per woman per couple at birth Show forest plot

2

680

Risk Ratio (M‐H, Fixed, 95% CI)

0.74 [0.38, 1.46]

6 Miscarriage rate per woman per couple Show forest plot

5

1497

Risk Ratio (M‐H, Fixed, 95% CI)

1.10 [0.68, 1.77]

7 Complications during pregnancy per woman per couple ‐ ectopic pregnancy Show forest plot

3

1135

Risk Ratio (M‐H, Fixed, 95% CI)

1.86 [0.75, 4.63]

8 Complications during pregnancy per woman/per couple/vaginal bleeding during pregnancy Show forest plot

1

487

Risk Ratio (M‐H, Fixed, 95% CI)

1.01 [0.14, 7.13]

9 Clinical pregnancy rate ‐ subgroup analysis ‐ timing of treatment Show forest plot

10

2142

Risk Ratio (M‐H, Fixed, 95% CI)

1.03 [0.91, 1.17]

9.1 Treatment started before down‐regulation

2

362

Risk Ratio (M‐H, Fixed, 95% CI)

1.05 [0.80, 1.38]

9.2 Treatment started at down‐regulation

4

1006

Risk Ratio (M‐H, Fixed, 95% CI)

1.10 [0.92, 1.31]

9.3 Treatment started after down‐regulation

4

774

Risk Ratio (M‐H, Fixed, 95% CI)

0.94 [0.75, 1.17]

10 Clinical pregnancy rate ‐ sensitivity analysis Show forest plot

3

849

Risk Ratio (M‐H, Fixed, 95% CI)

1.01 [0.82, 1.23]

Figuras y tablas -
Comparison 1. Low‐dose aspirin versus placebo or no treatment