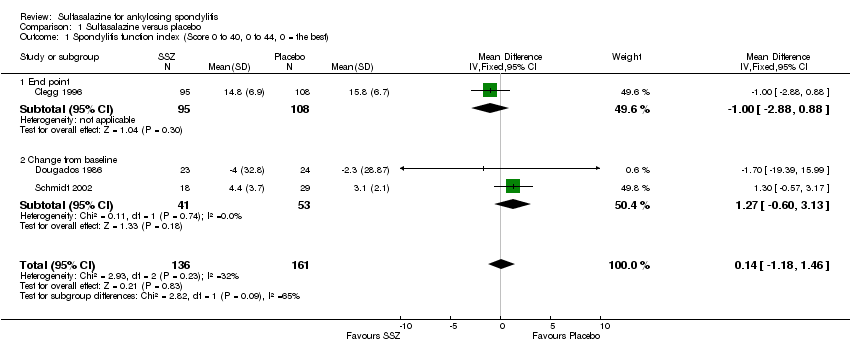
| 1 Spondylitis function index (Score 0 to 40, 0 to 44, 0 = the best) Show forest plot | 3 | 297 | Mean Difference (IV, Fixed, 95% CI) | 0.14 [‐1.18, 1.46] |
|
| 1.1 End point | 1 | 203 | Mean Difference (IV, Fixed, 95% CI) | ‐1.0 [‐2.88, 0.88] |
| 1.2 Change from baseline | 2 | 94 | Mean Difference (IV, Fixed, 95% CI) | 1.27 [‐0.60, 3.13] |
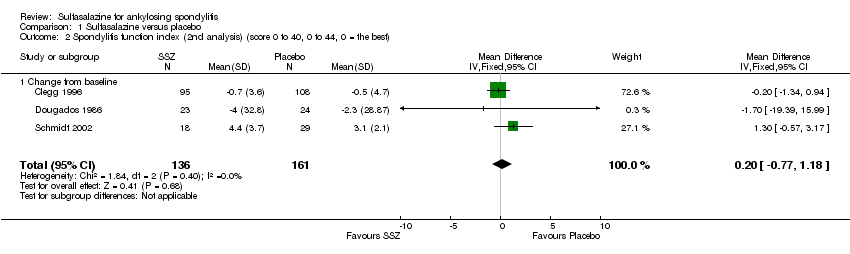
| 2 Spondylitis function index (2nd analysis) (score 0 to 40, 0 to 44, 0 = the best) Show forest plot | 3 | 297 | Mean Difference (IV, Fixed, 95% CI) | 0.20 [‐0.77, 1.18] |
|
| 2.1 Change from baseline | 3 | 297 | Mean Difference (IV, Fixed, 95% CI) | 0.20 [‐0.77, 1.18] |
| 3 Improvement in back pain Show forest plot | 1 | | Risk Ratio (M‐H, Fixed, 95% CI) | Totals not selected |
|
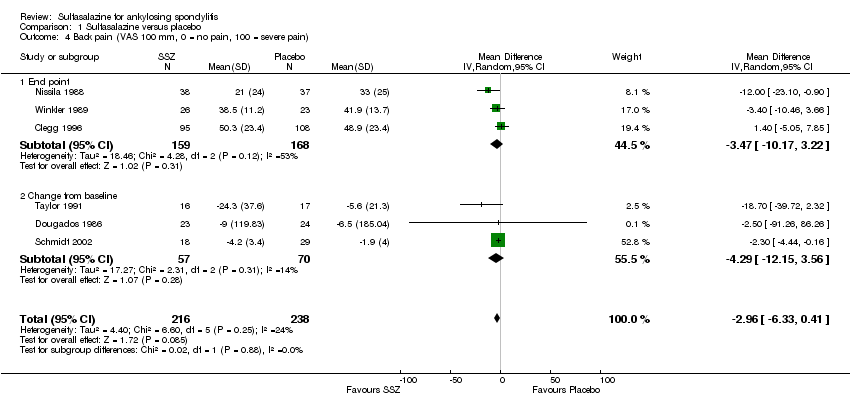
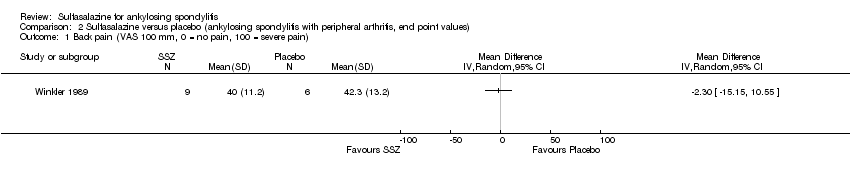
| 4 Back pain (VAS 100 mm, 0 = no pain, 100 = severe pain) Show forest plot | 6 | 454 | Mean Difference (IV, Random, 95% CI) | ‐2.96 [‐6.33, 0.41] |
|
| 4.1 End point | 3 | 327 | Mean Difference (IV, Random, 95% CI) | ‐3.47 [‐10.17, 3.22] |
| 4.2 Change from baseline | 3 | 127 | Mean Difference (IV, Random, 95% CI) | ‐4.29 [‐12.15, 3.56] |
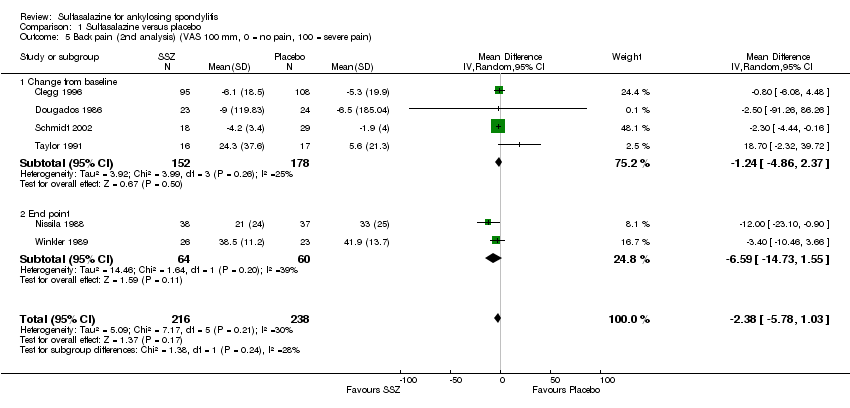
| 5 Back pain (2nd analysis) (VAS 100 mm, 0 = no pain, 100 = severe pain) Show forest plot | 6 | 454 | Mean Difference (IV, Random, 95% CI) | ‐2.38 [‐5.78, 1.03] |
|
| 5.1 Change from baseline | 4 | 330 | Mean Difference (IV, Random, 95% CI) | ‐1.24 [‐4.86, 2.37] |
| 5.2 End point | 2 | 124 | Mean Difference (IV, Random, 95% CI) | ‐6.59 [‐14.73, 1.55] |
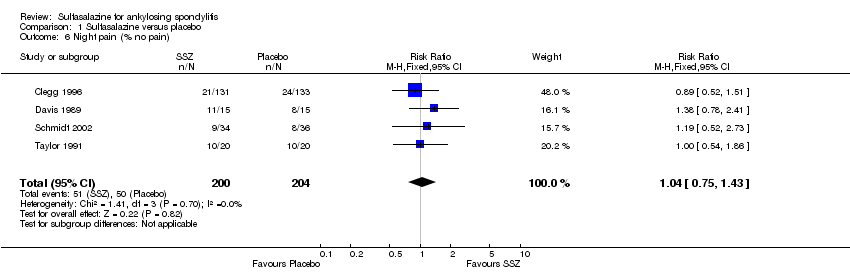
| 6 Night pain (% no pain) Show forest plot | 4 | 404 | Risk Ratio (M‐H, Fixed, 95% CI) | 1.04 [0.75, 1.43] |
|
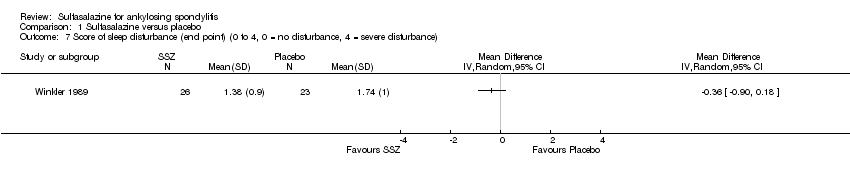
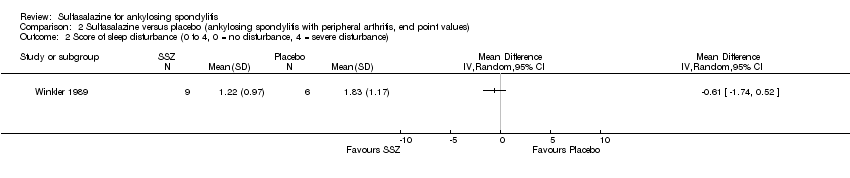
| 7 Score of sleep disturbance (end point) (0 to 4, 0 = no disturbance, 4 = severe disturbance) Show forest plot | 1 | | Mean Difference (IV, Random, 95% CI) | Totals not selected |
|
| 8 Frequency of nocturnal awakening (change from baseline) Show forest plot | 1 | | Mean Difference (IV, Random, 95% CI) | Totals not selected |
|
| 9 Score of daily NSAIDs (change from baseline, usual dosage as 10) Show forest plot | 1 | | Mean Difference (IV, Random, 95% CI) | Totals not selected |
|
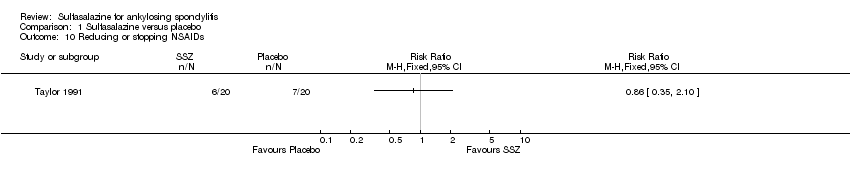
| 10 Reducing or stopping NSAIDs Show forest plot | 1 | | Risk Ratio (M‐H, Fixed, 95% CI) | Totals not selected |
|
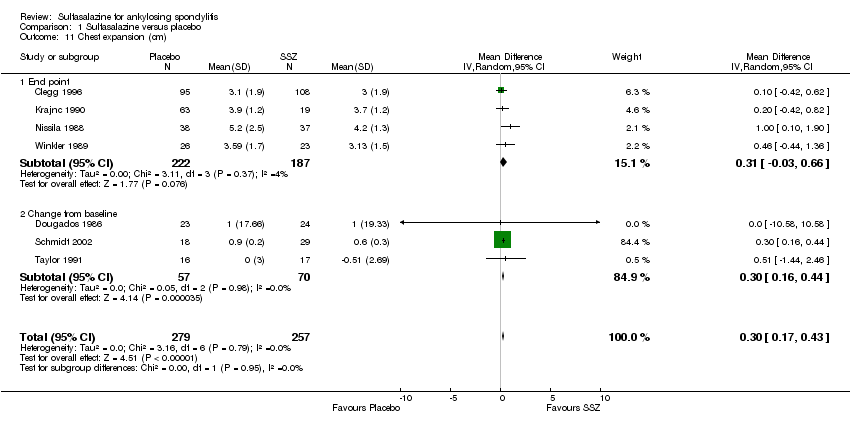
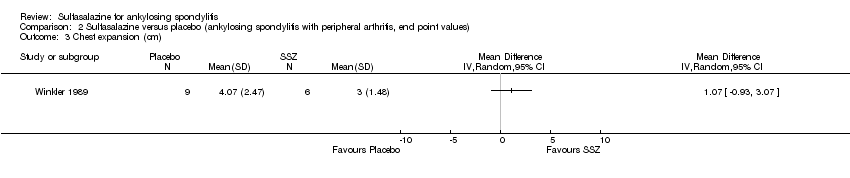
| 11 Chest expansion (cm) Show forest plot | 7 | 536 | Mean Difference (IV, Random, 95% CI) | 0.30 [0.17, 0.43] |
|
| 11.1 End point | 4 | 409 | Mean Difference (IV, Random, 95% CI) | 0.31 [‐0.03, 0.66] |
| 11.2 Change from baseline | 3 | 127 | Mean Difference (IV, Random, 95% CI) | 0.30 [0.16, 0.44] |
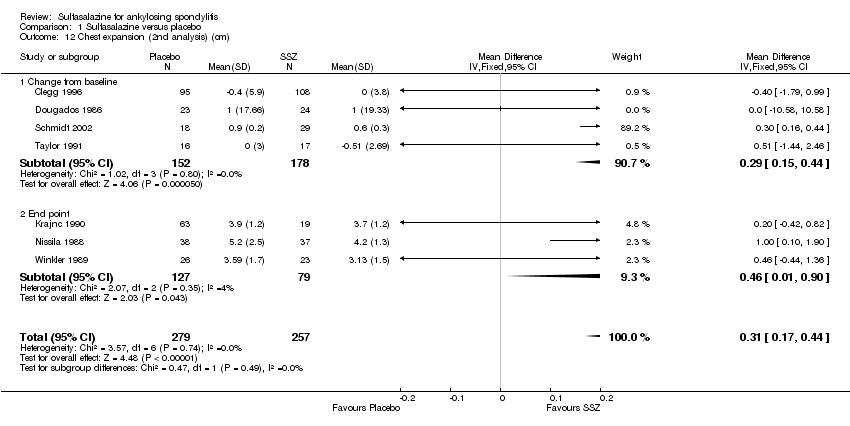
| 12 Chest expansion (2nd analysis) (cm) Show forest plot | 7 | 536 | Mean Difference (IV, Fixed, 95% CI) | 0.31 [0.17, 0.44] |
|
| 12.1 Change from baseline | 4 | 330 | Mean Difference (IV, Fixed, 95% CI) | 0.29 [0.15, 0.44] |
| 12.2 End point | 3 | 206 | Mean Difference (IV, Fixed, 95% CI) | 0.46 [0.01, 0.90] |
| 13 Forced vital volume (change from baseline) (L/min) Show forest plot | 1 | | Mean Difference (IV, Random, 95% CI) | Totals not selected |
|
| 14 (Modified) Schober's test (cm) Show forest plot | 7 | 536 | Mean Difference (IV, Random, 95% CI) | 0.18 [‐0.11, 0.46] |
|
| 14.1 End point | 4 | 409 | Mean Difference (IV, Random, 95% CI) | 0.07 [‐0.14, 0.29] |
| 14.2 Change from baseline | 3 | 127 | Mean Difference (IV, Random, 95% CI) | 0.50 [0.44, 0.56] |
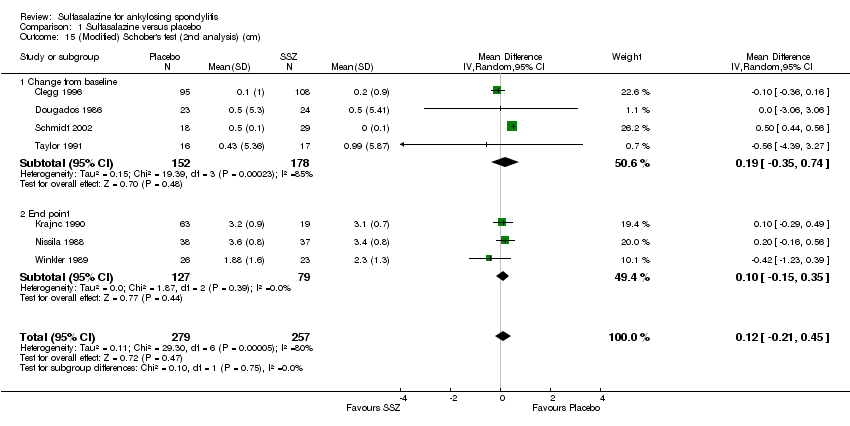
| 15 (Modified) Schober's test (2nd analysis) (cm) Show forest plot | 7 | 536 | Mean Difference (IV, Random, 95% CI) | 0.12 [‐0.21, 0.45] |
|
| 15.1 Change from baseline | 4 | 330 | Mean Difference (IV, Random, 95% CI) | 0.19 [‐0.35, 0.74] |
| 15.2 End point | 3 | 206 | Mean Difference (IV, Random, 95% CI) | 0.10 [‐0.15, 0.35] |
| 16 Occiput‐to‐wall test (cm) Show forest plot | 5 | 386 | Mean Difference (IV, Random, 95% CI) | 0.08 [‐0.90, 1.06] |
|
| 16.1 End point | 3 | 306 | Mean Difference (IV, Random, 95% CI) | ‐0.63 [‐1.33, 0.07] |
| 16.2 Change from baseline | 2 | 80 | Mean Difference (IV, Random, 95% CI) | 0.68 [0.31, 1.05] |
| 17 Occiput‐to‐wall test (2nd analysis) (cm) Show forest plot | 5 | 386 | Mean Difference (IV, Random, 95% CI) | ‐0.03 [‐0.84, 0.79] |
|
| 17.1 Change from baseline | 3 | 283 | Mean Difference (IV, Random, 95% CI) | 0.30 [‐0.43, 1.03] |
| 17.2 End point | 2 | 103 | Mean Difference (IV, Random, 95% CI) | ‐0.75 [‐1.49, ‐0.02] |
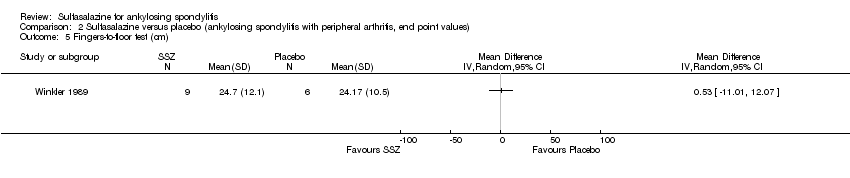
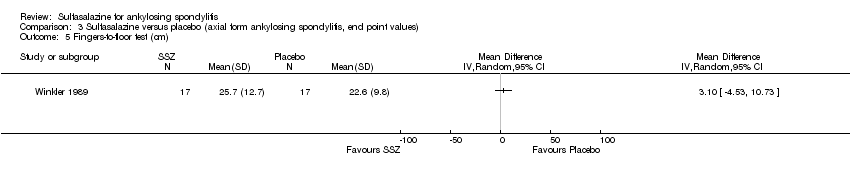
| 18 Fingers‐to‐floor test (cm) Show forest plot | 7 | 517 | Mean Difference (IV, Random, 95% CI) | ‐1.03 [‐2.93, 0.87] |
|
| 18.1 End point | 5 | 437 | Mean Difference (IV, Random, 95% CI) | ‐0.64 [‐2.77, 1.49] |
| 18.2 Change from baseline | 2 | 80 | Mean Difference (IV, Random, 95% CI) | ‐2.54 [‐6.75, 1.67] |
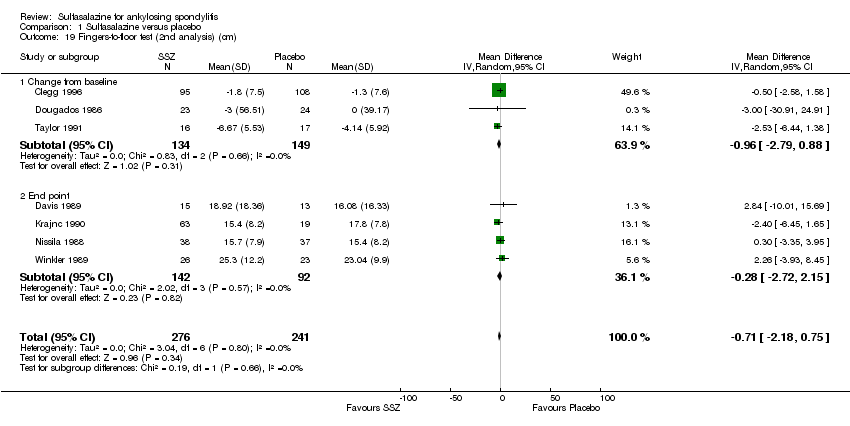
| 19 Fingers‐to‐floor test (2nd analysis) (cm) Show forest plot | 7 | 517 | Mean Difference (IV, Random, 95% CI) | ‐0.71 [‐2.18, 0.75] |
|
| 19.1 Change from baseline | 3 | 283 | Mean Difference (IV, Random, 95% CI) | ‐0.96 [‐2.79, 0.88] |
| 19.2 End point | 4 | 234 | Mean Difference (IV, Random, 95% CI) | ‐0.28 [‐2.72, 2.15] |
| 20 Chin sternum distance (change from baseline) (cm) Show forest plot | 1 | | Mean Difference (IV, Fixed, 95% CI) | Totals not selected |
|
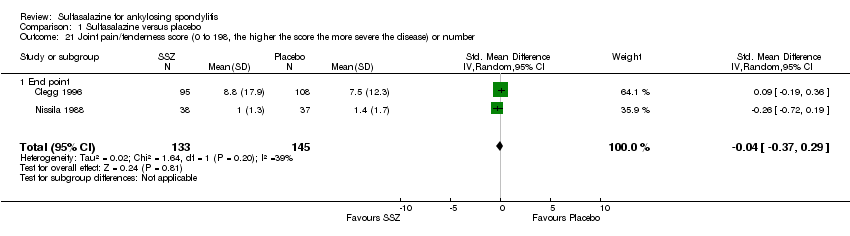
| 21 Joint pain/tenderness score (0 to 198, the higher the score the more severe the disease) or number Show forest plot | 2 | 278 | Std. Mean Difference (IV, Random, 95% CI) | ‐0.04 [‐0.37, 0.29] |
|
| 21.1 End point | 2 | 278 | Std. Mean Difference (IV, Random, 95% CI) | ‐0.04 [‐0.37, 0.29] |
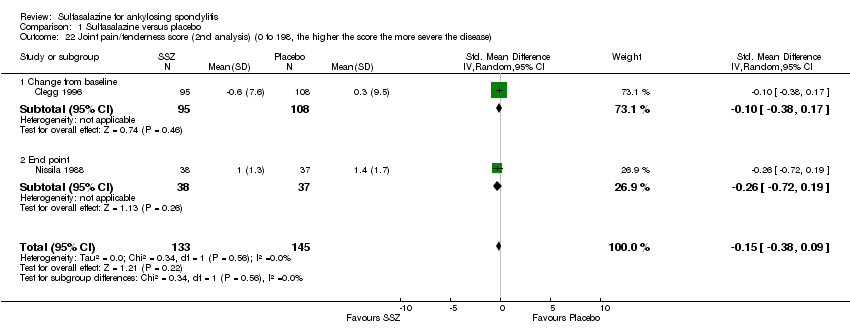
| 22 Joint pain/tenderness score (2nd analysis) (0 to 198, the higher the score the more severe the disease) Show forest plot | 2 | 278 | Std. Mean Difference (IV, Random, 95% CI) | ‐0.15 [‐0.38, 0.09] |
|
| 22.1 Change from baseline | 1 | 203 | Std. Mean Difference (IV, Random, 95% CI) | ‐0.10 [‐0.38, 0.17] |
| 22.2 End point | 1 | 75 | Std. Mean Difference (IV, Random, 95% CI) | ‐0.26 [‐0.72, 0.19] |
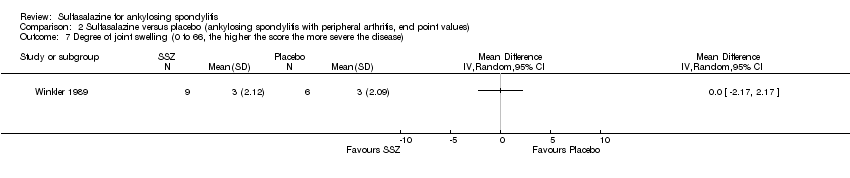
| 23 Joint swelling score (0 to 198, the higher score the more severe the disease) or number Show forest plot | 2 | 278 | Std. Mean Difference (IV, Random, 95% CI) | 0.04 [‐0.20, 0.27] |
|
| 23.1 End point | 2 | 278 | Std. Mean Difference (IV, Random, 95% CI) | 0.04 [‐0.20, 0.27] |
| 24 Joint swelling score (2nd analysis) (0 to 198, the higher the score the more severe the disease) Show forest plot | 2 | 278 | Mean Difference (IV, Random, 95% CI) | 0.0 [‐0.29, 0.29] |
|
| 24.1 Change from baseline | 1 | 203 | Mean Difference (IV, Random, 95% CI) | 0.0 [‐0.97, 0.97] |
| 24.2 End point | 1 | 75 | Mean Difference (IV, Random, 95% CI) | 0.0 [‐0.30, 0.30] |
| 25 Dactylitis score (0 to 3, 0 = normal, 3 = severe) Show forest plot | 1 | | Mean Difference (IV, Random, 95% CI) | Totals not selected |
|
| 26 Dactylitis score (2nd analysis) (0 to 3, 0 = normal, 3 = severe) Show forest plot | 1 | | Mean Difference (IV, Random, 95% CI) | Totals not selected |
|
| 27 Enthesopathy index (0 to 90, 0 to 66, 0 to 90, the higher the score the more severe the disease) Show forest plot | 3 | 297 | Std. Mean Difference (IV, Random, 95% CI) | 0.10 [‐0.13, 0.33] |
|
| 27.1 End point | 1 | 203 | Std. Mean Difference (IV, Random, 95% CI) | 0.06 [‐0.22, 0.33] |
| 27.2 Change from baseline | 2 | 94 | Std. Mean Difference (IV, Random, 95% CI) | 0.19 [‐0.29, 0.68] |
| 28 Enthesopathy index (2nd analysis) (0 to 90, 0 to 66, 0 to 90, the higher score the more severe the disease) Show forest plot | 3 | 297 | Std. Mean Difference (IV, Random, 95% CI) | 0.11 [‐0.12, 0.34] |
|
| 28.1 Change from baseline | 3 | 297 | Std. Mean Difference (IV, Random, 95% CI) | 0.11 [‐0.12, 0.34] |
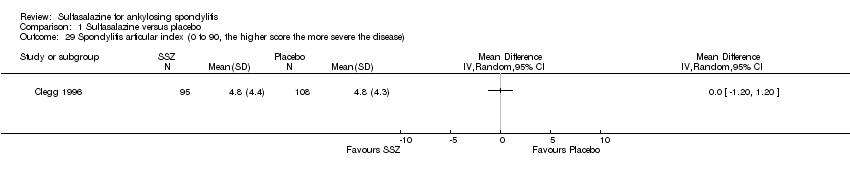
| 29 Spondylitis articular index (0 to 90, the higher score the more severe the disease) Show forest plot | 1 | | Mean Difference (IV, Random, 95% CI) | Totals not selected |
|
| 30 Spondylitis articular index (2nd analysis) (0 to 90, the higher score the more severe the disease) Show forest plot | 1 | | Mean Difference (IV, Random, 95% CI) | Totals not selected |
|
| 31 Improvement in patient global assessment Show forest plot | 3 | 394 | Risk Ratio (IV, Random, 95% CI) | 1.52 [0.78, 2.97] |
|
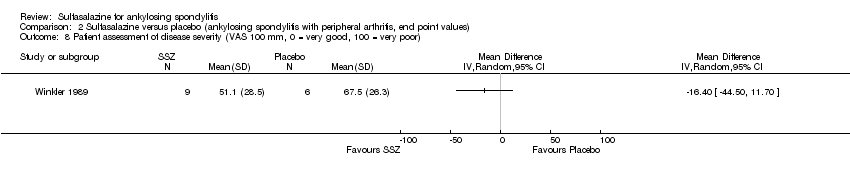
| 32 Patient assessment of disease severity (end point) (VAS 100 mm, 0 = very good, 100 = very poor) Show forest plot | 1 | | Mean Difference (IV, Fixed, 95% CI) | Totals not selected |
|
| 33 General well‐being (end point) (VAS 100 mm, 0 = very good, 100 = very poor) Show forest plot | 1 | | Mean Difference (IV, Random, 95% CI) | Totals not selected |
|
| 34 Improvement in physician global assessment Show forest plot | 2 | 334 | Risk Ratio (IV, Random, 95% CI) | 1.34 [0.59, 3.08] |
|
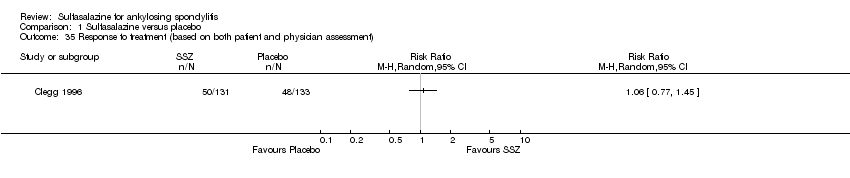
| 35 Response to treatment (based on both patient and physician assessment) Show forest plot | 1 | | Risk Ratio (M‐H, Random, 95% CI) | Totals not selected |
|
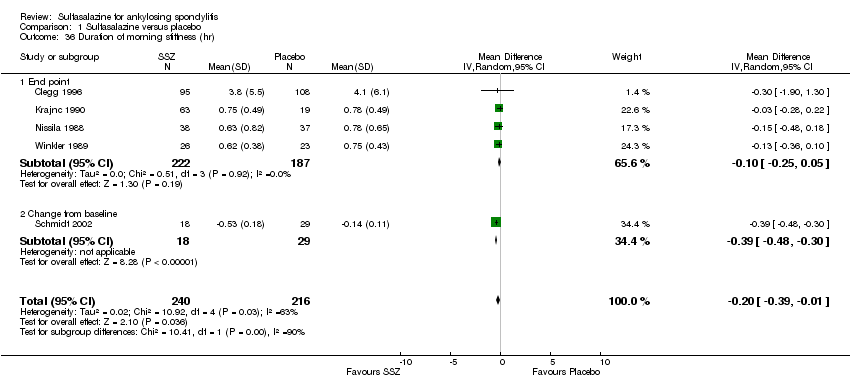
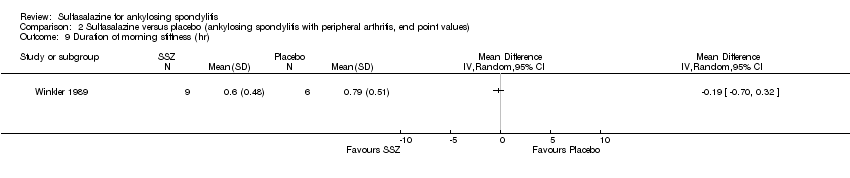
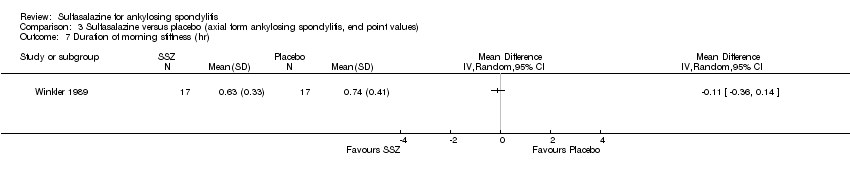
| 36 Duration of morning stiffness (hr) Show forest plot | 5 | 456 | Mean Difference (IV, Random, 95% CI) | ‐0.20 [‐0.39, ‐0.01] |
|
| 36.1 End point | 4 | 409 | Mean Difference (IV, Random, 95% CI) | ‐0.10 [‐0.25, 0.05] |
| 36.2 Change from baseline | 1 | 47 | Mean Difference (IV, Random, 95% CI) | ‐0.39 [‐0.48, ‐0.30] |
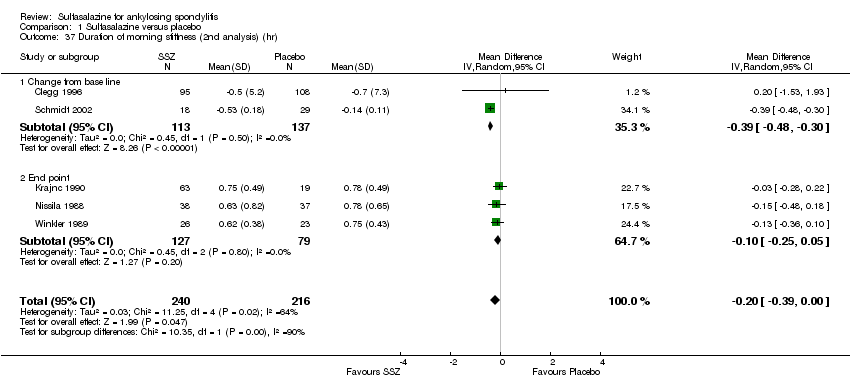
| 37 Duration of morning stiffness (2nd analysis) (hr) Show forest plot | 5 | 456 | Mean Difference (IV, Random, 95% CI) | ‐0.20 [‐0.39, ‐0.00] |
|
| 37.1 Change from base line | 2 | 250 | Mean Difference (IV, Random, 95% CI) | ‐0.39 [‐0.48, ‐0.30] |
| 37.2 End point | 3 | 206 | Mean Difference (IV, Random, 95% CI) | ‐0.10 [‐0.25, 0.05] |
| 38 Morning stiffness (end point) (VAS 100 mm, 0 = no stiffness, 100 = severe stiffness) Show forest plot | 2 | 108 | Mean Difference (IV, Random, 95% CI) | ‐13.89 [‐22.54, ‐5.24] |
|
| 38.1 End point | 1 | 75 | Mean Difference (IV, Random, 95% CI) | ‐12.00 [‐23.78, ‐4.22] |
| 38.2 Change from baseline | 1 | 33 | Mean Difference (IV, Random, 95% CI) | ‐13.5 [‐30.00, 5.00] |
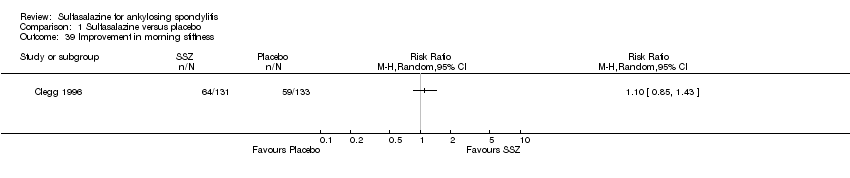
| 39 Improvement in morning stiffness Show forest plot | 1 | | Risk Ratio (M‐H, Random, 95% CI) | Totals not selected |
|
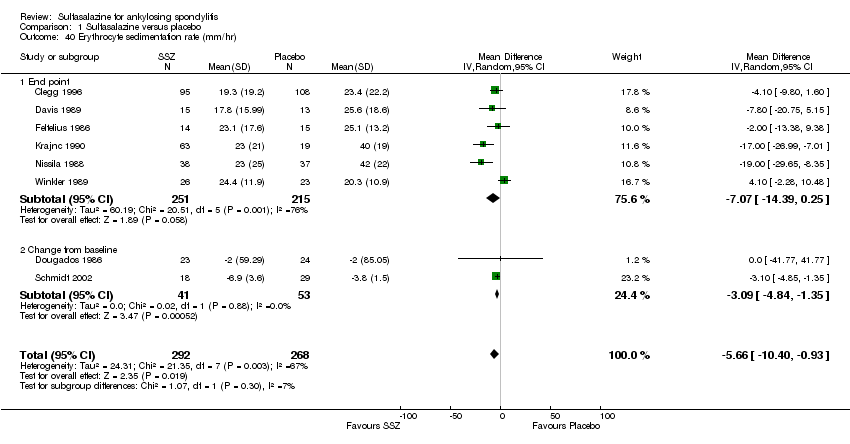
| 40 Erythrocyte sedimentation rate (mm/hr) Show forest plot | 8 | 560 | Mean Difference (IV, Random, 95% CI) | ‐5.66 [‐10.40, ‐0.93] |
|
| 40.1 End point | 6 | 466 | Mean Difference (IV, Random, 95% CI) | ‐7.07 [‐14.39, 0.25] |
| 40.2 Change from baseline | 2 | 94 | Mean Difference (IV, Random, 95% CI) | ‐3.09 [‐4.84, ‐1.35] |
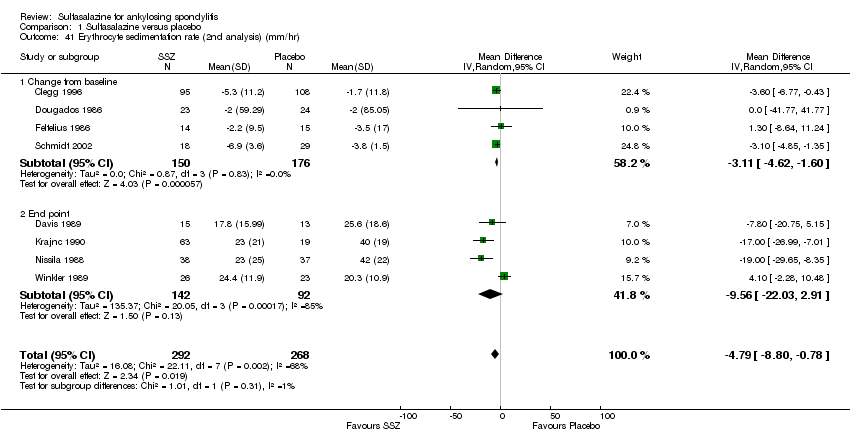
| 41 Erythrocyte sedimentation rate (2nd analysis) (mm/hr) Show forest plot | 8 | 560 | Mean Difference (IV, Random, 95% CI) | ‐4.79 [‐8.80, ‐0.78] |
|
| 41.1 Change from baseline | 4 | 326 | Mean Difference (IV, Random, 95% CI) | ‐3.11 [‐4.62, ‐1.60] |
| 41.2 End point | 4 | 234 | Mean Difference (IV, Random, 95% CI) | ‐9.56 [‐22.03, 2.91] |
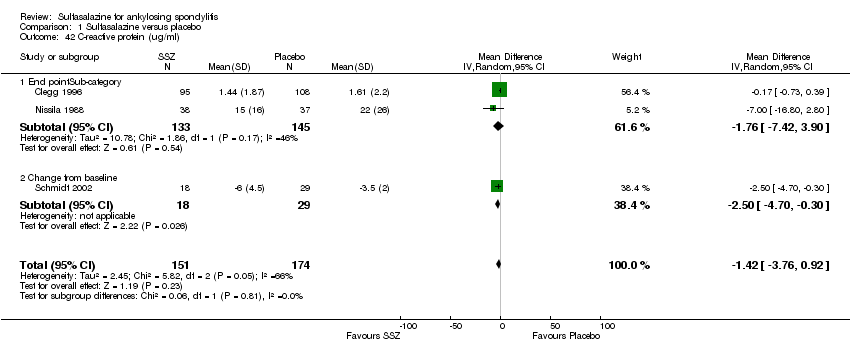
| 42 C‐reactive protein (ug/ml) Show forest plot | 3 | 325 | Mean Difference (IV, Random, 95% CI) | ‐1.42 [‐3.76, 0.92] |
|
| 42.1 End pointSub‐category | 2 | 278 | Mean Difference (IV, Random, 95% CI) | ‐1.76 [‐7.42, 3.90] |
| 42.2 Change from baseline | 1 | 47 | Mean Difference (IV, Random, 95% CI) | ‐2.5 [‐4.70, ‐0.30] |
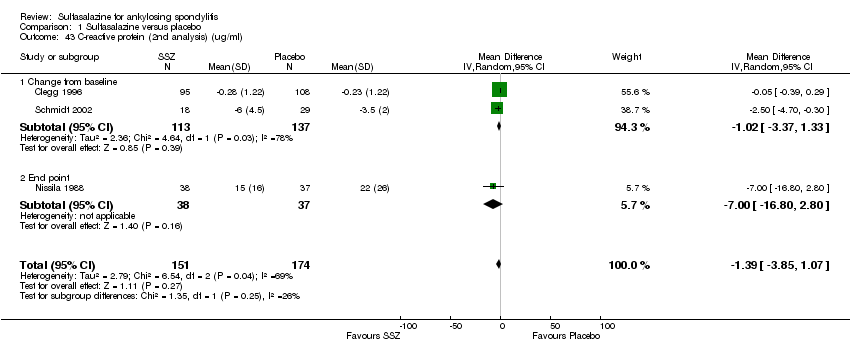
| 43 C‐reactive protein (2nd analysis) (ug/ml) Show forest plot | 3 | 325 | Mean Difference (IV, Random, 95% CI) | ‐1.39 [‐3.85, 1.07] |
|
| 43.1 Change from baseline | 2 | 250 | Mean Difference (IV, Random, 95% CI) | ‐1.02 [‐3.37, 1.33] |
| 43.2 End point | 1 | 75 | Mean Difference (IV, Random, 95% CI) | ‐7.0 [‐16.80, 2.80] |
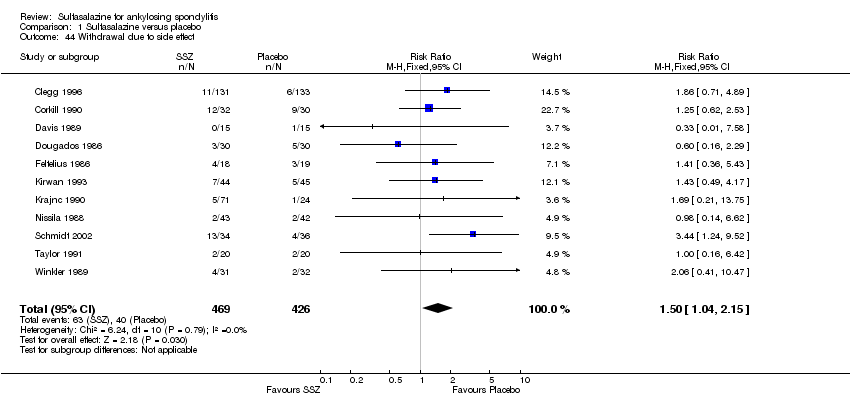
| 44 Withdrawal due to side effect Show forest plot | 11 | 895 | Risk Ratio (M‐H, Fixed, 95% CI) | 1.50 [1.04, 2.15] |
|
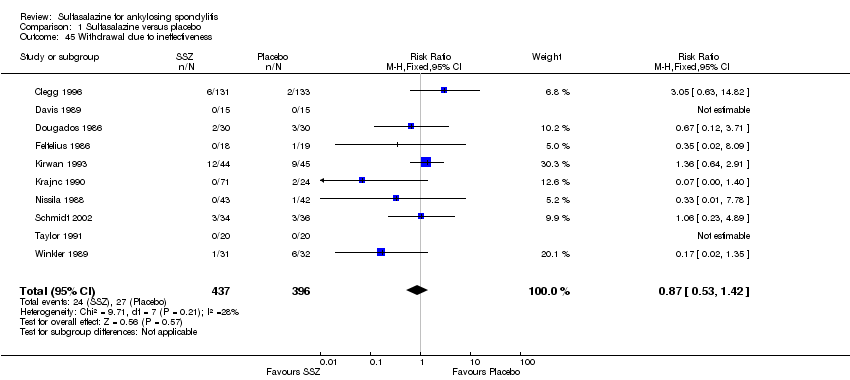
| 45 Withdrawal due to ineffectiveness Show forest plot | 10 | 833 | Risk Ratio (M‐H, Fixed, 95% CI) | 0.87 [0.53, 1.42] |
|
| 46 Drop‐out for any reason Show forest plot | 10 | 833 | Risk Ratio (M‐H, Fixed, 95% CI) | 1.33 [1.03, 1.73] |
|
| 47 Serious adverse events Show forest plot | 1 | 264 | Peto Odds Ratio (Peto, Fixed, 95% CI) | 7.50 [0.15, 378.16] |
|