| 1 Cure (sputum culture conversion) at 8 weeks Show forest plot | 3 | 416 | Risk Ratio (M‐H, Random, 95% CI) | 0.98 [0.82, 1.17] |
|
| 1.1 Ciprofloxacin vs rifampicin | 1 | 60 | Risk Ratio (M‐H, Random, 95% CI) | 1.08 [0.88, 1.32] |
| 1.2 Ciprofloxacin vs ethambutol plus pyrazinamide | 1 | 20 | Risk Ratio (M‐H, Random, 95% CI) | 0.68 [0.42, 1.09] |
| 1.3 Moxifloxacin vs ethambutol | 1 | 336 | Risk Ratio (M‐H, Random, 95% CI) | 1.00 [0.83, 1.19] |
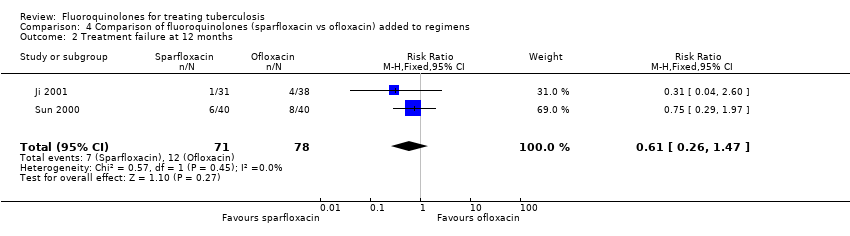
| 2 Treatment failure at 12 months Show forest plot | 3 | 388 | Risk Ratio (M‐H, Fixed, 95% CI) | 2.14 [0.71, 6.42] |
|
| 2.1 Ciprofloxacin vs rifampicin | 1 | 60 | Risk Ratio (M‐H, Fixed, 95% CI) | 3.0 [0.13, 70.83] |
| 2.2 Ciprofloxacin vs ethambutol plus pyrazinamide | 2 | 328 | Risk Ratio (M‐H, Fixed, 95% CI) | 2.03 [0.63, 6.58] |
| 3 Relapse Show forest plot | 3 | 384 | Risk Ratio (M‐H, Fixed, 95% CI) | 7.17 [1.33, 38.58] |
|
| 3.1 Ciprofloxacin vs ethambutol plus pyrazinamide | 1 | 168 | Risk Ratio (M‐H, Fixed, 95% CI) | 15.72 [0.91, 270.96] |
| 3.2 Ciprofloxacin vs rifampicin | 1 | 60 | Risk Ratio (M‐H, Fixed, 95% CI) | 3.0 [0.33, 27.23] |
| 3.3 Ofloxacin vs ethambutol | 1 | 156 | Risk Ratio (M‐H, Fixed, 95% CI) | 0.0 [0.0, 0.0] |
| 4 Relapse: by HIV status Show forest plot | 1 | | Risk Ratio (M‐H, Fixed, 95% CI) | Totals not selected |
|
| 4.1 HIV‐positive participants: ciprofloxacin vs ethambutol plus pyrazinamide | 1 | | Risk Ratio (M‐H, Fixed, 95% CI) | 0.0 [0.0, 0.0] |
| 4.2 HIV‐negative participants: ciprofloxacin vs ethambutol plus pyrazinamide | 1 | | Risk Ratio (M‐H, Fixed, 95% CI) | 0.0 [0.0, 0.0] |
| 5 Time to sputum culture conversion (months) Show forest plot | 1 | | Mean Difference (IV, Fixed, 95% CI) | Totals not selected |
|
| 5.1 Ciprofloxacin vs ethambutol plus pyrazinamide | 1 | | Mean Difference (IV, Fixed, 95% CI) | 0.0 [0.0, 0.0] |
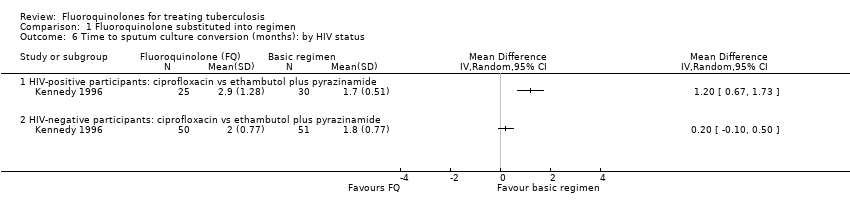
| 6 Time to sputum culture conversion (months): by HIV status Show forest plot | 1 | | Mean Difference (IV, Random, 95% CI) | Totals not selected |
|
| 6.1 HIV‐positive participants: ciprofloxacin vs ethambutol plus pyrazinamide | 1 | | Mean Difference (IV, Random, 95% CI) | 0.0 [0.0, 0.0] |
| 6.2 HIV‐negative participants: ciprofloxacin vs ethambutol plus pyrazinamide | 1 | | Mean Difference (IV, Random, 95% CI) | 0.0 [0.0, 0.0] |
| 7 Clinical or radiological improvement at 8 weeks Show forest plot | 2 | 216 | Risk Ratio (M‐H, Random, 95% CI) | 0.89 [0.49, 1.59] |
|
| 7.1 Ciprofloxacin vs rifampicin | 1 | 60 | Risk Ratio (M‐H, Random, 95% CI) | 1.08 [0.88, 1.32] |
| 7.2 Ofloxacin vs ethambutol | 1 | 156 | Risk Ratio (M‐H, Random, 95% CI) | 0.69 [0.44, 1.08] |
| 8 Serious adverse events Show forest plot | 5 | 743 | Risk Ratio (M‐H, Fixed, 95% CI) | 0.98 [0.56, 1.72] |
|
| 8.1 Ciprofloxacin vs rifampicin | 1 | 60 | Risk Ratio (M‐H, Fixed, 95% CI) | 1.0 [0.07, 15.26] |
| 8.2 Ofloxacin vs ethambutol | 1 | 156 | Risk Ratio (M‐H, Fixed, 95% CI) | 1.30 [0.47, 3.57] |
| 8.3 Ciprofloxacin vs ethambutol plus pyrazinamide | 1 | 160 | Risk Ratio (M‐H, Fixed, 95% CI) | 0.98 [0.20, 4.69] |
| 8.4 Ofloxacin vs rifampicin | 1 | 31 | Risk Ratio (M‐H, Fixed, 95% CI) | 0.10 [0.01, 1.79] |
| 8.5 Moxifloxacin vs ethambutol | 1 | 336 | Risk Ratio (M‐H, Fixed, 95% CI) | 1.24 [0.50, 3.05] |
| 9 Total number of adverse events Show forest plot | 4 | 712 | Risk Ratio (M‐H, Fixed, 95% CI) | 1.17 [0.96, 1.43] |
|
| 9.1 Ciprofloxacin vs rifampicin | 1 | 60 | Risk Ratio (M‐H, Fixed, 95% CI) | 1.0 [0.22, 4.56] |
| 9.2 Ciprofloxacin vs ethambutol plus pyrazinamide | 1 | 160 | Risk Ratio (M‐H, Fixed, 95% CI) | 0.87 [0.60, 1.24] |
| 9.3 Ofloxacin vs ethambutol | 1 | 156 | Risk Ratio (M‐H, Fixed, 95% CI) | 1.95 [0.70, 5.44] |
| 9.4 Moxifloxacin vs ethambutol | 1 | 336 | Risk Ratio (M‐H, Fixed, 95% CI) | 1.29 [1.00, 1.66] |
| 10 Total number of adverse events, substitutions for ethambutol Show forest plot | 2 | 492 | Risk Ratio (M‐H, Fixed, 95% CI) | 1.34 [1.05, 1.72] |
|