Dodatak testosterona na hormonsku terapiju žena u menopauzi
Abstract
Background
The question of whether adding testosterone therapy to conventional postmenopausal hormone therapy (HT) is effective or safe is unresolved. Therefore, we aimed to determine the efficacy and safety of testosterone therapy for postmenopausal women using HT.
Objectives
To determine the benefits and risks of testosterone therapy for postmenopausal women taking HT.
Search methods
We searched the Cochrane Menstrual Disorders and Subfertility Group Trials Register (searched 21 July, November 2008), The Cochrane Library (2008, Issue 3), MEDLINE (1966 to July 2008), EMBASE (1980 to July 2008), Biological Abstracts (1969 to 2008), PsycINFO (1972 to July 2008), CINAHL (1982 to July 2008), and reference lists of articles. We also contacted pharmaceutical companies and researchers in the field.
Selection criteria
Studies included randomised comparisons of testosterone plus HT versus HT alone in peri or postmenopausal women.
Data collection and analysis
Two review authors independently assessed the quality of the trials and extracted data. For dichotomous outcomes, a Peto odds ratio (OR) and its 95% confidence interval (CI) were calculated. For continuous outcomes, non‐skewed data from valid scales were synthesized using a weighted mean difference or standardized mean difference. If statistical heterogeneity was found, a random‐effects model was used and reasons for the heterogeneity were explored and discussed.
Main results
Thirty‐five trials with a total of 4768 participants were included in the review. The median study duration was six months (range 1.5 to 24 months). Most of the trials were of adequate quality with regard to randomisation and concealment of allocation sequence. The major methodological limitations were attrition bias and lack of a washout period in the crossover studies. The pooled estimate suggested that the addition of testosterone to HT regimens improved sexual function scores and number of satisfying sexual episodes for postmenopausal women. Significant adverse effects were decreased high‐density lipoprotein (HDL) cholesterol levels and an increased incidence of hair growth and acne. The discontinuation rate was not significantly greater with the addition of testosterone therapy (OR 0.99, 95% CI 0.83 to 1.19).
Authors' conclusions
There is good evidence that adding testosterone to HT has a beneficial effect on sexual function in post‐menopausal women. However, the combined therapy is associated with a higher incidence of hair growth and acne and a reduction in HDL cholesterol. These adverse events may differ by the different doses and route of testosterone administration. There is insufficient evidence to determine the effect of testosterone in long term use.
Laički sažetak
Dodatak testosterona na hormonsku terapiju žena u menopauzi
Postoje valjani dokazi da dodavanje testosterona na hormonsku terapiju ima pozitivan učinak na seksualnu funkciju žena u menopauzi. Ipak, kombinirana terapija je povezana s većom incidencijom rasta kose i dlaka, nastajanju akni i smanjenju lipoproteina visoke gustoće (HDL). Ove nuspojave mogu varirati ovisno o različitim dozama i načinima uzimanja testosterona. Dodavanjem testosterona na hormonsku terapiju nije se povećao broj žena koje su zaustavile primjenu te terapije.
Authors' conclusions
Background
Description of the condition
The role of testosterone in women
Biological data support important physiological effects of testosterone in women. Testosterone acts directly via androgen receptors throughout the body, including in areas such as the brain, particularly the hypothalamus and amygdala; and at peripheral sites including bone, breast, skin, skeletal muscle, and adipose, vascular, and genital tissues (Davis 1995). The effects of testosterone are also mediated by aromatization to oestrogens as androgens are the essential precursor hormones for oestrogen biosynthesis in the ovaries and extra‐gonadal tissues (Simpson 2000). Imbalance in androgen biosynthesis or metabolism in women may have undesirable effects on any or all of these systems. Exogenous testosterone may influence sexual desire, bone mineral density, muscle mass, adipose tissue distribution, mood, energy, and psychological well being (Burger 1984; Burger 1987; Davis 1995; Sherwin 1988; Sherwin 1988). Recognised causes of low testosterone production include hypopituitarism, adrenal insufficiency, premature ovarian failure, bilateral oophorectomy, oral glucocorticosteroid therapy, and oral oestrogen therapy (Davis 1995; Bachmann 2002; Burger 2002).
Effects of menopause on testosterone levels
Most studies addressing the changes in androgen levels with age have been limited by: the inclusion of small numbers of women with limited age ranges (Labrie 1997; Zumoff 1995), reproductive status (Pfeilschifter 1996; Randolph 2003), insensitivity of assays for the measurement of total and free testosterone levels in the female range (Burger 2000) and, for blood sampling, failure to take into account the cyclical variations in androgen levels (Overlie 1999; Rannevik 1995). In the late reproductive years there is a loss of the midcycle rise in free testosterone that characterizes the menstrual cycle in young ovulating women (Mushayandebvu 1996). To establish whether testosterone levels decline during the menopause transition, it is necessary to measure testosterone at times other than during the early follicular phase nadir that is evident in premenopausal women. A large cross‐sectional study of 1423 women aged 18 to 75 years, randomly recruited from the community, and not seeking health care was undertaken to document androgen levels by decade of age (Davison 2005). Total testosterone was measured by a direct, manual radioimmunoassay method which is a clinically useful assay for the study of the 'low' testosterone levels within the female population. Free testosterone was calculated using the Sodergard equation (Sodergard 1982). This free testosterone estimate has been demonstrated to have a strong correlation with levels measured by equilibrium dialysis, which is generally considered the most accurate method of measuring free testosterone. The results of the study showed a decline in total and free testosterone, dehydroepiandrosterone sulphate (DHEAS), and androstenedione with age, commencing in the mid 30s (Davison 2005). An effect of natural menopause on circulating androgen levels was not found, which contrasts with the sharp decline in estradiol that occurs at this time (Davison 2005). These findings provide suggestive data that testosterone levels do not change across the menopause transition. In the same study postmenopausal oophorectomised women had lower total and free testosterone levels than non‐oophorectomised women, suggesting that the postmenopausal ovary remains a source of testosterone production.
Proposed female androgen insufficiency syndrome
It has been proposed that insufficient testosterone production in women may result in lowered sexual desire and arousal, and diminished well being (Bachmann 2002). However, there are no substantial data to support this hypothesis and no 'cut‐off' level of testosterone has been demonstrated as a diagnostic indicator of female androgen insufficiency. In contrast, in women younger than 45 years low domain scores for desire, arousal, and responsiveness were associated with higher odds of having DHEAS levels in the lowest 10th centile. In women over 45 years of age a low domain score for responsiveness was associated with higher odds of having DHEAS levels in the lowest 10th centile (Davis 2003). The concept of female androgen insufficiency is primarily supported by results from therapeutic trials. However, demonstration of the clinical efficacy of testosterone therapy is only surrogate evidence for a female androgen insufficiency syndrome, which still remains to be appropriately researched.
Description of the intervention
Testosterone therapy for postmenopausal women
Results from several randomised controlled trials suggest that testosterone therapy has additional benefits for the health of postmenopausal women when compared with the use of HT alone. Proposed benefits include effects on sexual function, mood, bone density, and increased lean body mass (Burger 1984; Burger 1987; Davis 1995; Sherwin 1987a; Shifren 2000). These studies have not been systematically reviewed. Based on clinical data, potential risks of testosterone therapy include acne, excess facial and body hair, deepening of the voice, weight gain, emotional changes, and adverse effects on lipid profiles (Bachmann 2002). Lower high‐density lipoprotein (HDL) cholesterol, increased hematocrit, and abnormal liver function tests have been reported with higher doses of oral methyltestosterone (Bachmann 2002). Cases of hepatotoxicity were associated with oral administration of methyltestosterone in men treated with dosages of 10 to 100 mg/day (Foss 1959). The incidence of toxic hepatitis in a study that involved 572,794 women who were exposed to oral esterified oestrogen plus methyltestosterone was 3 per 100,000 person‐years (Ettinger 1998). The long‐term effects of testosterone on breast and other cancers, cardiovascular disease, and stroke is unknown. As androgens are converted to oestrogens in vivo oestrogenic side effects are also potential consequences of androgen therapy, such as effects on the breast and endometrium.
How the intervention might work
Mechanism of action of testosterone
Testosterone may act in a variety of ways in the different tissues but this is an area that requires further investigation. Primarily the testosterone action is likely to be directly via the androgen receptor (AR). However, testosterone is an important precursor for oestradiol production in target tissues. Thus the testosterone action may be as a consequence of conversion to oestradiol and then genomically via alpha or beta oestrogen receptors (ER), or non‐genomically via other oestrogenic mechanisms. Grohe et al reported a series of elegant experiments in which they demonstrated local oestrogen biosynthesis from testosterone in cardiac myocytes and the subsequent activation of ER alpha and beta and downstream target genes, in a gender‐based fashion. In a mechanistic randomised controlled trial of oestrogen replete postmenopausal women, aromatase inhibition did not alter the effects of testosterone therapy on improved sexual function, mood, and well being. Testosterone levels were restored to within the normal premenopausal range.
Why it is important to do this review
In our first version of this Cochrane review, a meta‐analysis of two (and for some outcomes three) fair quality, randomised, controlled trials (Figure 1) comparing hormone therapy (HT) alone and with testosterone (T+HT) indicated that the latter improved libido by 0.42 points (95% CI 0.18 to 0.66), the mean composite score for sexual function by 0.41 points (95% CI 0.15 to 0.67), and the mean score for sexual activity by 1.00 point (95% CI 0.4 to 1.58). Thus, the evidence supported the beneficial effect of testosterone therapy on sexual health among postmenopausal women. A decrease in HDL cholesterol levels was a significant adverse effect. The discontinuation rate was not significantly greater with testosterone therapy than with HT alone. There was insufficient evidence of a treatment effect for other outcomes.
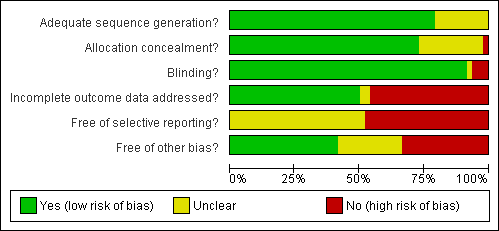
Methodological quality graph: review authors' judgements about each methodological quality item presented as percentages across all included studies.
For the Cochrane Review the results from this small number of studies were pooled so that the power of the meta‐analysis to provide conclusions about efficacy and safety was limited. In addition, the meta‐analysis combined studies using different testosterone regimens. It was thus difficult to estimate the effect of testosterone on sexual function in association with any individual HT formulation. Moreover, the subgroup analysis according to type of menopause, natural versus surgical, was not performed due to the limited number of studies. Therefore, it was uncertain as to whether the benefits and risks would differ according to type of menopause.
Since the cut‐off date for publications in the initial Cochrane review, several clinical trials of testosterone therapy in postmenopausal women have been published (Braunstein 2005; Buster 2005; Chiuve 2004; Davis 2006; Floter 2002b;Floter 2004Floter 2005; Leao 2006; Matthews 2005; Nathrost‐Boos 2006;Nathorst‐Böös 2005; Shifren 2006; Simon 2005; Warnock 2005; Zang 2006). Inclusion of these recent trials in this review increases the power of the meta‐analyses to provide precise conclusions about efficacy and safety and so provide valuable evidence for clinical practice.
Objectives
To determine the benefits and risks of testosterone therapy for peri and postmenopausal women taking HT.
Methods
Criteria for considering studies for this review
Types of studies
Only randomised controlled trials (RCTs) were considered for inclusion in the review. We excluded quasi‐randomised controlled trials.
Types of participants
Study participants included perimenopausal women and women who had either a natural or surgically‐induced menopause, regardless of ethnicity and duration of HT before randomisation.
Diagnostic criteria were as follows.
1) A naturally menopausal woman was defined as:
-
a woman with an intact uterus who had had spontaneous amenorrhoea for at least 12 months, with a low serum oestradiol level or an elevated serum level of follicle stimulating hormone (FSH) in the postmenopausal range, or both;
-
a woman who had had a hysterectomy and who had one or both ovaries conserved at hysterectomy with a low serum oestradiol level or an elevated serum level of FSH in the postmenopausal range, or both.
2) A surgically menopausal woman was defined as a woman who had undergone a bilateral oophorectomy.
3) A perimenopausal woman was defined as a woman who had experienced any symptom of approaching menopause and had an elevated serum level of FSH in the postmenopausal range and the final menstrual period was in a period less than 12 months prior to participating in the study.
We included all studies irrespective of prerequisite signs and symptoms of menopause before randomisation.
Types of interventions
Testosterone plus HT in all formulations versus HT alone in peri or postmenopausal women.
HT was defined as unopposed oestrogen therapy or oestrogen therapy with combined cyclic or continuous progestin therapy.
Studies that combined those interventions with other complementary therapies, such as vitamin or mineral supplements, diet, or exercise were considered for inclusion. The minimum period of acceptable treatment was four weeks.
Types of outcome measures
The following outcomes were recorded, if the information was available.
1. Major outcomes:
1.1 sense of well being, measured and scored by validated questionnaires for example the psychological general well‐being index (PGWB);
1.2 unexplained fatigue, measured and scored by validated questionnaires;
1.3 sexual function, measured and scored by validated questionnaires in all aspects including libido, activity, satisfaction, pleasure, fantasy, and orgasm.
2. Minor outcomes.
2.1. Benefits:
2.1.1. bone health,
2.1.1.1. incidence of osteoporotic fracture,
2.1.1.2. bone mineral density;
2.1.2. body composition, measured in various aspects including body weight, body mass index, hip and waist circumferences;
2.1.3. cognition measured and scored by validated questionnaires;
2.1.4. menopausal symptoms measured and scored by validated questionnaires in the dimensions of psychological, somatic, vasomotor symptoms, and urogenital symptoms.
2.2. Adverse events:
2.2.1. increased facial and body hair growth, measured and scored by validated scales;
2.2.2. acne, measured and scored by known scales;
2.2.3. mood change, specifically aggression as measured and scored by validated questionnaires;
2.2.4. breast cancer,
2.2.4.1. mammographic findings,
2.2.4.2. incidence of breast cancer;
2.2.5. coronary heart disease, defined as acute myocardial infarction and silent myocardial infarction;
2.2.6. discontinuation rate;
2.2.7. lipid profile, measured as total cholesterol, HDL cholesterol, low‐density lipoprotein (LDL) cholesterol, and triglycerides;
2.2.8. coagulation parameters.
Search methods for identification of studies
The search strategy of the Menstrual Disorders and Subfertility Group (MDSG) (see Review Group details for more information) was used for the identification of randomised controlled trials (RCTs). All trials conducted from 1966 onwards were examined for eligibility regardless of language.
1) The MDSG Trials Register was searched for any trials using a combination of terms (menopause, post menopause, testosterone, androgens, and oestrogen) present in the title, abstract, or keywords section. See the Review Group for more details on the make‐up of the Specialised Register.
2) The following electronic databases were searched using Ovid software:
MEDLINE (1966 to 21st July 2008);
EMBASE (1980 to 21st July 2008);
Bio Abstracts (1980 to 21st July 2008);
CINAHL (1982 to 21st July 2008);
PsycINFO (1974 to 21st July 2008).
See Appendix 1; Appendix 2; Appendix 3; Appendix 4.
3) The MetaRegister of Controlled Trials (mRCT), which contains a number of databases of recent or ongoing trials, was searched for any trials with the following words: postmenopause, androgen, testosterone, oestrogen. This meta‐database includes the National Research Register (NRR), entries from the Medical Research Council's Clinical Trials Register, and details on reviews in progress collected by the NHS Centre for Reviews and Dissemination.
4) Additional unpublished trials were identified from citation lists of relevant articles, communication with the corresponding authors of relevant articles, experts, and pharmaceutical companies.
5) The MDSG Specialised Register also included results from handsearching the following relevant journals for RCTs. We searched for any trials on androgen or testosterone that involved peri and postmenopausal women in:
Acta Europaea Fertilitatis (1969 to 1989 infertility RCTs only, 1990 on);
American Journal of Reproductive Immunology and Microbiology (1980 to 1990);
Andrologia (1980 to 1990 searched for infertility RCTs only, 1991 on);
Archives of Andrology (1978 to 1992 searched for infertility RCTs only, 1993 on);
Climacteric (1998 on);
Epidemiology (1990 to 1995);
Fertility and Sterility (1950 on);
Gynecological Endocrinology (1987 on);
Gynaecological Endoscopy (1991 on);
Human Reproduction (1986 on);
International Journal of Andrology (1978 to 1992 searched for infertility RCTs only, 1993 on);
International Journal of Fertility and Women's Medicine (previously International Journal of Fertility Menopausal Studies and International Journal of Fertility) 1968 ‐ ongoing
Journal of Andrology (1980 to 1990 searched for infertility RCTs only, 1991 on);
Journal of Assisted Reproduction and Genetics (formerly Journal of In Vitro Fertility and Embryo Transfer, 1984 to 1991), 1984 to 1992 searched for infertility RCTs only, 1993 on);
Journal of Reproduction and Fertility (1966 to 1990 searched for infertility RCTs only, 1992 on);
Maturitas (1978 on);
Molecular Reproduction and Development (Formerly Gamete Research, 1978 to 1990) (1978 to 1992 infertility RCTs only, 1993 on);
Pediatric Perinatal Epidemiology (1987 to 1995);
Reproduction, Fertility, and Development (Clinical Reproduction and Fertility, 1982 to 1990) (1982 to 1993 searched for infertility RCTs only, 1982 on).
Data collection and analysis
1) Study selection
Selection of trials was performed by one of the review authors (WS) after employing the search strategy described above. WS obtained copies of the full text articles and made copies in which details of the authors and institutions had been struck out and the results section removed for RB. Each study identified by the search strategy was independently assessed against the inclusion criteria by two of the review authors (RB and WS). If necessary, SD sought additional information from the principal investigators of the study. If there was any study that did not contain enough detail to be examined, that study was listed in the awaiting assessment section of the review.
2) Assessment of methodological quality
Included trials were independently assessed by two of the review authors (RB and WS) for the following quality criteria and methodological details, using the standard checklist developed by the MDSG. Any disagreement in eligibility or quality assessment was discussed in detail. Major quality criteria were established to enable future sensitivity analyses.
Trial characteristics
1. Internal validity
1.1. Was the assigned treatment adequately concealed prior to allocation (scored according to the categories used by The Cochrane Collaboration)?
A. Adequate
B. Unclear
C. Inadequate
D. Not used
1.2. Were the outcomes of participants who withdrew or were excluded after allocation described and included in an intention‐to‐treat analysis?
A. Intention‐to‐treat
B. No intention‐to‐treat
C. Unclear
1.3. Were the outcome assessors blind to assignment status?
A. Yes
B. No
C. Unclear
1.4. Were the treatment and control groups comparable at entry?
A. Yes
B. No
C. Unclear
1.5. Were the participants blind to assignment status following allocation?
A. Yes
B. No
C. Unclear
1.6. Were the treatment providers blind to assignment status?
A. Yes
B. No
C. Unclear
1.7. Were the care programs, other than the trial options, identical?
A. Yes
B. No
C. Unclear
1.8. Were the withdrawals < 10% of the study population
A. Losses and withdrawals of less than 10%
B. Losses and withdrawals of 10% or more
C. Not reported or unclear
1.9. Method of randomisation
A. Truly randomised: centralised randomization scheme or on‐site computer system with concealment of allocation or sequentially numbered, sealed opaque envelopes.
B. Pseudo randomised: alternating record numbers or dates of birth, or open list of random numbers or open envelopes or tables.
C. Not stated
2. External Validity
2.1. Were the inclusion and exclusion criteria for entry clearly defined?
A. Yes
B. No
C. Unclear
2.2. Were the outcome measures used clearly defined?
A. Yes
B. No
C. Unclear
2.3. Were the accuracy, precision, and observer variation of the outcome measures adequate?
A. Yes
B. No
C. Unclear
2.4. Was the timing of the outcome measures appropriate?
A. Yes
B. No
C. Unclear
2.5. Was a power calculation done?
2.6. Source of funding, if stated
This information was presented in the table 'Characteristics of included studies' and provided a context for discussing the reliability of the results.
3) Data collection
WS then provided RB with the results sections of the included studies and both review authors independently extracted information using the pro forma's designed by the Review Group. Discrepancies were resolved by discussion and a third review author (SD), if necessary. For each included trial, information was collected regarding the location of the study, methods of the study (as per the quality assessment checklist), the participants (age range, eligibility criteria), the nature of the interventions, and data relating to the outcomes, as follows.
Characteristics of the study participants
1. Age and menopausal status
2. Criteria for confirming menopausal status
3. Natural versus surgically induced menopause
4. The location of the study, and source of recruitment of participants
5. Ethnicity
6. Inclusion criteria
7. Exclusion criteria
8. Baseline quality of treatment groups
A. Groups balanced in terms of age and other variables(dependent on outcome of interest), e.g. baseline sexual function score, well‐being score, bone mineral density, lipid profile, body composition, menopausal symptoms, cognition, and hormonal profile
B. Groups not balanced
C. Balance not reported
Intervention used
1. Types of therapies used
2. Mode of administration
3. Doses administered
4. Duration of treatment
Outcomes relevant to this analysis were as follows.
Benefits: sense of well being, improvement of unexplained fatigue, sexual functioning, bone health, body composition, cognition, and menopausal symptoms.
Risks: hirsutism, acne, mood alteration, breast cancer, coronary heart disease, haematocrit, lipid profile, coagulation profile, and discontinuation rate.
Where possible, missing data were sought from the authors by SD.
4) Analysis
Statistical analysis was performed in accordance with the guidelines for statistical analysis developed by the Menstrual Disorders and Subfertility Group. Heterogeneity (variation) between the results of different studies was examined by inspecting the scatter in the data points on the graphs and the overlap in their confidence intervals and, more formally, by checking the results of the chi square tests. Where possible, the outcomes were pooled statistically.
The following outcomes were presented as follows, if the information was available.
1. Primary outcomes
1.1. Sense of well being (as the percentage of women who improved or did not improve, mean or median of per cent change)
1.2. Unexplained fatigue (as the percentage of women who improved or did not improve, mean or median of per cent change)
1.3. Sexual function (as percentage of women who improved or did not improve, mean or median of per cent change)
2. Secondary outcomes
2.1. Benefits
2.1.1. bone health:
2.1.1.1. incidence of osteoporotic fracture (the number of osteoporotic fractures per year in each treatment group),
2.1.1.2. biochemical markers (as the percentage of women for whom there was an increase, no change, or a decrease in each marker; mean or median of per cent change in each marker),
2.1.1.3. bone mineral density (as percentage of women for whom there was an increase, no change, or decrease at each site (femur, lumbar spines, wrist); mean or median of per cent change at each site);
2.1.2. body composition (percentage of women for whom there was an increase, no change, or decrease; mean or median of percentage change in each value);
2.1.3. cognition (percentage of women who improved or did not improve; mean or median of percentage change);
2.1.4. menopausal symptoms (percentage of women who improved or did not improve; mean or median of percentage change).
2.2. Adverse events:
2.2.1. increased facial and body hair growth (percentage of women who did or did not have a change in score or who reported this side effect);
2.2.2. acne (percentage of women who have or do not have the side effect);
2.2.3. mood alteration, specifically aggression (percentage of women who experienced an increase, no change, or decrease);
2.2.4. breast cancer,
2.2.4.1. breast cell proliferation (percentage of women with decreased, stable, or increased breast cell proliferation),
2.2.4.2. mammographic finding (percentage of women with decreased, stable, or increased mammographic density or difference in mean dense area),
2.2.4.3. incidence of breast cancer (as percentage of women who did or did not develop breast cancer);
2.2.5. coronary heart disease (as the number of events per year);
2.2.6. discontinuation rate (percentage of women who discontinued treatment);
2.2.7. haematocrit (percentage of women for whom there was an increase, no change, or decrease; mean or median of percentage change);
2.2.8. lipid profile (percentage of women for whom there was an increase, no change, or decrease; mean or median of per cent change in each value);
2.2.9. coagulation profile (mean or median of percentage change).
The criteria for improvement in the particular outcomes were as defined by the trialist's.
For dichotomous data, results for each study were expressed as an odds ratio (OR) with 95% confidence intervals (95% CI) and combined for meta‐analysis with RevMan software using the Peto method and a fixed‐effect model.
For continuous data, results from each study were expressed as a weighted mean difference (WMD) with 95% CI and combined for meta‐analysis. The fixed‐effect model was used to calculate a simple weighted average of the study results. However if there was statistical heterogeneity (the test for heterogeneity results in a P‐value of 0.05 or less), the random‐effects model was used and reasons for the heterogeneity were explored and discussed. However, standardized mean differences were used if it was necessary to summarize results across studies with continuous data outcomes that were conceptually the same but were measured in different ways. Meta‐analytic methods for continuous data assumed that the underlying distribution of the measurements was normal. Where data were skewed and results were reported in the publication as median and range using non‐parametric tests of significance, the results were also reported in the 'Other data' section of the review (Table 1).
| Outcome | Study ID | N | Reason | Conclusion |
| Acne | 291 | The data was not available | Acne of mild or moderate severity was reported by 5 (3%) estrogen‐testosterone treated participants, whereas no participants receiving oestrogen reported acne | |
| Biochemical Markers of bone metabolism | 50 | A crossover study with no washout period | Both treatments had similar effects, with a significant decrease in bone resorption (ICTP) and bone turnover (osteocalcin) after 24 weeks. | |
| Biochemical markers of bone metabolism | 57 | The data was likely to be skewed because the means were smaller than twice the SDs | There were no between group differences noted in baseline Dpd levels(p=0.111), Dpd% change (P=0.338), baseline NTx levels (P=0.112), or NTx % change (P=0.271) | |
| Biochemical markers of bone metabolism | 28 | The data was not available | The effects of oestrogen‐testosterone and oestrogen alone on markers of bone resorption were generally similar. The increase in bone formation markers after oestrogen‐testosterone treatment was significantly different from the effect of oestrogen for all bone formation parameters. | |
| Bone mineral density of lumbar spine and femur | 199 | The data was not available | BMD increased in the estrogen‐testosterone(low dose) were comparable to those in the oestrogen(low dose) group, while the BMD changes at 24 months in the estrogen‐testosterone(high dose) group significantly exceeded those in oestrogen(high dose) group(P=0.014 for lumbar spine, BMD and P=0.009 for total hip BMD) | |
| Bone mineral density | 50 | A crossover study with no washout period. | No changes in BMD were noted in the total body, hip, or lumbar spine with either regimen | |
| Bone mineral density | 50 | The data was not available. | There was no significant differences in bone density at any of the sites measured between women receiving oestrogen alone and those receiving estrogen‐testosterone. No treated subjects had a significant bone loss(more than twice the measurement precision) at either spine or femoral neck at 1 year, but three in each treated group showed a small but non significant decrease at both sites | |
| Bone mineral density of L1‐L4, femur and forearm | 48 | The data was not available | The estrogen‐testosterone showed significant increases in spinal BMD at 12 and 24 months(P<0.01). The estrogen group demonstrated a non significant increase in spinal BMD. The difference between groups was not significant at 12 or 24 months. There were no significant changes in BMD from baseline in either group at the radius, femoral neck, Ward triangle, or greater trochanter | |
| Body composition | 40 | It was unclear with regard to the standard deviation (SD) of the data | ‐ When compared with oestrogen alone, estrogen‐testosterone treatment significantly increased lean body mass in the arms, legs, and trunk. Body fat percentage decreased significantly from baseline in the same arms, legs, and trunk in the oestrogen‐testosterone group but not the oestrogen alone group. When changes in arms, legs, and trunk in each participant were analysed simultaneously, the difference between treatments was significant for lean body mass(P=0.007) and percentage of fat tissue(P=0.077) | |
| Body composition | 50 | A crossover study with no washout period | There was no significant differences in total body fat, total lean body mass, trunk fat, and trunk lean mass between the two treatments | |
| Body composition | 37 | The data was likely to be skewed | When compared to HT alone, T‐HT treatment significantly increased visceral fat area (P = 0.009). However there was no significant difference in subcutaneous fat area between the two groups | |
| Cognition and psychological well being | 42 | A crossover study with no washout period | Switching Attention Test that mean reaction time in the switching condition was faster in the estrogen‐testosterone group than in the estrogen group(t=3.25, df=37, P<0.002, effect size = 0.53 SD). For other conditions of the same test, such as side condition and direction condition, they did not differ between two groups. | |
| Cognition | 49 | The data was not available | There was no comparative effects between oestrogen‐testosterone and oestrogen alone group. | |
| Cognition | 30 | The data was likely to be skewed | No significant interactions were found showing an advantage for oestrogen‐testosterone treated group as contrasted to oestrogen‐treated group | |
| Cognition (Cube Comparisons and Building Memory) | 26 | The data was likely to be skewed | Differences in task performance between women receiving E or E‐T treatment were assessed with a 2‐factor(treatment group x test session), mixed analysis of variance for each cognitive task. Post hoc comparisons were conducted using Tukey's method of multiple comparisons. With regard to Cube Comparisons, performance improved for both groups across test sessions, however this improvement only approached statistical significance (P=0.09). No other effects were significant. Regarding Building Memory, a main effect of test session was observed, with performance declining across sessions for both groups(P<0.01). A treatment x test session interaction was observed(P<0.05). Post hoc comparison revealed that this effect was due to a decrease in the E group(P<0.05) but not The E‐T group(P>0.1) across sessions. | |
| Hematocrit | 199 | The data was not available. | There was no clinically significant difference in haematology | |
| Hematocrit | 50 | A cross‐over study with no washout period | They reported that there was no change in blood counts during the study | |
| Hematocrit | 26 | The data was not available. | ‐ At 6 months, statistically significant between‐group differences were seen for hematocrit. The difference was small in magnitude, remained within the normal ranges, and was not considered clinically significant. | |
| Hematocrit | 67 | A cross‐over study with no washout period | Transdermal testosterone treatment had no significant effects on blood counts | |
| Hematocrit | 48 | The data were not available | No clinically significant changes in hematologic indices | |
| Hirsutism | 199 | The data was not available | Changes in hair growth in the oestrogen‐testosterone(low dose) group were similar to those in the oestrogen(low dose) group, and there were no statistically significant differences in the hirsutism scores between the treatment groups. In the high‐dose groups only four participants treated with oestrogen‐testosterone and two treated with oestrogen reported hirsutism as an adverse event at month 12. At 24 months, 10 oestrogen‐testosterone‐treated and 3 oestrogen‐treated participants reported hirsutism as an adverse event | |
| Hirsutism and acne | 50 | A crossover study with no washout period | Incidences of hirsutism and acne were similar in two treatment groups | |
| Hirsutism and acne | 67 | A crossover study with no washout period | The hirsutism and acne scores did not change significantly during treatment. The mean facial depilation rate increased slightly during treatment with estrogen‐testosterone 300 microgram | |
| Lipid profile | 40 | The data was not available. | After 16 weeks of treatment, significant decreases in total cholesterol, HDL, and triglycerides occurred in the estrogen‐testosterone group. LDL values were virtually unchanged. The oestrogen group demonstrated the opposite effect on lipids, with a significant decrease in LDL and no meaningful change in the other lipid parameters | |
| Lipid profile | 50 | A crossover study with no washout period | Serum levels of total testosterone increased markedly from a baseline mean of 0.8–4.9 mmol/l during testosterone addition. Total and LDL‐cholesterol levels were significantly reduced by both treatments as also were those of Lp‐(a) although the difference was not significant. A 13% reduction in HDL‐cholesterol levels was found when testosterone was added, but no change with oestrogen alone. Triglyceride levels were increased by oestrogen treatment, but not affected by the combination of oestrogen plus testosterone | |
| Lipid profile | 56 | The data was not available | There were significant reductions in total cholesterol and LDL cholesterol in all groups. In estrogen‐testosterone‐treated group triglyceride levels increased 26.0% and HDL cholesterol levels decreased 9.0%. In contrast, with oestrogen therapy triglyceride levels decreased 9.0% and HDL cholesterol levels increased 9.0% | |
| Lipid profile | 57 | The data was likely to be skewed because the means were smaller than twice the SDs | The study found significant reductions in total cholesterol and LDL cholesterol in all groups. Triglyceride levels increased 26.0% and HDL cholesterol levels decreased 9.0% in estrogen‐testosterone‐treated group. In contrast, with oestrogens therapy triglyceride levels decreased 9.0% and HDL cholesterol levels increased 9.0% | |
| Lipid profile | 60 | A crossover study with no washout period | Total cholesterol, triglycerides, HDL and LDL revealed no significant differences between any of the periods or groups | |
| Menopausal symptoms, sense of well being and sexual function | 199 | The data were not available | Women in all treatment groups reported an improvement in menopausal symptoms and quality of life measures at 24 months. There was a non significant trend toward greater improvement in well being and sexual interest and higher scores on the modified menopausal rating scale in the oestrogen‐testosterone groups | |
| Menopausal symptoms and sexual function | 40 | The data were non‐normal distribution | There were no significant differences between treatments on any variable at either 2 months or 6 months after treatment | |
| Menopausal symptoms | 26 | The data were non‐normal distribution | There was no statistically significant difference between two treatments in menopausal symptoms | |
| Menopausal symptoms | 51 | The data were not available | Vasomotor symptoms were reduced by at least 75% after treatment in all groups | |
| Menopausal symptoms | 28 | The data was likely to be skewed | Both treatments significantly decreased somatic symptom scores, but only estrogen‐testosterone treatment provided significant relief of psychosomatic and psychological symptoms | |
| Menopausal symptoms | 20 | The data was not available | There was no statistical difference between the estrogen‐testosterone groups versus the oestrogen group | |
| Menopausal symptoms | 49 | The data was not available | There was no result for the comparative effect on hot flushes between estrogen‐testosterone and oestrogen alone | |
| Menopausal symptoms | 43 | The data were not available | Menopausal index: | |
| Menopausal symptoms | 92 | The data was not available | In general, estrogen‐testosterone therapy provided greater relief from these symptoms than oestrogen therapy. This was most apparent in the finding that the degree of vasomotor symptom relief with low dose estrogen‐testosterone preparation was similar to relief experienced with higher dose estrogen therapy alone. | |
| Menopausal symptoms | 66 | The data were not available | There were no significant differences in somatic symptoms between the oestrogen and estrogen‐testosterone groups at baseline or after treatment. Psychosomatic and psychologic symptom values are not presented because of the small number of evaluable symptomatic participants | |
| Mood (hostility) | 36 | The data were not available | Hostility scores did not differ significantly in the two groups (testosterone‐oestrogen or oestrogen alone) | |
| Sense of well being | 40 | The data were not available. | With regard to QUALMS questionnaire, the oestrogen‐testosterone group showed significant improvement from baseline in somatic symptoms(week 10, P=0.003; week 16, P=0.073). The oestrogen group showed significant improvement from baseline in well being (week 16, P= 0.049) and cognition (week 10, P=0.054) | |
| Sense of well being | 50 | A crossover study with no washout period | There were no significant differences between the treatments in any of the sub scores or total PGWB index | |
| Sense of well being | 84 | The data were likely to be skewed | There was no difference in SRD 30 scores between the two active treatment groups at either 2 or 4 months | |
| Sense of well being | 40 | The data were not available. | No conclusion on psycho‐physical well being. | |
| Sense of well being | 35 | A cross‐over study with no washout period | No significant effects of adding testosterone into hormone therapy | |
| Sense of well being | 43 | The data was not available. | Anxiety: There was no differences among any of the groups across time. | |
| Sense of well being | 65 | A crossover study with no washout period | Adding 300 microgram patch into oral oestrogen has a significant improvement in general well being by means of PGWB (P=0.04). There also were significant increases with oestrogen‐testosterone 300 microgram treatment for sub scales of positive well being and depressed mood. | |
| Sexual function | 20 | The data was not available. | After six weeks the loss of libido in the single implant group remained, while the combined group showed significant symptomatic relief(P<0.01). Eight in the single implant group chose to have a testosterone implant at the first follow up visit at 6 weeks; the other two stopped coming because of dissatisfaction with the treatment | |
| Sexual function | 40 | The data was not available. | The sample size was not powered, nor was entry criteria designed to assess sexual dysfunction parameters; however, there were significant results. In the oestrogen‐testosterone group, BISF‐W mean increases at each visit were statistically significant for frequency/psychosexual(P=0.05) and pleasure/orgasm(P=0.041) domains. The mean composite BISF‐W score increased in the oestrogen‐testosterone group, whereas the mean score in the estrogen group decreased. Although it appeared that the two treatment groups were not well balanced at baseline(the estrogen group seemed to have healthier sexual function at baseline than the estrogen‐testosterone group), the estrogen‐testosterone group showed significant improvement in sexual function compared with the estrogen group. | |
| Sexual function (total McCoy score) | 44 | A crossover study with no washout period | After 24 weeks of treatment, the addition of testosterone had a significantly better effect on the variables 'enjoyment of sex', 'satisfaction with frequency of sexual activity' and 'interest in sex'. The total McCoy score was significantly increased by both treatments, but the addition of testosterone exerted a stronger effect (P<0.05) | |
| Sexual function | 51 | The data was not available | Improvement (P<0.05) in sexual interest, sexual satisfaction, frequency of sexual intercourse and intensity and frequency of orgasm during sexual intercourse were reported in all groups except the estrogen alone group | |
| Sexual function | 60 | A cross‐over study with no washout period | The scores concerning frequency of sexual activity, orgasm and intercourse, sexual arousal, fantasies and enjoyment, satisfaction with orgasms, and interest in sex were all significantly improved for testosterone addition as compared to placebo both before and after crossover | |
| Sexual function(desire and satisfaction) | 33 | The data was not available | No difference between two groups was observed at any of the considered time points. | |
| Sexual function | 30 | The data was likely to be skewed | Oestrogen‐testosterone‐treated participants reported significantly less lack of sexual desire or interest to engage in sexual activity, compared to participants receiving oestrogen alone | |
| Sexual function | 43 | The data was not available | Women who received either of the androgen‐containing preparations had significantly higher scores than women in the estrogen and placebo groups(P<0.01) in association with their higher levels of plasma testosterone. Women in the estrogen‐testosterone and testosterone‐only group experienced a greater number of fantasies during every treatment than did women in the oestrogen and placebo group (P<0.01). During treatment phases, both androgen groups attained higher levels of sexual arousal than did the estrogen and placebo groups(P<0.01) | |
| Sexual function (scores) | 65 | A cross‐over study with no washout period | The mean composite score expressed as a percentage of the mean value for normal women, increased from 52(27) percent at baseline to 72(38) percent during estrogen treatment, 74(37) percent during treatment with estrogen plus 150 microgram of testosterone per day, and 81(37) percent during treatment with estrogen plus 300 microgram of testosterone per day(P=0.05 for the comparison with estrogen‐alone). The scores for thoughts‐desire, frequency of sexual activity, and pleasure‐orgasm were lowest at baseline and increased in a dose‐dependent fashion. With the estrogen plus testosterone 300 microgram, the increases in scores for frequency of sexual activity and pleasure‐orgasm were significantly greater than those with estrogen‐alone (P=0.03 for both comparisons). The score for problems affecting sexual function was 116%(48) of the normative mean at baseline and decreased to 98%(49) during treatment with estrogen plus 300 microgram of testosterone(P=0.07 for the comparison with oestrogen‐alone) | |
| Sexual function (the prevalence of particular types of sexual behavior) | 65 | A crossover study with no washout period | The percentage of women who reported having sexual fantasies at least once a week was 12% at baseline, 10% during oestrogen treatment, 18 percent during estrogen plus testosterone 150 microgram, and 24% during treatment with estrogen plus 300 microgram of testosterone. The percentage of women who reported masturbating at least once a week was 3%, 5% and 10% at baseline, estrogen treatment and estrogen plus testosterone treatment, respectively. Finally, the percentage of women who engaged in sexual intercourse at least once a week was 23% at baseline, 35% during treatment with either oestrogen‐alone or oestrogen plus 150 microgram of testosterone, and 41% during treatment with oestrogen plus 300 microgram of testosterone | |
| Unexplained fatigue (vitality) | 50 | A crossover study with no washout period | There was no significant difference between the treatments in vitality | |
| Unexplained fatigue (vitality) | 67 | A crossover study with no washout period | Vitality improved in women treated with testosterone patch combined with oral conjugated equine oestrogen | |
| Unexplained fatigue and sense of well being | 43 | The data was not available | Women in estrogen alone and placebo groups reported significantly lower ratings of energy level and well being than did those who received either of the androgen‐containing preparations (P<0.01) |
Despite the lack of statistical heterogeneity, differences in clinical parameters were considerable (clinical heterogeneity). These differences were taken into account when analysing and interpreting the pooled results.
Sensitivity analysis was performed to look at the possible contribution of unpublished studies (if there were any), differences in methodological quality of trials, very large studies, length of the treatment follow‐up period, and different dosages. We suspected results might differ significantly between groups in these sensitivity analyses, which were only performed if there were at least five trials in each group. With event rate data, the analysis was repeated using the risk difference and relative risk.
Subgroup analyses were performed according to surgical or natural menopause; perimenopause and postmenopause; oral and non‐oral HT; methyltestosterone or testosterone; trial duration of less than three months or three to < six months, six to 12 months, or 12 months to 24 months; placebo‐controlled trials or non placebo‐controlled trials; and adequacy of symptom control.
Where there was an adequate number of studies, a funnel plot was drawn to examine the possibility of publication bias. The review will be updated every two years.
Results
Description of studies
1. Study inclusion
Ninety articles were assessed for inclusion in the review. Six of these did not contain sufficient information in their published format and were classified as awaiting assessment. We attempted to contact the authors in each case. Thirty‐six articles were excluded and 49 were included. Among the 49 included references, there were 35 separate trials. The articles that were from the same trials were as follows: (1) Davis 1995 and Davis 2000b; (2) Dobs 2002, Basaria 2002, Nguyen 1999, and Wisniewski 2002; (3) Miller 2000, Luciano 1998a, and Luciano 1999; (4) Barrett‐Connor 1999 and Barrett‐Connor 1996; (5) Sherwin 1988, Sherwin 1984, Sherwin 1985a; Sherwin 1985b; Sherwin 1985c; (6) Floter 2002b, Floter 2004, Floter 2005; and (7) Hofling 2007a and Hofling 2007b. The results from different articles about the same trial were included in the review only if the different articles were reporting different outcomes.
Of the 36 excluded articles, the reasons for exclusion were: non randomization(13 studies), no HT group serving as a control group (10 studies), ineligible outcomes (9 studies), ineligible intervention (2 studies), and ineligible participants (2 studies).
2. Participants
For all the included trials there was a total of 4768 participants randomised. Five of 35 trials did not report the number of participants who completed the study (Chiuve 2004; Dow 1983; Garnett 1992; Hofling 2007; Regestein 2001; Watts 1995). Therefore, of 4445 randomised participants from the remaining 31 trials there were 3904 participants who completed the trials. Not all trials reported on all outcomes, and not all trials reported outcomes in a form suitable for inclusion in the meta‐analysis. Therefore, there were different numbers of trials and participants analysed for each outcome.
2.1 Setting
Twenty trials were hospital‐based or clinic‐based studies. In 11 trials recruitment was from the general community (Braunstein 2005; Buster 2005; Davis 2006; El‐Hage 2007; Floter 2002b; Matthews 2005; Nathrost‐Boos 2006; Regestein 2001; Shepanek 1999; Shifren 2006; Simon 2005; Zang 2006). The setting was not stated in five trials (Chiuve 2004; Hofling 2007; Leao 2006; Montgomery 1987; Warnock 2005).
2.2 Location
The trials were located in seven countries, specifically United States of America (16 trials) (Barrett‐Connor 1999; Chiuve 2004; Dobs 2002; Braunstein 2005; Hickok 1993; Lobo 2003; Matthews 2005; Miller 2000; Raisz 1996; Regestein 2001; Sarrel 1998; Shepanek 1999; Shifren 2000; Simon 1999; Warnock 2005; Watts 1995), United Kingdom (three trials) (Dow 1983; Farish 1984; Montgomery 1987), Australia (three trials) (Burger 1987; Davis 1995; El‐Hage 2007), Italy (one trial) (Penotti 2001), Canada (one trial) (Sherwin 1988), Sweden (four trials) (Floter 2002b; Hofling 2007; Nathrost‐Boos 2006; Zang 2006), and Brazil (three trials) (de Paula 2007; Leao 2006; Penteado 2008). Four trials were multinational studies (Buster 2005; Davis 2006; Shifren 2006; Simon 2005).
2.3 Ethnicity
There were 18 trials that specified ethnicity (Barrett‐Connor 1999; Buster 2005; de Paula 2007; Dobs 2002; El‐Hage 2007; Hickok 1993; Hofling 2007; Leao 2006; Lobo 2003; Matthews 2005; Penteado 2008; Sarrel 1998; Shepanek 1999; Shifren 2000; Shifren 2006; Simon 2005; Warnock 2005; Watts 1995). Of these trials the most common ethnicity was Caucasian.
2.4 Disease status
Disease status was classified by considering the participant characteristic requirements at enrolment. Three categories were created for this review: no symptom requirement, particular symptom requirement, and the prerequisite of impaired sexual function with low serum testosterone levels. The majority of the studies recruited only healthy postmenopausal women, regardless of symptoms (Barrett‐Connor 1999; Dobs 2002; Floter 2002b; Hickok 1993; Hofling 2007; Matthews 2005; Miller 2000; Leao 2006; Penotti 2001; Raisz 1996; Regestein 2001; Shepanek 1999; Sherwin 1988; Simon 1999; Watts 1995; Zang 2006). Ten trials enrolled postmenopausal women with a particular condition; such as having an indication for implant therapy (Davis 1995), menopausal symptoms despite being on standard HT (Farish 1984; Montgomery 1987), impaired sexual function (Burger 1987; Buster 2005; de Paula 2007; Dow 1983; El‐Hage 2007; Lobo 2003; Penteado 2008; Shifren 2006; Warnock 2005), dissatisfaction with HT alone (Sarrel 1998). Four studies included only postmenopausal women with low serum testosterone levels who had impaired sexual function (Braunstein 2005; Davis 2006; Chiuve 2004; Nathrost‐Boos 2006).
2.5 Type of menopause
Thirteen trials included both surgically and naturally menopausal women (Burger 1987; Davis 1995; Dobs 2002; Dow 1983; El‐Hage 2007; Leao 2006; Lobo 2003; Matthews 2005; Montgomery 1987; Raisz 1996; Regestein 2001; Sarrel 1998; Sherwin 1988). Thirteen trials included only surgically menopausal women (Barrett‐Connor 1999; Braunstein 2005; Buster 2005; Chiuve 2004; Davis 2006; Farish 1984; Floter 2002b; Shepanek 1999; Sherwin 1988; Shifren 2000; Simon 1999; Watts 1995; Warnock 2005), and eight trials were conducted in naturally menopausal women only (de Paula 2007; Hofling 2007; Nathrost‐Boos 2006; Penotti 2001; Penteado 2008; Shifren 2006; Simon 1999; Zang 2006). For one trial the type of menopause was unclear (Hickok 1993).
2.6 Menopausal status
Most trials included only postmenopausal women. Only three trials recruited both peri and postmenopausal women (Montgomery 1987; Sarrel 1998; Simon 1999).
3. Study design
3.1 Blinding and placebo
All of the trials were randomised clinical trials. Most trials were double‐blind, placebo‐controlled studies. There were three open randomised trials (Penotti 2001; Raisz 1996; Zang 2006) and three single‐blind trials (Burger 1987; Davis 1995; Dow 1983).
To ensure double blinding (participants and assessors), one trial used an identical form of medication (Miller 2000) where oestrogen and testosterone were combined in a tablet that was identical to the oestrogen tablet; 15 trials used placebo therapy (Braunstein 2005; Buster 2005; Davis 2006; de Paula 2007; El‐Hage 2007; Hofling 2007; Leao 2006; Matthews 2005; Nathrost‐Boos 2006; Penteado 2008; Sherwin 1988; Shifren 2000; Shifren 2006; Simon 2005; Warnock 2005); six trials used double‐dummy placebo tablets (Floter 2002b; Hickok 1993; Lobo 2003; Regestein 2001; Sarrel 1998; Watts 1995); and two used an independent doctor, who did not assess the outcome, to provide medication (Farish 1984; Montgomery 1987). Five trials did not report the blinding method (Barrett‐Connor 1999; Chiuve 2004; Dobs 2002; Shepanek 1999; Simon 1999).
3.2 Crossover studies
Seven trials were crossover studies (de Paula 2007; El‐Hage 2007; Floter 2002b; Nathrost‐Boos 2006; Regestein 2001; Sherwin 1988; Shifren 2000). The principal problem with this kind of study is an effect or carry over after the treatment crossover. Therefore, a period between treatments, known as a washout period, is needed as a means of minimizing carry over effects. In addition, the statistical techniques to demonstrate absence of carry over may not be satisfactory. Thus only a crossover study that had a washout period was considered as an appropriate trial. Accordingly, for this review, two trials conducted by El‐Hage et al and Sherwin et al were recognized as suitable crossover studies (El‐Hage 2007; Sherwin 1988). Because of the possibility of a carry‐over effect, it was decided that only the first half of the remaining studies would be considered for inclusion. However, after contacting corresponding authors of these studies it was established that the data from the first treatment periods were no longer available.
3.3 Centres
There were 18 single‐centre trials (Dobs 2002; Davis 1995; de Paula 2007; Dow 1983; El‐Hage 2007; Floter 2002b; Hickok 1993; Hofling 2007; Matthews 2005; Miller 2000; Montgomery 1987; Nathrost‐Boos 2006; Penotti 2001; Penteado 2008; Regestein 2001; Sarrel 1998; Sherwin 1988; Zang 2006) and the remaining trials were multicentre (more than two centres) studies.
3.4 Source of funding
There were 17 trials that were sponsored by pharmaceutical companies (Barrett‐Connor 1999; Braunstein 2005; Buster 2005; Chiuve 2004; Davis 1995; Davis 2006; de Paula 2007; El‐Hage 2007; Hofling 2007; Penteado 2008; Regestein 2001; Sarrel 1998; Shepanek 1999; Shifren 2000; Simon 2005; Warnock 2005; Watts 1995), 10 trials partly funded by pharmaceutical companies (Dobs 2002; Burger 1987; Floter 2002b; Hickok 1993; Leao 2006; Matthews 2005; Miller 2000; Nathrost‐Boos 2006; Raisz 1996; Zang 2006), and eight trials did not state their funding source (Dow 1983; Farish 1984; Leao 2006; Lobo 2003; Montgomery 1987; Penotti 2001; Sherwin 1988; Simon 1999).
3.5 Duration of study
There were five trials with a study duration of less than three months (Chiuve 2004; Matthews 2005; Raisz 1996; Sarrel 1998; Warnock 2005), 12 trials lasting three to less than six months (de Paula 2007; Dobs 2002; Dow 1983; Lobo 2003; Montgomery 1987; Nathrost‐Boos 2006; Regestein 2001; Shepanek 1999; Sherwin 1988; Shifren 2000; Simon 1999; Zang 2006), 12 trials lasting six to less than 12 months (Braunstein 2005; Burger 1987; Buster 2005; Davis 2006; El‐Hage 2007; Farish 1984; Floter 2002b; Hickok 1993; Hofling 2007; Penotti 2001; Shifren 2006; Simon 2005), and six studies of 12‐months duration or more (Barrett‐Connor 1999; Davis 1995; Leao 2006; Miller 2000; Penteado 2008; Watts 1995).
4. Intervention
4.1 Route
4.1.1 HT: the majority of trials involved oral HT. The non‐oral forms included sublingual tablets (Miller 2000), implants (Burger 1987; Davis 1995; Dow 1983; Farish 1984; Montgomery 1987), transdermal therapy (Davis 2006; El‐Hage 2007; Penotti 2001; Shifren 2000), percutaneous gel (Leao 2006), and intramuscular injection (Sherwin 1988). Three studies included women who were receiving a stable dose of oral or transdermal oestrogen therapy (Buster 2005; Nathrost‐Boos 2006; Simon 2005).
4.1.2 Testosterone therapy: testosterone was most commonly administered orally. Non‐oral administration included implants (Burger 1987; Davis 1995; Dow 1983; Farish 1984; Montgomery 1987), transdermal patches (Braunstein 2005; Buster 2005; Davis 2006; Hofling 2007; Shifren 2000; Shifren 2006; Simon 2005), sublingual tablets (Miller 2000), percutaneous gel (Nathrost‐Boos 2006), percutaneous cream (El‐Hage 2007), and intramuscular injection (Sherwin 1988). For orally administered testosterone, 15 trials used methyltestosterone (Barrett‐Connor 1999; Chiuve 2004; de Paula 2007; Dobs 2002; Hickok 1993; Leao 2006; Lobo 2003; Penteado 2008; Raisz 1996; Regestein 2001; Sarrel 1998; Shepanek 1999; Simon 1999; Warnock 2005; Watts 1995), and the remaining trials used testosterone undecanoate (Floter 2002b; Penotti 2001; Zang 2006).
4.2 Progestin use
In women with an intact uterus, eight trials did not include any kind of progestin during the study period (Dobs 2002; Hickok 1993; Lobo 2003; Raisz 1996; Regestein 2001; Sarrel 1998; Simon 1999; Zang 2006) while 12 trials used a progestin to oppose the oestrogenic effects on the endometrium (Burger 1987; Davis 1995; de Paula 2007; Dow 1983; Hofling 2007; Matthews 2005; Miller 2000; Montgomery 1987; Nathrost‐Boos 2006; Penotti 2001; Penteado 2008; Shifren 2006).
4.3 Dosages of testosterone
4.3.1 Methyltestosterone: there were three dosages of methyltestosterone used in the included studies. These were 1.25, 2 and 2.5 mg. The 1.25 mg dose was commonly used together with 0.625 mg of esterified oestrogen or another equivalent dose of oestrogen (Barrett‐Connor 1999; Hickok 1993; Leao 2006; Lobo 2003; Regestein 2001; Shepanek 1999; Simon 1999). The 2 mg dose was used together with 0.625 mg of conjugated equine oestrogen (Penteado 2008). The 2.5 mg dose was used with 1.25 mg of esterified oestrogen or another equivalent dose of oestrogen (Barrett‐Connor 1999; Chiuve 2004; de Paula 2007; Dobs 2002; Matthews 2005; Raisz 1996; Sarrel 1998; Simon 1999; Warnock 2005; Watts 1995).
4.3.2 Non‐methyltestosterone: the testosterone undecanoate dose was 40 mg once a day; the micronized testosterone dose was 1.25 mg twice a day; testosterone patches were 150, 300, and 450 µg twice a week; and testosterone implant doses were 50 mg and 100 mg.
5. Outcomes
This review had a broad range of outcomes of interest. Data synthesis in each outcome was from meta‐analysis, descriptive analysis, or both depending on the availability and appropriateness of data. The availability of data is presented in this section. For construct outcomes only the available data that were measured by validated questionnaires were subsequently included for data synthesis and considered for meta‐analysis. Construct outcomes were sense of well being, unexplained fatigue, sexual function, mood, menopausal symptoms, increased facial and body hair growth, and acne. The available data from parallel studies and the one crossover study with a washout period where the data were non‐skewed were included for meta‐analysis. Information about data that were not included in the meta‐analysis was presented in an additional table of trial outcomes not included in the meta‐analysis.
5.1 Primary outcomes
5.1.1. Sense of well being: there were 11 trials that reported data pertaining to this outcome (Barrett‐Connor 1999; Dobs 2002; Floter 2002b; Matthews 2005; Montgomery 1987; Nathrost‐Boos 2006; Penotti 2001; Regestein 2001; Sherwin 1988; Shifren 2000; Warnock 2005). Two of these did not provide comparative results (Dobs 2002; Penotti 2001). Therefore, only nine trials were considered for data synthesis and only two trials were suitable for meta‐analysis (Matthews 2005; Warnock 2005).
5.1.2. Unexplained fatigue: this outcome was most commonly presented in the analysis of sense of well being or menopausal symptoms. Of trials that included either of these two outcomes, there were three crossover trials that provided data pertaining to unexplained fatigue for descriptive data synthesis (Floter 2002b; Sherwin 1988; Shifren 2000). No data were suitable for meta‐analysis.
5.1.3. Sexual function: 23 trials reported the effects of testosterone on sexual function (Barrett‐Connor 1999; Braunstein 2005; Burger 1987; Buster 2005; Davis 1995; Davis 2006; Dobs 2002; Dow 1983; El‐Hage 2007; Floter 2002b; Lobo 2003; Miller 2000; Nathrost‐Boos 2006; Penotti 2001; Penteado 2008; Regestein 2001; Sarrel 1998; Shepanek 1999; Sherwin 1988; Shifren 2000; Shifren 2006; Simon 2005; Warnock 2005). One study did not report any data for this outcome that was suitable for descriptive data synthesis (Regestein 2001). Only nine trials provided suitable data for meta‐analysis (Braunstein 2005; Buster 2005; Davis 1995; Davis 2006; Lobo 2003; Sarrel 1998; Shifren 2006; Simon 2005; Warnock 2005).
5.2 Secondary outcomes
5.2.1. Benefits
5.2.1.1. Bone health
5.2.1.1.1. Incidence of osteoporotic fracture: there was no trial that reported this outcome.
5.2.1.1.2. Bone mineral density: six trials described this result (Barrett‐Connor 1999; Davis 1995; Floter 2002b; Miller 2000; Watts 1995; Zang 2006). There were three double‐blind, parallel‐group studies (Barrett‐Connor 1999; Miller 2000; Watts 1995), one crossover study (Floter 2005), one single‐blind study (Davis 1995), and one open study (Zang 2006). Only three trials provided appropriate data for meta‐analysis (Davis 1995; Miller 2000; Zang 2006). The remaining trials were included in descriptive data synthesis.
5.2.1.2. Body composition: five studies provided the data pertaining to this outcome (Davis 1995; Dobs 2002; Floter 2005; Leao 2006; Zang 2006). The weight gain data from four studies was suitable for meta‐analysis (Davis 1995; Dobs 2002; Leao 2006; Zang 2006).
5.2.1.3. Cognition: of the five randomised trials (Dobs 2002; Regestein 2001; Shepanek 1999; Sherwin 1988; Warnock 2005) that reported effects of testosterone on cognition only two were eligible for meta‐analysis (Dobs 2002; Warnock 2005). The remaining trials were considered for descriptive data synthesis.
5.2.1.4. Menopausal symptoms: this outcome was stated in 11 trials (Barrett‐Connor 1999; Dow 1983; Hickok 1993; Miller 2000; Raisz 1996; Regestein 2001; Sarrel 1998; Sherwin 1988; Simon 1999; Warnock 2005; Watts 1995) but only one trial provided data suitable for meta‐analysis (Warnock 2005). The remaining trials were considered for descriptive data synthesis.
5.2.2. Adverse events
5.2.2.1. Increased facial or body hair: only the results of trials that used a standard method of assessment were included in the data synthesis. Accordingly there were 12 eligible trials (Barrett‐Connor 1999; Braunstein 2005; Buster 2005; Chiuve 2004; Davis 2006; El‐Hage 2007; Floter 2002b; Lobo 2003; Shifren 2000; Shifren 2006; Simon 2005; Warnock 2005). Eight trials provided suitable results for meta‐analysis (Braunstein 2005; Buster 2005; Chiuve 2004; Davis 2006; Shifren 2006; Simon 2005; Warnock 2005; Lobo 2003).
5.2.2.2. Acne: only the results of trials that used a standard method of assessment were included in the data synthesis. Accordingly there were 12 eligible trials (Barrett‐Connor 1999; Braunstein 2005; Buster 2005; Chiuve 2004; Davis 2006; El‐Hage 2007; Floter 2002b; Lobo 2003; Shifren 2000; Shifren 2006; Simon 2005; Warnock 2005). Eight trials provided suitable results for meta‐analysis (Braunstein 2005; Buster 2005; Chiuve 2004; Davis 2006; Lobo 2003; Shifren 2006; Simon 2005; Warnock 2005).
5.2.2.3. Mood alteration, specifically aggression: only two trials reported the effects of testosterone on aggression; the data were not appropriate for meta‐analysis (El‐Hage 2007; Sherwin 1988). Therefore, only descriptive data synthesis was performed.
5.2.2.4. Breast cancer
5.2.2.4.1. Mammographic findings: only two trials reported the effects of testosterone on breast cell proliferation; the data were not appropriate for meta‐analysis.
5.2.2.4.2 Incidence of breast cancer: no trial reported this outcome.
5.2.2.5. Coronary heart disease: no trial reported this outcome.
5.2.2.6. Lipid profile: there were 17 trials that were appropriate for inclusion in the meta‐analysis (Barrett‐Connor 1999; Braunstein 2005; Buster 2005; Chiuve 2004; Dobs 2002; Davis 1995; Davis 2006; Farish 1984; Hickok 1993; Leao 2006; Lobo 2003; Penotti 2001; Raisz 1996; Shifren 2006; Simon 2005; Watts 1995; Warnock 2005). Five trials did not provide suitable data for the meta‐analysis but they were included in the descriptive data synthesis (Dobs 2002; El‐Hage 2007; Floter 2002b; Miller 2000; Nathrost‐Boos 2006).
5.2.2.7. Discontinuation rate: of 35 included trials, data from 14 trials were incomplete for meta‐analysis (Chiuve 2004; de Paula 2007; El‐Hage 2007; Dow 1983; Floter 2002b; Hofling 2007; Miller 2000; Nathrost‐Boos 2006; Raisz 1996; Regestein 2001; Shepanek 1999; Sherwin 1988; Shifren 2000; Watts 1995). Therefore, 21 trials were included in the meta‐analysis.
Risk of bias in included studies
The methodological risks of bias for the included studies are presented in Figure 1 and Figure 2.

Methodological quality summary: review authors' judgements about each methodological quality item for each included study.
1. Randomisation and concealment of allocation sequences
Randomisation and concealment of allocation sequences were adequate in 21 trials (Barrett‐Connor 1999; Braunstein 2005; Buster 2005; Davis 2006; Davis 1995; Dobs 2002; El‐Hage 2007; Farish 1984; Floter 2002b; Leao 2006; Lobo 2003; Matthews 2005; Miller 2000; Nathrost‐Boos 2006; Penotti 2001; Regestein 2001; Sarrel 1998; Sherwin 1988; Shifren 2000; Shifren 2006; Simon 2005) while in nine trials these were unclear (Chiuve 2004; Dow 1983; Hofling 2007; Montgomery 1987; Penteado 2008; Raisz 1996; Shepanek 1999; Simon 1999; Warnock 2005). In one study randomisation was adequate but concealment was inadequate (Zang 2006). In three trials randomisation was adequate but concealment was unclear (Burger 1987; de Paula 2007; Hickok 1993). In one study concealment was adequate but randomisation was unclear (Watts 1995).
2. Baseline equality
This issue applied to parallel studies only. Of the included parallel studies five publications did not comment on baseline equality (Burger 1987; Dow 1983; Farish 1984; Sarrel 1998; Simon 1999). Seven publications stated that baseline characteristics were similar in terms of age and menopausal status but did not comment on the baseline values of the main outcomes (Barrett‐Connor 1999; Buster 2005; Hofling 2007; Matthews 2005; Miller 2000 (two publications); Penteado 2008; Watts 1995). Baseline equality in terms for age, menopausal status, and baseline values of the outcomes were reported in 14 publications (Braunstein 2005; Chiuve 2004; Davis 2006; Dobs 2002; Hickok 1993; Leao 2006; Lobo 2003; Miller 2000; Penotti 2001; Shepanek 1999; Shifren 2006; Simon 2005; Warnock 2005; Zang 2006). However, baseline inequality was documented in two trials for sexual function score (Davis 2006; Dobs 2002), one for menopausal symptom scores (Raisz 1996), and three for age (Davis 1995; Raisz 1996; Warnock 2005).
3. Non‐compliers and intention‐to‐treat analysis
Only five studies reported no withdrawals (El‐Hage 2007; Farish 1984; Hickok 1993; Leao 2006; Zang 2006) and eight reported a discontinuation rate of less than 10% (Chiuve 2004; Davis 1995; de Paula 2007; Dobs 2002; Matthews 2005; Penteado 2008; Sarrel 1998; Simon 1999). The majority of trials reported a non‐compliance rate of at least 10% (Barrett‐Connor 1999; Braunstein 2005; Burger 1987; Buster 2005; Davis 2006; Floter 2002b; Hofling 2007; Lobo 2003; Miller 2000; Montgomery 1987; Nathrost‐Boos 2006; Penotti 2001; Regestein 2001; Shepanek 1999; Sherwin 1988; Shifren 2000; Shifren 2006; Simon 2005; Warnock 2005). The remaining two studies did not report on discontinuation rate.
Ten trials stated that analyses were performed on an intention‐to‐treat basis (Barrett‐Connor 1999; Braunstein 2005; Buster 2005; Davis 2006; El‐Hage 2007; Lobo 2003; Shifren 2000; Shifren 2006; Simon 2005; Warnock 2005). Seven trials clearly described the method of intention‐to‐treat analysis. The 'last observation carried forward' approach was used for the intention‐to‐treat analysis (Braunstein 2005; Buster 2005; Davis 2006; Shifren 2006; Simon 2005; Lobo 2003; Warnock 2005) however the number of participants analysed was still less than the number of participants randomised. For the other two of the nine trials the number of participants analysed was obviously less than that at randomisation (Barrett‐Connor 1999; Shifren 2000). There were two criteria for an intention‐to‐treat analysis. Firstly, trial participants should be analysed in the groups to which they were randomised regardless of which (or how much) treatment they actually received and regardless of other protocol irregularities, such as ineligibility. In addition, all participants should be included regardless of whether their outcomes were actually collected. According to these criteria none of the studies were analysed by a genuine intention‐to‐treat analysis.
4. Standardized outcome measurement
Standardized outcome measurement was considered for the construct variables in term of validated scales or questionnaire use.
4.1 Sense of well being: of all the relevant trials one study used a self‐rating scale (Penotti 2001); eight used validated questionnaires (Dobs 2002; Floter 2002b; Matthews 2005; Montgomery 1987; Regestein 2001; Sherwin 1988; Shifren 2000; Warnock 2005), and one did not describe the questionnaire used (Barrett‐Connor 1999). The names of the validated questionnaires were: the Quality of Life at Menopause Scale (QUALMS), The Menopausal Quality of Life Questionnaire, the Psychological General Well Being Index (PGWB), the short version of Kellner and Sheffield's self rating scale of distress (SRD 30), the Trait Anxiety Inventory, the Zung Self‐Rated Depression Inventory, the symptom Check List‐90 Revised, the Adult Playfulness Scale, and the Multiple Adjective Affect Checklist (MAACL).
4.2 Unexplained fatigue: all relevant trials used validated questionnaires (Floter 2002b; Sherwin 1988; Shifren 2000). As stated above, this outcome was most commonly presented in the analysis of sense of well being. Names of the validated questionnaires were: the Psychological General Well Being Index (PGWB), and Daily Menopausal Rating Scale (DMRS).
4.3 Sexual function: of 21 trials that reported this outcome four studies used self‐rating scales (Burger 1987; Miller 2000; Penotti 2001; Regestein 2001) and 17 studies used validated questionnaires (Braunstein 2005; Buster 2005; Davis 1995; Davis 2006; Dobs 2002; El‐Hage 2007; Floter 2002b; Lobo 2003; Nathrost‐Boos 2006; Penteado 2008; Sarrel 1998; Shepanek 1999; Sherwin 1988; Shifren 2000; Shifren 2006; Simon 2005; Warnock 2005). In two studies the assessment method was not stated (Barrett‐Connor 1999; Dow 1983). The names of the validated questionnaires were: the Brief Index of Sexual Functioning for Women (BISF‐W), Changes in Sexual Functioning Questionnaire (CSFQ‐F‐C), Sabbatsberg Revised Sexual Self‐Rating Scale (SRS), Sexual Interest Questionnaire (SIQ), Sexual Activity Log (SAL), Menopausal Sexual Interest Questionnaire (MSIQ), the Profile of Female Sexual Function (PFSF), Sabbatsberg self‐rating scale, McCoy's sex scale questionnaire, the 10‐item Sexual Activity and Libido Scale, and DMRS.
4.4 Mood: validated questionnaires were used in the relevant trials (El‐Hage 2007; Sherwin 1988).
4.5 Cognition: all five studies used validated questionnaires (Dobs 2002; Regestein 2001; Shepanek 1999; Sherwin 1988; Warnock 2005).
4.6 Menopausal symptoms: of the 12 relevant trials five trials used validated questionnaires (Dow 1983; Montgomery 1987; Regestein 2001; Sherwin 1988; Warnock 2005). Five trials used a modified version of an original questionnaire (Barrett‐Connor 1999; Raisz 1996; Sarrel 1998; Simon 1999; Watts 1995), one used a self‐rating scale (Miller 2000), and one trial did not report the source of the questionnaire used (Hickok 1993). The validated questionnaires included the Greene scale and the Menopause Specific Quality of Life Questionnaire.
4.7 Increased facial and body hair growth: of the 13 relevant trials eight trials used standard scales for hirsutism evaluation (Braunstein 2005; Buster 2005; Davis 2006; El‐Hage 2007; Lobo 2003; Shifren 2000; Shifren 2006; Simon 2005), one trial used a modified scale (Barrett‐Connor 1999), and five trials did not state the scale used (Braunstein 2005; Chiuve 2004; Floter 2002b; Nathrost‐Boos 2006; Warnock 2005).
4.8 Acne: eight trials used original scales for acne evaluation (Braunstein 2005; Buster 2005; Davis 2006; El‐Hage 2007; Lobo 2003; Shifren 2000; Shifren 2006; Simon 2005), one trial used a modified scale (Barrett‐Connor 1999), and four trials did not state the scale used (Chiuve 2004; Floter 2002b; Nathrost‐Boos 2006; Warnock 2005).
Effects of interventions
Outcomes
1. Primary outcomes
1.1. Sense of well being
1.1.1. Meta‐analysis (comparison 1): two studies were eligible for this analysis (Matthews 2005; Warnock 2005). There were 10 domains of well being. Of these domains only sexual function was improved by testosterone addition. We reported the improvement with testosterone in terms of the standardized mean difference (SMD). The improvement with testosterone was 0.47 (95% CI 0.15 to 0.80).
1.1.2. Descriptive data synthesis: of the five available trials that used validated questionnaires there was one crossover study with no washout period that reported a significant benefit to general well being of adding a testosterone patch to an hormone (HT) regimen (Shifren 2000). In contrast, there was no evidence of a significant difference in another crossover study, with no washout period, which examined the effect of adding testosterone undecanoate to HT (Floter 2002b). These two trials measured sense of well being by the Psychological General Well Being Index. For other trials that used other types of questionnaires, one crossover study reported no effect on anxiety with the addition of a testosterone injection (Sherwin 1988) and there was no evidence of a significant difference for sense of well being from two parallel trials (Montgomery 1987; Regestein 2001).
1.2. Unexplained fatigue
1.2.1. Meta‐analysis: no appropriate data were available
1.2.2. Descriptive data synthesis: data were available from three crossover studies in surgically menopausal women (Floter 2002b; Sherwin 1988; Shifren 2000). One crossover study with a washout period found that women treated with oestrogen alone reported significantly lower ratings of energy levels than those who received either of the androgen‐containing preparations (P < 0.01) (Sherwin 1988). Two other studies with no washout period found no significant difference between the treatments in term of vitality (Floter 2002b; Shifren 2000). It is possible that lack of a washout period in these studies contributed to underestimation of a treatment effect for this outcome.
1.3. Sexual function
1.3.1. Meta‐analysis (comparison 2): there was an improved outcome with testosterone for a number of domains of sexual function. For one of the domains, the parameters sexual activity and coital frequency were considered together. We reported the improvement with testosterone in terms of the standardized mean difference (SMD). The mean scores were greater in the T‐HT group than in the HT alone group. The improvement was 0.29 (95% CI 0.20 to 0.38) for the number of satisfying sexual events, 0.25 (95% CI 0.17 to 0.34) for the total number of sexual events, 0.30 (95% CI 0.21 to 0.39) for the total number of orgasms, 0.35 (95% CI 0.26 to 0.43) for desire, 0.28 (95% CI 0.19 to 0.37) for orgasm, 0.36 (95% CI 0.27 to 0.45) for arousal, 0.33 (95% CI 0.22 to 0.43) for pleasure, 0.32 (95% CI 0.22 to 0.41) for sexual concerns, 0.32 (95% CI 0.23 to 0.40) for responsiveness, 0.26 (95% CI 0.16 to 0.35) for sexual self‐image, and 0.41 (95% CI 0.15 to 0.67) for the composite sexual function score. The decrease in mean personal distress scores in the T‐HT group was significantly greater than the decrease in the HT group. The difference was ‐8.13 (95% CI ‐10.59 to ‐5.67). One study provided data that showed that use of testosterone was associated with an improved outcome: SMD of 0.98 (95% CI 0.24 to 1.72) for satisfaction, 1.37 (95% CI 0.59 to 2.15) for fantasy, and 0.29 (95% CI 0.20 to 0.38) for frequency of desire.
Subgroup analysis was not practical due to the limited number of studies.
1.3.2. Descriptive data synthesis: of 14 available studies there were nine trials that used validated questionnaires for assessing sexual function. All of these trials reported positive effects of testosterone on sexual functioning (Braunstein 2005; Davis 2006; Dobs 2002; El‐Hage 2007; Floter 2002b; Penteado 2008; Shepanek 1999; Sherwin 1988; Shifren 2000). Descriptive data synthesis using other studies that measured sexual function by other scores or scales found inconsistent results.
The majority of trials did not have progestin use as a co‐intervention to oppose oestrogenic effects on the endometrium during the study period. However, beneficial effects of testosterone on sexual function were reported when progestin was added (Burger 1987; Davis 1995; Penteado 2008).
2. Secondary outcomes
2.1. Benefits
2.1.1. Bone health: for bone health the best outcome measure is the incidence of osteoporotic fracture; however, no study provided this outcome. The most commonly used outcome to measure bone health was bone mineral density (BMD).
2.1.1.1. Meta‐analysis (comparison 3): meta‐analyses using either the mean endpoint or change values from the three eligible trials showed no significant difference between treatment groups for lumbar BMD after 12 and 24 months of treatment. For femoral BMD, there were inconsistent results between analyses using mean endpoint and change values, after 12 months of treatment. By using the mean endpoint, WMD was ‐0.05 g/cm2 (95% CI ‐0.09 to ‐0.01) while for change in value the difference in means was 1.40 g/cm2 (95% CI 0.14 to 2.66). This inconsistency was likely to be due to the effect of the baseline BMD values. The oestrogen plus testosterone group had noticeably lower BMD values at baseline at both sites in two studies, even though in the Miller study the difference in baseline values was not statistically significant (Davis 1995; Miller 2000).
2.1.1.2. Descriptive data synthesis: three studies showed inconsistent results. One study showed that there was no significant difference between treatment groups for BMD of either the lumbar spine or femur (Watts 1995). In contrast, another study demonstrated a significantly greater improvement in both lumbar and femoral BMD at 24 months in the testosterone plus hormone therapy (T‐HT) group than in the HT group (Barrett‐Connor 1999). In a study over six months, there were no changes in BMD of the total body, hip, or lumbar spine with either regimen (Floter 2002b).
2.1.2. Body composition
2.1.2.1. Meta‐analysis (comparison 4): data were derived from one or two studies for each parameter. Using mean or mean change, results did not achieve a significant difference for any parameter.
2.1.2.2. Descriptive data synthesis: results from three studies for other parameters of body composition were not included in the meta‐analysis (Dobs 2002; Floter 2002b; Leao 2006). Standard deviations were unclear in one study (Dobs 2002). This study reported that T‐HT treatment, when compared with HT alone, significantly increased lean body mass in the arms, legs, and trunk. When the changes in arms, legs, and trunk in each participant were analysed together, the difference between treatments was significant for lean body mass (P < 0.05) and percentage of fat tissue (P < 0.05) but not significant for fat tissue (P < 0.05). In a crossover study, there were no significant differences in total body fat, total lean body mass, trunk fat, and trunk lean mass between the two treatments (Floter 2002b). The addition of testosterone to HT was associated with a significant increase in visceral fat area (P = 0.009) in one study (Leao 2006). However, there was no significant difference in subcutaneous fat area between the two groups (Leao 2006).
2.1.3. Cognition
2.1.3.1. Meta‐analysis (comparison 5): one trial was eligible for meta‐analysis for each domain of cognition. These domains were: cognition difficulty (Warnock 2005), identical pictures, and shape memory (Dobs 2002). The results showed no statistically significant difference in the means between treatments (difference in means 0.0, 95% CI ‐0.21 to 0.21; 2.4, 95% CI ‐6.67 to 1.87; and 0.10, 95% CI ‐2.19 to 2.39 for cognition difficulty, identical pictures, and shape memory, respectively) (Dobs 2002; Warnock 2005).
2.1.3.2. Descriptive data synthesis: this same study showed that performance on building memory was significantly different between the two groups (Dobs 2002). Women receiving oestrogen and methyltestosterone maintained a steady level of performance on the building memory task, whereas those receiving oestrogen alone showed a decrease in performance. A double‐blind, crossover study reported a significant benefit of testosterone on the Switching Attention Test (Regestein 2001). Reaction time in the switching condition was faster in the oestrogen plus testosterone group than in the oestrogen group (t = 3.25, df = 37, P < 0.002, effect size = 0.53 SD) (Regestein 2001). For other conditions of the same test, such as side condition and direction condition, there were no differences between the two groups (Regestein 2001). Results from another double‐blind study showed no significant advantage of adding testosterone to oestrogen therapy on tasks involving spatial transformation or orientation, mathematics, or non‐verbal reasoning (Shepanek 1999). Another crossover study did not report an effect on cognitive function of oestrogen alone versus oestrogen plus testosterone (Sherwin 1988). No studies involved co‐administered progestin during the study period.
2.1.4. Menopausal symptoms
2.1.4.1. Meta‐analysis (comparison 6): two trials were eligible for meta‐analysis, looking at vasomotor symptoms (Warnock 2005; Matthews 2005). The results showed no significant difference between the treatment means (mean difference 0,09, 95% CI ‐0.18 to 0.37).
2.1.4.2. Descriptive data synthesis: menopausal symptoms were measured by validated questionnaires in three trials (Dow 1983; Regestein 2001; Sherwin 1988). Dow et al measured menopausal symptoms using a menopausal symptom scale developed by Greene 1976 and reported no significant difference between treatments in any domain. In a crossover trial with no washout period, menopausal symptoms were measured by the Menopause‐Specific Quality of Life Questionnaire (MENQOL) and the study found that the mean overall outcome change score between treatments was not different from zero (Regestein 2001). Sherwin et al measured the symptoms using a menopausal index and reported a significantly greater improvement in somatic and psychological symptoms in the combined testosterone‐oestrogen treated group than in the oestrogen alone group (Sherwin 1988). No comparative effects on hot flushes were provided in another report of the same trial (Sherwin 1988). Descriptive data synthesis from other studies that measured menopausal symptoms using modified scores and scales also found inconsistent results.
2.2. Adverse events
2.2.1. Increased facial and body hair
2.2.1.1. Meta‐analysis (comparison 7): hirsutism and facial hair growth were considered together. Seven studies that were eligible for meta‐analysis (Braunstein 2005; Buster 2005; Chiuve 2004; Davis 2006; Shifren 2006; Simon 2005; Warnock 2005) showed that the incidence of increased facial or body hair growth was significantly higher in the T‐HT group than that in the HT group (Peto OR 1.52, 95% CI 1.07 to 2.17). By using a mean hirsutism score, one study eligible for meta‐analysis (Lobo 2003) showed that the mean score was not significantly different between the two treatments (difference in means 0.4, 95% CI ‐0.15 to 0.95).
2.2.1.2. Descriptive data synthesis: a parallel study reported no differences in the hirsutism scores between the low‐dose groups (conjugated equine oestrogen 0.625 mg versus conjugated equine oestrogen 0.625 mg and methyltestosterone 1.25 mg) (Barrett‐Connor 1999). In the high‐dose groups (conjugated equine oestrogen 1.25 mg versus conjugated equine oestrogen 1.25 mg and methyltestosterone 2.5 mg) in the same study, 10 HT‐T treated participants and three HT treated participants reported hirsutism as an adverse event. Three crossover studies with no washout period reported no difference in increased hair growth between treatment groups (El‐Hage 2007; Floter 2002b; Shifren 2000).
2.2.2. Acne
2.2.2.1. Meta‐analysis (comparison 8): seven studies that were eligible for meta‐analysis (Braunstein 2005; Buster 2005; Chiuve 2004; Davis 2006; Shifren 2006; Simon 2005; Warnock 2005) showed that the incidence of acne was significantly higher in the T‐HT group than that in the HT group (Peto OR 1.51, 95% CI 1.07 to 2.14). Using the mean acne score, one study that was eligible for meta‐analysis (Lobo 2003) showed that the score was not significantly different between the two treatments (difference in means 0.1, 95% CI ‐0.03 to 0.23).
2.2.2.2. Descriptive data synthesis: the incidence of acne was not different between groups as reported in three crossover studies with no washout period (El‐Hage 2007; Floter 2002b; Shifren 2000). In the interim analysis of a two‐year study (Barrett‐Connor 1999), acne of mild or moderate severity was reported by 5 (3%) in the oestrogen plus methyltestosterone treated participants whereas no participants receiving oestrogen alone reported acne (Barrett‐Connor 1999).
2.2.3. Mood alteration, specifically aggression
2.2.3.1. Meta‐analysis: no appropriate data were available.
2.2.3.2. Descriptive data synthesis: the data synthesis found no significant differences between treatments for hostility (El‐Hage 2007; Sherwin 1988).
2.2.4. Breast cancer
2.2.4.1. Mammographic density (comparison 9): only one trial was eligible for meta‐analysis (Hofling 2007). The results showed no statistically significant difference in the mean increase in area of dense breast between the two treatment groups.
2.2.4.2. Incidence of breast cancer: no trial reported an outcome for incidence of breast cancer.
2.2.5. Coronary heart disease: no trial reported this as an outcome.
2.2.6. Lipid profile
2.2.6.1. Meta‐analysis (comparison 10 and 11): four lipid parameters were analysed according to route of testosterone administration. As significant heterogeneity was found in the meta‐analyses of all lipid parameters, we used the random‐effects model to analyse the outcomes. When we combined the results for all routes of testosterone there were significant reductions in total cholesterol and HDL‐cholesterol levels while there were significant increases in LDL cholesterol and triglyceride levels. For subgroup analyses according to route of testosterone administration not only did oral testosterone significantly increase LDL cholesterol but it also significantly decreased total cholesterol, HDL cholesterol, and triglyceride levels. When compared with conventional hormone therapy, the addition of a testosterone patch did not significantly alter the levels of total cholesterol, LDL cholesterol, and triglyceride but it significantly decreased the HDL level by ‐1.09 mg/dl (95% CI ‐1.98 to ‐ 0.91). Possible sources of heterogeneity were clinical and methodological diversities. Baseline inequality was documented in the study conducted by Chiuve et al in terms of triglyceride levels (Chiuve 2004) and Raisz et al. in terms of age and total cholesterol (Raisz 1996). Baseline triglyceride levels were noticeably lower in the T‐HT group than those in the HT group (Chiuve 2004). Participants in the T‐HT group were younger than those in the HT group and baseline total cholesterol levels in the T‐HT group were significantly higher than in the HT only group (P < 0.05) (Raisz 1996). Baseline equality was not mentioned in the study conducted by Farish et al (Farish 1984). However, baseline lipid levels as shown in a table were similar in both groups (Farish 1984).
Five parameters were analysed at five time periods: less than three months, three to < six months, six to < 12 months, at 12 months, and at 24 months. The parameters were: total cholesterol, triglyceride, LDL cholesterol, HDL cholesterol, and the total cholesterol to HDL cholesterol ratio.
2.2.6.1.1. Studies of less than three‐month duration: there were four eligible studies. The direction of the results was different between studies for total cholesterol, triglyceride, and LDL cholesterol. Furthermore, there was statistically significant heterogeneity for triglyceride, HDL cholesterol, and LDL cholesterol (P < 0.05). Therefore these trials were not pooled for triglyceride and LDL cholesterol; a random‐effects model was used for the meta‐analysis of total cholesterol and HDL cholesterol. Possible sources of heterogeneity were clinical and methodological diversities. Baseline inequality was documented in the study conducted by Chiuve et al in terms of triglyceride levels (Chiuve 2004) and Raisz et al in terms of age and baseline total cholesterol levels (Raisz 1996). Baseline triglyceride levels were noticeably lower in the T‐HT group than in the HT group (Chiuve 2004). Participants in the T‐HT group were younger than those in the HT group and total cholesterol levels in the T‐HT group were significantly higher than in the HT‐only group (P < 0.05) (Raisz 1996). Baseline equality was not mentioned in the study conducted by Farish et al (Farish 1984). However, baseline lipid levels shown in a table were similar in both treatment groups (Farish 1984). Another possible source of heterogeneity was the route of hormone administration. In two studies both hormones were administered orally (Chiuve 2004; Raisz 1996) and in the other study by implant (Farish 1984).
In the meta‐analysis: total cholesterol and HDL cholesterol were significantly lower after treatment in the T‐HT group than in the HT group. The weighted mean differences (WMD) were ‐14.92 mg/dl (95% CI ‐27.81 to ‐2.03) and ‐17.11 mg/dl (95% CI ‐23.47 to ‐10.75), respectively.
2.2.6.1.2. Studies over three to < six months: two studies were eligible for this analysis (Dobs 2002; Lobo 2003). Because statistically significant heterogeneity was found using the Chi2 test the random‐effects model was used to estimate the treatment effects. A possible source of heterogeneity was the dose of methyltestosterone. In the study conducted by Lobo et al, the dose of methyltestosterone was 1.25 mg (Lobo 2003) while 2.5 mg of methyltestosterone was administered in the study conducted by Dobs et al (Dobs 2002). When we combined the mean scores and the change in scores, triglyceride and HDL cholesterol levels were significantly lower in the T‐HT group than in the HT group (total WMD ‐25.62 mg/dl, 95% CI ‐38.53 to ‐12.72; ‐18.72 mg/dl, 95% CI ‐26.04 to ‐11.39 respectively) while total cholesterol and LDL cholesterol levels were not significantly different between treatment groups.
2.2.6.1.3. Studies at six to < 12 months: 10 studies were eligible for this analysis. By using mean scores or change in scores, HDL cholesterol was consistently significantly lower in the T‐HT group than in the HT group (WMD ‐9.38 mg/dl, 95% CI ‐13.64 to ‐5.12; ‐4.74 mg/dl, 95% CI ‐8.42 to ‐1.07 respectively) while total cholesterol, triglyceride, and LDL cholesterol levels were not significantly different between treatment groups. Subgroup analysis according to oral or non‐oral testosterone (comparison 21) showed that HDL levels consistently decreased in both subgroups; however, the decrease was less in the non‐oral subgroup. Only one study was eligible for the meta‐analysis of the total cholesterol to HDL cholesterol ratio. For this the decrease in the ratio was greater in the T‐HT group than in the HT group (difference in means 20.60, 95% CI 12.76 to 28.44).
2.2.6.1.4. Studies at 12 months: using mean scores or change in scores, only HDL cholesterol was consistently significantly lower in the T‐HT group than in the HT group (WMD ‐7.22 mg/dl, 95% CI ‐13.99 to ‐0.45; ‐23.64 mg/dl, 95% CI ‐28.95 to ‐18.33 respectively). However, using change in scores the increase in LDL cholesterol was significantly greater in the T‐HT group than in the HT group (WMD 9.5 mg/dl, 95% CI 2.1 to 16.9) whereas the decrease in triglycerides was significantly greater in the T‐HT group than in the HT group (WMD ‐45.29, 95% CI ‐80.17 to‐10.40).
2.2.6.1.5. Studies at 24 months: using mean scores there were no differences between the two treatment groups. However, using change in scores the increase in LDL cholesterol was significantly greater in the T‐HT group than in the HT group (WMD 9.8 mg/dl, 95%CI 1.3 to 18.3). Triglyceride and HDL cholesterol levels were significantly lower in the T‐HT group than in the HT group (WMD ‐58.1 mg/dl, 95% CI ‐76.1 to ‐40.1; ‐26.3 mg/dl, 95% CI ‐30.0 to ‐22.7 respectively). The total cholesterol to HDL cholesterol ratio was significantly higher in the T‐HT group at both 12 and 24 months (WMD 20.8 mg/dl, 95% CI 11.0 to 30.6).
For changes in scores, the meta‐analyses at both 12 and 24 months were limited to esterified oestrogen 1.25 mg versus esterified oestrogen 1.25 mg plus methyltestosterone 2.5 mg.
2.2.6.2. Descriptive data synthesis: results from a study of esterified oestrogen 1.25 mg versus esterified oestrogen 1.25 mg plus methyltestosterone 2.5 mg showed that after 16 weeks of treatment significant decreases in the levels of total cholesterol, HDL cholesterol, and triglycerides occurred in the oestrogen plus testosterone group; LDL cholesterol values were virtually unchanged (Dobs 2002). The oestrogen group demonstrated the opposite effect on lipids with a significant decrease in LDL cholesterol levels and no meaningful change in the other lipid parameters (Dobs 2002). Results from a study of micronized oestrogen (with or without micronized progesterone) versus micronized oestrogen plus micronized testosterone (with or without micronized progesterone) found significant reductions in total cholesterol and LDL cholesterol in all groups (Miller 2000). Triglyceride levels increased 26.0% and HDL cholesterol levels decreased 9.0% in the oestrogen plus testosterone group. In contrast, with oestrogen therapy the triglyceride levels decreased 9.0% and HDL cholesterol levels increased 9.0%.
2.2.7. Discontinuation rate
2.2.7.1. Meta‐analysis (comparisons 12, 13, and 14): meta‐analyses involving 20 trials showed that there was no statistically significant difference in discontinuation rates between treatments. For the overall discontinuation rate and the discontinuation rate due to adverse events, Peto ORs were 0.99 (95% CI 0.83 to 1.19) and 1.24 (95% CI 0.95 to 1.62), respectively. Sensitivity analyses (comparison 23) based on quality of randomization and concealment of allocation sequences, study size (taking out three large studies with more than 100 participants), blinding, crossover studies, doses of testosterone, and doses of oestrogen did not affect the result. Subgroup analyses on the basis of symptoms at recruitment, menopausal status, type of menopause, duration of treatment, blinding, and disease status did not affect results.
Sensitivity analysis
Sensitivity analysis was performed only for the discontinuation rate due to limitations in the number of trials for each outcome. There was no substantial effect of methodological quality of trials, very large studies, length of treatment follow up, and different doses on the discontinuation rate.
Publication bias
Funnel plots were created to examine any possibility of publication bias. For the discontinuation rate, the funnel plot had a symmetrical shape around the overall effect with a wide base and a narrow peak. It indicated the absence of bias. However, visual examination of funnel plots for other outcomes had limited power because the numbers of studies were small.
Discussion
Summary of main results
Based on the results of this review, adding testosterone to an HT regimen has significant beneficial effects on sexual function for several domains, specifically number of satisfying sexual events (SMD 0.29, 95% CI 0.20 to 0.38), the total number of sexual events (SMD 0.25, 95% CI 0.17 to 0.34), number of orgasms (SMD 0.30, 95% CI 0.21 to 0.39), degree of libido or desire (SMD 0.35, 95% CI 0.26 to 0.43), level of orgasm (SMD 0.28, 95% CI 0.19 to 0.37), arousal (SMD 0.36, 95% CI 0.27 to 0.45), pleasure or enjoyment of sex (SMD 0.33, 95% CI 0.22 to 0.43), sexual concerns (SMD 0.32, 95% CI 0.22 to 0.41), responsiveness (SMD 0.32, 95% CI 0.23 to 0.40), sexual self‐image (SMD 0.26, 95% CI 0.16 to 0.35), and for the composite sexual function score (SMD 0.41, 95% CI 0.19 to 0.63). The decrease in personal distress scores in the testosterone group at 24 weeks was significantly greater for the placebo group (‐8.13, 95% CI ‐10.59 to ‐5.67). The clearly documented adverse effects of therapy were a reduction in HDL cholesterol, an increased incidence of facial hair growth (Peto OR 1.52, 95% CI 1.07 to 2.17) and acne (Peto OR 1.52, 95% CI 1.07 to 2.14). A reduction in HDL cholesterol was consistently seen for all testosterone regimens over all study durations that were evaluated. However, the magnitude and precision of this effect varied with the study duration and route of administration. In a subgroup analysis, HDL levels were markedly decreased in postmenopausal women who were treated with oral testosterone (WMD ‐18.63, 95% CI ‐22.18 to ‐15.08) while the effect size was smaller in the women who were treated with a testosterone patch (WMD ‐1.09, 95% CI ‐1.98 to ‐0.91). The discontinuation rate was not significantly greater with testosterone therapy (Peto OR 0.98, 95% CI 0.83 to1.17). There was no convincing evidence for effects on sense of well being, unexplained fatigue, bone health, body composition, menopausal symptoms, cognition, or hostility. However, conclusions are limited by the paucity of studies that have included these outcomes. Evidence for long‐term effects on breast cancer and coronary heart disease is lacking.
Overall completeness and applicability of evidence
For applicability of the evidence the following factors should be considered.
1) Testosterone regimens: all types of testosterone therapy exhibit a beneficial effect on sexual function. An adverse effect on HDL cholesterol levels was seen for testosterone implants, methyltestosterone, and testosterone patches.
2) Characteristics of participants: the improvement in sexual function together with the adverse effect on HDL cholesterol were reported in women treated with HT plus testosterone regardless of the type of menopause, disease status, duration or location of the study. There was no evidence available for perimenopausal women as distinct from postmenopausal women.
3) Biologic and cultural aspects: the age of natural menopause and the experience of menopausal symptoms vary geographically and culturally (Gold 2000). Additional factors that influence sexual function after menopause include endocrine factors, socioeconomic status, various concurrent illnesses, as well as the availability and sexual vitality of an intimate partner (Bachmann 2000). The effects of exogenous testosterone therapy on sexual function will be superimposed on this complex background.
Because of the complex nature of female sexual dysfunction it is often difficult to establish the meaningful steps in treatment. Treatment options for sexual dysfunction include identification of correctable causes, education and counselling, and medical therapy. Evidence from this systematic review provides information to be considered within the overall management of female sexual dysfunction.
Quality of the evidence
The methodological strengths of the included studies are that most had adequate randomisation and concealment of allocation sequences, to prevent selection bias. Methodological limitations included attrition bias, baseline inequality, the possibility of detection bias, and lack of a washout period in crossover studies. Attrition bias, baseline inequality, and detection bias all may have caused inaccurate effect estimates in the meta‐analyses. Attrition bias is evident by a significant number of non‐compliers and the lack of an intention‐to‐treat analysis in most of the included studies. Baseline inequality was documented in the studies that were included in the meta‐analysis for sexual function and lipid profile (Chiuve 2004; Davis 1995; Davis 2006; Raisz 1996). Detection bias may have occurred in the assessment of sexual function in a single‐blind study (Davis 1995) and may have resulted in overestimation of the treatment effect. In addition, the baseline inequality that was documented in the studies by Raisz and Chiuve might provide an explanation for the heterogeneity found in the meta‐analysis for the lipid outcome with less than three months of treatment. The difference in baseline frequency for total satisfactory activity may have contributed to the inaccurate effect estimate in one of the studies (Davis 2006); however, the direction of treatment effect was the same as in the other studies. With respect to the crossover studies included in the descriptive data synthesis for the outcomes of sense of wellbeing, unexplained fatigue, cognition, excess facial and body hair, and acne the lack of a washout period is likely to have resulted in underestimation of a treatment effect. This may have led to inconclusive results in these studies. In addition, different types of questionnaires used for outcome measurements of the construct variables may also have contributed to an underestimation of treatment effect.
Nevertheless, descriptive data synthesis of other double‐blind studies that were not included in the meta‐analyses confirms a benefit of testosterone therapy on sexual function. The positive effect of testosterone on sexual function and the negative effect on HDL cholesterol levels are likely to be reliable as the direction of the effects is consistent across the relevant studies not included in the meta‐analyses.
Potential biases in the review process
The strengths of this review are that we looked at a broad range of outcomes in relation to the addition of testosterone to HT regimens and thoroughly searched for all relevant studies, both published and unpublished, in electronic databases. We also made contact with the corresponding authors of relevant articles, experts, and pharmaceutical companies; and relevant journals were handsearched. In addition, there was a pre‐determined strategy for study selection and quality assessment of included studies, conducted by two independent assessors. These procedures were used to optimize the validity of the results of this review. Last but not least, we have now included more data in our meta‐analyses, specifically on sexual function, lipid profile, excess facial and body hair, and acne, resulting in more precise estimates of efficacy and safety than those in the previous review (Cochrane 2005).
Limitations of this review are the small number of studies and that no study was suitable for meta‐analyses for some outcomes, specifically sense of well being, unexplained fatigue, bone health, body composition, cognition, menopausal symptoms, mood alteration, breast cancer, and cardiovascular disease. In addition we included different regimens in the same analysis. The former limitation contributed to the inconclusive results and limited the power of the meta‐analysis to provide conclusions about some aspects of efficacy and safety. To address our question on whether there is evidence for the efficacy of testosterone therapy, we included all eligible studies in the meta‐analyses regardless of the treatment regimen. The limitation of this approach is that the effect estimate cannot be interpreted for a single treatment regimen.
Progestin was a co‐intervention in eight of the included trials. This could potentially obscure the treatment effects of testosterone on sexual function, body composition, BMD, biochemical markers of bone turnover, and lipid profiles. This review did not distinguish adverse events specific to the study medication from other adverse events since there was inconsistent reporting of the classification of adverse events among the studies. We did not review the effects of HT plus testosterone on liver function, endometrial histology, or hormonal profiles.
Agreements and disagreements with other studies or reviews
In support of the effects of testosterone on sexual function, a dose‐response relationship between testosterone and sexual function was suggested by six studies (Braunstein 2005; Buster 2005; Davis 2006; Shifren 2000; Shifren 2006; Simon 2005). The test for a linear dose‐response relationship for changes in sexual desire showed a positive trend although it did not reach statistical significance (P = 0.06) (Braunstein 2005). In the study by Shifren et al higher testosterone doses resulted in further increases in scores for thoughts‐desire, frequency of sexual activity, and pleasure‐orgasm determined using the Brief Index of Sexual Functioning for women (Shifren 2000). There was no formal statistical analysis for the dose‐response relationship provided. Thus a dose‐response relationship may exist but the limited number and size of available studies provided us with limited power to assess a dose‐response effect. The correlation between testosterone levels and sexual function was supported by evidence from six therapeutic trials (Braunstein 2005; Buster 2005; Davis 2006; Lobo 2003; Shifren 2006; Simon 2005). Lobo et al reported a significant association between changes in female sexual interest or desire and responsiveness and bioavailable testosterone (Lobo 2003). However, the correlation coefficient was not reported. Braustein et al reported a significant association between testosterone (total, free, and bioavailable) and many domains of sexual function; specifically sexual desire, sexual arousal, orgasm, and pleasure (Braunstein 2005). Significant correlations were also consistently observed between changes in serum total, bioavailable, and free testosterone levels and changes in the frequency of satisfying activity (Spearman's rank correlation of 0.16 to 0.18; P < 0.05), sexual desire (0.20 to 0.25; P<0.05), and personal distress (‐0.11 to ‐0.17, P < 0.05) (Buster 2005). These correlations were consistently reported by other studies using testosterone patches (Davis 2006; Shifren 2006; Simon 2005). The magnitude of the correlation coefficient varied across the studies. The highest coefficients were 0.61, 0.40, and 0.48 for the correlation between free testosterone and the frequency of satisfying activity, sexual desire, and personal distress, respectively. These figures showed a moderately strong relationship between serum levels of testosterone and sexual function.
Evidence from therapeutic trials regarding testosterone levels and the change of lipid profile is controversial. In a study of methyltestosterone in surgically postmenopausal women taking esterified oestrogens, changes in serum testosterone, total or free, were not found to be significantly correlated with changes in any of the lipoproteins (Chiuve 2004). In a crossover study, during the phase of oestradiol valerate 2 mg plus testosterone undecanoate 40 mg the difference between baseline and 24 weeks showed a significant positive correlation between free testosterone and total cholesterol (r = 0.33, P < 0.027). However, no correlations were found between the levels of total testosterone, free testosterone, and serum levels of HDL cholesterol (Floter 2002b).

Methodological quality graph: review authors' judgements about each methodological quality item presented as percentages across all included studies.

Methodological quality summary: review authors' judgements about each methodological quality item for each included study.
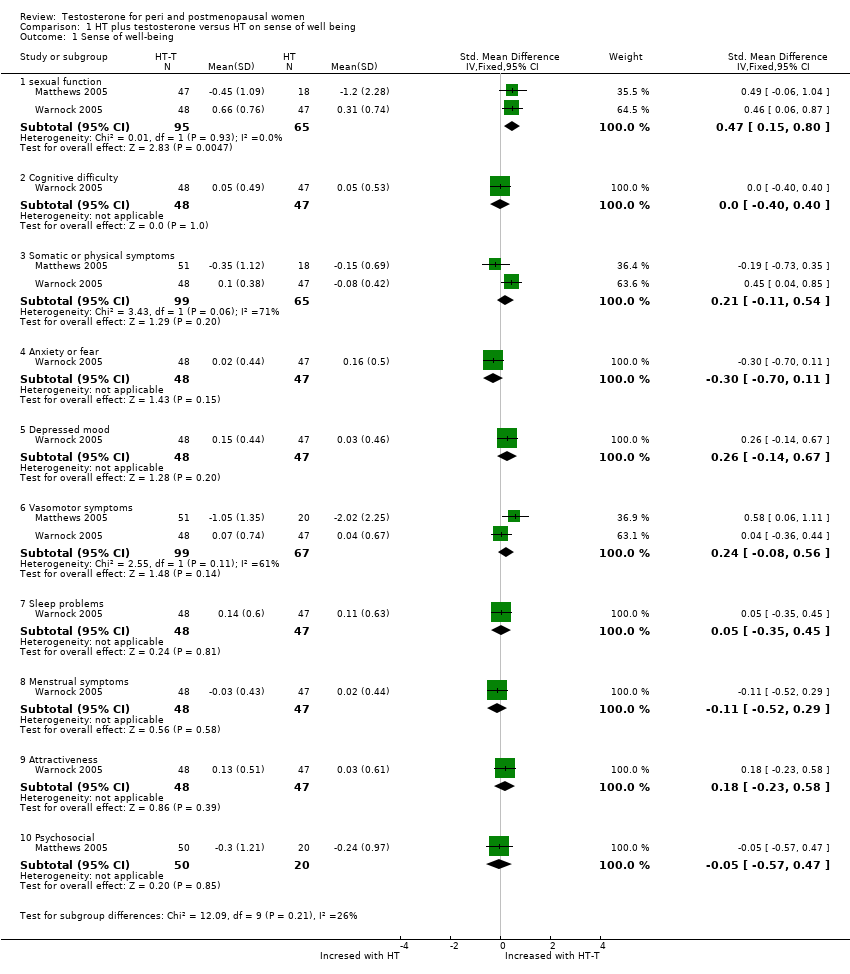
Comparison 1 HT plus testosterone versus HT on sense of well being, Outcome 1 Sense of well‐being.

Comparison 2 HT plus testosterone versus HT on sexual function, Outcome 1 Change scores of sexual function.
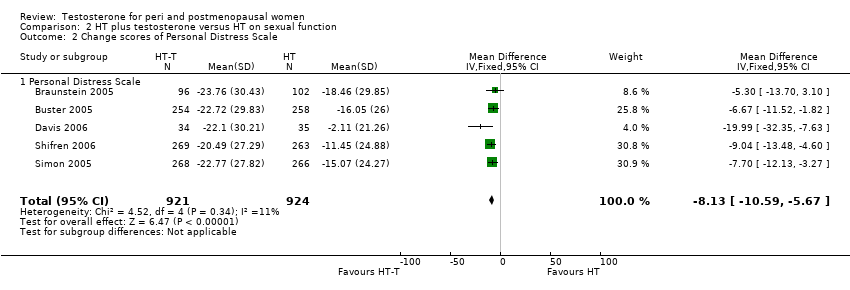
Comparison 2 HT plus testosterone versus HT on sexual function, Outcome 2 Change scores of Personal Distress Scale.

Comparison 3 HT plus testosterone versus HT on bone mineral density, Outcome 1 Lumbar BMDs at 12 months.
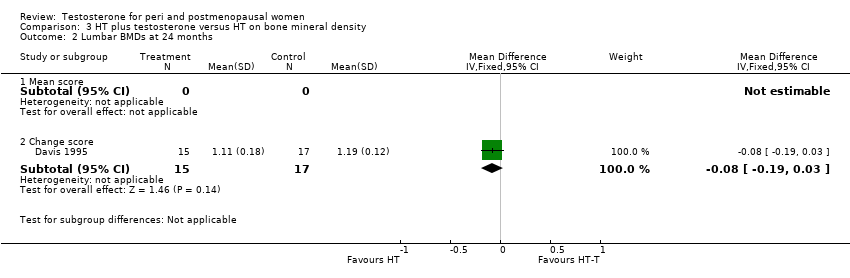
Comparison 3 HT plus testosterone versus HT on bone mineral density, Outcome 2 Lumbar BMDs at 24 months.

Comparison 3 HT plus testosterone versus HT on bone mineral density, Outcome 3 Femur BMDs at 12 months.
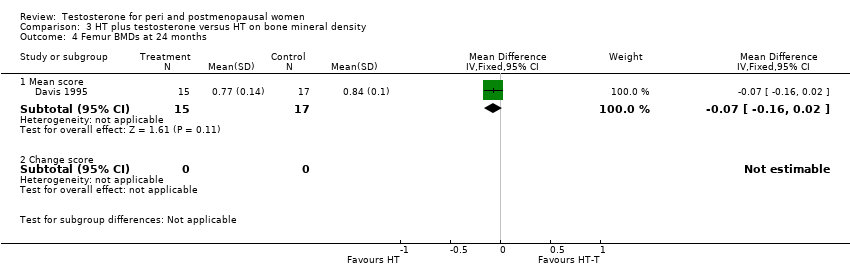
Comparison 3 HT plus testosterone versus HT on bone mineral density, Outcome 4 Femur BMDs at 24 months.
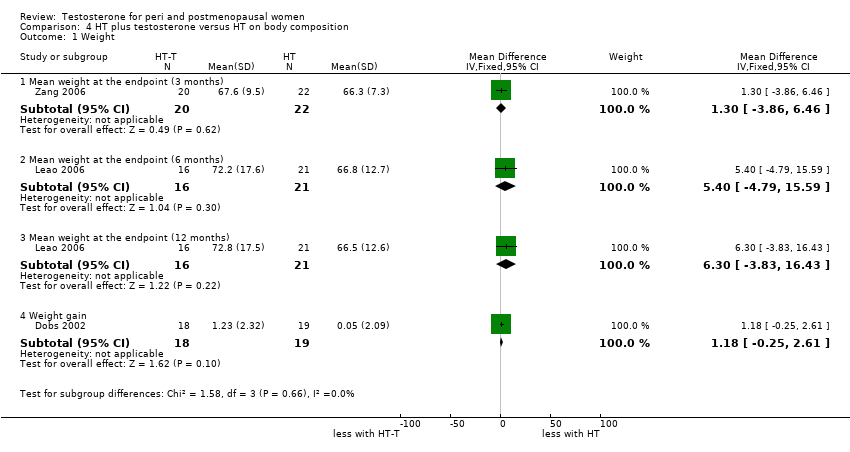
Comparison 4 HT plus testosterone versus HT on body composition, Outcome 1 Weight.
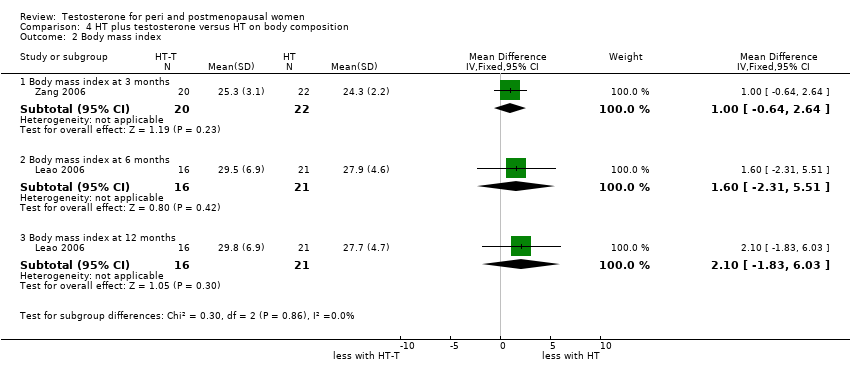
Comparison 4 HT plus testosterone versus HT on body composition, Outcome 2 Body mass index.
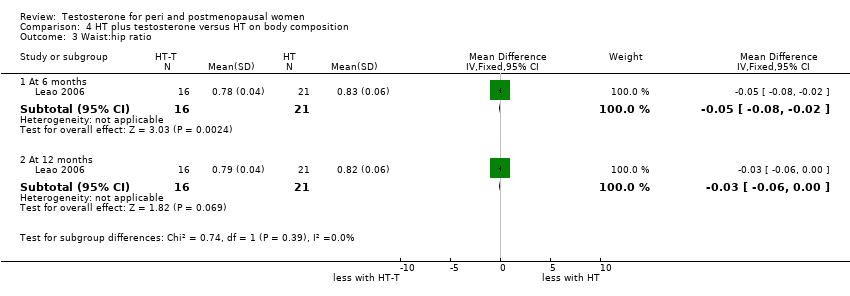
Comparison 4 HT plus testosterone versus HT on body composition, Outcome 3 Waist:hip ratio.
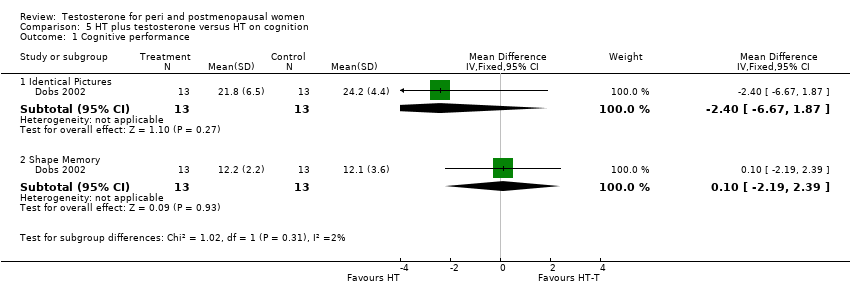
Comparison 5 HT plus testosterone versus HT on cognition, Outcome 1 Cognitive performance.

Comparison 5 HT plus testosterone versus HT on cognition, Outcome 2 Cognition difficulty.

Comparison 6 HT plus testosterone versus HT on menopausal symptoms, Outcome 1 Vasomotor symptom.
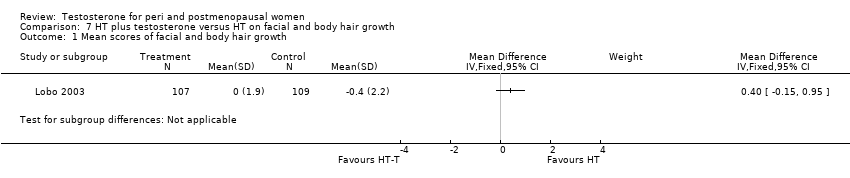
Comparison 7 HT plus testosterone versus HT on facial and body hair growth, Outcome 1 Mean scores of facial and body hair growth.
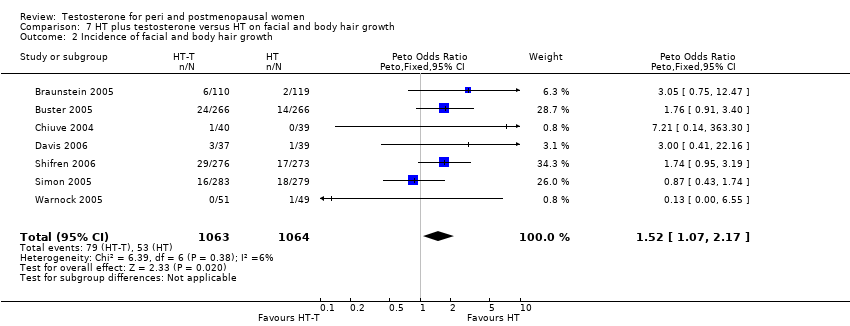
Comparison 7 HT plus testosterone versus HT on facial and body hair growth, Outcome 2 Incidence of facial and body hair growth.
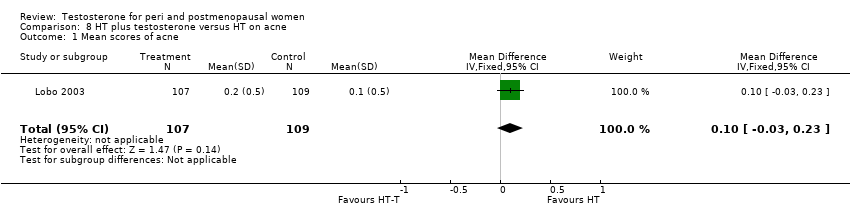
Comparison 8 HT plus testosterone versus HT on acne, Outcome 1 Mean scores of acne.

Comparison 8 HT plus testosterone versus HT on acne, Outcome 2 Incidence of acne.
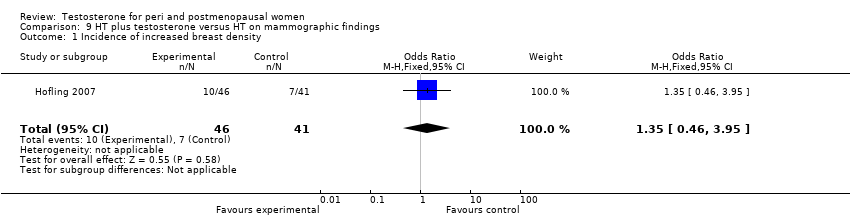
Comparison 9 HT plus testosterone versus HT on mammographic findings, Outcome 1 Incidence of increased breast density.
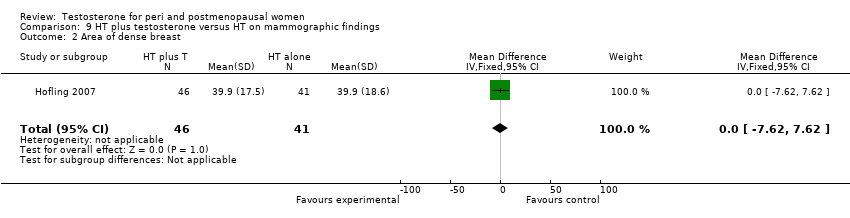
Comparison 9 HT plus testosterone versus HT on mammographic findings, Outcome 2 Area of dense breast.
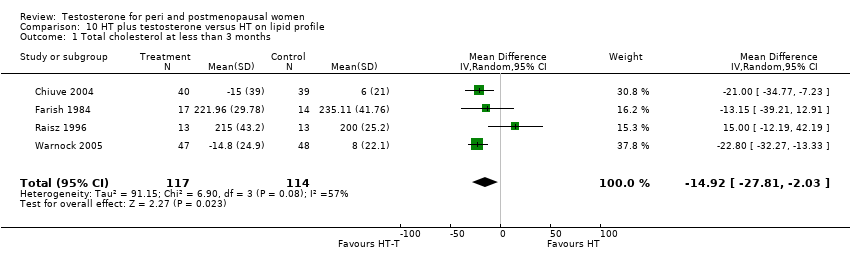
Comparison 10 HT plus testosterone versus HT on lipid profile, Outcome 1 Total cholesterol at less than 3 months.
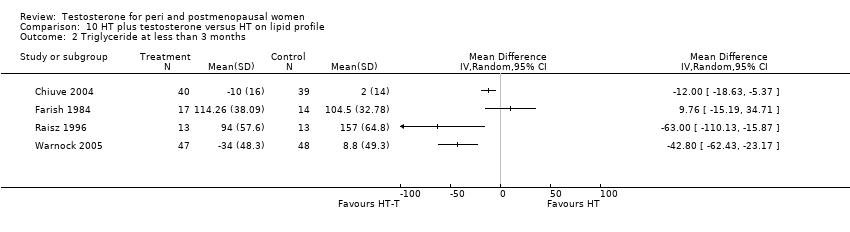
Comparison 10 HT plus testosterone versus HT on lipid profile, Outcome 2 Triglyceride at less than 3 months.
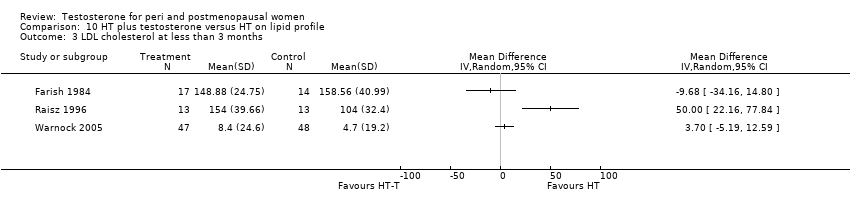
Comparison 10 HT plus testosterone versus HT on lipid profile, Outcome 3 LDL cholesterol at less than 3 months.

Comparison 10 HT plus testosterone versus HT on lipid profile, Outcome 4 HDL cholesterol at less than 3 months.
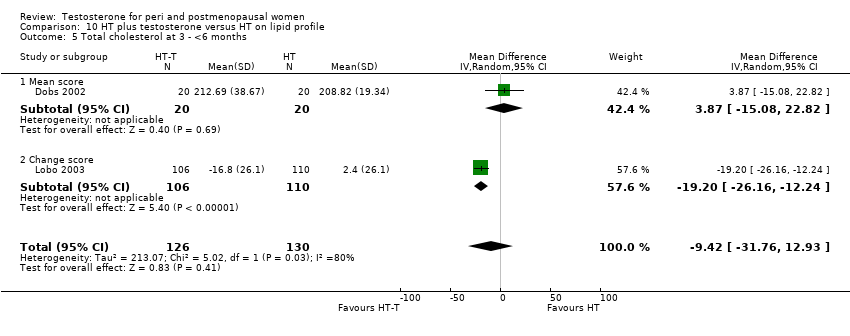
Comparison 10 HT plus testosterone versus HT on lipid profile, Outcome 5 Total cholesterol at 3 ‐ <6 months.

Comparison 10 HT plus testosterone versus HT on lipid profile, Outcome 6 Triglyceride at 3 ‐ <6 months.
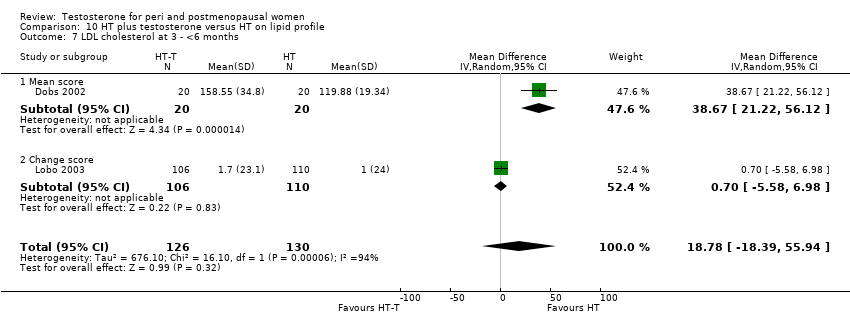
Comparison 10 HT plus testosterone versus HT on lipid profile, Outcome 7 LDL cholesterol at 3 ‐ <6 months.
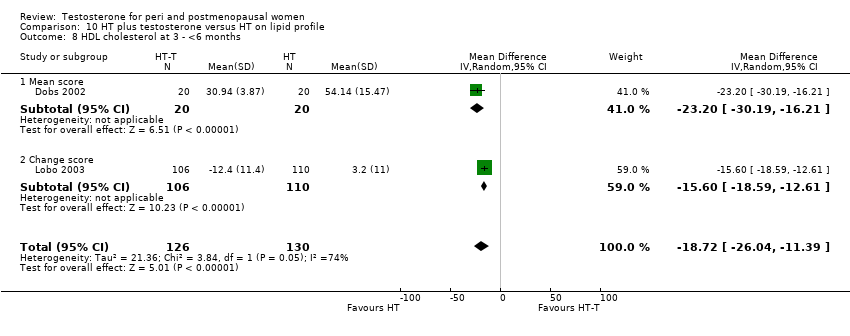
Comparison 10 HT plus testosterone versus HT on lipid profile, Outcome 8 HDL cholesterol at 3 ‐ <6 months.

Comparison 10 HT plus testosterone versus HT on lipid profile, Outcome 10 Total cholesterol at 6 ‐ <12 months.

Comparison 10 HT plus testosterone versus HT on lipid profile, Outcome 11 Triglyceride at 6 ‐ <12 months.

Comparison 10 HT plus testosterone versus HT on lipid profile, Outcome 12 LDL cholesterol at 6 ‐ <12 months.

Comparison 10 HT plus testosterone versus HT on lipid profile, Outcome 13 HDL cholesterol at 6 ‐ <12 months.
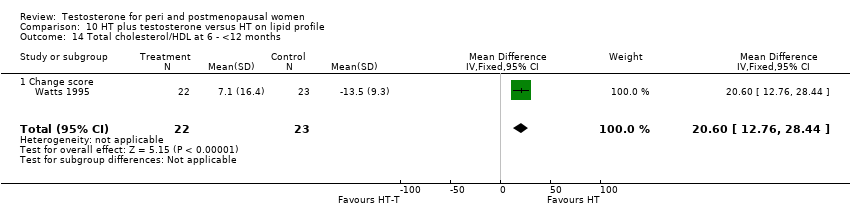
Comparison 10 HT plus testosterone versus HT on lipid profile, Outcome 14 Total cholesterol/HDL at 6 ‐ <12 months.

Comparison 10 HT plus testosterone versus HT on lipid profile, Outcome 15 Total cholesterol at 12 months.

Comparison 10 HT plus testosterone versus HT on lipid profile, Outcome 16 Triglyceride at 12 months.

Comparison 10 HT plus testosterone versus HT on lipid profile, Outcome 17 LDL cholesterol at 12 months.
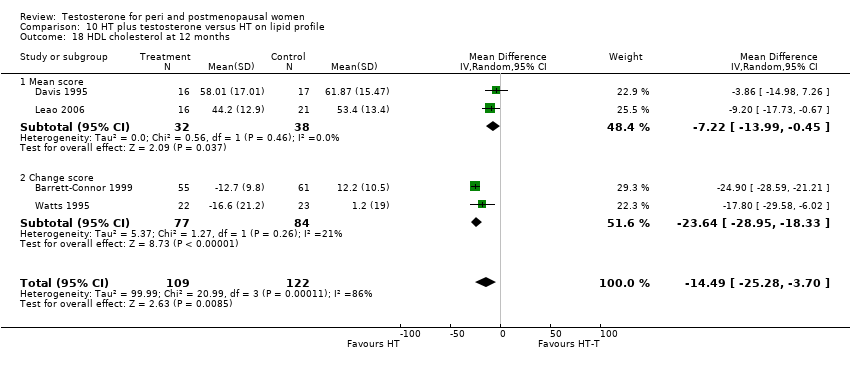
Comparison 10 HT plus testosterone versus HT on lipid profile, Outcome 18 HDL cholesterol at 12 months.
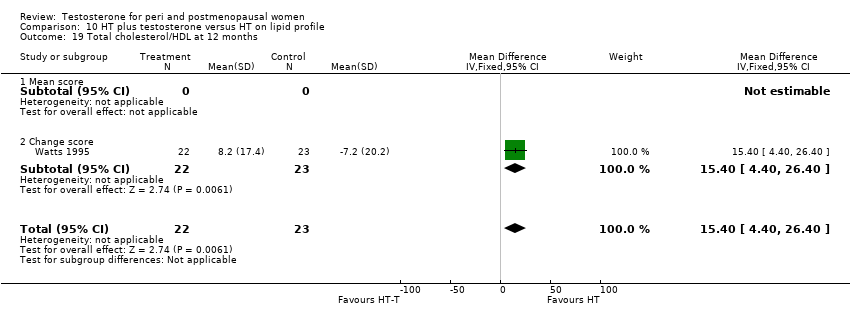
Comparison 10 HT plus testosterone versus HT on lipid profile, Outcome 19 Total cholesterol/HDL at 12 months.
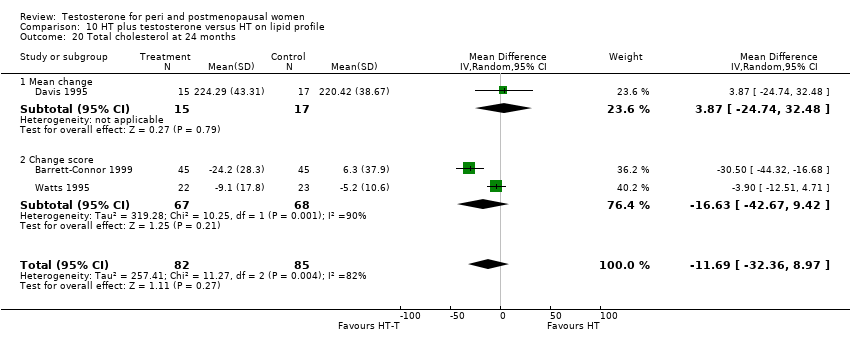
Comparison 10 HT plus testosterone versus HT on lipid profile, Outcome 20 Total cholesterol at 24 months.
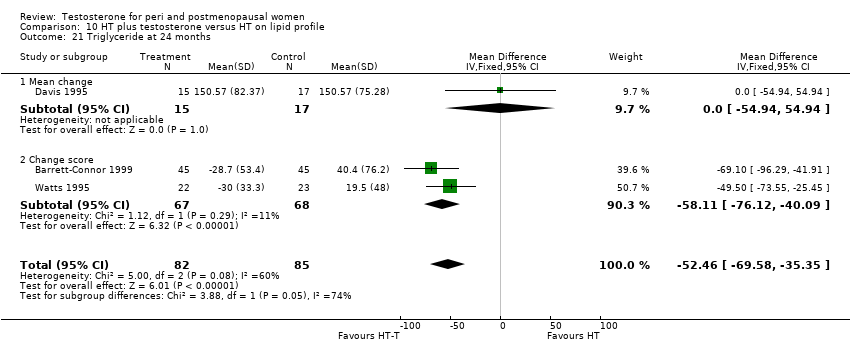
Comparison 10 HT plus testosterone versus HT on lipid profile, Outcome 21 Triglyceride at 24 months.

Comparison 10 HT plus testosterone versus HT on lipid profile, Outcome 22 LDL cholesterol at 24 months.

Comparison 10 HT plus testosterone versus HT on lipid profile, Outcome 23 HDL cholesterol at 24 months.
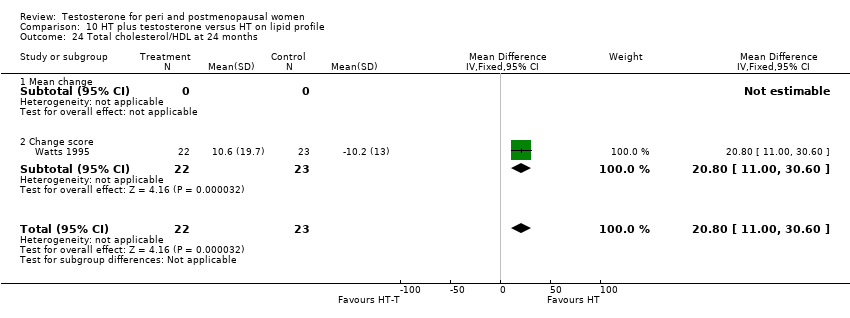
Comparison 10 HT plus testosterone versus HT on lipid profile, Outcome 24 Total cholesterol/HDL at 24 months.
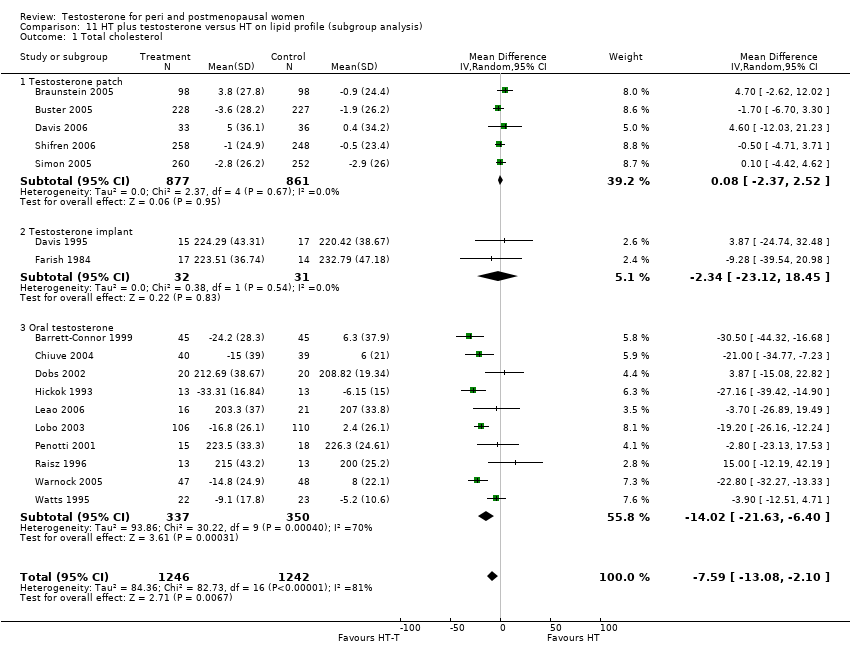
Comparison 11 HT plus testosterone versus HT on lipid profile (subgroup analysis), Outcome 1 Total cholesterol.

Comparison 11 HT plus testosterone versus HT on lipid profile (subgroup analysis), Outcome 2 HDL cholesterol.
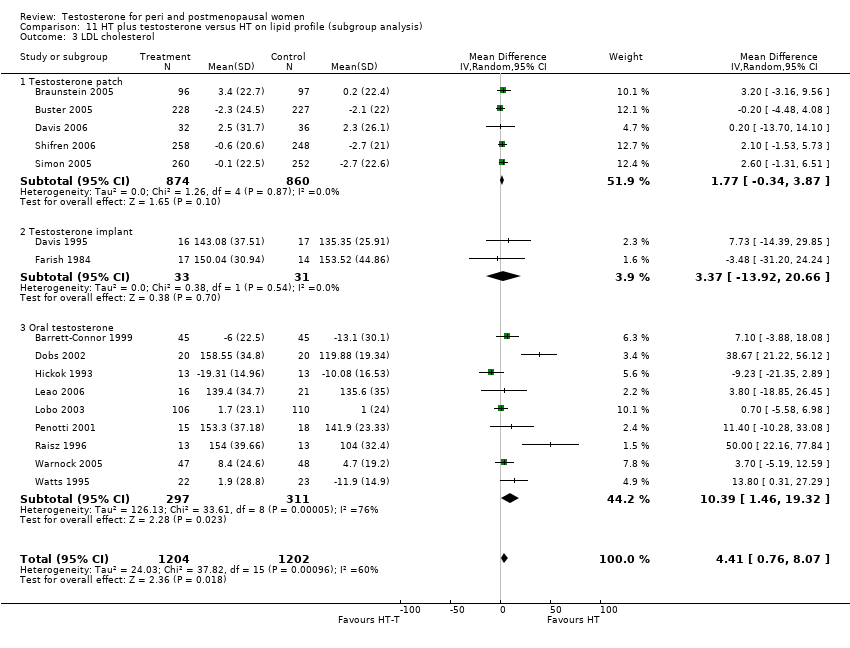
Comparison 11 HT plus testosterone versus HT on lipid profile (subgroup analysis), Outcome 3 LDL cholesterol.

Comparison 11 HT plus testosterone versus HT on lipid profile (subgroup analysis), Outcome 4 Triglyceride.
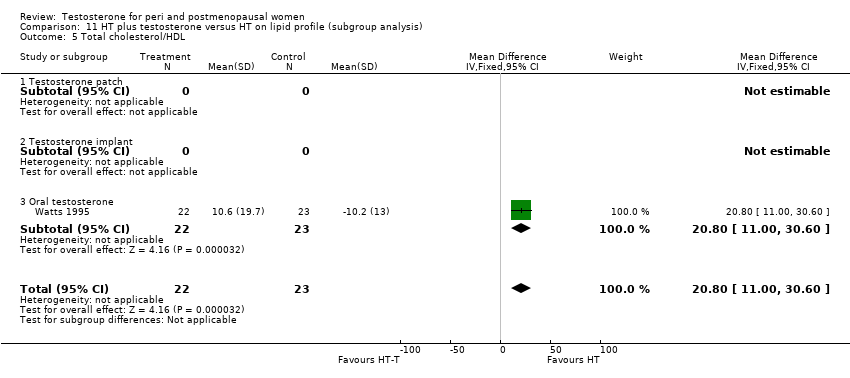
Comparison 11 HT plus testosterone versus HT on lipid profile (subgroup analysis), Outcome 5 Total cholesterol/HDL.

Comparison 12 HT plus testosterone versus HT on discontinuation rate, Outcome 1 Discontinuation rate (overall).
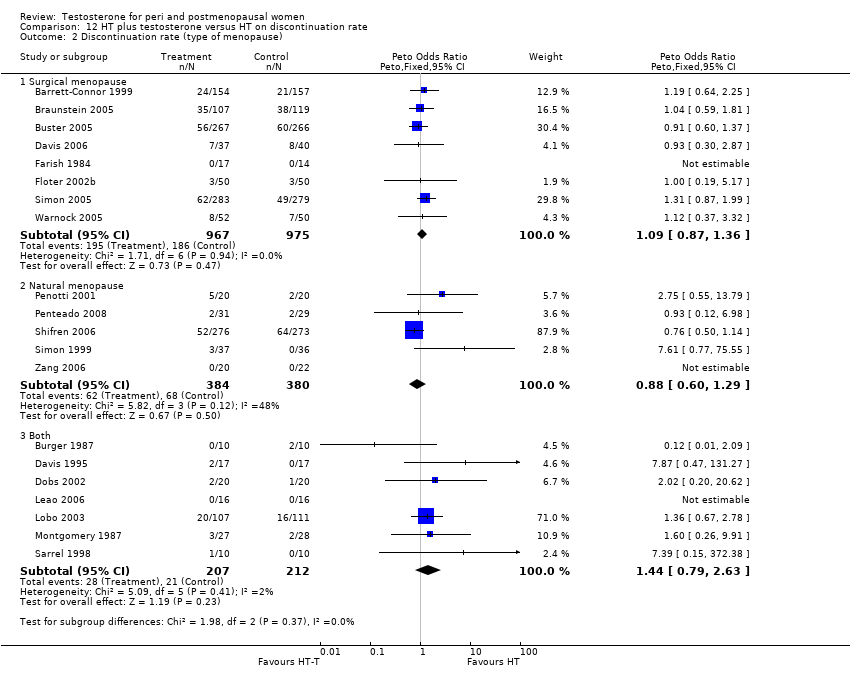
Comparison 12 HT plus testosterone versus HT on discontinuation rate, Outcome 2 Discontinuation rate (type of menopause).

Comparison 12 HT plus testosterone versus HT on discontinuation rate, Outcome 3 Discontinuation rate (menopausal status).

Comparison 12 HT plus testosterone versus HT on discontinuation rate, Outcome 4 Discontinuation rate (route of hormone therapy).
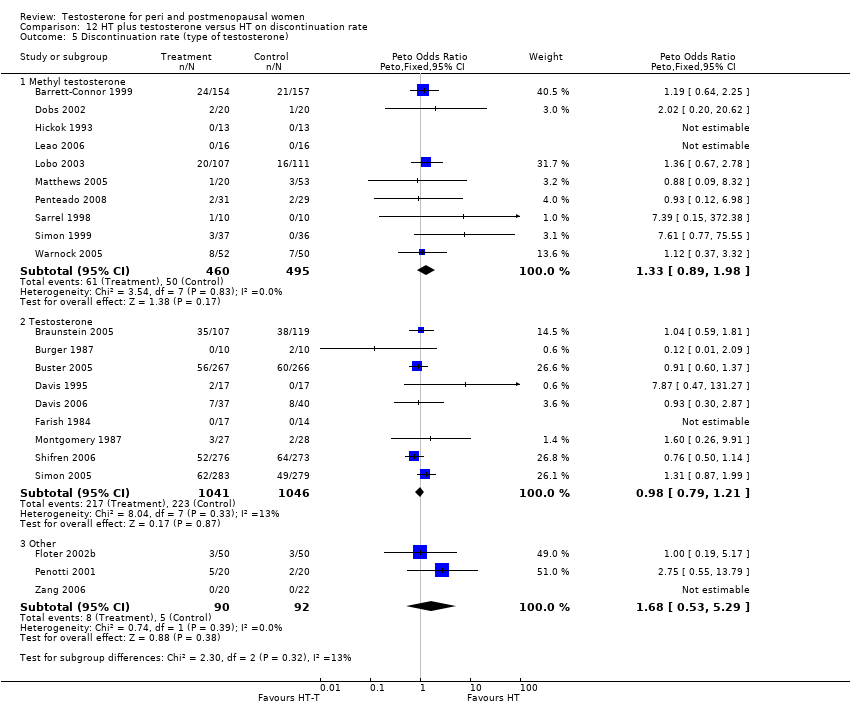
Comparison 12 HT plus testosterone versus HT on discontinuation rate, Outcome 5 Discontinuation rate (type of testosterone).
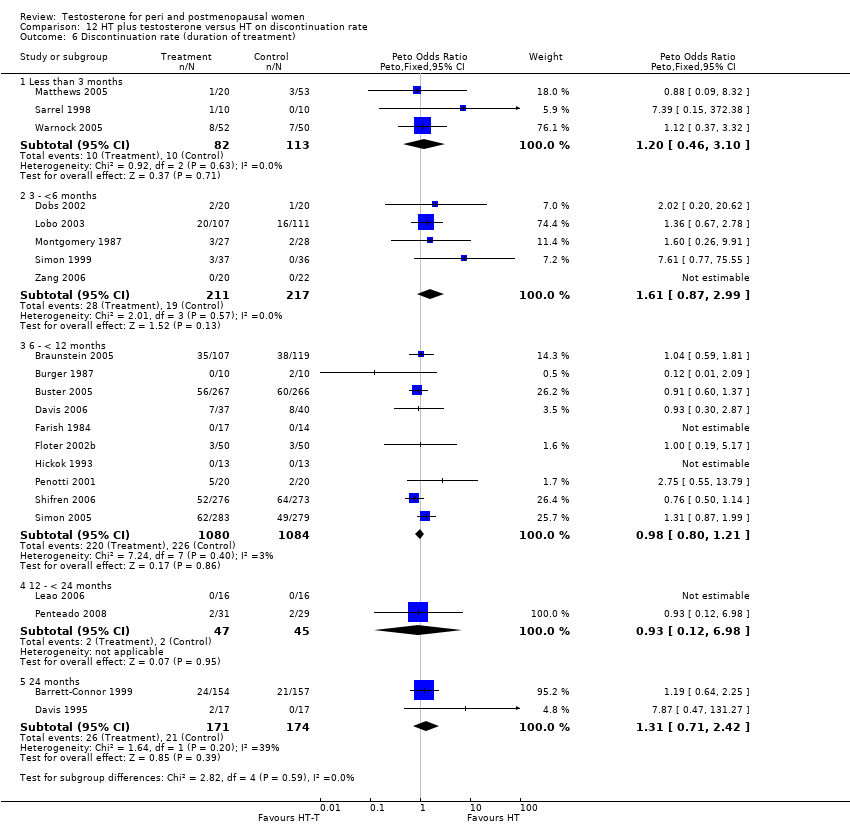
Comparison 12 HT plus testosterone versus HT on discontinuation rate, Outcome 6 Discontinuation rate (duration of treatment).

Comparison 12 HT plus testosterone versus HT on discontinuation rate, Outcome 7 Discontinuation rate (blinding).

Comparison 12 HT plus testosterone versus HT on discontinuation rate, Outcome 8 Discontinuation rate (disease status).
Comparison 13 HT plus testosterone versus HT on discontinuation rate due to adverse events, Outcome 1 Discontinuation rate due to adverse events (overall).

Comparison 13 HT plus testosterone versus HT on discontinuation rate due to adverse events, Outcome 2 Discontinuation rate due to adverse events (type of menopause).

Comparison 13 HT plus testosterone versus HT on discontinuation rate due to adverse events, Outcome 3 Discontinuation rate due to adverse events (menopausal status).

Comparison 13 HT plus testosterone versus HT on discontinuation rate due to adverse events, Outcome 4 Discontinuation rate due to adverse events (route of hormone therapy).

Comparison 13 HT plus testosterone versus HT on discontinuation rate due to adverse events, Outcome 5 Discontinuation rate due to adverse events (type of testosterone).

Comparison 13 HT plus testosterone versus HT on discontinuation rate due to adverse events, Outcome 6 Discontinuation rate due to adverse events (duration of treatment).

Comparison 13 HT plus testosterone versus HT on discontinuation rate due to adverse events, Outcome 7 Discontinuation rate due to adverse events (blinding).
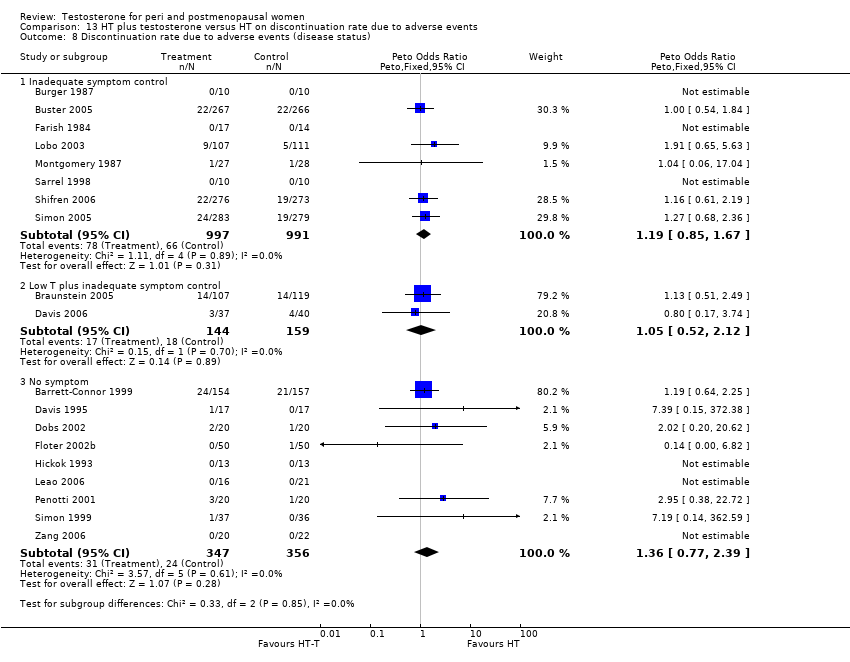
Comparison 13 HT plus testosterone versus HT on discontinuation rate due to adverse events, Outcome 8 Discontinuation rate due to adverse events (disease status).

Comparison 14 HT‐T versus HT on discontinuation rate (sensitivity analysis), Outcome 1 Discontinuation rate (allocation quality).

Comparison 14 HT‐T versus HT on discontinuation rate (sensitivity analysis), Outcome 2 Discontinuation rate due to adverse events (allocation quality).

Comparison 14 HT‐T versus HT on discontinuation rate (sensitivity analysis), Outcome 3 Discontinuation rate (quality of randomisation)).
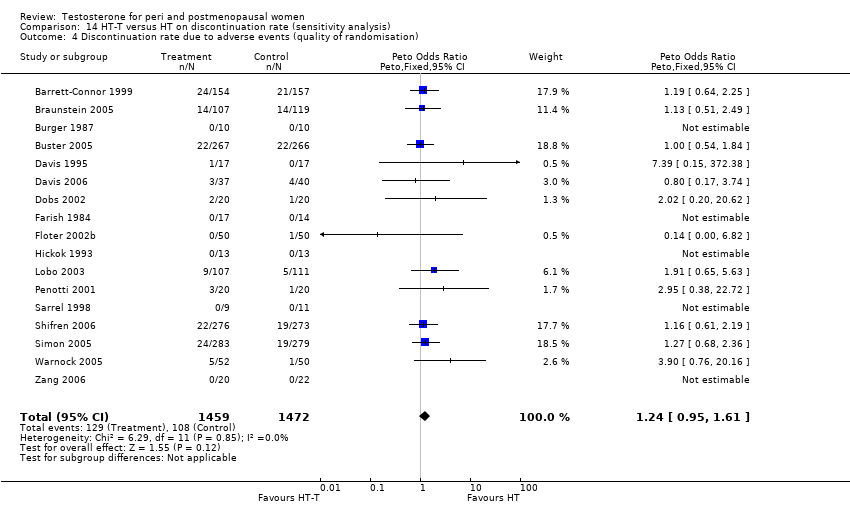
Comparison 14 HT‐T versus HT on discontinuation rate (sensitivity analysis), Outcome 4 Discontinuation rate due to adverse events (quality of randomisation).

Comparison 14 HT‐T versus HT on discontinuation rate (sensitivity analysis), Outcome 5 Discontinuation rate (blinding method).
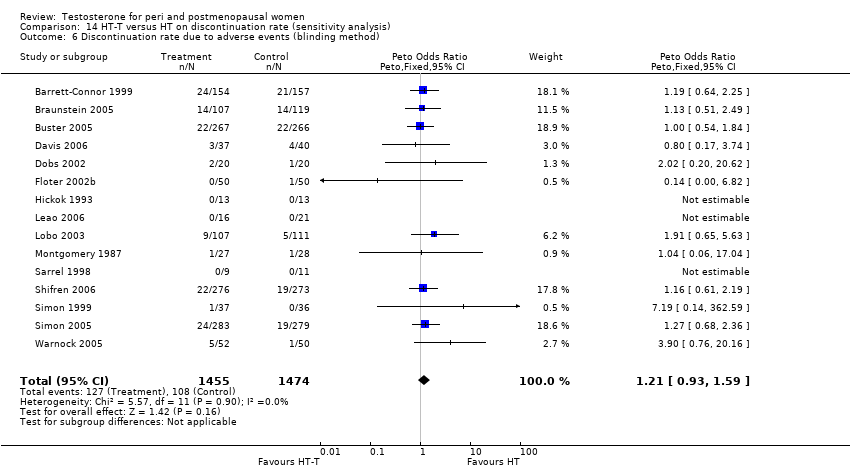
Comparison 14 HT‐T versus HT on discontinuation rate (sensitivity analysis), Outcome 6 Discontinuation rate due to adverse events (blinding method).
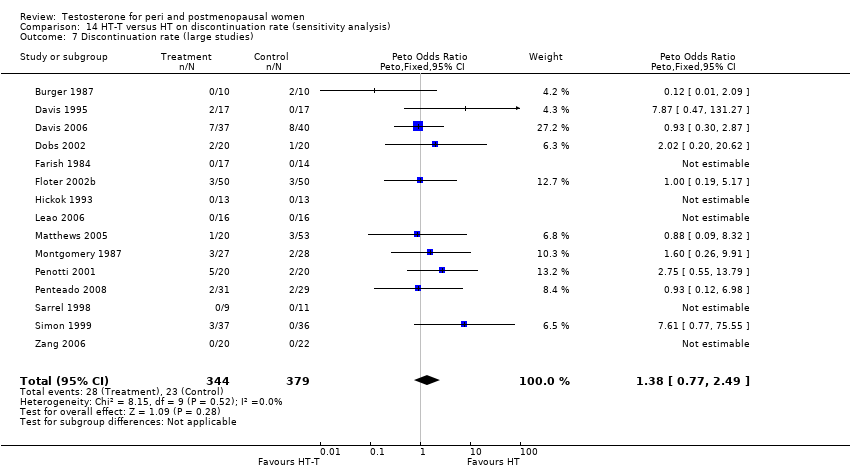
Comparison 14 HT‐T versus HT on discontinuation rate (sensitivity analysis), Outcome 7 Discontinuation rate (large studies).

Comparison 14 HT‐T versus HT on discontinuation rate (sensitivity analysis), Outcome 8 Discontinuation rate due to adverse events (large studies).

Comparison 14 HT‐T versus HT on discontinuation rate (sensitivity analysis), Outcome 9 Discontinuation rate (methyl testosterone doses).
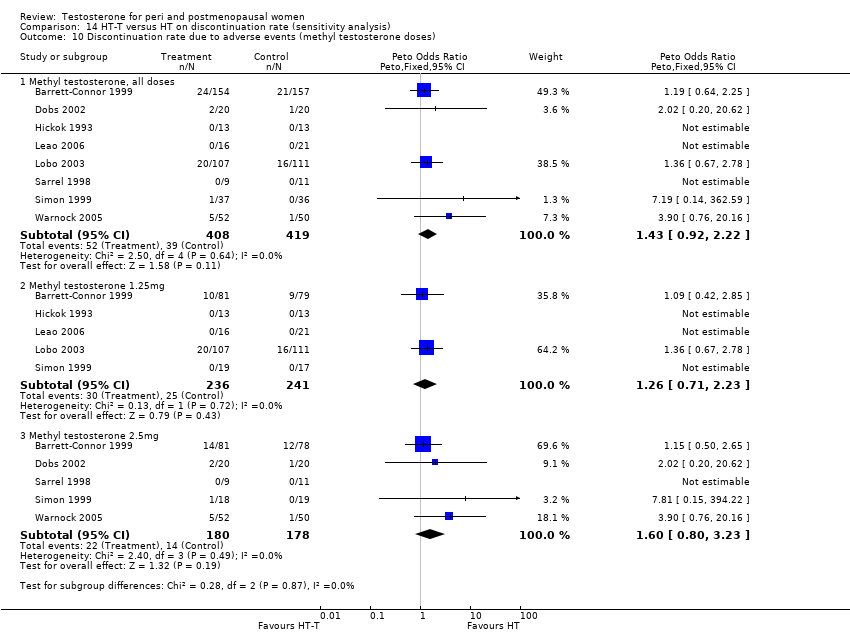
Comparison 14 HT‐T versus HT on discontinuation rate (sensitivity analysis), Outcome 10 Discontinuation rate due to adverse events (methyl testosterone doses).
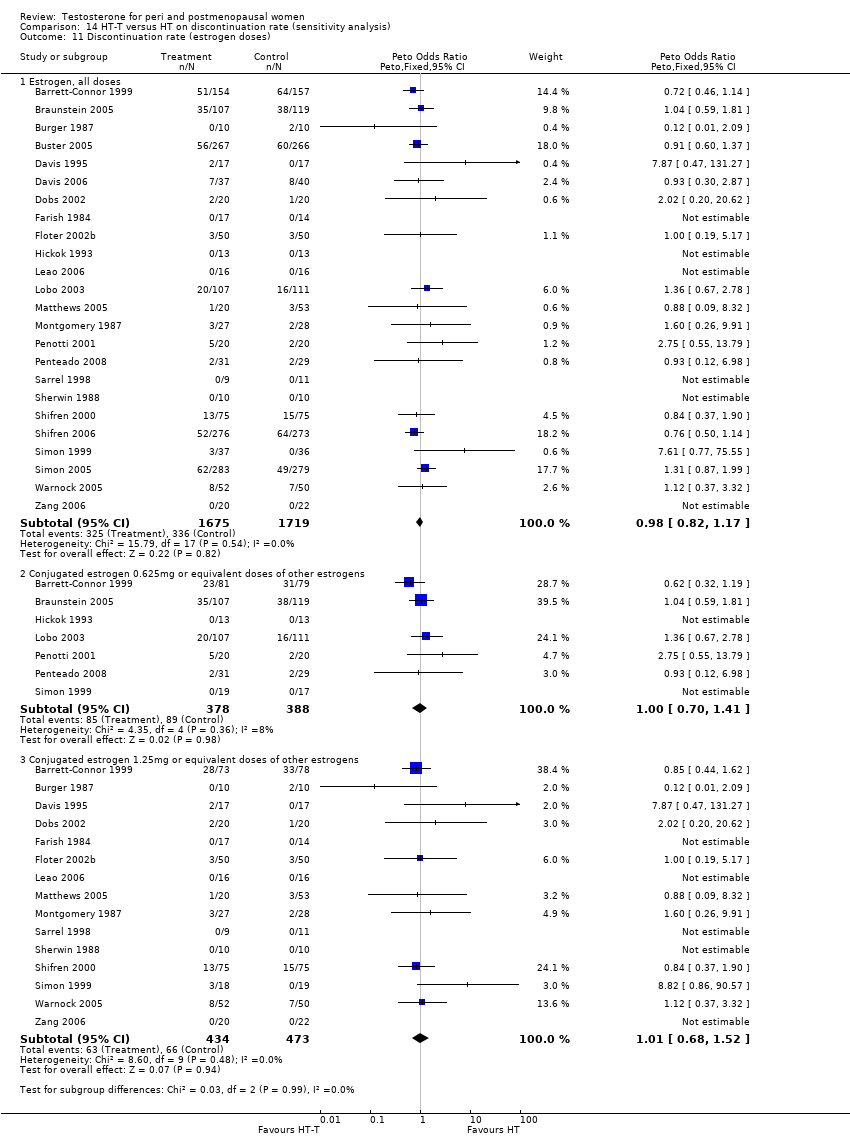
Comparison 14 HT‐T versus HT on discontinuation rate (sensitivity analysis), Outcome 11 Discontinuation rate (estrogen doses).

Comparison 14 HT‐T versus HT on discontinuation rate (sensitivity analysis), Outcome 12 Discontinuation rate due to adverse events (estrogen doses).
| Outcome | Study ID | N | Reason | Conclusion |
| Acne | 291 | The data was not available | Acne of mild or moderate severity was reported by 5 (3%) estrogen‐testosterone treated participants, whereas no participants receiving oestrogen reported acne | |
| Biochemical Markers of bone metabolism | 50 | A crossover study with no washout period | Both treatments had similar effects, with a significant decrease in bone resorption (ICTP) and bone turnover (osteocalcin) after 24 weeks. | |
| Biochemical markers of bone metabolism | 57 | The data was likely to be skewed because the means were smaller than twice the SDs | There were no between group differences noted in baseline Dpd levels(p=0.111), Dpd% change (P=0.338), baseline NTx levels (P=0.112), or NTx % change (P=0.271) | |
| Biochemical markers of bone metabolism | 28 | The data was not available | The effects of oestrogen‐testosterone and oestrogen alone on markers of bone resorption were generally similar. The increase in bone formation markers after oestrogen‐testosterone treatment was significantly different from the effect of oestrogen for all bone formation parameters. | |
| Bone mineral density of lumbar spine and femur | 199 | The data was not available | BMD increased in the estrogen‐testosterone(low dose) were comparable to those in the oestrogen(low dose) group, while the BMD changes at 24 months in the estrogen‐testosterone(high dose) group significantly exceeded those in oestrogen(high dose) group(P=0.014 for lumbar spine, BMD and P=0.009 for total hip BMD) | |
| Bone mineral density | 50 | A crossover study with no washout period. | No changes in BMD were noted in the total body, hip, or lumbar spine with either regimen | |
| Bone mineral density | 50 | The data was not available. | There was no significant differences in bone density at any of the sites measured between women receiving oestrogen alone and those receiving estrogen‐testosterone. No treated subjects had a significant bone loss(more than twice the measurement precision) at either spine or femoral neck at 1 year, but three in each treated group showed a small but non significant decrease at both sites | |
| Bone mineral density of L1‐L4, femur and forearm | 48 | The data was not available | The estrogen‐testosterone showed significant increases in spinal BMD at 12 and 24 months(P<0.01). The estrogen group demonstrated a non significant increase in spinal BMD. The difference between groups was not significant at 12 or 24 months. There were no significant changes in BMD from baseline in either group at the radius, femoral neck, Ward triangle, or greater trochanter | |
| Body composition | 40 | It was unclear with regard to the standard deviation (SD) of the data | ‐ When compared with oestrogen alone, estrogen‐testosterone treatment significantly increased lean body mass in the arms, legs, and trunk. Body fat percentage decreased significantly from baseline in the same arms, legs, and trunk in the oestrogen‐testosterone group but not the oestrogen alone group. When changes in arms, legs, and trunk in each participant were analysed simultaneously, the difference between treatments was significant for lean body mass(P=0.007) and percentage of fat tissue(P=0.077) | |
| Body composition | 50 | A crossover study with no washout period | There was no significant differences in total body fat, total lean body mass, trunk fat, and trunk lean mass between the two treatments | |
| Body composition | 37 | The data was likely to be skewed | When compared to HT alone, T‐HT treatment significantly increased visceral fat area (P = 0.009). However there was no significant difference in subcutaneous fat area between the two groups | |
| Cognition and psychological well being | 42 | A crossover study with no washout period | Switching Attention Test that mean reaction time in the switching condition was faster in the estrogen‐testosterone group than in the estrogen group(t=3.25, df=37, P<0.002, effect size = 0.53 SD). For other conditions of the same test, such as side condition and direction condition, they did not differ between two groups. | |
| Cognition | 49 | The data was not available | There was no comparative effects between oestrogen‐testosterone and oestrogen alone group. | |
| Cognition | 30 | The data was likely to be skewed | No significant interactions were found showing an advantage for oestrogen‐testosterone treated group as contrasted to oestrogen‐treated group | |
| Cognition (Cube Comparisons and Building Memory) | 26 | The data was likely to be skewed | Differences in task performance between women receiving E or E‐T treatment were assessed with a 2‐factor(treatment group x test session), mixed analysis of variance for each cognitive task. Post hoc comparisons were conducted using Tukey's method of multiple comparisons. With regard to Cube Comparisons, performance improved for both groups across test sessions, however this improvement only approached statistical significance (P=0.09). No other effects were significant. Regarding Building Memory, a main effect of test session was observed, with performance declining across sessions for both groups(P<0.01). A treatment x test session interaction was observed(P<0.05). Post hoc comparison revealed that this effect was due to a decrease in the E group(P<0.05) but not The E‐T group(P>0.1) across sessions. | |
| Hematocrit | 199 | The data was not available. | There was no clinically significant difference in haematology | |
| Hematocrit | 50 | A cross‐over study with no washout period | They reported that there was no change in blood counts during the study | |
| Hematocrit | 26 | The data was not available. | ‐ At 6 months, statistically significant between‐group differences were seen for hematocrit. The difference was small in magnitude, remained within the normal ranges, and was not considered clinically significant. | |
| Hematocrit | 67 | A cross‐over study with no washout period | Transdermal testosterone treatment had no significant effects on blood counts | |
| Hematocrit | 48 | The data were not available | No clinically significant changes in hematologic indices | |
| Hirsutism | 199 | The data was not available | Changes in hair growth in the oestrogen‐testosterone(low dose) group were similar to those in the oestrogen(low dose) group, and there were no statistically significant differences in the hirsutism scores between the treatment groups. In the high‐dose groups only four participants treated with oestrogen‐testosterone and two treated with oestrogen reported hirsutism as an adverse event at month 12. At 24 months, 10 oestrogen‐testosterone‐treated and 3 oestrogen‐treated participants reported hirsutism as an adverse event | |
| Hirsutism and acne | 50 | A crossover study with no washout period | Incidences of hirsutism and acne were similar in two treatment groups | |
| Hirsutism and acne | 67 | A crossover study with no washout period | The hirsutism and acne scores did not change significantly during treatment. The mean facial depilation rate increased slightly during treatment with estrogen‐testosterone 300 microgram | |
| Lipid profile | 40 | The data was not available. | After 16 weeks of treatment, significant decreases in total cholesterol, HDL, and triglycerides occurred in the estrogen‐testosterone group. LDL values were virtually unchanged. The oestrogen group demonstrated the opposite effect on lipids, with a significant decrease in LDL and no meaningful change in the other lipid parameters | |
| Lipid profile | 50 | A crossover study with no washout period | Serum levels of total testosterone increased markedly from a baseline mean of 0.8–4.9 mmol/l during testosterone addition. Total and LDL‐cholesterol levels were significantly reduced by both treatments as also were those of Lp‐(a) although the difference was not significant. A 13% reduction in HDL‐cholesterol levels was found when testosterone was added, but no change with oestrogen alone. Triglyceride levels were increased by oestrogen treatment, but not affected by the combination of oestrogen plus testosterone | |
| Lipid profile | 56 | The data was not available | There were significant reductions in total cholesterol and LDL cholesterol in all groups. In estrogen‐testosterone‐treated group triglyceride levels increased 26.0% and HDL cholesterol levels decreased 9.0%. In contrast, with oestrogen therapy triglyceride levels decreased 9.0% and HDL cholesterol levels increased 9.0% | |
| Lipid profile | 57 | The data was likely to be skewed because the means were smaller than twice the SDs | The study found significant reductions in total cholesterol and LDL cholesterol in all groups. Triglyceride levels increased 26.0% and HDL cholesterol levels decreased 9.0% in estrogen‐testosterone‐treated group. In contrast, with oestrogens therapy triglyceride levels decreased 9.0% and HDL cholesterol levels increased 9.0% | |
| Lipid profile | 60 | A crossover study with no washout period | Total cholesterol, triglycerides, HDL and LDL revealed no significant differences between any of the periods or groups | |
| Menopausal symptoms, sense of well being and sexual function | 199 | The data were not available | Women in all treatment groups reported an improvement in menopausal symptoms and quality of life measures at 24 months. There was a non significant trend toward greater improvement in well being and sexual interest and higher scores on the modified menopausal rating scale in the oestrogen‐testosterone groups | |
| Menopausal symptoms and sexual function | 40 | The data were non‐normal distribution | There were no significant differences between treatments on any variable at either 2 months or 6 months after treatment | |
| Menopausal symptoms | 26 | The data were non‐normal distribution | There was no statistically significant difference between two treatments in menopausal symptoms | |
| Menopausal symptoms | 51 | The data were not available | Vasomotor symptoms were reduced by at least 75% after treatment in all groups | |
| Menopausal symptoms | 28 | The data was likely to be skewed | Both treatments significantly decreased somatic symptom scores, but only estrogen‐testosterone treatment provided significant relief of psychosomatic and psychological symptoms | |
| Menopausal symptoms | 20 | The data was not available | There was no statistical difference between the estrogen‐testosterone groups versus the oestrogen group | |
| Menopausal symptoms | 49 | The data was not available | There was no result for the comparative effect on hot flushes between estrogen‐testosterone and oestrogen alone | |
| Menopausal symptoms | 43 | The data were not available | Menopausal index: | |
| Menopausal symptoms | 92 | The data was not available | In general, estrogen‐testosterone therapy provided greater relief from these symptoms than oestrogen therapy. This was most apparent in the finding that the degree of vasomotor symptom relief with low dose estrogen‐testosterone preparation was similar to relief experienced with higher dose estrogen therapy alone. | |
| Menopausal symptoms | 66 | The data were not available | There were no significant differences in somatic symptoms between the oestrogen and estrogen‐testosterone groups at baseline or after treatment. Psychosomatic and psychologic symptom values are not presented because of the small number of evaluable symptomatic participants | |
| Mood (hostility) | 36 | The data were not available | Hostility scores did not differ significantly in the two groups (testosterone‐oestrogen or oestrogen alone) | |
| Sense of well being | 40 | The data were not available. | With regard to QUALMS questionnaire, the oestrogen‐testosterone group showed significant improvement from baseline in somatic symptoms(week 10, P=0.003; week 16, P=0.073). The oestrogen group showed significant improvement from baseline in well being (week 16, P= 0.049) and cognition (week 10, P=0.054) | |
| Sense of well being | 50 | A crossover study with no washout period | There were no significant differences between the treatments in any of the sub scores or total PGWB index | |
| Sense of well being | 84 | The data were likely to be skewed | There was no difference in SRD 30 scores between the two active treatment groups at either 2 or 4 months | |
| Sense of well being | 40 | The data were not available. | No conclusion on psycho‐physical well being. | |
| Sense of well being | 35 | A cross‐over study with no washout period | No significant effects of adding testosterone into hormone therapy | |
| Sense of well being | 43 | The data was not available. | Anxiety: There was no differences among any of the groups across time. | |
| Sense of well being | 65 | A crossover study with no washout period | Adding 300 microgram patch into oral oestrogen has a significant improvement in general well being by means of PGWB (P=0.04). There also were significant increases with oestrogen‐testosterone 300 microgram treatment for sub scales of positive well being and depressed mood. | |
| Sexual function | 20 | The data was not available. | After six weeks the loss of libido in the single implant group remained, while the combined group showed significant symptomatic relief(P<0.01). Eight in the single implant group chose to have a testosterone implant at the first follow up visit at 6 weeks; the other two stopped coming because of dissatisfaction with the treatment | |
| Sexual function | 40 | The data was not available. | The sample size was not powered, nor was entry criteria designed to assess sexual dysfunction parameters; however, there were significant results. In the oestrogen‐testosterone group, BISF‐W mean increases at each visit were statistically significant for frequency/psychosexual(P=0.05) and pleasure/orgasm(P=0.041) domains. The mean composite BISF‐W score increased in the oestrogen‐testosterone group, whereas the mean score in the estrogen group decreased. Although it appeared that the two treatment groups were not well balanced at baseline(the estrogen group seemed to have healthier sexual function at baseline than the estrogen‐testosterone group), the estrogen‐testosterone group showed significant improvement in sexual function compared with the estrogen group. | |
| Sexual function (total McCoy score) | 44 | A crossover study with no washout period | After 24 weeks of treatment, the addition of testosterone had a significantly better effect on the variables 'enjoyment of sex', 'satisfaction with frequency of sexual activity' and 'interest in sex'. The total McCoy score was significantly increased by both treatments, but the addition of testosterone exerted a stronger effect (P<0.05) | |
| Sexual function | 51 | The data was not available | Improvement (P<0.05) in sexual interest, sexual satisfaction, frequency of sexual intercourse and intensity and frequency of orgasm during sexual intercourse were reported in all groups except the estrogen alone group | |
| Sexual function | 60 | A cross‐over study with no washout period | The scores concerning frequency of sexual activity, orgasm and intercourse, sexual arousal, fantasies and enjoyment, satisfaction with orgasms, and interest in sex were all significantly improved for testosterone addition as compared to placebo both before and after crossover | |
| Sexual function(desire and satisfaction) | 33 | The data was not available | No difference between two groups was observed at any of the considered time points. | |
| Sexual function | 30 | The data was likely to be skewed | Oestrogen‐testosterone‐treated participants reported significantly less lack of sexual desire or interest to engage in sexual activity, compared to participants receiving oestrogen alone | |
| Sexual function | 43 | The data was not available | Women who received either of the androgen‐containing preparations had significantly higher scores than women in the estrogen and placebo groups(P<0.01) in association with their higher levels of plasma testosterone. Women in the estrogen‐testosterone and testosterone‐only group experienced a greater number of fantasies during every treatment than did women in the oestrogen and placebo group (P<0.01). During treatment phases, both androgen groups attained higher levels of sexual arousal than did the estrogen and placebo groups(P<0.01) | |
| Sexual function (scores) | 65 | A cross‐over study with no washout period | The mean composite score expressed as a percentage of the mean value for normal women, increased from 52(27) percent at baseline to 72(38) percent during estrogen treatment, 74(37) percent during treatment with estrogen plus 150 microgram of testosterone per day, and 81(37) percent during treatment with estrogen plus 300 microgram of testosterone per day(P=0.05 for the comparison with estrogen‐alone). The scores for thoughts‐desire, frequency of sexual activity, and pleasure‐orgasm were lowest at baseline and increased in a dose‐dependent fashion. With the estrogen plus testosterone 300 microgram, the increases in scores for frequency of sexual activity and pleasure‐orgasm were significantly greater than those with estrogen‐alone (P=0.03 for both comparisons). The score for problems affecting sexual function was 116%(48) of the normative mean at baseline and decreased to 98%(49) during treatment with estrogen plus 300 microgram of testosterone(P=0.07 for the comparison with oestrogen‐alone) | |
| Sexual function (the prevalence of particular types of sexual behavior) | 65 | A crossover study with no washout period | The percentage of women who reported having sexual fantasies at least once a week was 12% at baseline, 10% during oestrogen treatment, 18 percent during estrogen plus testosterone 150 microgram, and 24% during treatment with estrogen plus 300 microgram of testosterone. The percentage of women who reported masturbating at least once a week was 3%, 5% and 10% at baseline, estrogen treatment and estrogen plus testosterone treatment, respectively. Finally, the percentage of women who engaged in sexual intercourse at least once a week was 23% at baseline, 35% during treatment with either oestrogen‐alone or oestrogen plus 150 microgram of testosterone, and 41% during treatment with oestrogen plus 300 microgram of testosterone | |
| Unexplained fatigue (vitality) | 50 | A crossover study with no washout period | There was no significant difference between the treatments in vitality | |
| Unexplained fatigue (vitality) | 67 | A crossover study with no washout period | Vitality improved in women treated with testosterone patch combined with oral conjugated equine oestrogen | |
| Unexplained fatigue and sense of well being | 43 | The data was not available | Women in estrogen alone and placebo groups reported significantly lower ratings of energy level and well being than did those who received either of the androgen‐containing preparations (P<0.01) |
| Outcome or subgroup title | No. of studies | No. of participants | Statistical method | Effect size |
| 1 Sense of well‐being Show forest plot | 2 | Std. Mean Difference (IV, Fixed, 95% CI) | Subtotals only | |
| 1.1 sexual function | 2 | 160 | Std. Mean Difference (IV, Fixed, 95% CI) | 0.47 [0.15, 0.80] |
| 1.2 Cognitive difficulty | 1 | 95 | Std. Mean Difference (IV, Fixed, 95% CI) | 0.0 [‐0.40, 0.40] |
| 1.3 Somatic or physical symptoms | 2 | 164 | Std. Mean Difference (IV, Fixed, 95% CI) | 0.21 [‐0.11, 0.54] |
| 1.4 Anxiety or fear | 1 | 95 | Std. Mean Difference (IV, Fixed, 95% CI) | ‐0.30 [‐0.70, 0.11] |
| 1.5 Depressed mood | 1 | 95 | Std. Mean Difference (IV, Fixed, 95% CI) | 0.26 [‐0.14, 0.67] |
| 1.6 Vasomotor symptoms | 2 | 166 | Std. Mean Difference (IV, Fixed, 95% CI) | 0.24 [‐0.08, 0.56] |
| 1.7 Sleep problems | 1 | 95 | Std. Mean Difference (IV, Fixed, 95% CI) | 0.05 [‐0.35, 0.45] |
| 1.8 Menstrual symptoms | 1 | 95 | Std. Mean Difference (IV, Fixed, 95% CI) | ‐0.11 [‐0.52, 0.29] |
| 1.9 Attractiveness | 1 | 95 | Std. Mean Difference (IV, Fixed, 95% CI) | 0.18 [‐0.23, 0.58] |
| 1.10 Psychosocial | 1 | 70 | Std. Mean Difference (IV, Fixed, 95% CI) | ‐0.05 [‐0.57, 0.47] |
| Outcome or subgroup title | No. of studies | No. of participants | Statistical method | Effect size |
| 1 Change scores of sexual function Show forest plot | 9 | Std. Mean Difference (IV, Fixed, 95% CI) | Subtotals only | |
| 1.1 Number of satisfying | 5 | 1893 | Std. Mean Difference (IV, Fixed, 95% CI) | 0.29 [0.20, 0.38] |
| 1.2 Number of activity | 7 | 1946 | Std. Mean Difference (IV, Fixed, 95% CI) | 0.25 [0.17, 0.34] |
| 1.3 Number of orgasms | 5 | 1893 | Std. Mean Difference (IV, Fixed, 95% CI) | 0.30 [0.21, 0.39] |
| 1.4 Libido, desire or interest in sex | 9 | 2215 | Std. Mean Difference (IV, Fixed, 95% CI) | 0.35 [0.26, 0.43] |
| 1.5 Orgasm | 6 | 1872 | Std. Mean Difference (IV, Fixed, 95% CI) | 0.28 [0.19, 0.37] |
| 1.6 Arousal | 5 | 1845 | Std. Mean Difference (IV, Fixed, 95% CI) | 0.36 [0.27, 0.45] |
| 1.7 Pleasure or enjoyment of sex | 6 | 1641 | Std. Mean Difference (IV, Fixed, 95% CI) | 0.33 [0.22, 0.43] |
| 1.8 Sexual concerns | 5 | 1852 | Std. Mean Difference (IV, Fixed, 95% CI) | 0.32 [0.22, 0.41] |
| 1.9 Responsiveness | 8 | 2171 | Std. Mean Difference (IV, Fixed, 95% CI) | 0.32 [0.23, 0.40] |
| 1.10 Sexual self‐image | 5 | 1839 | Std. Mean Difference (IV, Fixed, 95% CI) | 0.26 [0.16, 0.35] |
| 1.11 Satisfaction | 1 | 32 | Std. Mean Difference (IV, Fixed, 95% CI) | 0.98 [0.24, 1.72] |
| 1.12 Fantasy | 1 | 32 | Std. Mean Difference (IV, Fixed, 95% CI) | 1.37 [0.59, 2.15] |
| 1.13 Frequency of desire | 1 | 96 | Std. Mean Difference (IV, Fixed, 95% CI) | 0.21 [‐0.19, 0.61] |
| 1.14 Composite score | 3 | 330 | Std. Mean Difference (IV, Fixed, 95% CI) | 0.41 [0.19, 0.63] |
| 2 Change scores of Personal Distress Scale Show forest plot | 5 | 1845 | Mean Difference (IV, Fixed, 95% CI) | ‐8.13 [‐10.59, ‐5.67] |
| 2.1 Personal Distress Scale | 5 | 1845 | Mean Difference (IV, Fixed, 95% CI) | ‐8.13 [‐10.59, ‐5.67] |
| Outcome or subgroup title | No. of studies | No. of participants | Statistical method | Effect size |
| 1 Lumbar BMDs at 12 months Show forest plot | 2 | Mean Difference (IV, Fixed, 95% CI) | Subtotals only | |
| 1.1 Mean score | 2 | 90 | Mean Difference (IV, Fixed, 95% CI) | ‐0.05 [‐0.11, 0.00] |
| 1.2 Change score | 1 | 57 | Mean Difference (IV, Fixed, 95% CI) | ‐0.40 [‐1.93, 1.13] |
| 2 Lumbar BMDs at 24 months Show forest plot | 1 | Mean Difference (IV, Fixed, 95% CI) | Subtotals only | |
| 2.1 Mean score | 0 | 0 | Mean Difference (IV, Fixed, 95% CI) | 0.0 [0.0, 0.0] |
| 2.2 Change score | 1 | 32 | Mean Difference (IV, Fixed, 95% CI) | ‐0.08 [‐0.19, 0.03] |
| 3 Femur BMDs at 12 months Show forest plot | 2 | Mean Difference (IV, Fixed, 95% CI) | Subtotals only | |
| 3.1 Mean score | 2 | 90 | Mean Difference (IV, Fixed, 95% CI) | ‐0.05 [‐0.09, ‐0.01] |
| 3.2 Change score | 1 | 57 | Mean Difference (IV, Fixed, 95% CI) | 1.4 [0.14, 2.66] |
| 4 Femur BMDs at 24 months Show forest plot | 1 | Mean Difference (IV, Fixed, 95% CI) | Subtotals only | |
| 4.1 Mean score | 1 | 32 | Mean Difference (IV, Fixed, 95% CI) | ‐0.07 [‐0.16, 0.02] |
| 4.2 Change score | 0 | 0 | Mean Difference (IV, Fixed, 95% CI) | 0.0 [0.0, 0.0] |
| Outcome or subgroup title | No. of studies | No. of participants | Statistical method | Effect size |
| 1 Weight Show forest plot | 3 | Mean Difference (IV, Fixed, 95% CI) | Subtotals only | |
| 1.1 Mean weight at the endpoint (3 months) | 1 | 42 | Mean Difference (IV, Fixed, 95% CI) | 1.30 [‐3.86, 6.46] |
| 1.2 Mean weight at the endpoint (6 months) | 1 | 37 | Mean Difference (IV, Fixed, 95% CI) | 5.40 [‐4.79, 15.59] |
| 1.3 Mean weight at the endpoint (12 months) | 1 | 37 | Mean Difference (IV, Fixed, 95% CI) | 6.30 [‐3.83, 16.43] |
| 1.4 Weight gain | 1 | 37 | Mean Difference (IV, Fixed, 95% CI) | 1.18 [‐0.25, 2.61] |
| 2 Body mass index Show forest plot | 2 | Mean Difference (IV, Fixed, 95% CI) | Subtotals only | |
| 2.1 Body mass index at 3 months | 1 | 42 | Mean Difference (IV, Fixed, 95% CI) | 1.0 [‐0.64, 2.64] |
| 2.2 Body mass index at 6 months | 1 | 37 | Mean Difference (IV, Fixed, 95% CI) | 1.60 [‐2.31, 5.51] |
| 2.3 Body mass index at 12 months | 1 | 37 | Mean Difference (IV, Fixed, 95% CI) | 2.10 [‐1.83, 6.03] |
| 3 Waist:hip ratio Show forest plot | 1 | Mean Difference (IV, Fixed, 95% CI) | Subtotals only | |
| 3.1 At 6 months | 1 | 37 | Mean Difference (IV, Fixed, 95% CI) | ‐0.05 [‐0.08, ‐0.02] |
| 3.2 At 12 months | 1 | 37 | Mean Difference (IV, Fixed, 95% CI) | ‐0.03 [‐0.06, 0.00] |
| Outcome or subgroup title | No. of studies | No. of participants | Statistical method | Effect size |
| 1 Cognitive performance Show forest plot | 1 | Mean Difference (IV, Fixed, 95% CI) | Subtotals only | |
| 1.1 Identical Pictures | 1 | 26 | Mean Difference (IV, Fixed, 95% CI) | ‐2.40 [‐6.67, 1.87] |
| 1.2 Shape Memory | 1 | 26 | Mean Difference (IV, Fixed, 95% CI) | 0.10 [‐2.19, 2.39] |
| 2 Cognition difficulty Show forest plot | 1 | 95 | Mean Difference (IV, Fixed, 95% CI) | 0.0 [‐0.21, 0.21] |
| Outcome or subgroup title | No. of studies | No. of participants | Statistical method | Effect size |
| 1 Vasomotor symptom Show forest plot | 2 | 166 | Mean Difference (IV, Fixed, 95% CI) | 0.09 [‐0.18, 0.37] |
| Outcome or subgroup title | No. of studies | No. of participants | Statistical method | Effect size |
| 1 Mean scores of facial and body hair growth Show forest plot | 1 | Mean Difference (IV, Fixed, 95% CI) | Subtotals only | |
| 2 Incidence of facial and body hair growth Show forest plot | 7 | 2127 | Peto Odds Ratio (Peto, Fixed, 95% CI) | 1.52 [1.07, 2.17] |
| Outcome or subgroup title | No. of studies | No. of participants | Statistical method | Effect size |
| 1 Mean scores of acne Show forest plot | 1 | 216 | Mean Difference (IV, Fixed, 95% CI) | 0.1 [‐0.03, 0.23] |
| 2 Incidence of acne Show forest plot | 7 | 2127 | Peto Odds Ratio (Peto, Fixed, 95% CI) | 1.51 [1.07, 2.14] |
| Outcome or subgroup title | No. of studies | No. of participants | Statistical method | Effect size |
| 1 Incidence of increased breast density Show forest plot | 1 | 87 | Odds Ratio (M‐H, Fixed, 95% CI) | 1.35 [0.46, 3.95] |
| 2 Area of dense breast Show forest plot | 1 | 87 | Mean Difference (IV, Fixed, 95% CI) | 0.0 [‐7.62, 7.62] |
| Outcome or subgroup title | No. of studies | No. of participants | Statistical method | Effect size |
| 1 Total cholesterol at less than 3 months Show forest plot | 4 | 231 | Mean Difference (IV, Random, 95% CI) | ‐14.92 [‐27.81, ‐2.03] |
| 2 Triglyceride at less than 3 months Show forest plot | 4 | Mean Difference (IV, Random, 95% CI) | Totals not selected | |
| 3 LDL cholesterol at less than 3 months Show forest plot | 3 | Mean Difference (IV, Random, 95% CI) | Totals not selected | |
| 4 HDL cholesterol at less than 3 months Show forest plot | 4 | 231 | Mean Difference (IV, Random, 95% CI) | ‐17.11 [‐23.47, ‐10.75] |
| 5 Total cholesterol at 3 ‐ <6 months Show forest plot | 2 | 256 | Mean Difference (IV, Random, 95% CI) | ‐9.42 [‐31.76, 12.93] |
| 5.1 Mean score | 1 | 40 | Mean Difference (IV, Random, 95% CI) | 3.87 [‐15.08, 22.82] |
| 5.2 Change score | 1 | 216 | Mean Difference (IV, Random, 95% CI) | ‐19.2 [‐26.16, ‐12.24] |
| 6 Triglyceride at 3 ‐ <6 months Show forest plot | 2 | 256 | Mean Difference (IV, Fixed, 95% CI) | ‐25.62 [‐38.53, ‐12.72] |
| 6.1 Mean score | 1 | 40 | Mean Difference (IV, Fixed, 95% CI) | ‐44.29 [‐85.55, ‐3.03] |
| 6.2 Change score | 1 | 216 | Mean Difference (IV, Fixed, 95% CI) | ‐23.6 [‐37.18, ‐10.02] |
| 7 LDL cholesterol at 3 ‐ <6 months Show forest plot | 2 | 256 | Mean Difference (IV, Random, 95% CI) | 18.78 [‐18.39, 55.94] |
| 7.1 Mean score | 1 | 40 | Mean Difference (IV, Random, 95% CI) | 38.67 [21.22, 56.12] |
| 7.2 Change score | 1 | 216 | Mean Difference (IV, Random, 95% CI) | 0.7 [‐5.58, 6.98] |
| 8 HDL cholesterol at 3 ‐ <6 months Show forest plot | 2 | 256 | Mean Difference (IV, Random, 95% CI) | ‐18.72 [‐26.04, ‐11.39] |
| 8.1 Mean score | 1 | 40 | Mean Difference (IV, Random, 95% CI) | ‐23.2 [‐30.19, ‐16.21] |
| 8.2 Change score | 1 | 216 | Mean Difference (IV, Random, 95% CI) | ‐15.60 [‐18.59, ‐12.61] |
| 9 Total cholesterol/HDL cholesterol at 3 ‐ <6 months | 0 | 0 | Mean Difference (IV, Fixed, 95% CI) | 0.0 [0.0, 0.0] |
| 10 Total cholesterol at 6 ‐ <12 months Show forest plot | 10 | 1910 | Mean Difference (IV, Random, 95% CI) | ‐2.93 [‐7.18, 1.32] |
| 10.1 Mean score | 3 | 101 | Mean Difference (IV, Random, 95% CI) | ‐6.27 [‐20.41, 7.88] |
| 10.2 Change score | 7 | 1809 | Mean Difference (IV, Random, 95% CI) | ‐2.74 [‐7.47, 2.00] |
| 11 Triglyceride at 6 ‐ <12 months Show forest plot | 10 | 1909 | Mean Difference (IV, Random, 95% CI) | ‐5.79 [‐14.25, 2.67] |
| 11.1 Mean score | 3 | 101 | Mean Difference (IV, Random, 95% CI) | 7.00 [‐8.74, 22.74] |
| 11.2 Change score | 7 | 1808 | Mean Difference (IV, Random, 95% CI) | ‐8.64 [‐18.40, 1.11] |
| 12 LDL cholesterol at 6 ‐ <12 months Show forest plot | 10 | 1906 | Mean Difference (IV, Fixed, 95% CI) | 1.86 [‐0.15, 3.87] |
| 12.1 Mean score | 3 | 101 | Mean Difference (IV, Fixed, 95% CI) | 3.24 [‐10.76, 17.23] |
| 12.2 Change score | 7 | 1805 | Mean Difference (IV, Fixed, 95% CI) | 1.83 [‐0.20, 3.86] |
| 13 HDL cholesterol at 6 ‐ <12 months Show forest plot | 10 | 1907 | Mean Difference (IV, Random, 95% CI) | ‐5.84 [‐9.10, ‐2.58] |
| 13.1 Mean score | 3 | 101 | Mean Difference (IV, Random, 95% CI) | ‐9.38 [‐13.64, ‐5.12] |
| 13.2 Change score | 7 | 1806 | Mean Difference (IV, Random, 95% CI) | ‐4.74 [‐8.42, ‐1.07] |
| 14 Total cholesterol/HDL at 6 ‐ <12 months Show forest plot | 1 | 45 | Mean Difference (IV, Fixed, 95% CI) | 20.6 [12.76, 28.44] |
| 14.1 Change score | 1 | 45 | Mean Difference (IV, Fixed, 95% CI) | 20.6 [12.76, 28.44] |
| 15 Total cholesterol at 12 months Show forest plot | 4 | 231 | Mean Difference (IV, Random, 95% CI) | ‐7.99 [‐23.45, 7.48] |
| 15.1 Mean score | 2 | 70 | Mean Difference (IV, Random, 95% CI) | 1.75 [‐15.03, 18.52] |
| 15.2 Change score | 2 | 161 | Mean Difference (IV, Random, 95% CI) | ‐14.35 [‐38.05, 9.35] |
| 16 Triglyceride at 12 months Show forest plot | 4 | 231 | Mean Difference (IV, Random, 95% CI) | ‐23.38 [‐55.53, 8.76] |
| 16.1 Mean score | 2 | 70 | Mean Difference (IV, Random, 95% CI) | 3.92 [‐21.60, 29.43] |
| 16.2 Change score | 2 | 161 | Mean Difference (IV, Random, 95% CI) | ‐45.29 [‐80.17, ‐10.40] |
| 17 LDL cholesterol at 12 months Show forest plot | 4 | 231 | Mean Difference (IV, Fixed, 95% CI) | 8.84 [2.13, 15.54] |
| 17.1 Mean score | 2 | 70 | Mean Difference (IV, Fixed, 95% CI) | 5.81 [‐10.02, 21.64] |
| 17.2 Change score | 2 | 161 | Mean Difference (IV, Fixed, 95% CI) | 9.50 [2.10, 16.90] |
| 18 HDL cholesterol at 12 months Show forest plot | 4 | 231 | Mean Difference (IV, Random, 95% CI) | ‐14.49 [‐25.28, ‐3.70] |
| 18.1 Mean score | 2 | 70 | Mean Difference (IV, Random, 95% CI) | ‐7.22 [‐13.99, ‐0.45] |
| 18.2 Change score | 2 | 161 | Mean Difference (IV, Random, 95% CI) | ‐23.64 [‐28.95, ‐18.33] |
| 19 Total cholesterol/HDL at 12 months Show forest plot | 1 | 45 | Mean Difference (IV, Fixed, 95% CI) | 15.40 [4.40, 26.40] |
| 19.1 Mean score | 0 | 0 | Mean Difference (IV, Fixed, 95% CI) | 0.0 [0.0, 0.0] |
| 19.2 Change score | 1 | 45 | Mean Difference (IV, Fixed, 95% CI) | 15.40 [4.40, 26.40] |
| 20 Total cholesterol at 24 months Show forest plot | 3 | 167 | Mean Difference (IV, Random, 95% CI) | ‐11.69 [‐32.36, 8.97] |
| 20.1 Mean change | 1 | 32 | Mean Difference (IV, Random, 95% CI) | 3.87 [‐24.74, 32.48] |
| 20.2 Change score | 2 | 135 | Mean Difference (IV, Random, 95% CI) | ‐16.63 [‐42.67, 9.42] |
| 21 Triglyceride at 24 months Show forest plot | 3 | 167 | Mean Difference (IV, Fixed, 95% CI) | ‐52.46 [‐69.58, ‐35.35] |
| 21.1 Mean change | 1 | 32 | Mean Difference (IV, Fixed, 95% CI) | 0.0 [‐54.94, 54.94] |
| 21.2 Change score | 2 | 135 | Mean Difference (IV, Fixed, 95% CI) | ‐58.11 [‐76.12, ‐40.09] |
| 22 LDL cholesterol at 24 months Show forest plot | 3 | 167 | Mean Difference (IV, Fixed, 95% CI) | 9.15 [1.09, 17.20] |
| 22.1 Mean change | 1 | 32 | Mean Difference (IV, Fixed, 95% CI) | 3.87 [‐20.94, 28.68] |
| 22.2 Change score | 2 | 135 | Mean Difference (IV, Fixed, 95% CI) | 9.77 [1.26, 18.29] |
| 23 HDL cholesterol at 24 months Show forest plot | 3 | 167 | Mean Difference (IV, Random, 95% CI) | ‐17.63 [‐31.45, ‐3.80] |
| 23.1 Mean change | 1 | 32 | Mean Difference (IV, Random, 95% CI) | 0.0 [‐11.76, 11.76] |
| 23.2 Change score | 2 | 135 | Mean Difference (IV, Random, 95% CI) | ‐26.34 [‐28.00, ‐22.69] |
| 24 Total cholesterol/HDL at 24 months Show forest plot | 1 | 45 | Mean Difference (IV, Fixed, 95% CI) | 20.80 [11.00, 30.60] |
| 24.1 Mean change | 0 | 0 | Mean Difference (IV, Fixed, 95% CI) | 0.0 [0.0, 0.0] |
| 24.2 Change score | 1 | 45 | Mean Difference (IV, Fixed, 95% CI) | 20.80 [11.00, 30.60] |
| Outcome or subgroup title | No. of studies | No. of participants | Statistical method | Effect size |
| 1 Total cholesterol Show forest plot | 17 | 2488 | Mean Difference (IV, Random, 95% CI) | ‐7.59 [‐13.08, ‐2.10] |
| 1.1 Testosterone patch | 5 | 1738 | Mean Difference (IV, Random, 95% CI) | 0.08 [‐2.37, 2.52] |
| 1.2 Testosterone implant | 2 | 63 | Mean Difference (IV, Random, 95% CI) | ‐2.34 [‐23.12, 18.45] |
| 1.3 Oral testosterone | 10 | 687 | Mean Difference (IV, Random, 95% CI) | ‐14.02 [‐21.63, ‐6.40] |
| 2 HDL cholesterol Show forest plot | 17 | Mean Difference (IV, Random, 95% CI) | Subtotals only | |
| 2.1 Testosterone patch | 5 | 1735 | Mean Difference (IV, Random, 95% CI) | ‐1.09 [‐1.98, ‐0.19] |
| 2.2 Testosterone implant | 2 | 63 | Mean Difference (IV, Random, 95% CI) | ‐5.01 [‐11.72, 1.70] |
| 2.3 Oral testosterone | 10 | 687 | Mean Difference (IV, Random, 95% CI) | ‐18.63 [‐22.18, ‐15.08] |
| 3 LDL cholesterol Show forest plot | 16 | 2406 | Mean Difference (IV, Random, 95% CI) | 4.41 [0.76, 8.07] |
| 3.1 Testosterone patch | 5 | 1734 | Mean Difference (IV, Random, 95% CI) | 1.77 [‐0.34, 3.87] |
| 3.2 Testosterone implant | 2 | 64 | Mean Difference (IV, Random, 95% CI) | 3.37 [‐13.92, 20.66] |
| 3.3 Oral testosterone | 9 | 608 | Mean Difference (IV, Random, 95% CI) | 10.39 [1.46, 19.32] |
| 4 Triglyceride Show forest plot | 17 | 2487 | Mean Difference (IV, Random, 95% CI) | ‐14.80 [‐23.24, ‐6.36] |
| 4.1 Testosterone patch | 5 | 1737 | Mean Difference (IV, Random, 95% CI) | ‐3.64 [‐8.73, 1.44] |
| 4.2 Testosterone implant | 2 | 63 | Mean Difference (IV, Random, 95% CI) | 9.10 [‐16.04, 34.24] |
| 4.3 Oral testosterone | 10 | 687 | Mean Difference (IV, Random, 95% CI) | ‐27.07 [‐41.44, ‐12.70] |
| 5 Total cholesterol/HDL Show forest plot | 1 | 45 | Mean Difference (IV, Fixed, 95% CI) | 20.80 [11.00, 30.60] |
| 5.1 Testosterone patch | 0 | 0 | Mean Difference (IV, Fixed, 95% CI) | 0.0 [0.0, 0.0] |
| 5.2 Testosterone implant | 0 | 0 | Mean Difference (IV, Fixed, 95% CI) | 0.0 [0.0, 0.0] |
| 5.3 Oral testosterone | 1 | 45 | Mean Difference (IV, Fixed, 95% CI) | 20.80 [11.00, 30.60] |
| Outcome or subgroup title | No. of studies | No. of participants | Statistical method | Effect size |
| 1 Discontinuation rate (overall) Show forest plot | 21 | 3124 | Peto Odds Ratio (Peto, Fixed, 95% CI) | 0.99 [0.83, 1.19] |
| 2 Discontinuation rate (type of menopause) Show forest plot | 20 | Peto Odds Ratio (Peto, Fixed, 95% CI) | Subtotals only | |
| 2.1 Surgical menopause | 8 | 1942 | Peto Odds Ratio (Peto, Fixed, 95% CI) | 1.09 [0.87, 1.36] |
| 2.2 Natural menopause | 5 | 764 | Peto Odds Ratio (Peto, Fixed, 95% CI) | 0.88 [0.60, 1.29] |
| 2.3 Both | 7 | 419 | Peto Odds Ratio (Peto, Fixed, 95% CI) | 1.44 [0.79, 2.63] |
| 3 Discontinuation rate (menopausal status) Show forest plot | 22 | Peto Odds Ratio (Peto, Fixed, 95% CI) | Subtotals only | |
| 3.1 Perimenopausal | 0 | 0 | Peto Odds Ratio (Peto, Fixed, 95% CI) | 0.0 [0.0, 0.0] |
| 3.2 Postmenopausal | 19 | 3076 | Peto Odds Ratio (Peto, Fixed, 95% CI) | 1.04 [0.86, 1.25] |
| 3.3 Both | 3 | 148 | Peto Odds Ratio (Peto, Fixed, 95% CI) | 3.26 [0.85, 12.47] |
| 4 Discontinuation rate (route of hormone therapy) Show forest plot | 22 | Peto Odds Ratio (Peto, Fixed, 95% CI) | Subtotals only | |
| 4.1 Oral HT | 13 | 1840 | Peto Odds Ratio (Peto, Fixed, 95% CI) | 1.01 [0.79, 1.30] |
| 4.2 Non‐oral HT | 7 | 289 | Peto Odds Ratio (Peto, Fixed, 95% CI) | 1.32 [0.62, 2.82] |
| 4.3 Oral and non‐oral HT | 2 | 1095 | Peto Odds Ratio (Peto, Fixed, 95% CI) | 1.09 [0.82, 1.46] |
| 5 Discontinuation rate (type of testosterone) Show forest plot | 22 | Peto Odds Ratio (Peto, Fixed, 95% CI) | Subtotals only | |
| 5.1 Methyl testosterone | 10 | 955 | Peto Odds Ratio (Peto, Fixed, 95% CI) | 1.33 [0.89, 1.98] |
| 5.2 Testosterone | 9 | 2087 | Peto Odds Ratio (Peto, Fixed, 95% CI) | 0.98 [0.79, 1.21] |
| 5.3 Other | 3 | 182 | Peto Odds Ratio (Peto, Fixed, 95% CI) | 1.68 [0.53, 5.29] |
| 6 Discontinuation rate (duration of treatment) Show forest plot | 22 | Peto Odds Ratio (Peto, Fixed, 95% CI) | Subtotals only | |
| 6.1 Less than 3 months | 3 | 195 | Peto Odds Ratio (Peto, Fixed, 95% CI) | 1.20 [0.46, 3.10] |
| 6.2 3 ‐ <6 months | 5 | 428 | Peto Odds Ratio (Peto, Fixed, 95% CI) | 1.61 [0.87, 2.99] |
| 6.3 6 ‐ < 12 months | 10 | 2164 | Peto Odds Ratio (Peto, Fixed, 95% CI) | 0.98 [0.80, 1.21] |
| 6.4 12 ‐ < 24 months | 2 | 92 | Peto Odds Ratio (Peto, Fixed, 95% CI) | 0.93 [0.12, 6.98] |
| 6.5 24 months | 2 | 345 | Peto Odds Ratio (Peto, Fixed, 95% CI) | 1.31 [0.71, 2.42] |
| 7 Discontinuation rate (blinding) Show forest plot | 22 | Peto Odds Ratio (Peto, Fixed, 95% CI) | Subtotals only | |
| 7.1 Double‐blind | 18 | 3088 | Peto Odds Ratio (Peto, Fixed, 95% CI) | 1.05 [0.87, 1.26] |
| 7.2 Open or single‐blind | 4 | 136 | Peto Odds Ratio (Peto, Fixed, 95% CI) | 1.85 [0.53, 6.49] |
| 8 Discontinuation rate (disease status) Show forest plot | 21 | Peto Odds Ratio (Peto, Fixed, 95% CI) | Subtotals only | |
| 8.1 Inadequate symptom control | 9 | 2048 | Peto Odds Ratio (Peto, Fixed, 95% CI) | 1.00 [0.80, 1.25] |
| 8.2 Low T plus inadequate symptom control | 2 | 303 | Peto Odds Ratio (Peto, Fixed, 95% CI) | 1.02 [0.62, 1.67] |
| 8.3 No symptom | 10 | 771 | Peto Odds Ratio (Peto, Fixed, 95% CI) | 1.49 [0.90, 2.46] |
| Outcome or subgroup title | No. of studies | No. of participants | Statistical method | Effect size |
| 1 Discontinuation rate due to adverse events (overall) Show forest plot | 20 | 3096 | Peto Odds Ratio (Peto, Fixed, 95% CI) | 1.24 [0.95, 1.62] |
| 2 Discontinuation rate due to adverse events (type of menopause) Show forest plot | 19 | Peto Odds Ratio (Peto, Fixed, 95% CI) | Subtotals only | |
| 2.1 Surgical menopause | 8 | 1942 | Peto Odds Ratio (Peto, Fixed, 95% CI) | 1.16 [0.85, 1.59] |
| 2.2 Natural menopause | 4 | 704 | Peto Odds Ratio (Peto, Fixed, 95% CI) | 1.31 [0.72, 2.39] |
| 2.3 Both | 7 | 424 | Peto Odds Ratio (Peto, Fixed, 95% CI) | 1.94 [0.79, 4.78] |
| 3 Discontinuation rate due to adverse events (menopausal status) Show forest plot | 20 | Peto Odds Ratio (Peto, Fixed, 95% CI) | Subtotals only | |
| 3.1 Perimenopausal | 0 | 0 | Peto Odds Ratio (Peto, Fixed, 95% CI) | 0.0 [0.0, 0.0] |
| 3.2 Postmenopausal | 17 | 2948 | Peto Odds Ratio (Peto, Fixed, 95% CI) | 1.24 [0.95, 1.61] |
| 3.3 Both | 3 | 148 | Peto Odds Ratio (Peto, Fixed, 95% CI) | 1.99 [0.20, 19.45] |
| 4 Discontinuation rate due to adverse events (route of hormone therapy) Show forest plot | 19 | Peto Odds Ratio (Peto, Fixed, 95% CI) | Subtotals only | |
| 4.1 Oral HT | 11 | 1707 | Peto Odds Ratio (Peto, Fixed, 95% CI) | 1.31 [0.92, 1.86] |
| 4.2 Non‐oral HT | 7 | 294 | Peto Odds Ratio (Peto, Fixed, 95% CI) | 1.42 [0.48, 4.20] |
| 4.3 Oral and non‐oral HT | 2 | 606 | Peto Odds Ratio (Peto, Fixed, 95% CI) | 1.04 [0.57, 1.92] |
| 5 Discontinuation rate due to adverse events (type of testosterone) Show forest plot | 20 | Peto Odds Ratio (Peto, Fixed, 95% CI) | Subtotals only | |
| 5.1 Methyl testosterone | 8 | 827 | Peto Odds Ratio (Peto, Fixed, 95% CI) | 1.56 [0.94, 2.57] |
| 5.2 Testosterone | 9 | 2087 | Peto Odds Ratio (Peto, Fixed, 95% CI) | 1.13 [0.82, 1.55] |
| 5.3 Other | 3 | 182 | Peto Odds Ratio (Peto, Fixed, 95% CI) | 1.53 [0.25, 9.35] |
| 6 Discontinuation rate due to adverse events (duration of treatment) Show forest plot | 20 | Peto Odds Ratio (Peto, Fixed, 95% CI) | Subtotals only | |
| 6.1 Less than 3 months | 2 | 122 | Peto Odds Ratio (Peto, Fixed, 95% CI) | 3.90 [0.76, 20.16] |
| 6.2 3 ‐ < 6 months | 5 | 428 | Peto Odds Ratio (Peto, Fixed, 95% CI) | 1.94 [0.79, 4.77] |
| 6.3 6 ‐ < 12 months | 10 | 2164 | Peto Odds Ratio (Peto, Fixed, 95% CI) | 1.13 [0.82, 1.54] |
| 6.4 12 ‐ <24 months | 1 | 37 | Peto Odds Ratio (Peto, Fixed, 95% CI) | 0.0 [0.0, 0.0] |
| 6.5 24 months | 2 | 345 | Peto Odds Ratio (Peto, Fixed, 95% CI) | 1.25 [0.67, 2.33] |
| 7 Discontinuation rate due to adverse events (blinding) Show forest plot | 20 | Peto Odds Ratio (Peto, Fixed, 95% CI) | Subtotals only | |
| 7.1 Double‐blind | 16 | 2960 | Peto Odds Ratio (Peto, Fixed, 95% CI) | 1.21 [0.93, 1.59] |
| 7.2 Open or single‐blind | 4 | 136 | Peto Odds Ratio (Peto, Fixed, 95% CI) | 3.59 [0.59, 21.94] |
| 8 Discontinuation rate due to adverse events (disease status) Show forest plot | 19 | Peto Odds Ratio (Peto, Fixed, 95% CI) | Subtotals only | |
| 8.1 Inadequate symptom control | 8 | 1988 | Peto Odds Ratio (Peto, Fixed, 95% CI) | 1.19 [0.85, 1.67] |
| 8.2 Low T plus inadequate symptom control | 2 | 303 | Peto Odds Ratio (Peto, Fixed, 95% CI) | 1.05 [0.52, 2.12] |
| 8.3 No symptom | 9 | 703 | Peto Odds Ratio (Peto, Fixed, 95% CI) | 1.36 [0.77, 2.39] |
| Outcome or subgroup title | No. of studies | No. of participants | Statistical method | Effect size |
| 1 Discontinuation rate (allocation quality) Show forest plot | 14 | 2773 | Peto Odds Ratio (Peto, Fixed, 95% CI) | 0.98 [0.81, 1.17] |
| 2 Discontinuation rate due to adverse events (allocation quality) Show forest plot | 14 | 2778 | Peto Odds Ratio (Peto, Fixed, 95% CI) | 1.20 [0.91, 1.57] |
| 3 Discontinuation rate (quality of randomisation)) Show forest plot | 17 | 2902 | Peto Odds Ratio (Peto, Fixed, 95% CI) | 0.97 [0.81, 1.16] |
| 4 Discontinuation rate due to adverse events (quality of randomisation) Show forest plot | 17 | 2931 | Peto Odds Ratio (Peto, Fixed, 95% CI) | 1.24 [0.95, 1.61] |
| 5 Discontinuation rate (blinding method) Show forest plot | 17 | 3057 | Peto Odds Ratio (Peto, Fixed, 95% CI) | 0.97 [0.81, 1.17] |
| 6 Discontinuation rate due to adverse events (blinding method) Show forest plot | 15 | 2929 | Peto Odds Ratio (Peto, Fixed, 95% CI) | 1.21 [0.93, 1.59] |
| 7 Discontinuation rate (large studies) Show forest plot | 15 | 723 | Peto Odds Ratio (Peto, Fixed, 95% CI) | 1.38 [0.77, 2.49] |
| 8 Discontinuation rate due to adverse events (large studies) Show forest plot | 13 | 595 | Peto Odds Ratio (Peto, Fixed, 95% CI) | 1.44 [0.57, 3.64] |
| 9 Discontinuation rate (methyl testosterone doses) Show forest plot | 10 | Peto Odds Ratio (Peto, Fixed, 95% CI) | Subtotals only | |
| 9.1 Methyl testosterone, all doses | 10 | 955 | Peto Odds Ratio (Peto, Fixed, 95% CI) | 0.96 [0.68, 1.35] |
| 9.2 Methyl testosterone 1.25mg | 5 | 473 | Peto Odds Ratio (Peto, Fixed, 95% CI) | 0.89 [0.55, 1.43] |
| 9.3 Methyl testosterone 2 mg | 1 | 60 | Peto Odds Ratio (Peto, Fixed, 95% CI) | 0.93 [0.12, 6.98] |
| 9.4 Methyl testosterone 2.5mg | 6 | 431 | Peto Odds Ratio (Peto, Fixed, 95% CI) | 0.95 [0.57, 1.58] |
| 10 Discontinuation rate due to adverse events (methyl testosterone doses) Show forest plot | 8 | Peto Odds Ratio (Peto, Fixed, 95% CI) | Subtotals only | |
| 10.1 Methyl testosterone, all doses | 8 | 827 | Peto Odds Ratio (Peto, Fixed, 95% CI) | 1.43 [0.92, 2.22] |
| 10.2 Methyl testosterone 1.25mg | 5 | 477 | Peto Odds Ratio (Peto, Fixed, 95% CI) | 1.26 [0.71, 2.23] |
| 10.3 Methyl testosterone 2.5mg | 5 | 358 | Peto Odds Ratio (Peto, Fixed, 95% CI) | 1.60 [0.80, 3.23] |
| 11 Discontinuation rate (estrogen doses) Show forest plot | 24 | Peto Odds Ratio (Peto, Fixed, 95% CI) | Subtotals only | |
| 11.1 Estrogen, all doses | 24 | 3394 | Peto Odds Ratio (Peto, Fixed, 95% CI) | 0.98 [0.82, 1.17] |
| 11.2 Conjugated estrogen 0.625mg or equivalent doses of other estrogens | 7 | 766 | Peto Odds Ratio (Peto, Fixed, 95% CI) | 1.00 [0.70, 1.41] |
| 11.3 Conjugated estrogen 1.25mg or equivalent doses of other estrogens | 15 | 907 | Peto Odds Ratio (Peto, Fixed, 95% CI) | 1.01 [0.68, 1.52] |
| 12 Discontinuation rate due to adverse events (estrogen doses) Show forest plot | 22 | Peto Odds Ratio (Peto, Fixed, 95% CI) | Subtotals only | |
| 12.1 Estrogen, all doses | 22 | 3266 | Peto Odds Ratio (Peto, Fixed, 95% CI) | 1.22 [0.93, 1.58] |
| 12.2 Conjugated estrogen 0.625mg or equivalent doses of other estrogens | 6 | 706 | Peto Odds Ratio (Peto, Fixed, 95% CI) | 1.34 [0.80, 2.24] |
| 12.3 Conjugated estrogen 1.25mg or equivalent doses of other estrogens | 14 | 839 | Peto Odds Ratio (Peto, Fixed, 95% CI) | 1.42 [0.76, 2.65] |