Dodatak testosterona na hormonsku terapiju žena u menopauzi
Referencias
References to studies included in this review
References to studies excluded from this review
References to studies awaiting assessment
Additional references
References to other published versions of this review
Characteristics of studies
Characteristics of included studies [ordered by study ID]
| Methods | ||
| Participants | ||
| Interventions | ||
| Outcomes | ||
| Notes | ||
| Risk of bias | ||
| Bias | Authors' judgement | Support for judgement |
| Adequate sequence generation? | Low risk | |
| Allocation concealment? | Low risk | |
| Blinding? | Low risk | |
| Incomplete outcome data addressed? | High risk | |
| Free of selective reporting? | High risk | |
| Free of other bias? | Low risk | |
| Methods | ‐Design: double‐blind randomised (A), parallel group | |
| Participants | ‐Location: US | |
| Interventions | ‐CEE 0.625 mg once a day | |
| Outcomes | ‐Relevant outcomes: | |
| Notes | ‐Baseline equality: no differences in mean age, weight, height, body mass index and duration of menopause in four treatment groups. There was no report of the baseline equality of groups for the outcome of interest. | |
| Risk of bias | ||
| Bias | Authors' judgement | Support for judgement |
| Adequate sequence generation? | Low risk | A ‐ Adequate |
| Allocation concealment? | Low risk | A ‐ Adequate |
| Blinding? | Low risk | Participants and key personnel were blinded |
| Incomplete outcome data addressed? | High risk | Discontinuation >10% |
| Free of selective reporting? | High risk | Acne data reported incompletely |
| Free of other bias? | Low risk | Possible free of other sources of bias |
| Methods | See Dobs 2002 | |
| Participants | See Dobs 2002 | |
| Interventions | See Dobs 2002 | |
| Outcomes | See Dobs 2002 | |
| Notes | See Dobs 2002 | |
| Risk of bias | ||
| Bias | Authors' judgement | Support for judgement |
| Adequate sequence generation? | Low risk | See Dobs 2002 |
| Allocation concealment? | Low risk | See Dobs 2002 |
| Blinding? | Unclear risk | See Dobs 2002 |
| Incomplete outcome data addressed? | Unclear risk | See Dobs 2002 |
| Free of selective reporting? | Unclear risk | See Dobs 2002 |
| Free of other bias? | Unclear risk | See Dobs 2002 |
| Methods | ‐Design: double‐blind randomised (C), parallel group | |
| Participants | ‐Characteristics: surgically menopausal women with menopausal onset of low sexual desire with low serum T levels | |
| Interventions | ‐ once a day ‐CEE once a day plus T 150 mg twice a week | |
| Outcomes | ‐Relevant outcomes: | |
| Notes | ‐Baseline equality: no statistically significant differences across treatment groups with regard to age, ethnicity, percent married to partner, duration of relationship, age at oophorectomy and years since oophorectomy | |
| Risk of bias | ||
| Bias | Authors' judgement | Support for judgement |
| Adequate sequence generation? | Low risk | A ‐ Adequate |
| Allocation concealment? | Low risk | A ‐ Adequate |
| Blinding? | Low risk | Participants and key personnel were blinded |
| Incomplete outcome data addressed? | Low risk | Missing data have been imputed using appropriate methods |
| Free of selective reporting? | Unclear risk | Insufficient information |
| Free of other bias? | Low risk | Possibly free of other sources of bias |
| Methods | ‐Design: single‐blind randomised (A), parallel group | |
| Participants | ‐Location:Australia | |
| Interventions | ‐oestradiol 40 mg | |
| Outcomes | ‐Relevant outcomes: | |
| Notes | ‐Baseline equality: the mean number of years since menopause of the single and combined implant were 5.6(3.9) and 7.8(4.8), respectively. Nine of the combined implant group and all 10 in the single implant group had had hysterectomies, and three from each group had had oophorectomies. | |
| Risk of bias | ||
| Bias | Authors' judgement | Support for judgement |
| Adequate sequence generation? | Low risk | A ‐ Adequate |
| Allocation concealment? | Unclear risk | B ‐ Unclear |
| Blinding? | Low risk | Outcome assessment was blinded |
| Incomplete outcome data addressed? | High risk | Plausible effect size among missing outcomes enough to induce clinically relevant bias in observed effect size |
| Free of selective reporting? | High risk | One or more outcomes of interest in the review (sexual function) are reported incompletely |
| Free of other bias? | Unclear risk | insufficient information |
| Methods | ‐Design: double‐blind randomised(A), parallel group | |
| Participants | ‐Characteristics: surgically menopausal women with menopausal onset of hypoactive sexual desire disorder | |
| Interventions | ‐ Oral or transdermal oestrogen plus T patch 300 microgram/d | |
| Outcomes | ‐Relevant outcomes: | |
| Notes | ‐Baseline equality: no statistically significant differences across treatment groups with regard to mean age, ethnicity, percent married to partner, duration of relationship, route of oestrogen, and body mass index | |
| Risk of bias | ||
| Bias | Authors' judgement | Support for judgement |
| Adequate sequence generation? | Low risk | A ‐ Adequate |
| Allocation concealment? | Low risk | A ‐ Adequate |
| Blinding? | Low risk | Participants and key personnel were blinded |
| Incomplete outcome data addressed? | Low risk | Missing data have been imputed using appropriate methods |
| Free of selective reporting? | Unclear risk | Insufficient information |
| Free of other bias? | Low risk | Possible free of other sources of bias |
| Methods | ‐Design: double‐blind randomised (C), parallel group | |
| Participants | ‐Characteristics: surgically menopausal women with menopausal onset of low sexual desire with low serum T levels | |
| Interventions | ‐ Methyltestosterone (2.5 mg) plus esterified oestrogens (1.25 mg) compared with esterified oestrogens (1.25 mg) alone | |
| Outcomes | ‐Relevant outcomes: | |
| Notes | ‐Baseline equality: no significant differences across treatment groups with regard to age, BMI, race, years since surgical menopause, FSH and TSH. Baseline triglyceride levels were shown in a table. Triglyceride levels were somewhat lower in the T‐HT group than those in the HT group. | |
| Risk of bias | ||
| Bias | Authors' judgement | Support for judgement |
| Adequate sequence generation? | Unclear risk | C ‐ Not stated |
| Allocation concealment? | Unclear risk | B ‐ Unclear |
| Blinding? | Low risk | Participants and key personnel were blinded |
| Incomplete outcome data addressed? | Low risk | Discontinuation rate <10% |
| Free of selective reporting? | Unclear risk | Insufficient information |
| Free of other bias? | Low risk | Possibly free of other sources of bias |
| Methods | ‐Design: single‐blind randomised (A), parallel group | |
| Participants | ‐Location: Australia | |
| Interventions | ‐oestradiol 50 mg every three month | |
| Outcomes | ‐Relevant outcomes: | |
| Notes | ‐Baseline equality: no differences in smoking, alcohol habits, hysterectomy, oophorectomy, BMI, or baseline values of sexual function, lipid or hormone in two groups. However the mean age of the E group was less than that of the E‐T group. The mean BMDs were significantly lower for the E‐T group compared to the E group. | |
| Risk of bias | ||
| Bias | Authors' judgement | Support for judgement |
| Adequate sequence generation? | Low risk | A ‐ Adequate |
| Allocation concealment? | Low risk | A ‐ Adequate |
| Blinding? | Low risk | Outcome assessment was blinded |
| Incomplete outcome data addressed? | Low risk | Discontinuation rate <10% |
| Free of selective reporting? | Unclear risk | Insufficient information |
| Free of other bias? | High risk | Baseline imbalance (age, bone mineral density) |
| Methods | See Davis 2006 | |
| Participants | See Davis 2006 | |
| Interventions | See Davis 2006 | |
| Outcomes | See Davis 2006 | |
| Notes | See Davis 2006 | |
| Risk of bias | ||
| Bias | Authors' judgement | Support for judgement |
| Adequate sequence generation? | Low risk | See Davis 2006 |
| Allocation concealment? | Low risk | See Davis 2006 |
| Blinding? | Low risk | See Davis 2006 |
| Incomplete outcome data addressed? | Low risk | See Davis 2006 |
| Free of selective reporting? | Unclear risk | See Davis 2006 |
| Free of other bias? | High risk | See Davis 2006 |
| Methods | ‐Design: double‐blind randomised (A), parallel group | |
| Participants | ‐Characteristics: surgically menopausal women with menopausal onset of low sexual desire with low serum T levels | |
| Interventions | ‐ Transdermal oestrogen plus T 150 microgram/d | |
| Outcomes | ‐Relevant outcomes: | |
| Notes | ‐Baseline equality: no significant differences across treatment groups with regard to age, BMI, duration of relationship, and years since oophorectomy. However, there is somewhat different in frequency of total satisfactory activity. | |
| Risk of bias | ||
| Bias | Authors' judgement | Support for judgement |
| Adequate sequence generation? | Low risk | A ‐ Adequate |
| Allocation concealment? | Low risk | A ‐ Adequate |
| Blinding? | Low risk | Participants and key personnel were blinded |
| Incomplete outcome data addressed? | Low risk | Missing data have been imputed using appropriate methods |
| Free of selective reporting? | Unclear risk | Insufficient information |
| Free of other bias? | High risk | Baseline imbalance (sexual function) |
| Methods | ‐Design: a randomised, double‐blind, placebo‐controlled and crossover trial | |
| Participants | ‐Location: Sao Paulo, Brazil ‐Exclusion criteria 1. Use of other medication 2. Having other health problems or postmenopausal symptoms that could interfere with their sexual life including hot flashes, insomnia and other psychosomatic symptoms. | |
| Interventions | Methyltestosterone 2.5 mg/day combined with HRT (conjugated equine oestrogens 0.625 mg/day plus medroxyprogesterone acetate 5 mg/day) versus HRT (conjugated equine oestrogens 0.625 mg/day plus medroxyprogesterone acetate 5 mg/day) | |
| Outcomes | Lipid profile, sexual function, acne, hair growth, nervousness, aggressiveness, and discontinuation rate | |
| Notes | ||
| Risk of bias | ||
| Bias | Authors' judgement | Support for judgement |
| Adequate sequence generation? | Low risk | A ‐ Adequate |
| Allocation concealment? | Unclear risk | B‐ Unclear |
| Blinding? | Low risk | Participants and key personnel were blinded |
| Incomplete outcome data addressed? | Low risk | Discontinuation rate <10% |
| Free of selective reporting? | Unclear risk | Insufficient information |
| Free of other bias? | High risk | Crossover trial, no washout period |
| Methods | ‐Design: double‐blind randomised (A), parallel group | |
| Participants | ‐Location: United States | |
| Interventions | ‐EE 1.25 mg once a day | |
| Outcomes | ‐Relevant outcomes: | |
| Notes | ‐Baseline equality: no statistically significant differences between the E and E‐T groups in age, race, surgical or natural menopause and weight. The E group seemed to have a healthier sexual function at baseline than the E‐T group | |
| Risk of bias | ||
| Bias | Authors' judgement | Support for judgement |
| Adequate sequence generation? | Low risk | A ‐ Adequate |
| Allocation concealment? | Low risk | A ‐ Adequate |
| Blinding? | Low risk | Participants and key personnel were blinded |
| Incomplete outcome data addressed? | Low risk | Discontinuation rate <10% |
| Free of selective reporting? | High risk | One or more outcomes of interest in the review are reported incompletely |
| Free of other bias? | High risk | Baseline imbalance (sexual function) |
| Methods | ‐Design: single‐blind randomised(C), parallel group | |
| Participants | ‐Location: United Kingdom | |
| Interventions | ‐oestradiol 50 mg | |
| Outcomes | ‐Relevant outcomes: | |
| Notes | ‐Baseline equality: not stated | |
| Risk of bias | ||
| Bias | Authors' judgement | Support for judgement |
| Adequate sequence generation? | Unclear risk | C ‐ Not stated |
| Allocation concealment? | Unclear risk | B ‐ Unclear |
| Blinding? | Low risk | Outcome assessment was blinded |
| Incomplete outcome data addressed? | Unclear risk | number analysed not stated |
| Free of selective reporting? | Unclear risk | Insufficient information |
| Free of other bias? | Unclear risk | insufficient information |
| Methods | ‐Design: double‐blind, randomised, placebo‐controlled, crossover study | |
| Participants | ‐Location: Australia 3. In a stable relationship for at least 6 months 4. Normal thyroid function 5. Postmenopausal FSH level ‐Exclusion criteria: 3. Severe depression 4. Dysfunctional relationship 5. Use of alternative therapy products which may influence hypoactive sexual desire disorder, mood, or energy | |
| Interventions | Transdermal HT plus 1% testosterone cream (10 mg of testosterone, Andro‐Feme) versus transdermal HT plus placebo cream | |
| Outcomes | Sexual function, mood, energy, lipid profile, discontinuation rate | |
| Notes | ||
| Risk of bias | ||
| Bias | Authors' judgement | Support for judgement |
| Adequate sequence generation? | Low risk | A ‐ Adequate |
| Allocation concealment? | Low risk | A ‐ Adequate |
| Blinding? | Low risk | Participants and key personnel were blinded |
| Incomplete outcome data addressed? | Low risk | No missing data |
| Free of selective reporting? | Unclear risk | Insufficient information |
| Free of other bias? | Low risk | Possible free of other sources of bias |
| Methods | ‐Design: double‐blind randomised (A), parallel group | |
| Participants | ‐Location: United Kingdom | |
| Interventions | ‐17 beta‐estradiol 50 mg | |
| Outcomes | ‐Relevant outcomes: | |
| Notes | ‐Baseline equality: not stated. However, baseline levels of lipid profiles were shown in the table and seemed to be similar in two groups. | |
| Risk of bias | ||
| Bias | Authors' judgement | Support for judgement |
| Adequate sequence generation? | Low risk | A‐Adequate |
| Allocation concealment? | Low risk | A ‐ Adequate |
| Blinding? | Low risk | Participants and key personnel were blinded |
| Incomplete outcome data addressed? | Low risk | No missing data |
| Free of selective reporting? | Unclear risk | Insufficient information |
| Free of other bias? | Unclear risk | insufficient information |
| Methods | See Floter 2002b | |
| Participants | See Floter 2002b | |
| Interventions | See Floter 2002b | |
| Outcomes | See Floter 2002b | |
| Notes | See Floter 2002b | |
| Risk of bias | ||
| Bias | Authors' judgement | Support for judgement |
| Adequate sequence generation? | Low risk | See Floter 2002b |
| Allocation concealment? | Low risk | See Floter 2002b |
| Blinding? | Low risk | See Floter 2002b |
| Incomplete outcome data addressed? | High risk | See Floter 2002b |
| Free of selective reporting? | High risk | See Floter 2002b |
| Free of other bias? | High risk | See Floter 2002b |
| Methods | ‐Design: double‐blind randomised (A), crossover study | |
| Participants | ‐Location: Sweden | |
| Interventions | ‐oestradiol valerate 2mg once a day | |
| Outcomes | ‐Relevant outcomes: | |
| Notes | ‐Baseline equality: not applicable | |
| Risk of bias | ||
| Bias | Authors' judgement | Support for judgement |
| Adequate sequence generation? | Low risk | A ‐ Adequate |
| Allocation concealment? | Low risk | A ‐ Adequate |
| Blinding? | Low risk | Participants and key personnel were blinded |
| Incomplete outcome data addressed? | High risk | Plausible effect size among missing outcomes enough to induce clinically relevant bias in observed effect size |
| Free of selective reporting? | High risk | One or more outcomes of interest in the review are reported incompletely |
| Free of other bias? | High risk | Crossover trial, no washout period |
| Methods | See Floter 2002b | |
| Participants | See Floter 2002b | |
| Interventions | See Floter 2002b | |
| Outcomes | See Floter 2002b | |
| Notes | See Floter 2002b | |
| Risk of bias | ||
| Bias | Authors' judgement | Support for judgement |
| Adequate sequence generation? | Low risk | See Floter 2002b |
| Allocation concealment? | Low risk | See Floter 2002b |
| Blinding? | Low risk | See Floter 2002b |
| Incomplete outcome data addressed? | High risk | See Floter 2002b |
| Free of selective reporting? | High risk | See Floter 2002b |
| Free of other bias? | High risk | See Floter 2002b |
| Methods | ‐Design: double‐blind randomised (A), parallel group | |
| Participants | ‐Location: United States | |
| Interventions | ‐EE 0.625 mg once a day | |
| Outcomes | ‐Relevant outcomes: | |
| Notes | ‐Baseline equality: no statistically significant differences between the treatment groups with regard to age, time since menopause, the menopausal symptoms scale and lipid profiles. | |
| Risk of bias | ||
| Bias | Authors' judgement | Support for judgement |
| Adequate sequence generation? | Low risk | A ‐ Adequate |
| Allocation concealment? | Unclear risk | B ‐ Unclear |
| Blinding? | Low risk | Participants and key personnel were blinded |
| Incomplete outcome data addressed? | Low risk | No missing data |
| Free of selective reporting? | Unclear risk | Insufficient information |
| Free of other bias? | Low risk | Possible free of other sources of bias |
| Methods | ‐Design: double‐blind randomised (A), parallel group ‐No of participants completed the study: not stated ‐Number of participants analysed: 41 in E2/NETA, 47 in E2/NETA+testosterone | |
| Participants | ‐Characteristics: naturally menopausal women. 1. postmenopausal for at least 12 months and had FSH > 40 IU/L 2. None of the women had taken any sex steroid hormones during the last 3 months before the study. 3. All the women had a normal mammogram within 1 month of entering the study. 1. Previous history of cancer or previous breast disease 2. An abnormal mammogram 3. Hypertension (systolic blood pressure >170 mm Hg or diastolic >105 mm Hg), hyperlipidaemia (total cholesterol 98.0 mmol/L or triglycerides 93.0 mmol/L), diabetes mellitus 4. History of thromboembolic disease, undiagnosed vaginal bleeding, any sign of hepatic dysfunction, 5. Concomitant treatment known to influence the study medication (warfarin, rifampicin, carbamazepine, griseofulvin, hydantoins, primidone, barbiturates, and broad‐spectrum antibiotics). | |
| Interventions | 17beta‐estradiol (E2) 2 mg and norethisterone acetate (NETA) 1 mg plus testosterone patch releasing 300 kg/24 hours versus 17beta‐estradiol (E2) 2 mg and norethisterone acetate (NETA) 1 mg plus placebo patch | |
| Outcomes | Breast cell proliferation, dense breast, and discontinuation rate | |
| Notes | ||
| Risk of bias | ||
| Bias | Authors' judgement | Support for judgement |
| Adequate sequence generation? | Unclear risk | C ‐ Not stated |
| Allocation concealment? | Unclear risk | B ‐ Unclear |
| Blinding? | Low risk | Participants and key personnel were blinded |
| Incomplete outcome data addressed? | High risk | Plausible effect size among missing outcomes enough to induce clinically relevant bias in observed effect size |
| Free of selective reporting? | Unclear risk | Insufficient information |
| Free of other bias? | Low risk | Possible free of other sources of bias |
| Methods | ‐Design: double‐blind randomised (A), parallel group | |
| Participants | ‐Characteristics: hysterectomised postmenopausal women. | |
| Interventions | ‐ Estradiol gel 1mg/d plus methyltestosterone 1.25 mg/d | |
| Outcomes | ‐Relevant outcomes: | |
| Notes | ‐Baseline equality: no statistically significant differences across treatment groups with regard to age, ethnicity, and age at menopause | |
| Risk of bias | ||
| Bias | Authors' judgement | Support for judgement |
| Adequate sequence generation? | Low risk | A ‐ Adequate |
| Allocation concealment? | Low risk | A ‐ Adequate |
| Blinding? | Low risk | Participants and key personnel were blinded |
| Incomplete outcome data addressed? | Low risk | No missing data |
| Free of selective reporting? | Unclear risk | Insufficient information |
| Free of other bias? | Low risk | Possible free of other sources of bias |
| Methods | ‐Design: double‐blind randomised(A), parallel group | |
| Participants | ‐Location: United States | |
| Interventions | ‐EE 0.625 mg once a day | |
| Outcomes | ‐Relevant outcomes: | |
| Notes | ‐Baseline equality: Two groups were similar in terms of age, BMI, race, time since menopause, type of menopause, marital status, percent of highest educational level, total and bioavailable testosterone. | |
| Risk of bias | ||
| Bias | Authors' judgement | Support for judgement |
| Adequate sequence generation? | Low risk | A ‐ Adequate |
| Allocation concealment? | Low risk | A ‐ Adequate |
| Blinding? | Low risk | Participants and key personnel were blinded |
| Incomplete outcome data addressed? | Low risk | Missing data have been imputed using appropriate methods |
| Free of selective reporting? | Unclear risk | Insufficient information |
| Free of other bias? | Low risk | Possible free of other sources of bias |
| Methods | See Miller 2000 | |
| Participants | See Miller 2000 | |
| Interventions | See Miller 2000 | |
| Outcomes | See Miller 2000 | |
| Notes | See Miller 2000 | |
| Risk of bias | ||
| Bias | Authors' judgement | Support for judgement |
| Adequate sequence generation? | Low risk | See Miller 2000 |
| Allocation concealment? | Low risk | See Miller 2000 |
| Blinding? | Low risk | See Miller 2000 |
| Incomplete outcome data addressed? | High risk | See Miller 2000 |
| Free of selective reporting? | High risk | See Miller 2000 |
| Free of other bias? | Unclear risk | See Miller 2000 |
| Methods | ‐Design: double‐blind randomised (A), parallel group | |
| Participants | ‐Characteristics: healthy postmenopausal women | |
| Interventions | ‐Oral Estratab (1.25 mg/day) and placebo pill; Estratab (1.25 mg/day) and Provera continuous (5 mg); Estratab (1.25 mg/day) and Prometrium, micronized progesterone (100 mg/day); Estratest, combination oestrogen and androgen, and placebo pill; and two placebo pills | |
| Outcomes | ‐Relevant outcomes: | |
| Notes | ‐Baseline equality: no significant differences across treatment groups with regard to age, years of education, race, marital status, highest educational degree attained, current occupational status, family income, or family history of high blood pressure, diabetes, angina, myocardial infarction, other heart disease, stroke or cancer, baseline blood pressure or heart rate | |
| Risk of bias | ||
| Bias | Authors' judgement | Support for judgement |
| Adequate sequence generation? | Low risk | A ‐ Adequate |
| Allocation concealment? | Low risk | A ‐ Adequate |
| Blinding? | Low risk | Participants and key personnel were blinded |
| Incomplete outcome data addressed? | Low risk | Discontinuation rate <10% |
| Free of selective reporting? | Unclear risk | Insufficient information |
| Free of other bias? | Unclear risk | Insufficient information |
| Methods | ‐Design: double‐blind randomised (A), parallel group | |
| Participants | ‐Location: United States | |
| Interventions | Patients with hysterectomy | |
| Outcomes | ‐Relevant outcomes: | |
| Notes | ‐Baseline equality: no differences in age, height, weight, oestradiol and FSH levels, biochemical markers levels and BMD between the two groups. | |
| Risk of bias | ||
| Bias | Authors' judgement | Support for judgement |
| Adequate sequence generation? | Low risk | A ‐ Adequate |
| Allocation concealment? | Low risk | A ‐ Adequate |
| Blinding? | Low risk | Participants and key personnel were blinded |
| Incomplete outcome data addressed? | High risk | Plausible effect size among missing outcomes enough to induce clinically relevant bias in observed effect size |
| Free of selective reporting? | High risk | One or more outcomes of interest in the review are reported incompletely |
| Free of other bias? | Unclear risk | insufficient information |
| Methods | ‐Design: double‐blind randomised (C), parallel group | |
| Participants | ‐Location: United Kingdom | |
| Interventions | ‐estradiol 50 mg | |
| Outcomes | ‐Relevant outcomes: | |
| Notes | ‐Baseline equality: no differences between the three groups in age, menopausal status, or the presence of a uterus. | |
| Risk of bias | ||
| Bias | Authors' judgement | Support for judgement |
| Adequate sequence generation? | Unclear risk | C ‐ Not stated |
| Allocation concealment? | Unclear risk | B ‐ Unclear |
| Blinding? | Low risk | Participants and key personnel were blinded |
| Incomplete outcome data addressed? | High risk | Plausible effect size among missing outcomes enough to induce clinically relevant bias in observed effect size |
| Free of selective reporting? | High risk | One or more outcomes of interest in the review (sense of well being) are reported incompletely. |
| Free of other bias? | Low risk | Possible free of other sources of bias |
| Methods | ‐Design: double‐blind randomised (A), crossover study | |
| Participants | ‐Characteristics: postmenopausal women with menopausal onset of low sexual desire with low serum T levels | |
| Interventions | ‐Percutanous treatment with testosterone gel 10 mg/d‐hormone therapy | |
| Outcomes | ‐Relevant outcomes: | |
| Notes | ‐Baseline equality: not applicable | |
| Risk of bias | ||
| Bias | Authors' judgement | Support for judgement |
| Adequate sequence generation? | Low risk | A ‐ Adequate |
| Allocation concealment? | Low risk | A ‐ Adequate |
| Blinding? | Low risk | Participants and key personnel were blinded |
| Incomplete outcome data addressed? | High risk | Plausible effect size among missing outcomes enough to induce clinically relevant bias in observed effect size |
| Free of selective reporting? | Unclear risk | Insufficient information |
| Free of other bias? | High risk | Crossover trial, no washout period |
| Methods | See Dobs 2002 | |
| Participants | See Dobs 2002 | |
| Interventions | See Dobs 2002 | |
| Outcomes | See Dobs 2002 | |
| Notes | See Dobs 2002 | |
| Risk of bias | ||
| Bias | Authors' judgement | Support for judgement |
| Adequate sequence generation? | Low risk | See Dobs 2002 |
| Allocation concealment? | Low risk | See Dobs 2002 |
| Blinding? | Low risk | See Dobs 2002 |
| Incomplete outcome data addressed? | Low risk | See Dobs 2002 |
| Free of selective reporting? | High risk | See Dobs 2002 |
| Free of other bias? | High risk | See Dobs 2002 |
| Methods | ‐Design: open randomised (A), parallel group | |
| Participants | ‐Location: Italy | |
| Interventions | ‐oestradiol 50 micrograms once a day plus MPA 10 mg/d for a duration of 2 weeks every two months | |
| Outcomes | ‐Relevant outcomes: | |
| Notes | ‐Baseline equality: no statistically significant differences between the two groups in terms of age, BMI, years of menopause, duration of HT, sexual desire and satisfaction scores. | |
| Risk of bias | ||
| Bias | Authors' judgement | Support for judgement |
| Adequate sequence generation? | Low risk | A ‐ Adequate |
| Allocation concealment? | Low risk | A ‐ Adequate |
| Blinding? | High risk | Open randomised trial |
| Incomplete outcome data addressed? | High risk | Plausible effect size among missing outcomes enough to induce clinically relevant bias in observed effect size |
| Free of selective reporting? | High risk | One or more outcomes of interest in the review (sense of well being) are reported incompletely |
| Free of other bias? | Low risk | Possible free of other sources of bias |
| Methods | ‐Design: double‐blind randomised (A), parallel group | |
| Participants | ‐Location: Sao Paulo Brazil ‐Run‐in period: no ‐Exclusion criteria: | |
| Interventions | ‐ Treatment: mMethyltestosterone 2 mg/day combined with HRT (conjugated equine estrogens 0.625 mg/day plus medroxyprogesterone acetate 2.5 mg/day) ‐ Control/Placebo: HRT (conjugated equine oestrogens 0.625 mg/day plus medroxyprogesterone acetate 2.5 mg/day ‐Route: oral ‐Co‐intervention: no | |
| Outcomes | Sexual function and discontinuation rate | |
| Notes | ||
| Risk of bias | ||
| Bias | Authors' judgement | Support for judgement |
| Adequate sequence generation? | Unclear risk | C ‐ Not stated |
| Allocation concealment? | Unclear risk | B ‐ Unclear |
| Blinding? | Low risk | Participants and key personnel were blinded |
| Incomplete outcome data addressed? | Low risk | Discontinuation rate <10% |
| Free of selective reporting? | Unclear risk | Insufficient information |
| Free of other bias? | Unclear risk | insufficient information |
| Methods | ‐Design: open randomised (C), parallel group | |
| Participants | ‐Location: United States | |
| Interventions | ‐CEE 1.25 mg once a day | |
| Outcomes | ‐Relevant outcomes: | |
| Notes | ‐Baseline equality: no significant differences in weight, height, BMD, menopause duration, oophorectomy status and prior HT duration between two groups. The E‐T group was somewhat younger than the E group. There were no differences in general biochemical profiles or haematological measures. | |
| Risk of bias | ||
| Bias | Authors' judgement | Support for judgement |
| Adequate sequence generation? | Unclear risk | C‐Not stated |
| Allocation concealment? | Unclear risk | B ‐ Unclear |
| Blinding? | High risk | Open randomised trial |
| Incomplete outcome data addressed? | Low risk | Discontinuation rate <10% |
| Free of selective reporting? | High risk | One or more outcomes of interest in the review are reported incompletely. |
| Free of other bias? | High risk | Baseline imbalance (menopausal symptom score, age) |
| Methods | ‐Design: double‐blind randomised(A), crossover study | |
| Participants | ‐Location: United States | |
| Interventions | ‐EE 0.625 mg once a day | |
| Outcomes | ‐Relevant outcomes: | |
| Notes | ‐Baseline equality: not applicable | |
| Risk of bias | ||
| Bias | Authors' judgement | Support for judgement |
| Adequate sequence generation? | Low risk | A ‐ Adequate |
| Allocation concealment? | Low risk | A ‐ Adequate |
| Blinding? | Low risk | Participants and key personnel were blinded |
| Incomplete outcome data addressed? | High risk | Plausible effect size among missing outcomes enough to induce clinically relevant bias in observed effect size |
| Free of selective reporting? | Unclear risk | Insufficient information |
| Free of other bias? | High risk | Cross‐over trial, no washout period |
| Methods | ‐Design: double‐blind randomised (A), parallel group | |
| Participants | ‐Location: United States | |
| Interventions | ‐EE 1.25 mg once a day | |
| Outcomes | ‐Relevant outcomes: | |
| Notes | ‐Baseline equality: not stated | |
| Risk of bias | ||
| Bias | Authors' judgement | Support for judgement |
| Adequate sequence generation? | Low risk | A ‐ Adequate |
| Allocation concealment? | Low risk | A ‐ Adequate |
| Blinding? | Low risk | Participants and key personnel were blinded |
| Incomplete outcome data addressed? | Low risk | Discontinuation rate <10% |
| Free of selective reporting? | High risk | One or more outcomes of interest in the review (menopausal symptoms) are reported incompletely |
| Free of other bias? | Unclear risk | insufficient information |
| Methods | ‐Design: double‐blind randomised (C), parallel group | |
| Participants | ‐Location: United States | |
| Interventions | ‐EE 0.625 mg once a day | |
| Outcomes | ‐Relevant outcomes: | |
| Notes | ‐Baseline equality:Both groups had comparable demographics for personal characteristics (age, height, weight, length of menopause), group characteristics (education, race) and basic intelligence (as measured by the screening test, the Symbol Digit Modalities Test). | |
| Risk of bias | ||
| Bias | Authors' judgement | Support for judgement |
| Adequate sequence generation? | Unclear risk | C ‐ Not stated |
| Allocation concealment? | Unclear risk | B ‐ Unclear |
| Blinding? | Low risk | Participants and key personnel were blinded |
| Incomplete outcome data addressed? | High risk | Plausible effect size among missing outcomes enough to induce clinically relevant bias in observed effect size |
| Free of selective reporting? | Unclear risk | Insufficient information |
| Free of other bias? | Low risk | Possible free of other sources of bias |
| Methods | See Sherwin 1988 | |
| Participants | See Sherwin 1988 | |
| Interventions | See Sherwin 1988 | |
| Outcomes | See Sherwin 1988 | |
| Notes | See Sherwin 1988 | |
| Risk of bias | ||
| Bias | Authors' judgement | Support for judgement |
| Adequate sequence generation? | Low risk | See Sherwin 1988 |
| Allocation concealment? | Low risk | See Sherwin 1988 |
| Blinding? | Low risk | See Sherwin 1988 |
| Incomplete outcome data addressed? | High risk | See Sherwin 1988 |
| Free of selective reporting? | High risk | See Sherwin 1988 |
| Free of other bias? | Low risk | See Sherwin 1988 |
| Methods | ‐Design: double‐blind randomised (A), crossover study | |
| Participants | ‐Location: Canada | |
| Interventions | ‐estradiol valerate 10 mg | |
| Outcomes | ‐Relevant outcomes: | |
| Notes | ‐Baseline equality: not applicable | |
| Risk of bias | ||
| Bias | Authors' judgement | Support for judgement |
| Adequate sequence generation? | Low risk | A ‐ Adequate |
| Allocation concealment? | Low risk | A ‐ Adequate |
| Blinding? | Low risk | Participants and key personnel were blinded |
| Incomplete outcome data addressed? | High risk | Plausible effect size among missing outcomes enough to induce clinically relevant bias in observed effect size |
| Free of selective reporting? | High risk | One or more outcomes of interest in the review are reported incompletely. |
| Free of other bias? | Low risk | Possibly free of other sources of bias |
| Methods | ‐Design: double‐blind randomised (A), crossover study | |
| Participants | ‐Location: United States | |
| Interventions | ‐CEE 0.625 mg once a day | |
| Outcomes | ‐Relevant outcomes: | |
| Notes | ‐Baseline equality: not applicable | |
| Risk of bias | ||
| Bias | Authors' judgement | Support for judgement |
| Adequate sequence generation? | Low risk | A ‐ Adequate |
| Allocation concealment? | Low risk | A ‐ Adequate |
| Blinding? | Low risk | Participants and key personnel were blinded |
| Incomplete outcome data addressed? | High risk | Discontinuation >10% |
| Free of selective reporting? | Unclear risk | Insufficient information |
| Free of other bias? | High risk | Cross‐over trial, no washout period |
| Methods | ‐Design: double‐blind randomised (A), parallel group | |
| Participants | ‐Characteristics: postmenopausal women with menopausal onset of low sexual desire with low serum T levels | |
| Interventions | ‐A stable dose of oral oestrogen with or without progestin plus T 300 microgram/d | |
| Outcomes | ‐Relevant outcomes: | |
| Notes | ‐Baseline equality: no significant differences across treatment groups with regard to age, ethnicity, BMI, duration of relationship, hysterectomy status, years since last menstrual period (non hysterectomy), SHBG and type of hormone therapy | |
| Risk of bias | ||
| Bias | Authors' judgement | Support for judgement |
| Adequate sequence generation? | Low risk | A ‐ Adequate |
| Allocation concealment? | Low risk | A ‐ Adequate |
| Blinding? | Low risk | Participants and key personnel were blinded |
| Incomplete outcome data addressed? | Low risk | Missing data have been imputed using appropriate methods |
| Free of selective reporting? | Unclear risk | Insufficient information |
| Free of other bias? | Low risk | Possible free of other sources of bias |
| Methods | ‐Design: double‐blind randomised (C), parallel group | |
| Participants | ‐Location: United States | |
| Interventions | ‐EE 0.625 mg once a day | |
| Outcomes | ‐Relevant outcomes: | |
| Notes | ‐Baseline equality: patient characteristics were shown in table and they seemed to be similar in all groups in terms of age, BMI, duration of menopause and number of patients completing double‐blind phase. | |
| Risk of bias | ||
| Bias | Authors' judgement | Support for judgement |
| Adequate sequence generation? | Unclear risk | C ‐ Not stated |
| Allocation concealment? | Unclear risk | B ‐ Unclear |
| Blinding? | Low risk | Participants and key personnel were blinded |
| Incomplete outcome data addressed? | Low risk | Discontinuation rate <10% |
| Free of selective reporting? | High risk | One or more outcomes of interest in the review (menopausal symptoms) are reported incompletely |
| Free of other bias? | Unclear risk | insufficient information |
| Methods | ‐Design: double‐blind randomised (A), parallel group | |
| Participants | ‐Characteristics: surgically menopausal women with menopausal onset of low sexual desire | |
| Interventions | ‐Oestrogen plus T 300 microgram/d | |
| Outcomes | ‐Relevant outcomes: | |
| Notes | ‐Baseline equality: no significant differences across treatment groups with regard to age, weight, height, BMI, ethnicity, route of administration of concomitant oestrogen, duration of relationship, years since oophorectomy, number of satisfying sexual episodes over 4 weeks, score on sexual desire domain, score on PDS | |
| Risk of bias | ||
| Bias | Authors' judgement | Support for judgement |
| Adequate sequence generation? | Low risk | A ‐ Adequate |
| Allocation concealment? | Low risk | A ‐ Adequate |
| Blinding? | Low risk | Participants and key personnel were blinded |
| Incomplete outcome data addressed? | Low risk | Missing data have been imputed using appropriate methods |
| Free of selective reporting? | Unclear risk | Insufficient information |
| Free of other bias? | Low risk | Possible free of other sources of bias |
| Methods | ‐Design: double‐blind randomised (C), parallel group | |
| Participants | ‐Characteristics: surgically menopausal women with menopausal onset of low sexual desire | |
| Interventions | ‐Esterified oestrogens (1.25 mg) plus methyltestosterone (2.5 mg) once a day | |
| Outcomes | ‐Relevant outcomes: | |
| Notes | ‐Baseline equality: no significant differences across treatment groups with regard to age, ethnicity, years since oophorectomy, lipid levels and score of sexual questionnaire. | |
| Risk of bias | ||
| Bias | Authors' judgement | Support for judgement |
| Adequate sequence generation? | Unclear risk | C ‐ Not stated |
| Allocation concealment? | Unclear risk | B ‐ Unclear |
| Blinding? | Low risk | Participants and key personnel were blinded |
| Incomplete outcome data addressed? | Low risk | Missing data have been imputed using appropriate methods |
| Free of selective reporting? | Unclear risk | Insufficient information |
| Free of other bias? | High risk | Baseline imbalance (age) |
| Methods | ‐Design: double‐blind randomised (C), parallel group | |
| Participants | ‐Location: United States | |
| Interventions | ‐EE 1.25 mg once a day | |
| Outcomes | ‐Relevant outcomes: | |
| Notes | ‐Baseline equality: the two groups were similar in terms of age, height, weight, race, time since oophorectomy, number of patients with oestrogen use in previous 2 years, menopausal symptoms scores and lipid profiles. | |
| Risk of bias | ||
| Bias | Authors' judgement | Support for judgement |
| Adequate sequence generation? | Unclear risk | C ‐ Not stated |
| Allocation concealment? | Low risk | A ‐ Adequate |
| Blinding? | Low risk | Participants and key personnel were blinded. |
| Incomplete outcome data addressed? | High risk | Plausible effect size among missing outcomes enough to induce clinically relevant bias in observed effect size. |
| Free of selective reporting? | High risk | One or more outcomes of interest in the review are reported incompletely. |
| Free of other bias? | Unclear risk | Insufficient information |
| Methods | See Dobs 2002 | |
| Participants | See Dobs 2002 | |
| Interventions | See Dobs 2002 | |
| Outcomes | See Dobs 2002 | |
| Notes | See Dobs 2002 | |
| Risk of bias | ||
| Bias | Authors' judgement | Support for judgement |
| Adequate sequence generation? | Low risk | See Dobs 2002 |
| Allocation concealment? | Low risk | See Dobs 2002 |
| Blinding? | Low risk | See Dobs 2002 |
| Incomplete outcome data addressed? | Low risk | See Dobs 2002 |
| Free of selective reporting? | High risk | See Dobs 2002 |
| Free of other bias? | High risk | See Dobs 2002 |
| Methods | ‐Design: open randomised (A), parallel group | |
| Participants | ‐Characteristics: naturally menopausal women | |
| Interventions | ‐Testosterone undecanoate (40 mg every second day) | |
| Outcomes | ‐Relevant outcomes: | |
| Notes | ‐Baseline equality: no statistically significant differences across treatment groups with regard to age, weight, BMI, waist‐to‐hip ratio, blood pressure, serum hormone levels, and previous use of HT | |
| Risk of bias | ||
| Bias | Authors' judgement | Support for judgement |
| Adequate sequence generation? | Low risk | A ‐ Adequate |
| Allocation concealment? | High risk | C ‐ Inadequate |
| Blinding? | High risk | Open randomised trial |
| Incomplete outcome data addressed? | Low risk | No missing data |
| Free of selective reporting? | Unclear risk | Insufficient information |
| Free of other bias? | Low risk | Possible free of other sources of bias |
Definition:
‐Run‐in period for this review means a period where any intervention was identically administration to all participants in the same period of time.
‐Relevancy means a score of the importance of sexuality in the woman's life.
Abbreviation:
‐BISF‐W = Brief Index of Sexual Functioning for Women
‐BP = blood pressure
‐BMD = bone mineral density
‐BMI = body mass index
‐BSAP = serum bone‐specific alkaline phosphatase
‐BSO = bilateral salpingo‐oophorectomy
‐BW = body weight
‐CEE = conjugated equine oestrogen
‐DEXA = dual‐energy x‐ray absorptiometry
‐DHEAS = dehydroepiandrosterone sulphate
‐DMRS = Daily menopausal Rating Scale
‐Dpd = deoxypyridinoline
‐E = oestrogen(either with placebo or not) group; T group = testosterone(either with placebo or not) group; P group = placebo group; E‐P group= oestrogen plus progestogen(either with placebo or not) group, E‐T group = oestrogen plus testosterone(either with placebo or not) group; E‐P‐T group = oestrogen plus progestogen plus testosterone(either with placebo or not) group
‐ECG = electrocardiogram
‐EE = esterified oestrogen
‐MPA = medroxyprogesterone acetate
‐mT = methyl testosterone
‐No. = number
‐NTx = Cross‐linked N‐terminal telopeptide of type I collagen
‐Pap smear = Papanicolaou smear
‐ PFSF = Profile of Female Sexual Function
‐ PMS = premenstrual like symptom
‐ QUALMS = Quality of Life at Menopause Scale
‐ SAL = Sexual Activity Log
‐ SIQ = Sexual Interest Questionnaire
‐ SRS = Sabbatsberg Revised Sexual Self‐Rating Scale
‐ TAH = total abdominal hysterectomy
‐ SD = standard deviation
‐ SEM = standard error of mean
‐ T= testosterone
‐ VAS =visual analogue scale
Notes:
The published articles that were from the same trials were as follows:
1. Davis 1995 and Davis 2000
2. Basaria 2002, Dobs 2002, Nguyen 1999, and Wisniewski 2002
3 Miller 2000, Luciano 1998a, and Luciano 1999
4. Barrett‐Conner 1996 and Barrett‐Conner 1999
The published articles of Sherwin included the similar set of participants.
Characteristics of excluded studies [ordered by study ID]
| Study | Reason for exclusion |
| The study objective was to investigate the effect of esterified oestrogens combined with methyltestosterone on quality of life. The comparison group was placebo not hormone therapy. | |
| The objective of this study was to compare the effect of the addition of androgen on the incidence and severity of breakthrough bleeding in postmenopausal women receiving conventional regimens of continuous combined oestrogen/progestogen hormone therapy. The outcome was not eligible for this review. | |
| The phase III randomised, placebo‐controlled crossover clinical trial was aimed to evaluate whether transdermal testosterone would increase sexual desire in female cancer survivors. The population was not healthy postmenopausal women. | |
| This study aimed to compare climacteric symptom control in 55 postmenopausal women treated with either oestradiol plus testosterone implants or placebo. The control group was not HT. | |
| This was a pharmacokinetic study on the two existing testosterone preparations (oral testosterone undecanoate and subcutaneous testosterone pellets). One of sub studies was a 6 months double‐blind randomised parallel group study but the main outcome was testosterone concentration which was not relevant to the review. | |
| The objective of the study was to assess the efficacy (in terms of drug tolerance and doses) of intravaginal rings for androgen replacement in postmenopausal women who were receiving adequate oestrogen replacement by randomising them to either 0.5 or 1 mg testosterone/day added to HT. There was no HT only group serving as a control. | |
| An open study aimed to evaluate the effectiveness of combined estradiol and testosterone implants in alleviating menopausal symptoms not responding to standard oral oestrogens. The treatment group was the group of women who complained of persistent symptoms and then received testosterone plus estradiol implants. They were asked to return at monthly intervals for symptomatic assessment. The study design was not RCT. | |
| This was an open parallel group study aimed to investigate long‐term bone changes, lipid changes and sexual activity. Subjects were allocated randomly to one of three treatment groups or as controls. The treatment regimens were two oral oestrogen groups with cyclical or continuous progestogen, and one transdermal oestrogen regime with cyclical progestogen. Participants in the estradiol‐testosterone implanted group was not randomised. | |
| The study was conducted to elicit women's perceptions of the effects of testosterone therapy. The study was not RCT. | |
| The study was conducted to evaluate the effect of nandrolone decanoate on bone mineral density. The comparison group was not hormone therapy. | |
| The study was conducted to evaluate the effect of nandrolone decanoate on bone mineral density. The comparison group was not hormone therapy. | |
| The study was quasi‐randomised trial. | |
| This study was carried out to assess the effect of topical androgen replacement therapy on body composition and body weight. The treatment group was androgen gel, not testosterone plus HT while the control group was placebo, not HT. | |
| The aim of this study was to determine the efficacy and side effects of a combined hormone preparation (oestrogen, progestogen and testosterone) in various doses. There was no combined oestrogen plus progestogen therapy serving as a control group. | |
| The study was carried out to assess the effect of pellets containing either oestradiol or oestradiol in combination with testosterone in ten women with various type of ovarian failure. The participants included women with gonadal dysgenesis. | |
| The placebo‐controlled crossover study was carried out to assess the effects of oestrogen or testosterone in postmenopausal women with constantly low levels of gonadal steroids on in divergent thinking. The treatment group was testosterone only, not testosterone plus oestrogen. | |
| The study was to investigate the effects on large artery function of testosterone replacement in addition to conventional hormone therapy in postmenopausal women. It was not a randomised control trial. | |
| The purpose of this study was to evaluate the pharmacokinetics and the therapeutic responses of micronized estradiol, progesterone and testosterone administered sublingually as a single tablet. The outcome was not eligible for this review. | |
| A regimen of subcutaneous implants of oestradiol and testosterone in combination with continuous oral norethisterone was investigated in 71 non‐hysterectomized postmenopausal women in order to evaluate endometrial and menstrual response. There was no HT group serving as a control. | |
| The purpose of this study was to evaluate the pharmacokinetics of percutaneous administration of testosterone gel. The outcome was not eligible for this review. | |
| The double‐blind, randomised, placebo‐controlled study was conducted in 46 postmenopausal women with established osteoporosis in order to assess the long‐term effects of nandrolone decanoate on the bone mineral density and biochemical markers of bone turnover. The patients received intramuscular injections of placebo or 50 mg nandrolone decanoate every 3 weeks for 18 months. The treatment was not testosterone plus HT and the control group was not on HT. | |
| This was an interventional study, but not a randomised controlled trial, aimed to compare the short‐term effects of oestrogen and oestrogen plus testosterone on bone turnover. Oestradiol was given at baseline and then followed by the combination of estradiol plus testosterone. | |
| The primary outcomes, vaginal and fingertip blood flow, were not objectives of this review. In addition, the study participants were the same as those in Sarrel 1998 which was included in our review. | |
| The non‐randomised cohort study of postmenopausal women aimed to compare oral continuous treatment with cyclic oestrogen plus progesterone preparation and subcutaneous implants of estradiol combined with testosterone for their effects in preventing postmenopausal osteoporosis. | |
| This study was designed to investigate the effect on bone density when women change from oral oestrogen replacement therapy to subcutaneous hormone implants. The treatment group was the group of women who were complaining of problems with depression, loss of energy and loss of libido although the vasomotor symptoms were controlled while the control group was the group of women who were happy to continue with oral HT. The study design was not RCT. | |
| This retrospective study was designed to determine whether systemic replacement | |
| This was semi‐randomised study. The control groups included two historical groups of women who were randomly assigned to receive oestrogen continuously or no treatment. The treatment groups comprised the two study groups; oestrogen‐androgens and tibolone. | |
| The study was undertaken in order to investigate whether surgically menopausal women who had been chronically receiving a combined estrogen‐androgen drug long term would differ in aspects of their sexual functioning from women who had been receiving oestrogen alone and from those who remained untreated for several years. The study design was not RCT. | |
| The study aimed to compare lipid concentration in surgically menopausal women who received either oestrogen‐androgen, oestrogen or no treatment. The study design was not RCT. | |
| This randomised, double‐blind crossover study was carried out to test the effect of increased testosterone availability on impoverished | |
| The prospective, randomised placebo controlled double blind study aimed to investigate and compare the effects of testosterone, tibolone, hormone therapy on diastolic cardiac functions and lipid peroxidation in postmenopausal women. The outcomes were not eligible for this review. | |
| The study examined effects of testosterone on hypoactive sexual desire in pre‐ and postmenopausal women (treated) compared | |
| The study aimed to investigate the effects of testosterone implant therapy on arterial reactivity encompassing endothelial‐dependent and ‐independent vasodilation in women using HT. Thirty‐three postmenopausal women stabilized on oestrogen therapy received testosterone implant and 15 postmenopausal nonusers of HT served as control. The control group was not HT. | |
| The aim of this study was to investigate the treatment effects of testosterone and oestrogen on endometrium and the expression of proteins and genes involved in adipocyte signal transduction to lipolysis in abdominal subcutaneous adipose tissue of postmenopausal women. The outcomes were not eligible not our review. |
Characteristics of studies awaiting assessment [ordered by study ID]
| Methods | Unspecified |
| Participants | Postmenopausal women |
| Interventions | Exogenous testosterone |
| Outcomes | Psychological and metabolic effects |
| Notes | Published in National register trial. No data is available for evaluation |
| Methods | Prospective randomised study |
| Participants | Menopausal women |
| Interventions | Oestradiol and, oestradiol and testosterone implants |
| Outcomes | Psychiatric and psychosexual problems |
| Notes | Data could not be evaluated |
| Methods | Not specified |
| Participants | climacteric women with sexual dysfunction |
| Interventions | implanted oestradiol alone and in combination with testosterone |
| Outcomes | Not specified |
| Notes | Data could not be evaluated |
| Methods | Not specified |
| Participants | Decreased libido in climacteric women |
| Interventions | Oestradiol implant alone and in combination with testosterone |
| Outcomes | Not specified |
| Notes | Data could not be evaluated |
| Methods | A 10‐week, double‐blind, hormone replacement study |
| Participants | 40 naturally menopausal women (mean age 58.3 yr) |
| Interventions | Basal and stimulated vaginal vaso congestion and daily self‐reports of mood, physical symptoms, sexual behavior, and perceived sexual pleasure |
| Outcomes | Daily treatments were either conjugated equine oestrogen, i.e. Premarin (P; 0.625 mg), Premarin and medroxyprogesterone acetate, i.e. Provera (PP; 0.625 and 5 mg, respectively), Premarin and methyltestosterone (PT; 0.625 and 5 mg, respectively), or placebo (PL). |
| Notes | Data could not be evaluated |
| Methods | Unspecified |
| Participants | Postmenopausal women |
| Interventions | Subcutaneous testosterone |
| Outcomes | Benefits |
| Notes | Published in National register trial. No data is available for evaluation. |
Data and analyses
| Outcome or subgroup title | No. of studies | No. of participants | Statistical method | Effect size |
| 1 Sense of well‐being Show forest plot | 2 | Std. Mean Difference (IV, Fixed, 95% CI) | Subtotals only | |
| Analysis 1.1  Comparison 1 HT plus testosterone versus HT on sense of well being, Outcome 1 Sense of well‐being. | ||||
| 1.1 sexual function | 2 | 160 | Std. Mean Difference (IV, Fixed, 95% CI) | 0.47 [0.15, 0.80] |
| 1.2 Cognitive difficulty | 1 | 95 | Std. Mean Difference (IV, Fixed, 95% CI) | 0.0 [‐0.40, 0.40] |
| 1.3 Somatic or physical symptoms | 2 | 164 | Std. Mean Difference (IV, Fixed, 95% CI) | 0.21 [‐0.11, 0.54] |
| 1.4 Anxiety or fear | 1 | 95 | Std. Mean Difference (IV, Fixed, 95% CI) | ‐0.30 [‐0.70, 0.11] |
| 1.5 Depressed mood | 1 | 95 | Std. Mean Difference (IV, Fixed, 95% CI) | 0.26 [‐0.14, 0.67] |
| 1.6 Vasomotor symptoms | 2 | 166 | Std. Mean Difference (IV, Fixed, 95% CI) | 0.24 [‐0.08, 0.56] |
| 1.7 Sleep problems | 1 | 95 | Std. Mean Difference (IV, Fixed, 95% CI) | 0.05 [‐0.35, 0.45] |
| 1.8 Menstrual symptoms | 1 | 95 | Std. Mean Difference (IV, Fixed, 95% CI) | ‐0.11 [‐0.52, 0.29] |
| 1.9 Attractiveness | 1 | 95 | Std. Mean Difference (IV, Fixed, 95% CI) | 0.18 [‐0.23, 0.58] |
| 1.10 Psychosocial | 1 | 70 | Std. Mean Difference (IV, Fixed, 95% CI) | ‐0.05 [‐0.57, 0.47] |
| Outcome or subgroup title | No. of studies | No. of participants | Statistical method | Effect size |
| 1 Change scores of sexual function Show forest plot | 9 | Std. Mean Difference (IV, Fixed, 95% CI) | Subtotals only | |
| Analysis 2.1  Comparison 2 HT plus testosterone versus HT on sexual function, Outcome 1 Change scores of sexual function. | ||||
| 1.1 Number of satisfying | 5 | 1893 | Std. Mean Difference (IV, Fixed, 95% CI) | 0.29 [0.20, 0.38] |
| 1.2 Number of activity | 7 | 1946 | Std. Mean Difference (IV, Fixed, 95% CI) | 0.25 [0.17, 0.34] |
| 1.3 Number of orgasms | 5 | 1893 | Std. Mean Difference (IV, Fixed, 95% CI) | 0.30 [0.21, 0.39] |
| 1.4 Libido, desire or interest in sex | 9 | 2215 | Std. Mean Difference (IV, Fixed, 95% CI) | 0.35 [0.26, 0.43] |
| 1.5 Orgasm | 6 | 1872 | Std. Mean Difference (IV, Fixed, 95% CI) | 0.28 [0.19, 0.37] |
| 1.6 Arousal | 5 | 1845 | Std. Mean Difference (IV, Fixed, 95% CI) | 0.36 [0.27, 0.45] |
| 1.7 Pleasure or enjoyment of sex | 6 | 1641 | Std. Mean Difference (IV, Fixed, 95% CI) | 0.33 [0.22, 0.43] |
| 1.8 Sexual concerns | 5 | 1852 | Std. Mean Difference (IV, Fixed, 95% CI) | 0.32 [0.22, 0.41] |
| 1.9 Responsiveness | 8 | 2171 | Std. Mean Difference (IV, Fixed, 95% CI) | 0.32 [0.23, 0.40] |
| 1.10 Sexual self‐image | 5 | 1839 | Std. Mean Difference (IV, Fixed, 95% CI) | 0.26 [0.16, 0.35] |
| 1.11 Satisfaction | 1 | 32 | Std. Mean Difference (IV, Fixed, 95% CI) | 0.98 [0.24, 1.72] |
| 1.12 Fantasy | 1 | 32 | Std. Mean Difference (IV, Fixed, 95% CI) | 1.37 [0.59, 2.15] |
| 1.13 Frequency of desire | 1 | 96 | Std. Mean Difference (IV, Fixed, 95% CI) | 0.21 [‐0.19, 0.61] |
| 1.14 Composite score | 3 | 330 | Std. Mean Difference (IV, Fixed, 95% CI) | 0.41 [0.19, 0.63] |
| 2 Change scores of Personal Distress Scale Show forest plot | 5 | 1845 | Mean Difference (IV, Fixed, 95% CI) | ‐8.13 [‐10.59, ‐5.67] |
| Analysis 2.2  Comparison 2 HT plus testosterone versus HT on sexual function, Outcome 2 Change scores of Personal Distress Scale. | ||||
| 2.1 Personal Distress Scale | 5 | 1845 | Mean Difference (IV, Fixed, 95% CI) | ‐8.13 [‐10.59, ‐5.67] |
| Outcome or subgroup title | No. of studies | No. of participants | Statistical method | Effect size |
| 1 Lumbar BMDs at 12 months Show forest plot | 2 | Mean Difference (IV, Fixed, 95% CI) | Subtotals only | |
| Analysis 3.1  Comparison 3 HT plus testosterone versus HT on bone mineral density, Outcome 1 Lumbar BMDs at 12 months. | ||||
| 1.1 Mean score | 2 | 90 | Mean Difference (IV, Fixed, 95% CI) | ‐0.05 [‐0.11, 0.00] |
| 1.2 Change score | 1 | 57 | Mean Difference (IV, Fixed, 95% CI) | ‐0.40 [‐1.93, 1.13] |
| 2 Lumbar BMDs at 24 months Show forest plot | 1 | Mean Difference (IV, Fixed, 95% CI) | Subtotals only | |
| Analysis 3.2  Comparison 3 HT plus testosterone versus HT on bone mineral density, Outcome 2 Lumbar BMDs at 24 months. | ||||
| 2.1 Mean score | 0 | 0 | Mean Difference (IV, Fixed, 95% CI) | 0.0 [0.0, 0.0] |
| 2.2 Change score | 1 | 32 | Mean Difference (IV, Fixed, 95% CI) | ‐0.08 [‐0.19, 0.03] |
| 3 Femur BMDs at 12 months Show forest plot | 2 | Mean Difference (IV, Fixed, 95% CI) | Subtotals only | |
| Analysis 3.3  Comparison 3 HT plus testosterone versus HT on bone mineral density, Outcome 3 Femur BMDs at 12 months. | ||||
| 3.1 Mean score | 2 | 90 | Mean Difference (IV, Fixed, 95% CI) | ‐0.05 [‐0.09, ‐0.01] |
| 3.2 Change score | 1 | 57 | Mean Difference (IV, Fixed, 95% CI) | 1.4 [0.14, 2.66] |
| 4 Femur BMDs at 24 months Show forest plot | 1 | Mean Difference (IV, Fixed, 95% CI) | Subtotals only | |
| Analysis 3.4  Comparison 3 HT plus testosterone versus HT on bone mineral density, Outcome 4 Femur BMDs at 24 months. | ||||
| 4.1 Mean score | 1 | 32 | Mean Difference (IV, Fixed, 95% CI) | ‐0.07 [‐0.16, 0.02] |
| 4.2 Change score | 0 | 0 | Mean Difference (IV, Fixed, 95% CI) | 0.0 [0.0, 0.0] |
| Outcome or subgroup title | No. of studies | No. of participants | Statistical method | Effect size |
| 1 Weight Show forest plot | 3 | Mean Difference (IV, Fixed, 95% CI) | Subtotals only | |
| Analysis 4.1  Comparison 4 HT plus testosterone versus HT on body composition, Outcome 1 Weight. | ||||
| 1.1 Mean weight at the endpoint (3 months) | 1 | 42 | Mean Difference (IV, Fixed, 95% CI) | 1.30 [‐3.86, 6.46] |
| 1.2 Mean weight at the endpoint (6 months) | 1 | 37 | Mean Difference (IV, Fixed, 95% CI) | 5.40 [‐4.79, 15.59] |
| 1.3 Mean weight at the endpoint (12 months) | 1 | 37 | Mean Difference (IV, Fixed, 95% CI) | 6.30 [‐3.83, 16.43] |
| 1.4 Weight gain | 1 | 37 | Mean Difference (IV, Fixed, 95% CI) | 1.18 [‐0.25, 2.61] |
| 2 Body mass index Show forest plot | 2 | Mean Difference (IV, Fixed, 95% CI) | Subtotals only | |
| Analysis 4.2  Comparison 4 HT plus testosterone versus HT on body composition, Outcome 2 Body mass index. | ||||
| 2.1 Body mass index at 3 months | 1 | 42 | Mean Difference (IV, Fixed, 95% CI) | 1.0 [‐0.64, 2.64] |
| 2.2 Body mass index at 6 months | 1 | 37 | Mean Difference (IV, Fixed, 95% CI) | 1.60 [‐2.31, 5.51] |
| 2.3 Body mass index at 12 months | 1 | 37 | Mean Difference (IV, Fixed, 95% CI) | 2.10 [‐1.83, 6.03] |
| 3 Waist:hip ratio Show forest plot | 1 | Mean Difference (IV, Fixed, 95% CI) | Subtotals only | |
| Analysis 4.3  Comparison 4 HT plus testosterone versus HT on body composition, Outcome 3 Waist:hip ratio. | ||||
| 3.1 At 6 months | 1 | 37 | Mean Difference (IV, Fixed, 95% CI) | ‐0.05 [‐0.08, ‐0.02] |
| 3.2 At 12 months | 1 | 37 | Mean Difference (IV, Fixed, 95% CI) | ‐0.03 [‐0.06, 0.00] |
| Outcome or subgroup title | No. of studies | No. of participants | Statistical method | Effect size |
| 1 Cognitive performance Show forest plot | 1 | Mean Difference (IV, Fixed, 95% CI) | Subtotals only | |
| Analysis 5.1  Comparison 5 HT plus testosterone versus HT on cognition, Outcome 1 Cognitive performance. | ||||
| 1.1 Identical Pictures | 1 | 26 | Mean Difference (IV, Fixed, 95% CI) | ‐2.40 [‐6.67, 1.87] |
| 1.2 Shape Memory | 1 | 26 | Mean Difference (IV, Fixed, 95% CI) | 0.10 [‐2.19, 2.39] |
| 2 Cognition difficulty Show forest plot | 1 | 95 | Mean Difference (IV, Fixed, 95% CI) | 0.0 [‐0.21, 0.21] |
| Analysis 5.2  Comparison 5 HT plus testosterone versus HT on cognition, Outcome 2 Cognition difficulty. | ||||
| Outcome or subgroup title | No. of studies | No. of participants | Statistical method | Effect size |
| 1 Vasomotor symptom Show forest plot | 2 | 166 | Mean Difference (IV, Fixed, 95% CI) | 0.09 [‐0.18, 0.37] |
| Analysis 6.1  Comparison 6 HT plus testosterone versus HT on menopausal symptoms, Outcome 1 Vasomotor symptom. | ||||
| Outcome or subgroup title | No. of studies | No. of participants | Statistical method | Effect size |
| 1 Mean scores of facial and body hair growth Show forest plot | 1 | Mean Difference (IV, Fixed, 95% CI) | Subtotals only | |
| Analysis 7.1  Comparison 7 HT plus testosterone versus HT on facial and body hair growth, Outcome 1 Mean scores of facial and body hair growth. | ||||
| 2 Incidence of facial and body hair growth Show forest plot | 7 | 2127 | Peto Odds Ratio (Peto, Fixed, 95% CI) | 1.52 [1.07, 2.17] |
| Analysis 7.2  Comparison 7 HT plus testosterone versus HT on facial and body hair growth, Outcome 2 Incidence of facial and body hair growth. | ||||
| Outcome or subgroup title | No. of studies | No. of participants | Statistical method | Effect size |
| 1 Mean scores of acne Show forest plot | 1 | 216 | Mean Difference (IV, Fixed, 95% CI) | 0.1 [‐0.03, 0.23] |
| Analysis 8.1  Comparison 8 HT plus testosterone versus HT on acne, Outcome 1 Mean scores of acne. | ||||
| 2 Incidence of acne Show forest plot | 7 | 2127 | Peto Odds Ratio (Peto, Fixed, 95% CI) | 1.51 [1.07, 2.14] |
| Analysis 8.2  Comparison 8 HT plus testosterone versus HT on acne, Outcome 2 Incidence of acne. | ||||
| Outcome or subgroup title | No. of studies | No. of participants | Statistical method | Effect size |
| 1 Incidence of increased breast density Show forest plot | 1 | 87 | Odds Ratio (M‐H, Fixed, 95% CI) | 1.35 [0.46, 3.95] |
| Analysis 9.1  Comparison 9 HT plus testosterone versus HT on mammographic findings, Outcome 1 Incidence of increased breast density. | ||||
| 2 Area of dense breast Show forest plot | 1 | 87 | Mean Difference (IV, Fixed, 95% CI) | 0.0 [‐7.62, 7.62] |
| Analysis 9.2  Comparison 9 HT plus testosterone versus HT on mammographic findings, Outcome 2 Area of dense breast. | ||||
| Outcome or subgroup title | No. of studies | No. of participants | Statistical method | Effect size |
| 1 Total cholesterol at less than 3 months Show forest plot | 4 | 231 | Mean Difference (IV, Random, 95% CI) | ‐14.92 [‐27.81, ‐2.03] |
| Analysis 10.1  Comparison 10 HT plus testosterone versus HT on lipid profile, Outcome 1 Total cholesterol at less than 3 months. | ||||
| 2 Triglyceride at less than 3 months Show forest plot | 4 | Mean Difference (IV, Random, 95% CI) | Totals not selected | |
| Analysis 10.2  Comparison 10 HT plus testosterone versus HT on lipid profile, Outcome 2 Triglyceride at less than 3 months. | ||||
| 3 LDL cholesterol at less than 3 months Show forest plot | 3 | Mean Difference (IV, Random, 95% CI) | Totals not selected | |
| Analysis 10.3  Comparison 10 HT plus testosterone versus HT on lipid profile, Outcome 3 LDL cholesterol at less than 3 months. | ||||
| 4 HDL cholesterol at less than 3 months Show forest plot | 4 | 231 | Mean Difference (IV, Random, 95% CI) | ‐17.11 [‐23.47, ‐10.75] |
| Analysis 10.4  Comparison 10 HT plus testosterone versus HT on lipid profile, Outcome 4 HDL cholesterol at less than 3 months. | ||||
| 5 Total cholesterol at 3 ‐ <6 months Show forest plot | 2 | 256 | Mean Difference (IV, Random, 95% CI) | ‐9.42 [‐31.76, 12.93] |
| Analysis 10.5  Comparison 10 HT plus testosterone versus HT on lipid profile, Outcome 5 Total cholesterol at 3 ‐ <6 months. | ||||
| 5.1 Mean score | 1 | 40 | Mean Difference (IV, Random, 95% CI) | 3.87 [‐15.08, 22.82] |
| 5.2 Change score | 1 | 216 | Mean Difference (IV, Random, 95% CI) | ‐19.2 [‐26.16, ‐12.24] |
| 6 Triglyceride at 3 ‐ <6 months Show forest plot | 2 | 256 | Mean Difference (IV, Fixed, 95% CI) | ‐25.62 [‐38.53, ‐12.72] |
| Analysis 10.6  Comparison 10 HT plus testosterone versus HT on lipid profile, Outcome 6 Triglyceride at 3 ‐ <6 months. | ||||
| 6.1 Mean score | 1 | 40 | Mean Difference (IV, Fixed, 95% CI) | ‐44.29 [‐85.55, ‐3.03] |
| 6.2 Change score | 1 | 216 | Mean Difference (IV, Fixed, 95% CI) | ‐23.6 [‐37.18, ‐10.02] |
| 7 LDL cholesterol at 3 ‐ <6 months Show forest plot | 2 | 256 | Mean Difference (IV, Random, 95% CI) | 18.78 [‐18.39, 55.94] |
| Analysis 10.7  Comparison 10 HT plus testosterone versus HT on lipid profile, Outcome 7 LDL cholesterol at 3 ‐ <6 months. | ||||
| 7.1 Mean score | 1 | 40 | Mean Difference (IV, Random, 95% CI) | 38.67 [21.22, 56.12] |
| 7.2 Change score | 1 | 216 | Mean Difference (IV, Random, 95% CI) | 0.7 [‐5.58, 6.98] |
| 8 HDL cholesterol at 3 ‐ <6 months Show forest plot | 2 | 256 | Mean Difference (IV, Random, 95% CI) | ‐18.72 [‐26.04, ‐11.39] |
| Analysis 10.8  Comparison 10 HT plus testosterone versus HT on lipid profile, Outcome 8 HDL cholesterol at 3 ‐ <6 months. | ||||
| 8.1 Mean score | 1 | 40 | Mean Difference (IV, Random, 95% CI) | ‐23.2 [‐30.19, ‐16.21] |
| 8.2 Change score | 1 | 216 | Mean Difference (IV, Random, 95% CI) | ‐15.60 [‐18.59, ‐12.61] |
| 9 Total cholesterol/HDL cholesterol at 3 ‐ <6 months | 0 | 0 | Mean Difference (IV, Fixed, 95% CI) | 0.0 [0.0, 0.0] |
| 10 Total cholesterol at 6 ‐ <12 months Show forest plot | 10 | 1910 | Mean Difference (IV, Random, 95% CI) | ‐2.93 [‐7.18, 1.32] |
| Analysis 10.10  Comparison 10 HT plus testosterone versus HT on lipid profile, Outcome 10 Total cholesterol at 6 ‐ <12 months. | ||||
| 10.1 Mean score | 3 | 101 | Mean Difference (IV, Random, 95% CI) | ‐6.27 [‐20.41, 7.88] |
| 10.2 Change score | 7 | 1809 | Mean Difference (IV, Random, 95% CI) | ‐2.74 [‐7.47, 2.00] |
| 11 Triglyceride at 6 ‐ <12 months Show forest plot | 10 | 1909 | Mean Difference (IV, Random, 95% CI) | ‐5.79 [‐14.25, 2.67] |
| Analysis 10.11  Comparison 10 HT plus testosterone versus HT on lipid profile, Outcome 11 Triglyceride at 6 ‐ <12 months. | ||||
| 11.1 Mean score | 3 | 101 | Mean Difference (IV, Random, 95% CI) | 7.00 [‐8.74, 22.74] |
| 11.2 Change score | 7 | 1808 | Mean Difference (IV, Random, 95% CI) | ‐8.64 [‐18.40, 1.11] |
| 12 LDL cholesterol at 6 ‐ <12 months Show forest plot | 10 | 1906 | Mean Difference (IV, Fixed, 95% CI) | 1.86 [‐0.15, 3.87] |
| Analysis 10.12  Comparison 10 HT plus testosterone versus HT on lipid profile, Outcome 12 LDL cholesterol at 6 ‐ <12 months. | ||||
| 12.1 Mean score | 3 | 101 | Mean Difference (IV, Fixed, 95% CI) | 3.24 [‐10.76, 17.23] |
| 12.2 Change score | 7 | 1805 | Mean Difference (IV, Fixed, 95% CI) | 1.83 [‐0.20, 3.86] |
| 13 HDL cholesterol at 6 ‐ <12 months Show forest plot | 10 | 1907 | Mean Difference (IV, Random, 95% CI) | ‐5.84 [‐9.10, ‐2.58] |
| Analysis 10.13  Comparison 10 HT plus testosterone versus HT on lipid profile, Outcome 13 HDL cholesterol at 6 ‐ <12 months. | ||||
| 13.1 Mean score | 3 | 101 | Mean Difference (IV, Random, 95% CI) | ‐9.38 [‐13.64, ‐5.12] |
| 13.2 Change score | 7 | 1806 | Mean Difference (IV, Random, 95% CI) | ‐4.74 [‐8.42, ‐1.07] |
| 14 Total cholesterol/HDL at 6 ‐ <12 months Show forest plot | 1 | 45 | Mean Difference (IV, Fixed, 95% CI) | 20.6 [12.76, 28.44] |
| Analysis 10.14  Comparison 10 HT plus testosterone versus HT on lipid profile, Outcome 14 Total cholesterol/HDL at 6 ‐ <12 months. | ||||
| 14.1 Change score | 1 | 45 | Mean Difference (IV, Fixed, 95% CI) | 20.6 [12.76, 28.44] |
| 15 Total cholesterol at 12 months Show forest plot | 4 | 231 | Mean Difference (IV, Random, 95% CI) | ‐7.99 [‐23.45, 7.48] |
| Analysis 10.15  Comparison 10 HT plus testosterone versus HT on lipid profile, Outcome 15 Total cholesterol at 12 months. | ||||
| 15.1 Mean score | 2 | 70 | Mean Difference (IV, Random, 95% CI) | 1.75 [‐15.03, 18.52] |
| 15.2 Change score | 2 | 161 | Mean Difference (IV, Random, 95% CI) | ‐14.35 [‐38.05, 9.35] |
| 16 Triglyceride at 12 months Show forest plot | 4 | 231 | Mean Difference (IV, Random, 95% CI) | ‐23.38 [‐55.53, 8.76] |
| Analysis 10.16  Comparison 10 HT plus testosterone versus HT on lipid profile, Outcome 16 Triglyceride at 12 months. | ||||
| 16.1 Mean score | 2 | 70 | Mean Difference (IV, Random, 95% CI) | 3.92 [‐21.60, 29.43] |
| 16.2 Change score | 2 | 161 | Mean Difference (IV, Random, 95% CI) | ‐45.29 [‐80.17, ‐10.40] |
| 17 LDL cholesterol at 12 months Show forest plot | 4 | 231 | Mean Difference (IV, Fixed, 95% CI) | 8.84 [2.13, 15.54] |
| Analysis 10.17  Comparison 10 HT plus testosterone versus HT on lipid profile, Outcome 17 LDL cholesterol at 12 months. | ||||
| 17.1 Mean score | 2 | 70 | Mean Difference (IV, Fixed, 95% CI) | 5.81 [‐10.02, 21.64] |
| 17.2 Change score | 2 | 161 | Mean Difference (IV, Fixed, 95% CI) | 9.50 [2.10, 16.90] |
| 18 HDL cholesterol at 12 months Show forest plot | 4 | 231 | Mean Difference (IV, Random, 95% CI) | ‐14.49 [‐25.28, ‐3.70] |
| Analysis 10.18  Comparison 10 HT plus testosterone versus HT on lipid profile, Outcome 18 HDL cholesterol at 12 months. | ||||
| 18.1 Mean score | 2 | 70 | Mean Difference (IV, Random, 95% CI) | ‐7.22 [‐13.99, ‐0.45] |
| 18.2 Change score | 2 | 161 | Mean Difference (IV, Random, 95% CI) | ‐23.64 [‐28.95, ‐18.33] |
| 19 Total cholesterol/HDL at 12 months Show forest plot | 1 | 45 | Mean Difference (IV, Fixed, 95% CI) | 15.40 [4.40, 26.40] |
| Analysis 10.19  Comparison 10 HT plus testosterone versus HT on lipid profile, Outcome 19 Total cholesterol/HDL at 12 months. | ||||
| 19.1 Mean score | 0 | 0 | Mean Difference (IV, Fixed, 95% CI) | 0.0 [0.0, 0.0] |
| 19.2 Change score | 1 | 45 | Mean Difference (IV, Fixed, 95% CI) | 15.40 [4.40, 26.40] |
| 20 Total cholesterol at 24 months Show forest plot | 3 | 167 | Mean Difference (IV, Random, 95% CI) | ‐11.69 [‐32.36, 8.97] |
| Analysis 10.20  Comparison 10 HT plus testosterone versus HT on lipid profile, Outcome 20 Total cholesterol at 24 months. | ||||
| 20.1 Mean change | 1 | 32 | Mean Difference (IV, Random, 95% CI) | 3.87 [‐24.74, 32.48] |
| 20.2 Change score | 2 | 135 | Mean Difference (IV, Random, 95% CI) | ‐16.63 [‐42.67, 9.42] |
| 21 Triglyceride at 24 months Show forest plot | 3 | 167 | Mean Difference (IV, Fixed, 95% CI) | ‐52.46 [‐69.58, ‐35.35] |
| Analysis 10.21  Comparison 10 HT plus testosterone versus HT on lipid profile, Outcome 21 Triglyceride at 24 months. | ||||
| 21.1 Mean change | 1 | 32 | Mean Difference (IV, Fixed, 95% CI) | 0.0 [‐54.94, 54.94] |
| 21.2 Change score | 2 | 135 | Mean Difference (IV, Fixed, 95% CI) | ‐58.11 [‐76.12, ‐40.09] |
| 22 LDL cholesterol at 24 months Show forest plot | 3 | 167 | Mean Difference (IV, Fixed, 95% CI) | 9.15 [1.09, 17.20] |
| Analysis 10.22  Comparison 10 HT plus testosterone versus HT on lipid profile, Outcome 22 LDL cholesterol at 24 months. | ||||
| 22.1 Mean change | 1 | 32 | Mean Difference (IV, Fixed, 95% CI) | 3.87 [‐20.94, 28.68] |
| 22.2 Change score | 2 | 135 | Mean Difference (IV, Fixed, 95% CI) | 9.77 [1.26, 18.29] |
| 23 HDL cholesterol at 24 months Show forest plot | 3 | 167 | Mean Difference (IV, Random, 95% CI) | ‐17.63 [‐31.45, ‐3.80] |
| Analysis 10.23  Comparison 10 HT plus testosterone versus HT on lipid profile, Outcome 23 HDL cholesterol at 24 months. | ||||
| 23.1 Mean change | 1 | 32 | Mean Difference (IV, Random, 95% CI) | 0.0 [‐11.76, 11.76] |
| 23.2 Change score | 2 | 135 | Mean Difference (IV, Random, 95% CI) | ‐26.34 [‐28.00, ‐22.69] |
| 24 Total cholesterol/HDL at 24 months Show forest plot | 1 | 45 | Mean Difference (IV, Fixed, 95% CI) | 20.80 [11.00, 30.60] |
| Analysis 10.24  Comparison 10 HT plus testosterone versus HT on lipid profile, Outcome 24 Total cholesterol/HDL at 24 months. | ||||
| 24.1 Mean change | 0 | 0 | Mean Difference (IV, Fixed, 95% CI) | 0.0 [0.0, 0.0] |
| 24.2 Change score | 1 | 45 | Mean Difference (IV, Fixed, 95% CI) | 20.80 [11.00, 30.60] |
| Outcome or subgroup title | No. of studies | No. of participants | Statistical method | Effect size |
| 1 Total cholesterol Show forest plot | 17 | 2488 | Mean Difference (IV, Random, 95% CI) | ‐7.59 [‐13.08, ‐2.10] |
| Analysis 11.1  Comparison 11 HT plus testosterone versus HT on lipid profile (subgroup analysis), Outcome 1 Total cholesterol. | ||||
| 1.1 Testosterone patch | 5 | 1738 | Mean Difference (IV, Random, 95% CI) | 0.08 [‐2.37, 2.52] |
| 1.2 Testosterone implant | 2 | 63 | Mean Difference (IV, Random, 95% CI) | ‐2.34 [‐23.12, 18.45] |
| 1.3 Oral testosterone | 10 | 687 | Mean Difference (IV, Random, 95% CI) | ‐14.02 [‐21.63, ‐6.40] |
| 2 HDL cholesterol Show forest plot | 17 | Mean Difference (IV, Random, 95% CI) | Subtotals only | |
| Analysis 11.2  Comparison 11 HT plus testosterone versus HT on lipid profile (subgroup analysis), Outcome 2 HDL cholesterol. | ||||
| 2.1 Testosterone patch | 5 | 1735 | Mean Difference (IV, Random, 95% CI) | ‐1.09 [‐1.98, ‐0.19] |
| 2.2 Testosterone implant | 2 | 63 | Mean Difference (IV, Random, 95% CI) | ‐5.01 [‐11.72, 1.70] |
| 2.3 Oral testosterone | 10 | 687 | Mean Difference (IV, Random, 95% CI) | ‐18.63 [‐22.18, ‐15.08] |
| 3 LDL cholesterol Show forest plot | 16 | 2406 | Mean Difference (IV, Random, 95% CI) | 4.41 [0.76, 8.07] |
| Analysis 11.3  Comparison 11 HT plus testosterone versus HT on lipid profile (subgroup analysis), Outcome 3 LDL cholesterol. | ||||
| 3.1 Testosterone patch | 5 | 1734 | Mean Difference (IV, Random, 95% CI) | 1.77 [‐0.34, 3.87] |
| 3.2 Testosterone implant | 2 | 64 | Mean Difference (IV, Random, 95% CI) | 3.37 [‐13.92, 20.66] |
| 3.3 Oral testosterone | 9 | 608 | Mean Difference (IV, Random, 95% CI) | 10.39 [1.46, 19.32] |
| 4 Triglyceride Show forest plot | 17 | 2487 | Mean Difference (IV, Random, 95% CI) | ‐14.80 [‐23.24, ‐6.36] |
| Analysis 11.4  Comparison 11 HT plus testosterone versus HT on lipid profile (subgroup analysis), Outcome 4 Triglyceride. | ||||
| 4.1 Testosterone patch | 5 | 1737 | Mean Difference (IV, Random, 95% CI) | ‐3.64 [‐8.73, 1.44] |
| 4.2 Testosterone implant | 2 | 63 | Mean Difference (IV, Random, 95% CI) | 9.10 [‐16.04, 34.24] |
| 4.3 Oral testosterone | 10 | 687 | Mean Difference (IV, Random, 95% CI) | ‐27.07 [‐41.44, ‐12.70] |
| 5 Total cholesterol/HDL Show forest plot | 1 | 45 | Mean Difference (IV, Fixed, 95% CI) | 20.80 [11.00, 30.60] |
| Analysis 11.5  Comparison 11 HT plus testosterone versus HT on lipid profile (subgroup analysis), Outcome 5 Total cholesterol/HDL. | ||||
| 5.1 Testosterone patch | 0 | 0 | Mean Difference (IV, Fixed, 95% CI) | 0.0 [0.0, 0.0] |
| 5.2 Testosterone implant | 0 | 0 | Mean Difference (IV, Fixed, 95% CI) | 0.0 [0.0, 0.0] |
| 5.3 Oral testosterone | 1 | 45 | Mean Difference (IV, Fixed, 95% CI) | 20.80 [11.00, 30.60] |
| Outcome or subgroup title | No. of studies | No. of participants | Statistical method | Effect size |
| 1 Discontinuation rate (overall) Show forest plot | 21 | 3124 | Peto Odds Ratio (Peto, Fixed, 95% CI) | 0.99 [0.83, 1.19] |
| Analysis 12.1  Comparison 12 HT plus testosterone versus HT on discontinuation rate, Outcome 1 Discontinuation rate (overall). | ||||
| 2 Discontinuation rate (type of menopause) Show forest plot | 20 | Peto Odds Ratio (Peto, Fixed, 95% CI) | Subtotals only | |
| Analysis 12.2  Comparison 12 HT plus testosterone versus HT on discontinuation rate, Outcome 2 Discontinuation rate (type of menopause). | ||||
| 2.1 Surgical menopause | 8 | 1942 | Peto Odds Ratio (Peto, Fixed, 95% CI) | 1.09 [0.87, 1.36] |
| 2.2 Natural menopause | 5 | 764 | Peto Odds Ratio (Peto, Fixed, 95% CI) | 0.88 [0.60, 1.29] |
| 2.3 Both | 7 | 419 | Peto Odds Ratio (Peto, Fixed, 95% CI) | 1.44 [0.79, 2.63] |
| 3 Discontinuation rate (menopausal status) Show forest plot | 22 | Peto Odds Ratio (Peto, Fixed, 95% CI) | Subtotals only | |
| Analysis 12.3  Comparison 12 HT plus testosterone versus HT on discontinuation rate, Outcome 3 Discontinuation rate (menopausal status). | ||||
| 3.1 Perimenopausal | 0 | 0 | Peto Odds Ratio (Peto, Fixed, 95% CI) | 0.0 [0.0, 0.0] |
| 3.2 Postmenopausal | 19 | 3076 | Peto Odds Ratio (Peto, Fixed, 95% CI) | 1.04 [0.86, 1.25] |
| 3.3 Both | 3 | 148 | Peto Odds Ratio (Peto, Fixed, 95% CI) | 3.26 [0.85, 12.47] |
| 4 Discontinuation rate (route of hormone therapy) Show forest plot | 22 | Peto Odds Ratio (Peto, Fixed, 95% CI) | Subtotals only | |
| Analysis 12.4  Comparison 12 HT plus testosterone versus HT on discontinuation rate, Outcome 4 Discontinuation rate (route of hormone therapy). | ||||
| 4.1 Oral HT | 13 | 1840 | Peto Odds Ratio (Peto, Fixed, 95% CI) | 1.01 [0.79, 1.30] |
| 4.2 Non‐oral HT | 7 | 289 | Peto Odds Ratio (Peto, Fixed, 95% CI) | 1.32 [0.62, 2.82] |
| 4.3 Oral and non‐oral HT | 2 | 1095 | Peto Odds Ratio (Peto, Fixed, 95% CI) | 1.09 [0.82, 1.46] |
| 5 Discontinuation rate (type of testosterone) Show forest plot | 22 | Peto Odds Ratio (Peto, Fixed, 95% CI) | Subtotals only | |
| Analysis 12.5  Comparison 12 HT plus testosterone versus HT on discontinuation rate, Outcome 5 Discontinuation rate (type of testosterone). | ||||
| 5.1 Methyl testosterone | 10 | 955 | Peto Odds Ratio (Peto, Fixed, 95% CI) | 1.33 [0.89, 1.98] |
| 5.2 Testosterone | 9 | 2087 | Peto Odds Ratio (Peto, Fixed, 95% CI) | 0.98 [0.79, 1.21] |
| 5.3 Other | 3 | 182 | Peto Odds Ratio (Peto, Fixed, 95% CI) | 1.68 [0.53, 5.29] |
| 6 Discontinuation rate (duration of treatment) Show forest plot | 22 | Peto Odds Ratio (Peto, Fixed, 95% CI) | Subtotals only | |
| Analysis 12.6  Comparison 12 HT plus testosterone versus HT on discontinuation rate, Outcome 6 Discontinuation rate (duration of treatment). | ||||
| 6.1 Less than 3 months | 3 | 195 | Peto Odds Ratio (Peto, Fixed, 95% CI) | 1.20 [0.46, 3.10] |
| 6.2 3 ‐ <6 months | 5 | 428 | Peto Odds Ratio (Peto, Fixed, 95% CI) | 1.61 [0.87, 2.99] |
| 6.3 6 ‐ < 12 months | 10 | 2164 | Peto Odds Ratio (Peto, Fixed, 95% CI) | 0.98 [0.80, 1.21] |
| 6.4 12 ‐ < 24 months | 2 | 92 | Peto Odds Ratio (Peto, Fixed, 95% CI) | 0.93 [0.12, 6.98] |
| 6.5 24 months | 2 | 345 | Peto Odds Ratio (Peto, Fixed, 95% CI) | 1.31 [0.71, 2.42] |
| 7 Discontinuation rate (blinding) Show forest plot | 22 | Peto Odds Ratio (Peto, Fixed, 95% CI) | Subtotals only | |
| Analysis 12.7  Comparison 12 HT plus testosterone versus HT on discontinuation rate, Outcome 7 Discontinuation rate (blinding). | ||||
| 7.1 Double‐blind | 18 | 3088 | Peto Odds Ratio (Peto, Fixed, 95% CI) | 1.05 [0.87, 1.26] |
| 7.2 Open or single‐blind | 4 | 136 | Peto Odds Ratio (Peto, Fixed, 95% CI) | 1.85 [0.53, 6.49] |
| 8 Discontinuation rate (disease status) Show forest plot | 21 | Peto Odds Ratio (Peto, Fixed, 95% CI) | Subtotals only | |
| Analysis 12.8  Comparison 12 HT plus testosterone versus HT on discontinuation rate, Outcome 8 Discontinuation rate (disease status). | ||||
| 8.1 Inadequate symptom control | 9 | 2048 | Peto Odds Ratio (Peto, Fixed, 95% CI) | 1.00 [0.80, 1.25] |
| 8.2 Low T plus inadequate symptom control | 2 | 303 | Peto Odds Ratio (Peto, Fixed, 95% CI) | 1.02 [0.62, 1.67] |
| 8.3 No symptom | 10 | 771 | Peto Odds Ratio (Peto, Fixed, 95% CI) | 1.49 [0.90, 2.46] |
| Outcome or subgroup title | No. of studies | No. of participants | Statistical method | Effect size |
| 1 Discontinuation rate due to adverse events (overall) Show forest plot | 20 | 3096 | Peto Odds Ratio (Peto, Fixed, 95% CI) | 1.24 [0.95, 1.62] |
| Analysis 13.1  Comparison 13 HT plus testosterone versus HT on discontinuation rate due to adverse events, Outcome 1 Discontinuation rate due to adverse events (overall). | ||||
| 2 Discontinuation rate due to adverse events (type of menopause) Show forest plot | 19 | Peto Odds Ratio (Peto, Fixed, 95% CI) | Subtotals only | |
| Analysis 13.2  Comparison 13 HT plus testosterone versus HT on discontinuation rate due to adverse events, Outcome 2 Discontinuation rate due to adverse events (type of menopause). | ||||
| 2.1 Surgical menopause | 8 | 1942 | Peto Odds Ratio (Peto, Fixed, 95% CI) | 1.16 [0.85, 1.59] |
| 2.2 Natural menopause | 4 | 704 | Peto Odds Ratio (Peto, Fixed, 95% CI) | 1.31 [0.72, 2.39] |
| 2.3 Both | 7 | 424 | Peto Odds Ratio (Peto, Fixed, 95% CI) | 1.94 [0.79, 4.78] |
| 3 Discontinuation rate due to adverse events (menopausal status) Show forest plot | 20 | Peto Odds Ratio (Peto, Fixed, 95% CI) | Subtotals only | |
| Analysis 13.3  Comparison 13 HT plus testosterone versus HT on discontinuation rate due to adverse events, Outcome 3 Discontinuation rate due to adverse events (menopausal status). | ||||
| 3.1 Perimenopausal | 0 | 0 | Peto Odds Ratio (Peto, Fixed, 95% CI) | 0.0 [0.0, 0.0] |
| 3.2 Postmenopausal | 17 | 2948 | Peto Odds Ratio (Peto, Fixed, 95% CI) | 1.24 [0.95, 1.61] |
| 3.3 Both | 3 | 148 | Peto Odds Ratio (Peto, Fixed, 95% CI) | 1.99 [0.20, 19.45] |
| 4 Discontinuation rate due to adverse events (route of hormone therapy) Show forest plot | 19 | Peto Odds Ratio (Peto, Fixed, 95% CI) | Subtotals only | |
| Analysis 13.4  Comparison 13 HT plus testosterone versus HT on discontinuation rate due to adverse events, Outcome 4 Discontinuation rate due to adverse events (route of hormone therapy). | ||||
| 4.1 Oral HT | 11 | 1707 | Peto Odds Ratio (Peto, Fixed, 95% CI) | 1.31 [0.92, 1.86] |
| 4.2 Non‐oral HT | 7 | 294 | Peto Odds Ratio (Peto, Fixed, 95% CI) | 1.42 [0.48, 4.20] |
| 4.3 Oral and non‐oral HT | 2 | 606 | Peto Odds Ratio (Peto, Fixed, 95% CI) | 1.04 [0.57, 1.92] |
| 5 Discontinuation rate due to adverse events (type of testosterone) Show forest plot | 20 | Peto Odds Ratio (Peto, Fixed, 95% CI) | Subtotals only | |
| Analysis 13.5  Comparison 13 HT plus testosterone versus HT on discontinuation rate due to adverse events, Outcome 5 Discontinuation rate due to adverse events (type of testosterone). | ||||
| 5.1 Methyl testosterone | 8 | 827 | Peto Odds Ratio (Peto, Fixed, 95% CI) | 1.56 [0.94, 2.57] |
| 5.2 Testosterone | 9 | 2087 | Peto Odds Ratio (Peto, Fixed, 95% CI) | 1.13 [0.82, 1.55] |
| 5.3 Other | 3 | 182 | Peto Odds Ratio (Peto, Fixed, 95% CI) | 1.53 [0.25, 9.35] |
| 6 Discontinuation rate due to adverse events (duration of treatment) Show forest plot | 20 | Peto Odds Ratio (Peto, Fixed, 95% CI) | Subtotals only | |
| Analysis 13.6  Comparison 13 HT plus testosterone versus HT on discontinuation rate due to adverse events, Outcome 6 Discontinuation rate due to adverse events (duration of treatment). | ||||
| 6.1 Less than 3 months | 2 | 122 | Peto Odds Ratio (Peto, Fixed, 95% CI) | 3.90 [0.76, 20.16] |
| 6.2 3 ‐ < 6 months | 5 | 428 | Peto Odds Ratio (Peto, Fixed, 95% CI) | 1.94 [0.79, 4.77] |
| 6.3 6 ‐ < 12 months | 10 | 2164 | Peto Odds Ratio (Peto, Fixed, 95% CI) | 1.13 [0.82, 1.54] |
| 6.4 12 ‐ <24 months | 1 | 37 | Peto Odds Ratio (Peto, Fixed, 95% CI) | 0.0 [0.0, 0.0] |
| 6.5 24 months | 2 | 345 | Peto Odds Ratio (Peto, Fixed, 95% CI) | 1.25 [0.67, 2.33] |
| 7 Discontinuation rate due to adverse events (blinding) Show forest plot | 20 | Peto Odds Ratio (Peto, Fixed, 95% CI) | Subtotals only | |
| Analysis 13.7  Comparison 13 HT plus testosterone versus HT on discontinuation rate due to adverse events, Outcome 7 Discontinuation rate due to adverse events (blinding). | ||||
| 7.1 Double‐blind | 16 | 2960 | Peto Odds Ratio (Peto, Fixed, 95% CI) | 1.21 [0.93, 1.59] |
| 7.2 Open or single‐blind | 4 | 136 | Peto Odds Ratio (Peto, Fixed, 95% CI) | 3.59 [0.59, 21.94] |
| 8 Discontinuation rate due to adverse events (disease status) Show forest plot | 19 | Peto Odds Ratio (Peto, Fixed, 95% CI) | Subtotals only | |
| Analysis 13.8  Comparison 13 HT plus testosterone versus HT on discontinuation rate due to adverse events, Outcome 8 Discontinuation rate due to adverse events (disease status). | ||||
| 8.1 Inadequate symptom control | 8 | 1988 | Peto Odds Ratio (Peto, Fixed, 95% CI) | 1.19 [0.85, 1.67] |
| 8.2 Low T plus inadequate symptom control | 2 | 303 | Peto Odds Ratio (Peto, Fixed, 95% CI) | 1.05 [0.52, 2.12] |
| 8.3 No symptom | 9 | 703 | Peto Odds Ratio (Peto, Fixed, 95% CI) | 1.36 [0.77, 2.39] |
| Outcome or subgroup title | No. of studies | No. of participants | Statistical method | Effect size |
| 1 Discontinuation rate (allocation quality) Show forest plot | 14 | 2773 | Peto Odds Ratio (Peto, Fixed, 95% CI) | 0.98 [0.81, 1.17] |
| Analysis 14.1  Comparison 14 HT‐T versus HT on discontinuation rate (sensitivity analysis), Outcome 1 Discontinuation rate (allocation quality). | ||||
| 2 Discontinuation rate due to adverse events (allocation quality) Show forest plot | 14 | 2778 | Peto Odds Ratio (Peto, Fixed, 95% CI) | 1.20 [0.91, 1.57] |
| Analysis 14.2  Comparison 14 HT‐T versus HT on discontinuation rate (sensitivity analysis), Outcome 2 Discontinuation rate due to adverse events (allocation quality). | ||||
| 3 Discontinuation rate (quality of randomisation)) Show forest plot | 17 | 2902 | Peto Odds Ratio (Peto, Fixed, 95% CI) | 0.97 [0.81, 1.16] |
| Analysis 14.3  Comparison 14 HT‐T versus HT on discontinuation rate (sensitivity analysis), Outcome 3 Discontinuation rate (quality of randomisation)). | ||||
| 4 Discontinuation rate due to adverse events (quality of randomisation) Show forest plot | 17 | 2931 | Peto Odds Ratio (Peto, Fixed, 95% CI) | 1.24 [0.95, 1.61] |
| Analysis 14.4  Comparison 14 HT‐T versus HT on discontinuation rate (sensitivity analysis), Outcome 4 Discontinuation rate due to adverse events (quality of randomisation). | ||||
| 5 Discontinuation rate (blinding method) Show forest plot | 17 | 3057 | Peto Odds Ratio (Peto, Fixed, 95% CI) | 0.97 [0.81, 1.17] |
| Analysis 14.5  Comparison 14 HT‐T versus HT on discontinuation rate (sensitivity analysis), Outcome 5 Discontinuation rate (blinding method). | ||||
| 6 Discontinuation rate due to adverse events (blinding method) Show forest plot | 15 | 2929 | Peto Odds Ratio (Peto, Fixed, 95% CI) | 1.21 [0.93, 1.59] |
| Analysis 14.6  Comparison 14 HT‐T versus HT on discontinuation rate (sensitivity analysis), Outcome 6 Discontinuation rate due to adverse events (blinding method). | ||||
| 7 Discontinuation rate (large studies) Show forest plot | 15 | 723 | Peto Odds Ratio (Peto, Fixed, 95% CI) | 1.38 [0.77, 2.49] |
| Analysis 14.7  Comparison 14 HT‐T versus HT on discontinuation rate (sensitivity analysis), Outcome 7 Discontinuation rate (large studies). | ||||
| 8 Discontinuation rate due to adverse events (large studies) Show forest plot | 13 | 595 | Peto Odds Ratio (Peto, Fixed, 95% CI) | 1.44 [0.57, 3.64] |
| Analysis 14.8  Comparison 14 HT‐T versus HT on discontinuation rate (sensitivity analysis), Outcome 8 Discontinuation rate due to adverse events (large studies). | ||||
| 9 Discontinuation rate (methyl testosterone doses) Show forest plot | 10 | Peto Odds Ratio (Peto, Fixed, 95% CI) | Subtotals only | |
| Analysis 14.9  Comparison 14 HT‐T versus HT on discontinuation rate (sensitivity analysis), Outcome 9 Discontinuation rate (methyl testosterone doses). | ||||
| 9.1 Methyl testosterone, all doses | 10 | 955 | Peto Odds Ratio (Peto, Fixed, 95% CI) | 0.96 [0.68, 1.35] |
| 9.2 Methyl testosterone 1.25mg | 5 | 473 | Peto Odds Ratio (Peto, Fixed, 95% CI) | 0.89 [0.55, 1.43] |
| 9.3 Methyl testosterone 2 mg | 1 | 60 | Peto Odds Ratio (Peto, Fixed, 95% CI) | 0.93 [0.12, 6.98] |
| 9.4 Methyl testosterone 2.5mg | 6 | 431 | Peto Odds Ratio (Peto, Fixed, 95% CI) | 0.95 [0.57, 1.58] |
| 10 Discontinuation rate due to adverse events (methyl testosterone doses) Show forest plot | 8 | Peto Odds Ratio (Peto, Fixed, 95% CI) | Subtotals only | |
| Analysis 14.10  Comparison 14 HT‐T versus HT on discontinuation rate (sensitivity analysis), Outcome 10 Discontinuation rate due to adverse events (methyl testosterone doses). | ||||
| 10.1 Methyl testosterone, all doses | 8 | 827 | Peto Odds Ratio (Peto, Fixed, 95% CI) | 1.43 [0.92, 2.22] |
| 10.2 Methyl testosterone 1.25mg | 5 | 477 | Peto Odds Ratio (Peto, Fixed, 95% CI) | 1.26 [0.71, 2.23] |
| 10.3 Methyl testosterone 2.5mg | 5 | 358 | Peto Odds Ratio (Peto, Fixed, 95% CI) | 1.60 [0.80, 3.23] |
| 11 Discontinuation rate (estrogen doses) Show forest plot | 24 | Peto Odds Ratio (Peto, Fixed, 95% CI) | Subtotals only | |
| Analysis 14.11  Comparison 14 HT‐T versus HT on discontinuation rate (sensitivity analysis), Outcome 11 Discontinuation rate (estrogen doses). | ||||
| 11.1 Estrogen, all doses | 24 | 3394 | Peto Odds Ratio (Peto, Fixed, 95% CI) | 0.98 [0.82, 1.17] |
| 11.2 Conjugated estrogen 0.625mg or equivalent doses of other estrogens | 7 | 766 | Peto Odds Ratio (Peto, Fixed, 95% CI) | 1.00 [0.70, 1.41] |
| 11.3 Conjugated estrogen 1.25mg or equivalent doses of other estrogens | 15 | 907 | Peto Odds Ratio (Peto, Fixed, 95% CI) | 1.01 [0.68, 1.52] |
| 12 Discontinuation rate due to adverse events (estrogen doses) Show forest plot | 22 | Peto Odds Ratio (Peto, Fixed, 95% CI) | Subtotals only | |
| Analysis 14.12  Comparison 14 HT‐T versus HT on discontinuation rate (sensitivity analysis), Outcome 12 Discontinuation rate due to adverse events (estrogen doses). | ||||
| 12.1 Estrogen, all doses | 22 | 3266 | Peto Odds Ratio (Peto, Fixed, 95% CI) | 1.22 [0.93, 1.58] |
| 12.2 Conjugated estrogen 0.625mg or equivalent doses of other estrogens | 6 | 706 | Peto Odds Ratio (Peto, Fixed, 95% CI) | 1.34 [0.80, 2.24] |
| 12.3 Conjugated estrogen 1.25mg or equivalent doses of other estrogens | 14 | 839 | Peto Odds Ratio (Peto, Fixed, 95% CI) | 1.42 [0.76, 2.65] |

Methodological quality graph: review authors' judgements about each methodological quality item presented as percentages across all included studies.

Methodological quality summary: review authors' judgements about each methodological quality item for each included study.
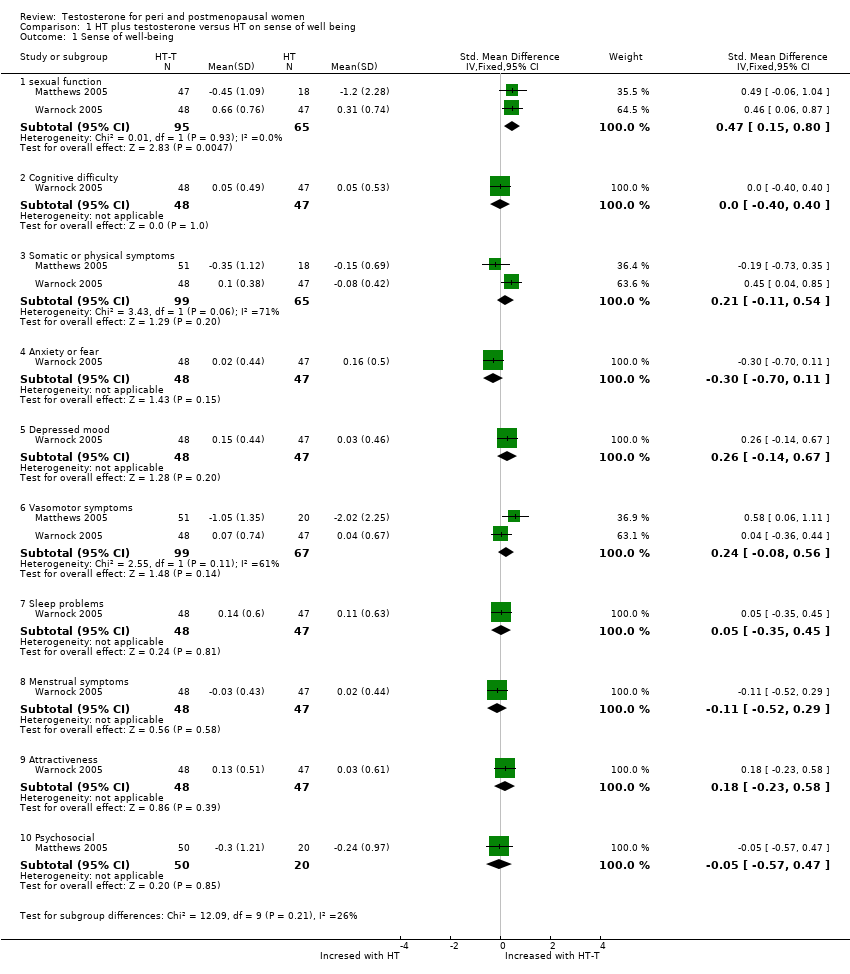
Comparison 1 HT plus testosterone versus HT on sense of well being, Outcome 1 Sense of well‐being.

Comparison 2 HT plus testosterone versus HT on sexual function, Outcome 1 Change scores of sexual function.
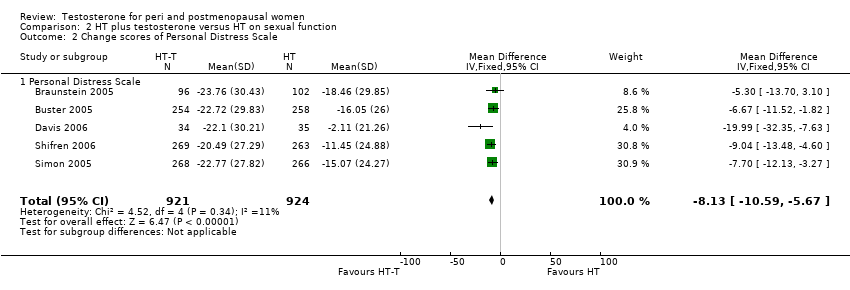
Comparison 2 HT plus testosterone versus HT on sexual function, Outcome 2 Change scores of Personal Distress Scale.

Comparison 3 HT plus testosterone versus HT on bone mineral density, Outcome 1 Lumbar BMDs at 12 months.
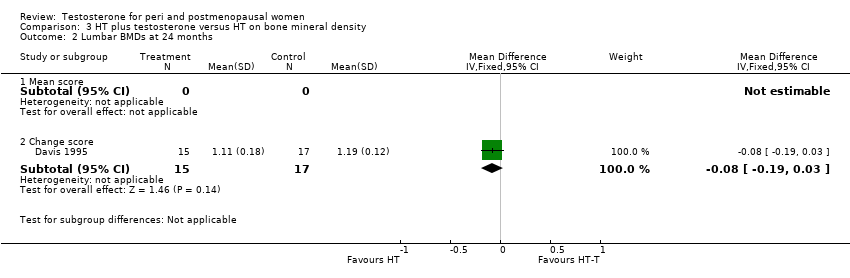
Comparison 3 HT plus testosterone versus HT on bone mineral density, Outcome 2 Lumbar BMDs at 24 months.

Comparison 3 HT plus testosterone versus HT on bone mineral density, Outcome 3 Femur BMDs at 12 months.
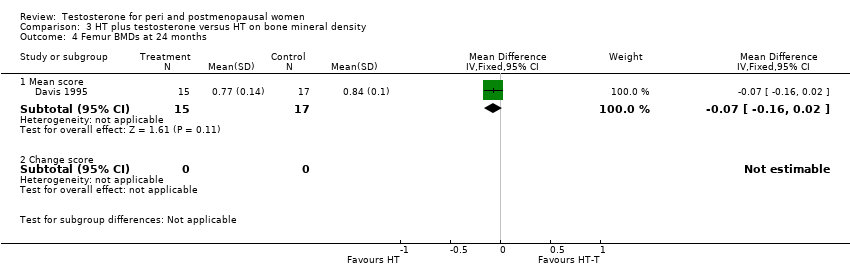
Comparison 3 HT plus testosterone versus HT on bone mineral density, Outcome 4 Femur BMDs at 24 months.
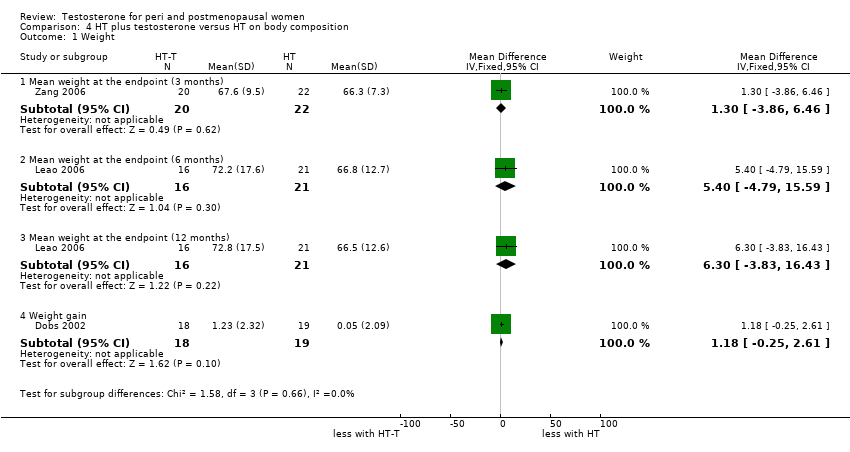
Comparison 4 HT plus testosterone versus HT on body composition, Outcome 1 Weight.
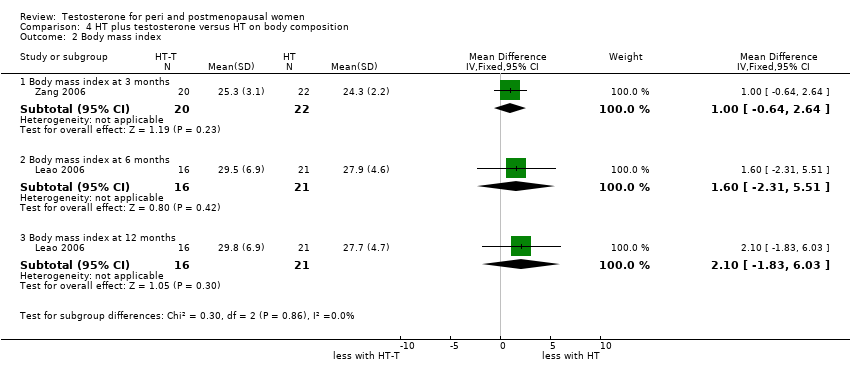
Comparison 4 HT plus testosterone versus HT on body composition, Outcome 2 Body mass index.
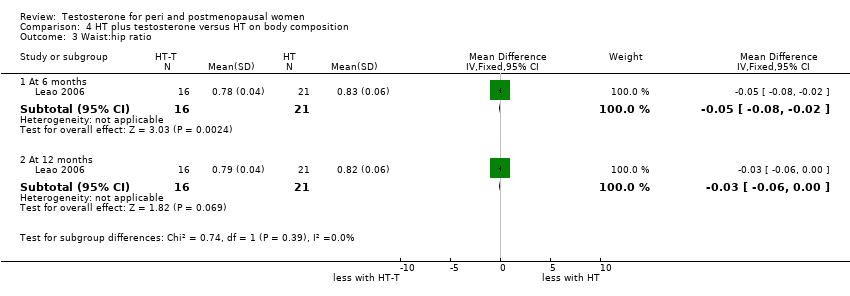
Comparison 4 HT plus testosterone versus HT on body composition, Outcome 3 Waist:hip ratio.
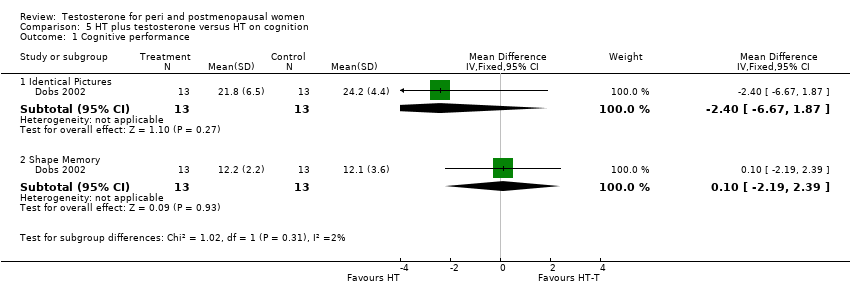
Comparison 5 HT plus testosterone versus HT on cognition, Outcome 1 Cognitive performance.

Comparison 5 HT plus testosterone versus HT on cognition, Outcome 2 Cognition difficulty.

Comparison 6 HT plus testosterone versus HT on menopausal symptoms, Outcome 1 Vasomotor symptom.
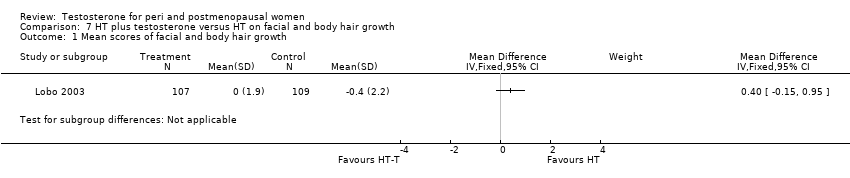
Comparison 7 HT plus testosterone versus HT on facial and body hair growth, Outcome 1 Mean scores of facial and body hair growth.
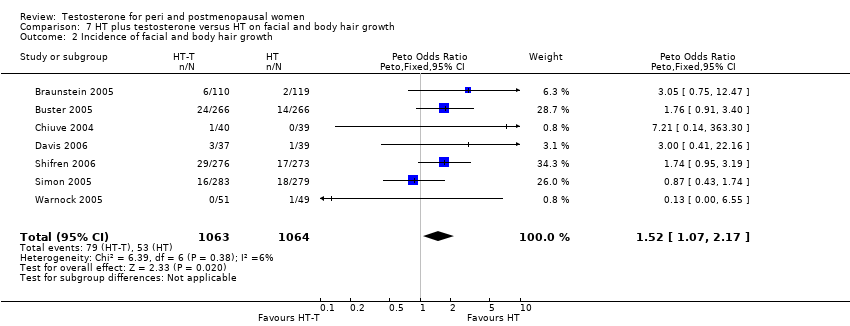
Comparison 7 HT plus testosterone versus HT on facial and body hair growth, Outcome 2 Incidence of facial and body hair growth.
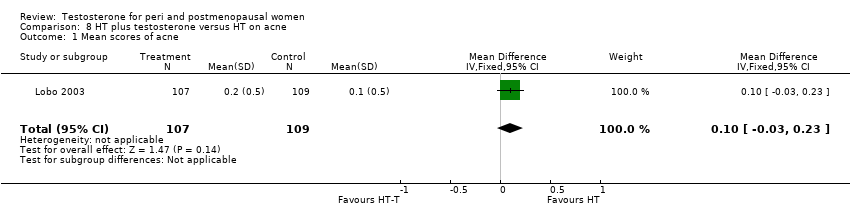
Comparison 8 HT plus testosterone versus HT on acne, Outcome 1 Mean scores of acne.

Comparison 8 HT plus testosterone versus HT on acne, Outcome 2 Incidence of acne.
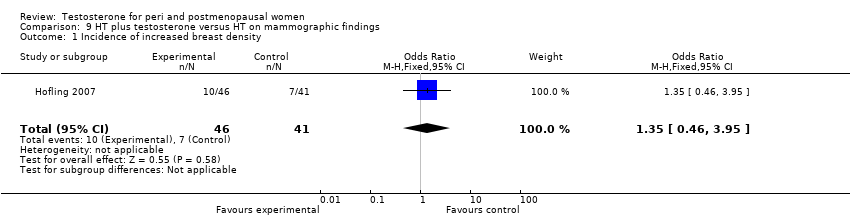
Comparison 9 HT plus testosterone versus HT on mammographic findings, Outcome 1 Incidence of increased breast density.
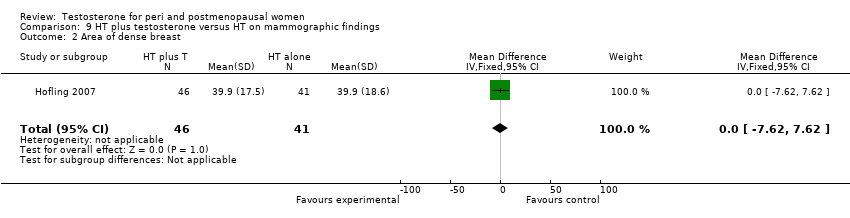
Comparison 9 HT plus testosterone versus HT on mammographic findings, Outcome 2 Area of dense breast.
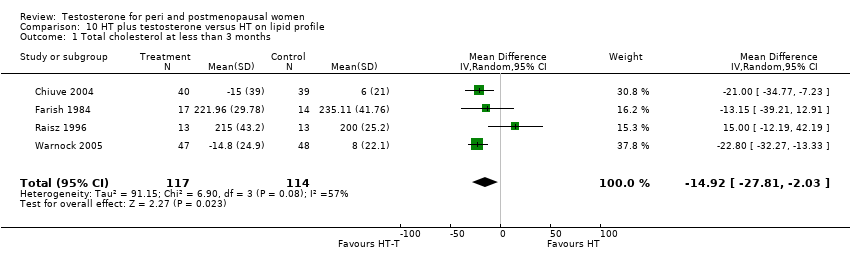
Comparison 10 HT plus testosterone versus HT on lipid profile, Outcome 1 Total cholesterol at less than 3 months.
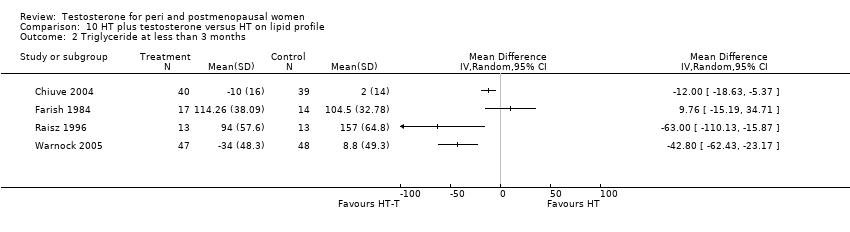
Comparison 10 HT plus testosterone versus HT on lipid profile, Outcome 2 Triglyceride at less than 3 months.
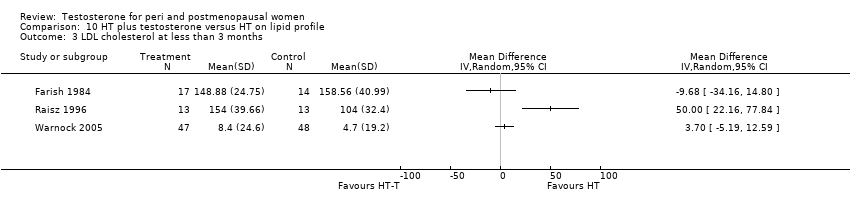
Comparison 10 HT plus testosterone versus HT on lipid profile, Outcome 3 LDL cholesterol at less than 3 months.

Comparison 10 HT plus testosterone versus HT on lipid profile, Outcome 4 HDL cholesterol at less than 3 months.
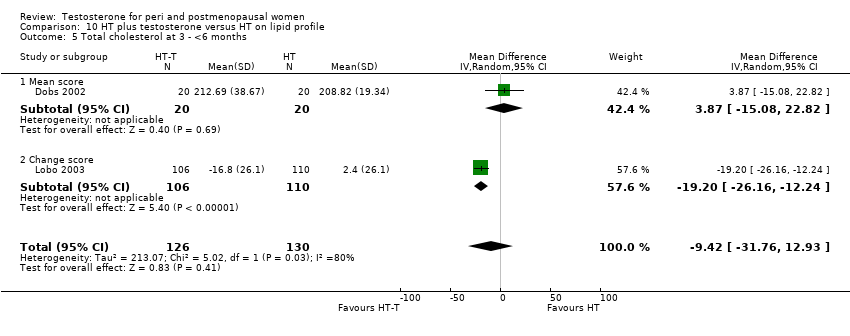
Comparison 10 HT plus testosterone versus HT on lipid profile, Outcome 5 Total cholesterol at 3 ‐ <6 months.

Comparison 10 HT plus testosterone versus HT on lipid profile, Outcome 6 Triglyceride at 3 ‐ <6 months.
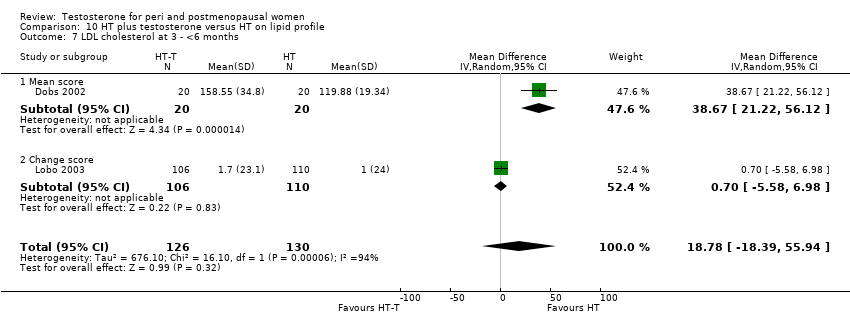
Comparison 10 HT plus testosterone versus HT on lipid profile, Outcome 7 LDL cholesterol at 3 ‐ <6 months.
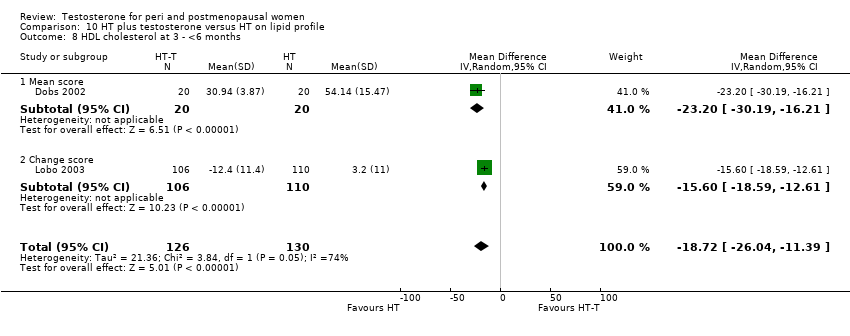
Comparison 10 HT plus testosterone versus HT on lipid profile, Outcome 8 HDL cholesterol at 3 ‐ <6 months.

Comparison 10 HT plus testosterone versus HT on lipid profile, Outcome 10 Total cholesterol at 6 ‐ <12 months.

Comparison 10 HT plus testosterone versus HT on lipid profile, Outcome 11 Triglyceride at 6 ‐ <12 months.

Comparison 10 HT plus testosterone versus HT on lipid profile, Outcome 12 LDL cholesterol at 6 ‐ <12 months.

Comparison 10 HT plus testosterone versus HT on lipid profile, Outcome 13 HDL cholesterol at 6 ‐ <12 months.
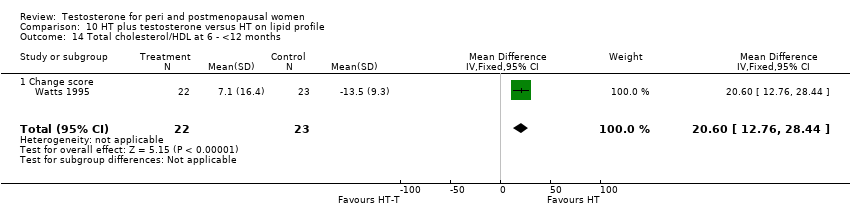
Comparison 10 HT plus testosterone versus HT on lipid profile, Outcome 14 Total cholesterol/HDL at 6 ‐ <12 months.

Comparison 10 HT plus testosterone versus HT on lipid profile, Outcome 15 Total cholesterol at 12 months.

Comparison 10 HT plus testosterone versus HT on lipid profile, Outcome 16 Triglyceride at 12 months.

Comparison 10 HT plus testosterone versus HT on lipid profile, Outcome 17 LDL cholesterol at 12 months.
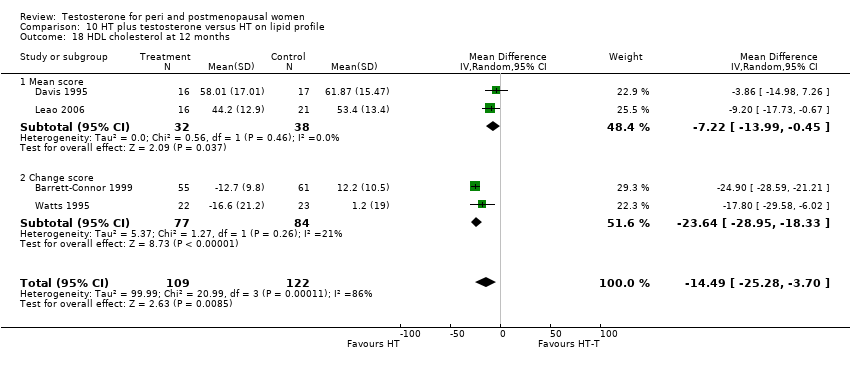
Comparison 10 HT plus testosterone versus HT on lipid profile, Outcome 18 HDL cholesterol at 12 months.
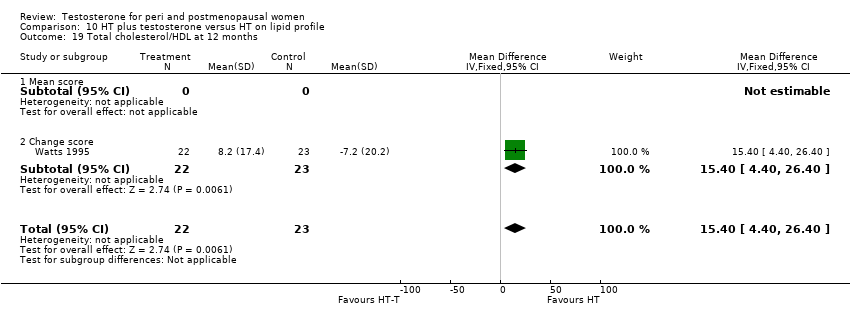
Comparison 10 HT plus testosterone versus HT on lipid profile, Outcome 19 Total cholesterol/HDL at 12 months.
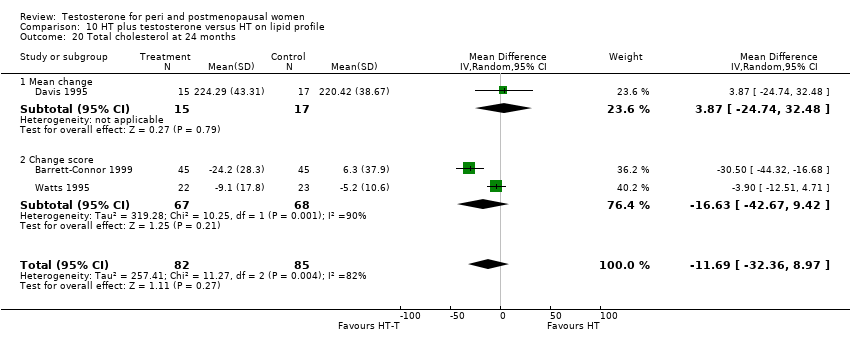
Comparison 10 HT plus testosterone versus HT on lipid profile, Outcome 20 Total cholesterol at 24 months.
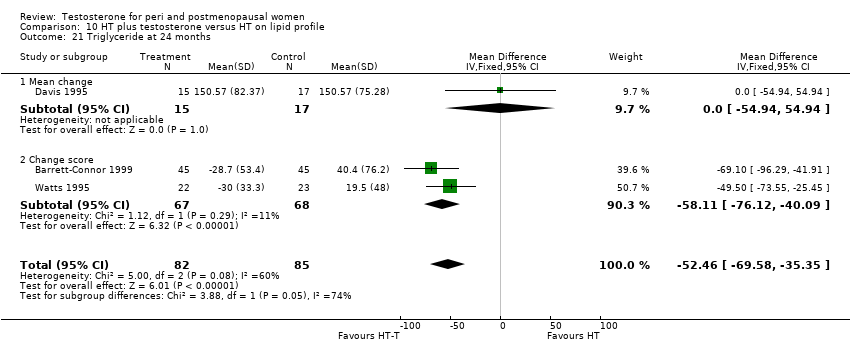
Comparison 10 HT plus testosterone versus HT on lipid profile, Outcome 21 Triglyceride at 24 months.

Comparison 10 HT plus testosterone versus HT on lipid profile, Outcome 22 LDL cholesterol at 24 months.

Comparison 10 HT plus testosterone versus HT on lipid profile, Outcome 23 HDL cholesterol at 24 months.
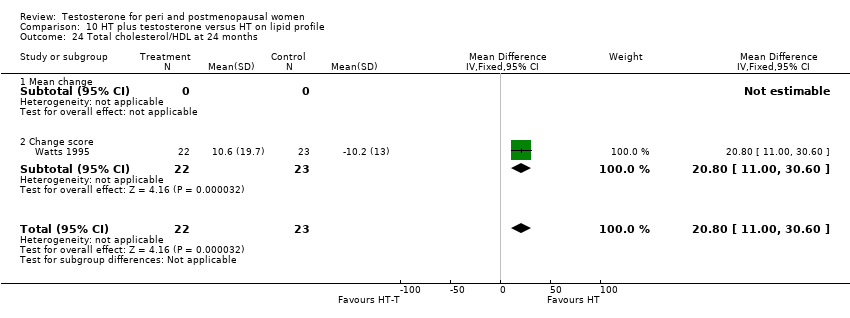
Comparison 10 HT plus testosterone versus HT on lipid profile, Outcome 24 Total cholesterol/HDL at 24 months.
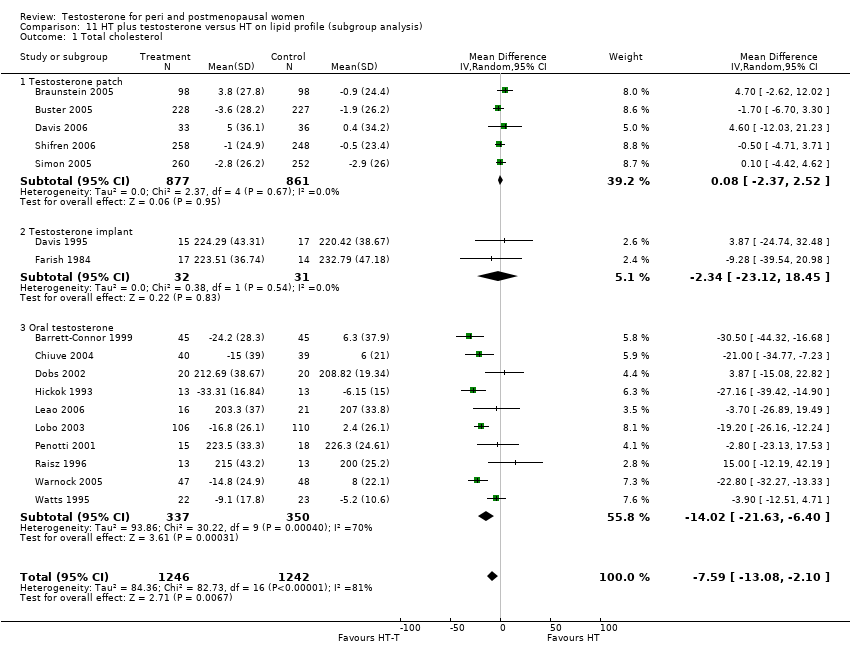
Comparison 11 HT plus testosterone versus HT on lipid profile (subgroup analysis), Outcome 1 Total cholesterol.

Comparison 11 HT plus testosterone versus HT on lipid profile (subgroup analysis), Outcome 2 HDL cholesterol.
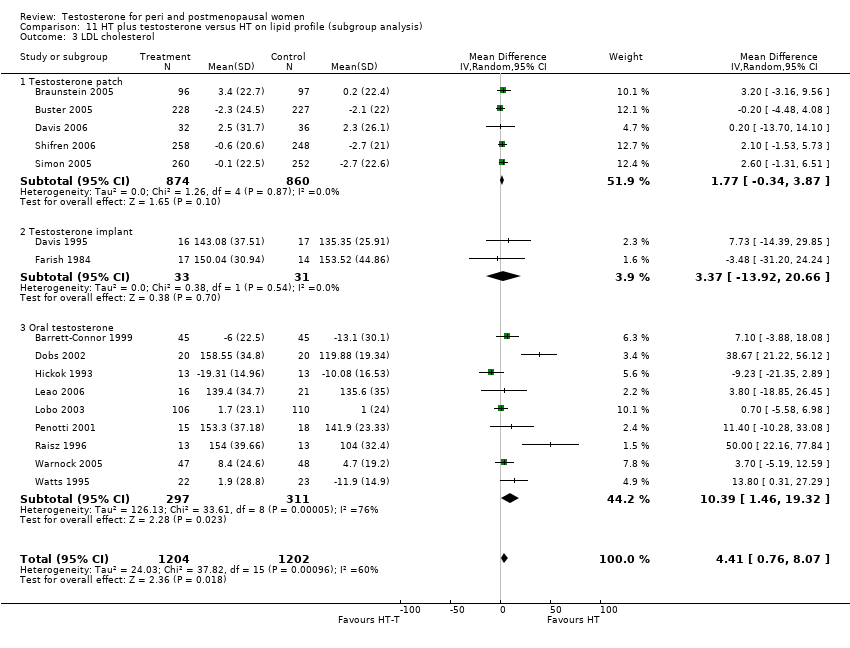
Comparison 11 HT plus testosterone versus HT on lipid profile (subgroup analysis), Outcome 3 LDL cholesterol.

Comparison 11 HT plus testosterone versus HT on lipid profile (subgroup analysis), Outcome 4 Triglyceride.
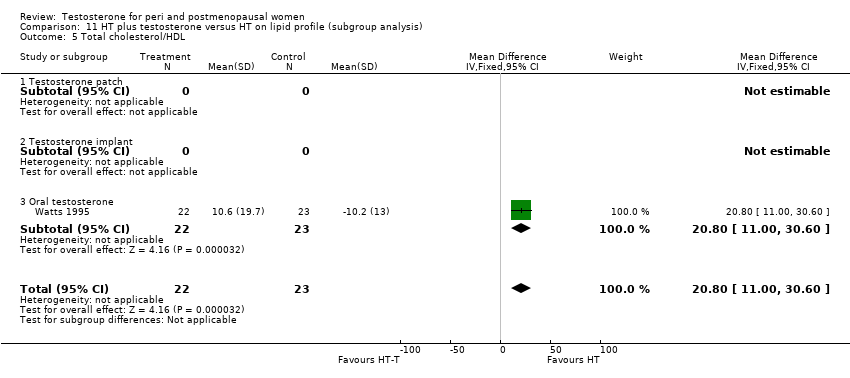
Comparison 11 HT plus testosterone versus HT on lipid profile (subgroup analysis), Outcome 5 Total cholesterol/HDL.

Comparison 12 HT plus testosterone versus HT on discontinuation rate, Outcome 1 Discontinuation rate (overall).
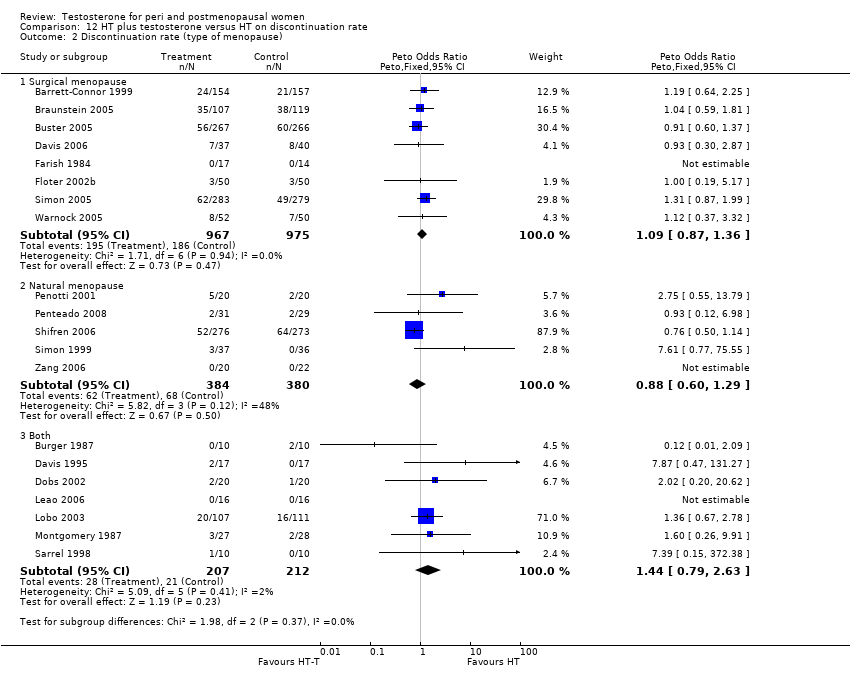
Comparison 12 HT plus testosterone versus HT on discontinuation rate, Outcome 2 Discontinuation rate (type of menopause).

Comparison 12 HT plus testosterone versus HT on discontinuation rate, Outcome 3 Discontinuation rate (menopausal status).

Comparison 12 HT plus testosterone versus HT on discontinuation rate, Outcome 4 Discontinuation rate (route of hormone therapy).
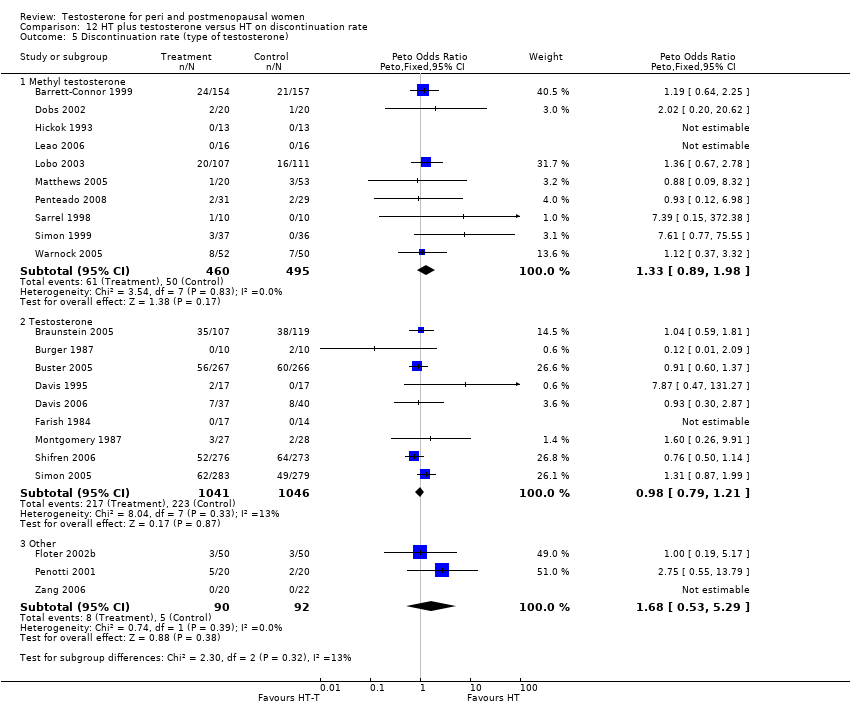
Comparison 12 HT plus testosterone versus HT on discontinuation rate, Outcome 5 Discontinuation rate (type of testosterone).
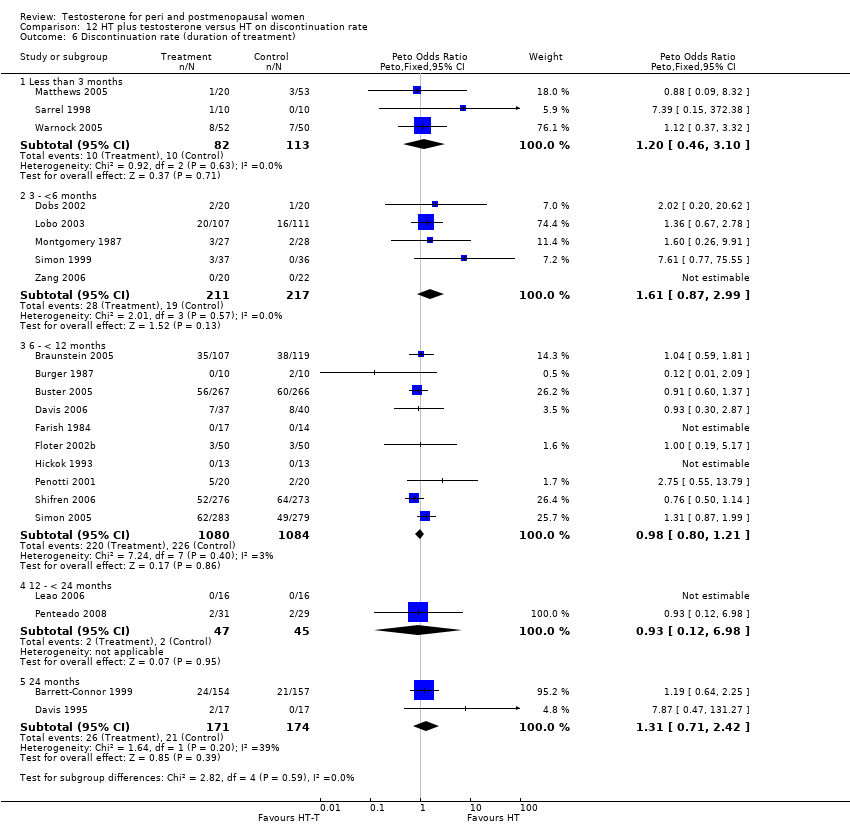
Comparison 12 HT plus testosterone versus HT on discontinuation rate, Outcome 6 Discontinuation rate (duration of treatment).

Comparison 12 HT plus testosterone versus HT on discontinuation rate, Outcome 7 Discontinuation rate (blinding).

Comparison 12 HT plus testosterone versus HT on discontinuation rate, Outcome 8 Discontinuation rate (disease status).
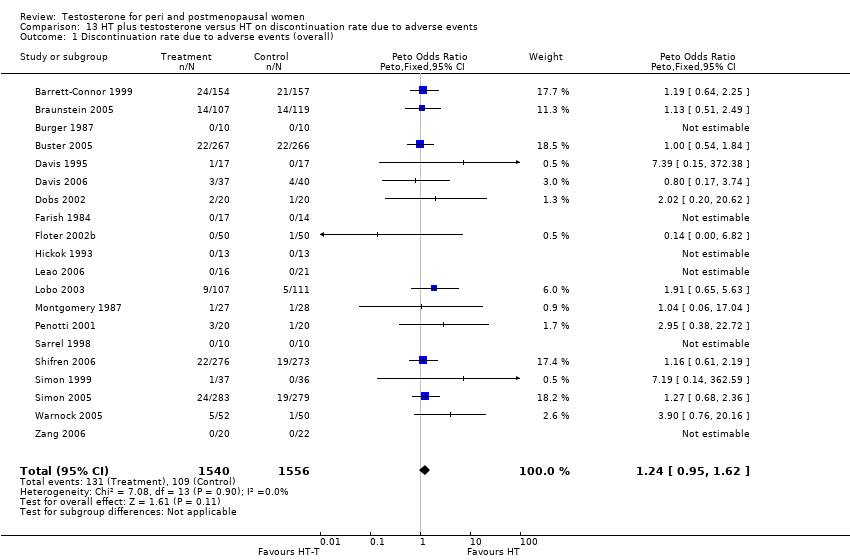
Comparison 13 HT plus testosterone versus HT on discontinuation rate due to adverse events, Outcome 1 Discontinuation rate due to adverse events (overall).

Comparison 13 HT plus testosterone versus HT on discontinuation rate due to adverse events, Outcome 2 Discontinuation rate due to adverse events (type of menopause).

Comparison 13 HT plus testosterone versus HT on discontinuation rate due to adverse events, Outcome 3 Discontinuation rate due to adverse events (menopausal status).

Comparison 13 HT plus testosterone versus HT on discontinuation rate due to adverse events, Outcome 4 Discontinuation rate due to adverse events (route of hormone therapy).

Comparison 13 HT plus testosterone versus HT on discontinuation rate due to adverse events, Outcome 5 Discontinuation rate due to adverse events (type of testosterone).

Comparison 13 HT plus testosterone versus HT on discontinuation rate due to adverse events, Outcome 6 Discontinuation rate due to adverse events (duration of treatment).

Comparison 13 HT plus testosterone versus HT on discontinuation rate due to adverse events, Outcome 7 Discontinuation rate due to adverse events (blinding).
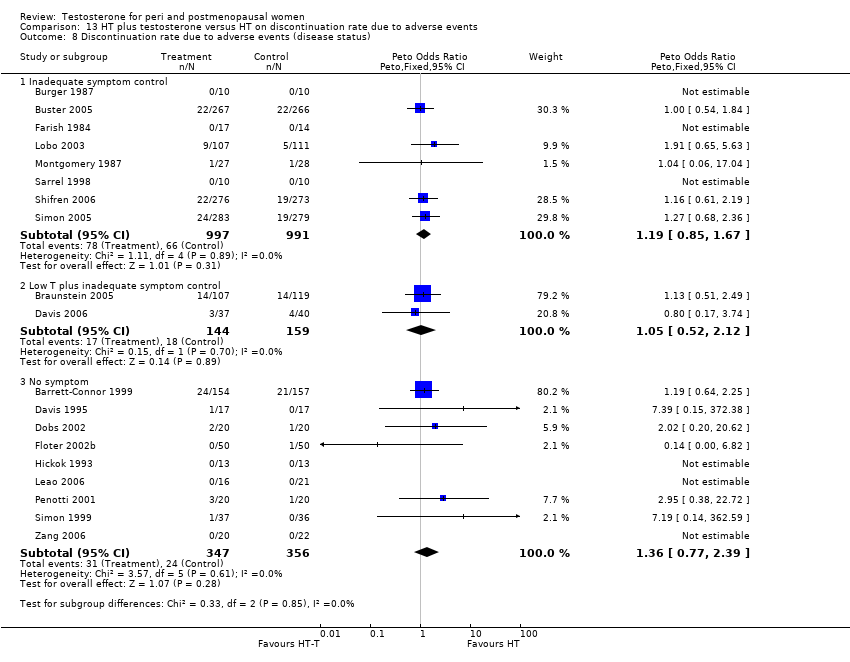
Comparison 13 HT plus testosterone versus HT on discontinuation rate due to adverse events, Outcome 8 Discontinuation rate due to adverse events (disease status).

Comparison 14 HT‐T versus HT on discontinuation rate (sensitivity analysis), Outcome 1 Discontinuation rate (allocation quality).

Comparison 14 HT‐T versus HT on discontinuation rate (sensitivity analysis), Outcome 2 Discontinuation rate due to adverse events (allocation quality).

Comparison 14 HT‐T versus HT on discontinuation rate (sensitivity analysis), Outcome 3 Discontinuation rate (quality of randomisation)).
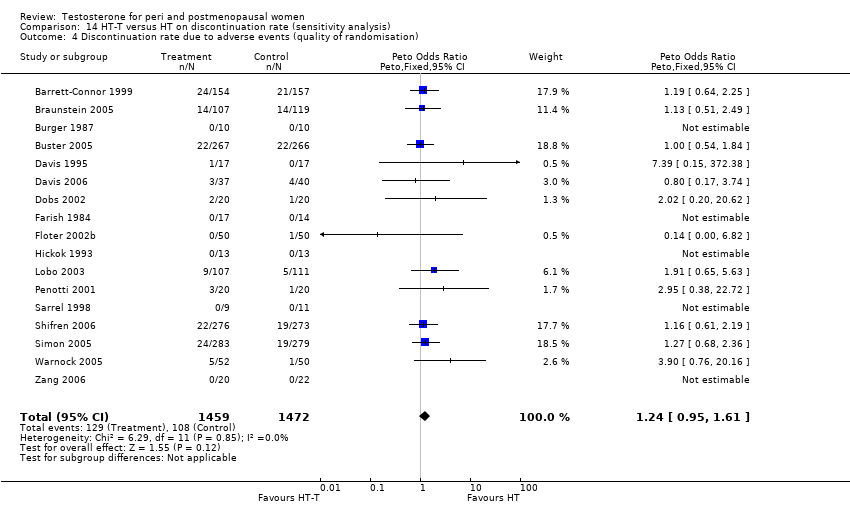
Comparison 14 HT‐T versus HT on discontinuation rate (sensitivity analysis), Outcome 4 Discontinuation rate due to adverse events (quality of randomisation).

Comparison 14 HT‐T versus HT on discontinuation rate (sensitivity analysis), Outcome 5 Discontinuation rate (blinding method).
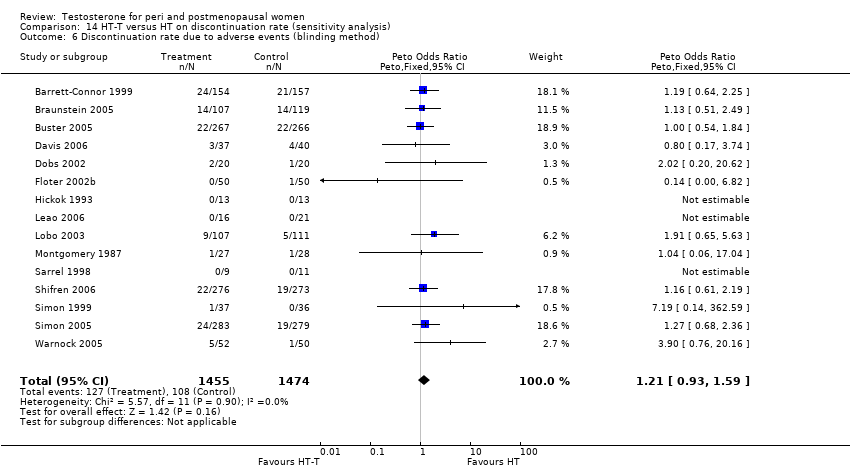
Comparison 14 HT‐T versus HT on discontinuation rate (sensitivity analysis), Outcome 6 Discontinuation rate due to adverse events (blinding method).
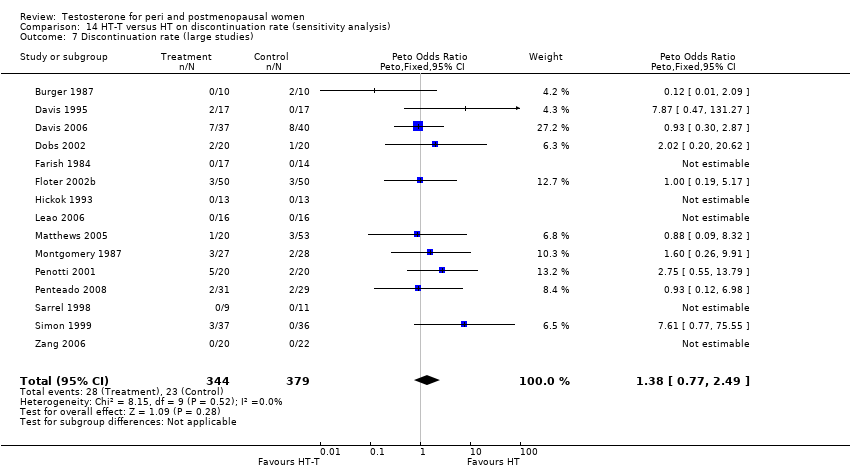
Comparison 14 HT‐T versus HT on discontinuation rate (sensitivity analysis), Outcome 7 Discontinuation rate (large studies).

Comparison 14 HT‐T versus HT on discontinuation rate (sensitivity analysis), Outcome 8 Discontinuation rate due to adverse events (large studies).

Comparison 14 HT‐T versus HT on discontinuation rate (sensitivity analysis), Outcome 9 Discontinuation rate (methyl testosterone doses).
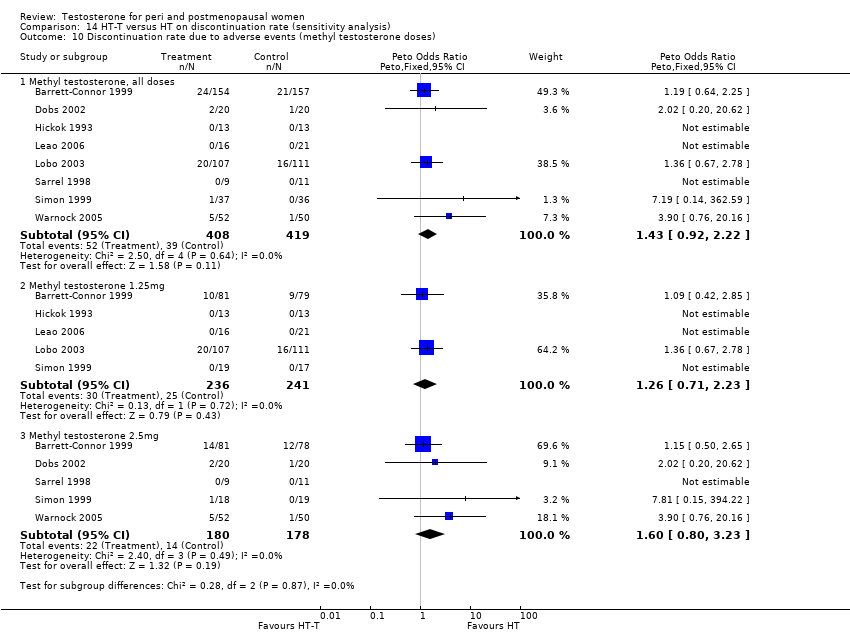
Comparison 14 HT‐T versus HT on discontinuation rate (sensitivity analysis), Outcome 10 Discontinuation rate due to adverse events (methyl testosterone doses).
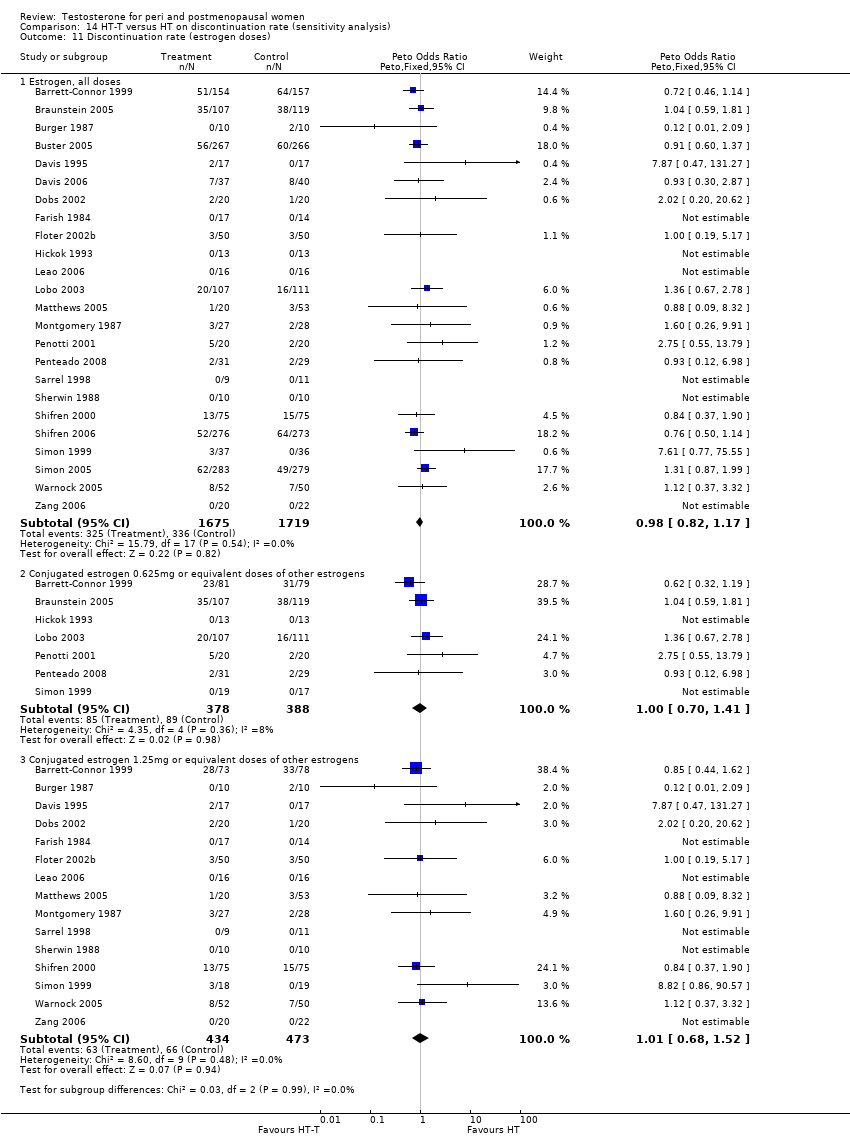
Comparison 14 HT‐T versus HT on discontinuation rate (sensitivity analysis), Outcome 11 Discontinuation rate (estrogen doses).

Comparison 14 HT‐T versus HT on discontinuation rate (sensitivity analysis), Outcome 12 Discontinuation rate due to adverse events (estrogen doses).
| Outcome | Study ID | N | Reason | Conclusion |
| Acne | 291 | The data was not available | Acne of mild or moderate severity was reported by 5 (3%) estrogen‐testosterone treated participants, whereas no participants receiving oestrogen reported acne | |
| Biochemical Markers of bone metabolism | 50 | A crossover study with no washout period | Both treatments had similar effects, with a significant decrease in bone resorption (ICTP) and bone turnover (osteocalcin) after 24 weeks. | |
| Biochemical markers of bone metabolism | 57 | The data was likely to be skewed because the means were smaller than twice the SDs | There were no between group differences noted in baseline Dpd levels(p=0.111), Dpd% change (P=0.338), baseline NTx levels (P=0.112), or NTx % change (P=0.271) | |
| Biochemical markers of bone metabolism | 28 | The data was not available | The effects of oestrogen‐testosterone and oestrogen alone on markers of bone resorption were generally similar. The increase in bone formation markers after oestrogen‐testosterone treatment was significantly different from the effect of oestrogen for all bone formation parameters. | |
| Bone mineral density of lumbar spine and femur | 199 | The data was not available | BMD increased in the estrogen‐testosterone(low dose) were comparable to those in the oestrogen(low dose) group, while the BMD changes at 24 months in the estrogen‐testosterone(high dose) group significantly exceeded those in oestrogen(high dose) group(P=0.014 for lumbar spine, BMD and P=0.009 for total hip BMD) | |
| Bone mineral density | 50 | A crossover study with no washout period. | No changes in BMD were noted in the total body, hip, or lumbar spine with either regimen | |
| Bone mineral density | 50 | The data was not available. | There was no significant differences in bone density at any of the sites measured between women receiving oestrogen alone and those receiving estrogen‐testosterone. No treated subjects had a significant bone loss(more than twice the measurement precision) at either spine or femoral neck at 1 year, but three in each treated group showed a small but non significant decrease at both sites | |
| Bone mineral density of L1‐L4, femur and forearm | 48 | The data was not available | The estrogen‐testosterone showed significant increases in spinal BMD at 12 and 24 months(P<0.01). The estrogen group demonstrated a non significant increase in spinal BMD. The difference between groups was not significant at 12 or 24 months. There were no significant changes in BMD from baseline in either group at the radius, femoral neck, Ward triangle, or greater trochanter | |
| Body composition | 40 | It was unclear with regard to the standard deviation (SD) of the data | ‐ When compared with oestrogen alone, estrogen‐testosterone treatment significantly increased lean body mass in the arms, legs, and trunk. Body fat percentage decreased significantly from baseline in the same arms, legs, and trunk in the oestrogen‐testosterone group but not the oestrogen alone group. When changes in arms, legs, and trunk in each participant were analysed simultaneously, the difference between treatments was significant for lean body mass(P=0.007) and percentage of fat tissue(P=0.077) | |
| Body composition | 50 | A crossover study with no washout period | There was no significant differences in total body fat, total lean body mass, trunk fat, and trunk lean mass between the two treatments | |
| Body composition | 37 | The data was likely to be skewed | When compared to HT alone, T‐HT treatment significantly increased visceral fat area (P = 0.009). However there was no significant difference in subcutaneous fat area between the two groups | |
| Cognition and psychological well being | 42 | A crossover study with no washout period | Switching Attention Test that mean reaction time in the switching condition was faster in the estrogen‐testosterone group than in the estrogen group(t=3.25, df=37, P<0.002, effect size = 0.53 SD). For other conditions of the same test, such as side condition and direction condition, they did not differ between two groups. | |
| Cognition | 49 | The data was not available | There was no comparative effects between oestrogen‐testosterone and oestrogen alone group. | |
| Cognition | 30 | The data was likely to be skewed | No significant interactions were found showing an advantage for oestrogen‐testosterone treated group as contrasted to oestrogen‐treated group | |
| Cognition (Cube Comparisons and Building Memory) | 26 | The data was likely to be skewed | Differences in task performance between women receiving E or E‐T treatment were assessed with a 2‐factor(treatment group x test session), mixed analysis of variance for each cognitive task. Post hoc comparisons were conducted using Tukey's method of multiple comparisons. With regard to Cube Comparisons, performance improved for both groups across test sessions, however this improvement only approached statistical significance (P=0.09). No other effects were significant. Regarding Building Memory, a main effect of test session was observed, with performance declining across sessions for both groups(P<0.01). A treatment x test session interaction was observed(P<0.05). Post hoc comparison revealed that this effect was due to a decrease in the E group(P<0.05) but not The E‐T group(P>0.1) across sessions. | |
| Hematocrit | 199 | The data was not available. | There was no clinically significant difference in haematology | |
| Hematocrit | 50 | A cross‐over study with no washout period | They reported that there was no change in blood counts during the study | |
| Hematocrit | 26 | The data was not available. | ‐ At 6 months, statistically significant between‐group differences were seen for hematocrit. The difference was small in magnitude, remained within the normal ranges, and was not considered clinically significant. | |
| Hematocrit | 67 | A cross‐over study with no washout period | Transdermal testosterone treatment had no significant effects on blood counts | |
| Hematocrit | 48 | The data were not available | No clinically significant changes in hematologic indices | |
| Hirsutism | 199 | The data was not available | Changes in hair growth in the oestrogen‐testosterone(low dose) group were similar to those in the oestrogen(low dose) group, and there were no statistically significant differences in the hirsutism scores between the treatment groups. In the high‐dose groups only four participants treated with oestrogen‐testosterone and two treated with oestrogen reported hirsutism as an adverse event at month 12. At 24 months, 10 oestrogen‐testosterone‐treated and 3 oestrogen‐treated participants reported hirsutism as an adverse event | |
| Hirsutism and acne | 50 | A crossover study with no washout period | Incidences of hirsutism and acne were similar in two treatment groups | |
| Hirsutism and acne | 67 | A crossover study with no washout period | The hirsutism and acne scores did not change significantly during treatment. The mean facial depilation rate increased slightly during treatment with estrogen‐testosterone 300 microgram | |
| Lipid profile | 40 | The data was not available. | After 16 weeks of treatment, significant decreases in total cholesterol, HDL, and triglycerides occurred in the estrogen‐testosterone group. LDL values were virtually unchanged. The oestrogen group demonstrated the opposite effect on lipids, with a significant decrease in LDL and no meaningful change in the other lipid parameters | |
| Lipid profile | 50 | A crossover study with no washout period | Serum levels of total testosterone increased markedly from a baseline mean of 0.8–4.9 mmol/l during testosterone addition. Total and LDL‐cholesterol levels were significantly reduced by both treatments as also were those of Lp‐(a) although the difference was not significant. A 13% reduction in HDL‐cholesterol levels was found when testosterone was added, but no change with oestrogen alone. Triglyceride levels were increased by oestrogen treatment, but not affected by the combination of oestrogen plus testosterone | |
| Lipid profile | 56 | The data was not available | There were significant reductions in total cholesterol and LDL cholesterol in all groups. In estrogen‐testosterone‐treated group triglyceride levels increased 26.0% and HDL cholesterol levels decreased 9.0%. In contrast, with oestrogen therapy triglyceride levels decreased 9.0% and HDL cholesterol levels increased 9.0% | |
| Lipid profile | 57 | The data was likely to be skewed because the means were smaller than twice the SDs | The study found significant reductions in total cholesterol and LDL cholesterol in all groups. Triglyceride levels increased 26.0% and HDL cholesterol levels decreased 9.0% in estrogen‐testosterone‐treated group. In contrast, with oestrogens therapy triglyceride levels decreased 9.0% and HDL cholesterol levels increased 9.0% | |
| Lipid profile | 60 | A crossover study with no washout period | Total cholesterol, triglycerides, HDL and LDL revealed no significant differences between any of the periods or groups | |
| Menopausal symptoms, sense of well being and sexual function | 199 | The data were not available | Women in all treatment groups reported an improvement in menopausal symptoms and quality of life measures at 24 months. There was a non significant trend toward greater improvement in well being and sexual interest and higher scores on the modified menopausal rating scale in the oestrogen‐testosterone groups | |
| Menopausal symptoms and sexual function | 40 | The data were non‐normal distribution | There were no significant differences between treatments on any variable at either 2 months or 6 months after treatment | |
| Menopausal symptoms | 26 | The data were non‐normal distribution | There was no statistically significant difference between two treatments in menopausal symptoms | |
| Menopausal symptoms | 51 | The data were not available | Vasomotor symptoms were reduced by at least 75% after treatment in all groups | |
| Menopausal symptoms | 28 | The data was likely to be skewed | Both treatments significantly decreased somatic symptom scores, but only estrogen‐testosterone treatment provided significant relief of psychosomatic and psychological symptoms | |
| Menopausal symptoms | 20 | The data was not available | There was no statistical difference between the estrogen‐testosterone groups versus the oestrogen group | |
| Menopausal symptoms | 49 | The data was not available | There was no result for the comparative effect on hot flushes between estrogen‐testosterone and oestrogen alone | |
| Menopausal symptoms | 43 | The data were not available | Menopausal index: | |
| Menopausal symptoms | 92 | The data was not available | In general, estrogen‐testosterone therapy provided greater relief from these symptoms than oestrogen therapy. This was most apparent in the finding that the degree of vasomotor symptom relief with low dose estrogen‐testosterone preparation was similar to relief experienced with higher dose estrogen therapy alone. | |
| Menopausal symptoms | 66 | The data were not available | There were no significant differences in somatic symptoms between the oestrogen and estrogen‐testosterone groups at baseline or after treatment. Psychosomatic and psychologic symptom values are not presented because of the small number of evaluable symptomatic participants | |
| Mood (hostility) | 36 | The data were not available | Hostility scores did not differ significantly in the two groups (testosterone‐oestrogen or oestrogen alone) | |
| Sense of well being | 40 | The data were not available. | With regard to QUALMS questionnaire, the oestrogen‐testosterone group showed significant improvement from baseline in somatic symptoms(week 10, P=0.003; week 16, P=0.073). The oestrogen group showed significant improvement from baseline in well being (week 16, P= 0.049) and cognition (week 10, P=0.054) | |
| Sense of well being | 50 | A crossover study with no washout period | There were no significant differences between the treatments in any of the sub scores or total PGWB index | |
| Sense of well being | 84 | The data were likely to be skewed | There was no difference in SRD 30 scores between the two active treatment groups at either 2 or 4 months | |
| Sense of well being | 40 | The data were not available. | No conclusion on psycho‐physical well being. | |
| Sense of well being | 35 | A cross‐over study with no washout period | No significant effects of adding testosterone into hormone therapy | |
| Sense of well being | 43 | The data was not available. | Anxiety: There was no differences among any of the groups across time. | |
| Sense of well being | 65 | A crossover study with no washout period | Adding 300 microgram patch into oral oestrogen has a significant improvement in general well being by means of PGWB (P=0.04). There also were significant increases with oestrogen‐testosterone 300 microgram treatment for sub scales of positive well being and depressed mood. | |
| Sexual function | 20 | The data was not available. | After six weeks the loss of libido in the single implant group remained, while the combined group showed significant symptomatic relief(P<0.01). Eight in the single implant group chose to have a testosterone implant at the first follow up visit at 6 weeks; the other two stopped coming because of dissatisfaction with the treatment | |
| Sexual function | 40 | The data was not available. | The sample size was not powered, nor was entry criteria designed to assess sexual dysfunction parameters; however, there were significant results. In the oestrogen‐testosterone group, BISF‐W mean increases at each visit were statistically significant for frequency/psychosexual(P=0.05) and pleasure/orgasm(P=0.041) domains. The mean composite BISF‐W score increased in the oestrogen‐testosterone group, whereas the mean score in the estrogen group decreased. Although it appeared that the two treatment groups were not well balanced at baseline(the estrogen group seemed to have healthier sexual function at baseline than the estrogen‐testosterone group), the estrogen‐testosterone group showed significant improvement in sexual function compared with the estrogen group. | |
| Sexual function (total McCoy score) | 44 | A crossover study with no washout period | After 24 weeks of treatment, the addition of testosterone had a significantly better effect on the variables 'enjoyment of sex', 'satisfaction with frequency of sexual activity' and 'interest in sex'. The total McCoy score was significantly increased by both treatments, but the addition of testosterone exerted a stronger effect (P<0.05) | |
| Sexual function | 51 | The data was not available | Improvement (P<0.05) in sexual interest, sexual satisfaction, frequency of sexual intercourse and intensity and frequency of orgasm during sexual intercourse were reported in all groups except the estrogen alone group | |
| Sexual function | 60 | A cross‐over study with no washout period | The scores concerning frequency of sexual activity, orgasm and intercourse, sexual arousal, fantasies and enjoyment, satisfaction with orgasms, and interest in sex were all significantly improved for testosterone addition as compared to placebo both before and after crossover | |
| Sexual function(desire and satisfaction) | 33 | The data was not available | No difference between two groups was observed at any of the considered time points. | |
| Sexual function | 30 | The data was likely to be skewed | Oestrogen‐testosterone‐treated participants reported significantly less lack of sexual desire or interest to engage in sexual activity, compared to participants receiving oestrogen alone | |
| Sexual function | 43 | The data was not available | Women who received either of the androgen‐containing preparations had significantly higher scores than women in the estrogen and placebo groups(P<0.01) in association with their higher levels of plasma testosterone. Women in the estrogen‐testosterone and testosterone‐only group experienced a greater number of fantasies during every treatment than did women in the oestrogen and placebo group (P<0.01). During treatment phases, both androgen groups attained higher levels of sexual arousal than did the estrogen and placebo groups(P<0.01) | |
| Sexual function (scores) | 65 | A cross‐over study with no washout period | The mean composite score expressed as a percentage of the mean value for normal women, increased from 52(27) percent at baseline to 72(38) percent during estrogen treatment, 74(37) percent during treatment with estrogen plus 150 microgram of testosterone per day, and 81(37) percent during treatment with estrogen plus 300 microgram of testosterone per day(P=0.05 for the comparison with estrogen‐alone). The scores for thoughts‐desire, frequency of sexual activity, and pleasure‐orgasm were lowest at baseline and increased in a dose‐dependent fashion. With the estrogen plus testosterone 300 microgram, the increases in scores for frequency of sexual activity and pleasure‐orgasm were significantly greater than those with estrogen‐alone (P=0.03 for both comparisons). The score for problems affecting sexual function was 116%(48) of the normative mean at baseline and decreased to 98%(49) during treatment with estrogen plus 300 microgram of testosterone(P=0.07 for the comparison with oestrogen‐alone) | |
| Sexual function (the prevalence of particular types of sexual behavior) | 65 | A crossover study with no washout period | The percentage of women who reported having sexual fantasies at least once a week was 12% at baseline, 10% during oestrogen treatment, 18 percent during estrogen plus testosterone 150 microgram, and 24% during treatment with estrogen plus 300 microgram of testosterone. The percentage of women who reported masturbating at least once a week was 3%, 5% and 10% at baseline, estrogen treatment and estrogen plus testosterone treatment, respectively. Finally, the percentage of women who engaged in sexual intercourse at least once a week was 23% at baseline, 35% during treatment with either oestrogen‐alone or oestrogen plus 150 microgram of testosterone, and 41% during treatment with oestrogen plus 300 microgram of testosterone | |
| Unexplained fatigue (vitality) | 50 | A crossover study with no washout period | There was no significant difference between the treatments in vitality | |
| Unexplained fatigue (vitality) | 67 | A crossover study with no washout period | Vitality improved in women treated with testosterone patch combined with oral conjugated equine oestrogen | |
| Unexplained fatigue and sense of well being | 43 | The data was not available | Women in estrogen alone and placebo groups reported significantly lower ratings of energy level and well being than did those who received either of the androgen‐containing preparations (P<0.01) |
| Outcome or subgroup title | No. of studies | No. of participants | Statistical method | Effect size |
| 1 Sense of well‐being Show forest plot | 2 | Std. Mean Difference (IV, Fixed, 95% CI) | Subtotals only | |
| 1.1 sexual function | 2 | 160 | Std. Mean Difference (IV, Fixed, 95% CI) | 0.47 [0.15, 0.80] |
| 1.2 Cognitive difficulty | 1 | 95 | Std. Mean Difference (IV, Fixed, 95% CI) | 0.0 [‐0.40, 0.40] |
| 1.3 Somatic or physical symptoms | 2 | 164 | Std. Mean Difference (IV, Fixed, 95% CI) | 0.21 [‐0.11, 0.54] |
| 1.4 Anxiety or fear | 1 | 95 | Std. Mean Difference (IV, Fixed, 95% CI) | ‐0.30 [‐0.70, 0.11] |
| 1.5 Depressed mood | 1 | 95 | Std. Mean Difference (IV, Fixed, 95% CI) | 0.26 [‐0.14, 0.67] |
| 1.6 Vasomotor symptoms | 2 | 166 | Std. Mean Difference (IV, Fixed, 95% CI) | 0.24 [‐0.08, 0.56] |
| 1.7 Sleep problems | 1 | 95 | Std. Mean Difference (IV, Fixed, 95% CI) | 0.05 [‐0.35, 0.45] |
| 1.8 Menstrual symptoms | 1 | 95 | Std. Mean Difference (IV, Fixed, 95% CI) | ‐0.11 [‐0.52, 0.29] |
| 1.9 Attractiveness | 1 | 95 | Std. Mean Difference (IV, Fixed, 95% CI) | 0.18 [‐0.23, 0.58] |
| 1.10 Psychosocial | 1 | 70 | Std. Mean Difference (IV, Fixed, 95% CI) | ‐0.05 [‐0.57, 0.47] |
| Outcome or subgroup title | No. of studies | No. of participants | Statistical method | Effect size |
| 1 Change scores of sexual function Show forest plot | 9 | Std. Mean Difference (IV, Fixed, 95% CI) | Subtotals only | |
| 1.1 Number of satisfying | 5 | 1893 | Std. Mean Difference (IV, Fixed, 95% CI) | 0.29 [0.20, 0.38] |
| 1.2 Number of activity | 7 | 1946 | Std. Mean Difference (IV, Fixed, 95% CI) | 0.25 [0.17, 0.34] |
| 1.3 Number of orgasms | 5 | 1893 | Std. Mean Difference (IV, Fixed, 95% CI) | 0.30 [0.21, 0.39] |
| 1.4 Libido, desire or interest in sex | 9 | 2215 | Std. Mean Difference (IV, Fixed, 95% CI) | 0.35 [0.26, 0.43] |
| 1.5 Orgasm | 6 | 1872 | Std. Mean Difference (IV, Fixed, 95% CI) | 0.28 [0.19, 0.37] |
| 1.6 Arousal | 5 | 1845 | Std. Mean Difference (IV, Fixed, 95% CI) | 0.36 [0.27, 0.45] |
| 1.7 Pleasure or enjoyment of sex | 6 | 1641 | Std. Mean Difference (IV, Fixed, 95% CI) | 0.33 [0.22, 0.43] |
| 1.8 Sexual concerns | 5 | 1852 | Std. Mean Difference (IV, Fixed, 95% CI) | 0.32 [0.22, 0.41] |
| 1.9 Responsiveness | 8 | 2171 | Std. Mean Difference (IV, Fixed, 95% CI) | 0.32 [0.23, 0.40] |
| 1.10 Sexual self‐image | 5 | 1839 | Std. Mean Difference (IV, Fixed, 95% CI) | 0.26 [0.16, 0.35] |
| 1.11 Satisfaction | 1 | 32 | Std. Mean Difference (IV, Fixed, 95% CI) | 0.98 [0.24, 1.72] |
| 1.12 Fantasy | 1 | 32 | Std. Mean Difference (IV, Fixed, 95% CI) | 1.37 [0.59, 2.15] |
| 1.13 Frequency of desire | 1 | 96 | Std. Mean Difference (IV, Fixed, 95% CI) | 0.21 [‐0.19, 0.61] |
| 1.14 Composite score | 3 | 330 | Std. Mean Difference (IV, Fixed, 95% CI) | 0.41 [0.19, 0.63] |
| 2 Change scores of Personal Distress Scale Show forest plot | 5 | 1845 | Mean Difference (IV, Fixed, 95% CI) | ‐8.13 [‐10.59, ‐5.67] |
| 2.1 Personal Distress Scale | 5 | 1845 | Mean Difference (IV, Fixed, 95% CI) | ‐8.13 [‐10.59, ‐5.67] |
| Outcome or subgroup title | No. of studies | No. of participants | Statistical method | Effect size |
| 1 Lumbar BMDs at 12 months Show forest plot | 2 | Mean Difference (IV, Fixed, 95% CI) | Subtotals only | |
| 1.1 Mean score | 2 | 90 | Mean Difference (IV, Fixed, 95% CI) | ‐0.05 [‐0.11, 0.00] |
| 1.2 Change score | 1 | 57 | Mean Difference (IV, Fixed, 95% CI) | ‐0.40 [‐1.93, 1.13] |
| 2 Lumbar BMDs at 24 months Show forest plot | 1 | Mean Difference (IV, Fixed, 95% CI) | Subtotals only | |
| 2.1 Mean score | 0 | 0 | Mean Difference (IV, Fixed, 95% CI) | 0.0 [0.0, 0.0] |
| 2.2 Change score | 1 | 32 | Mean Difference (IV, Fixed, 95% CI) | ‐0.08 [‐0.19, 0.03] |
| 3 Femur BMDs at 12 months Show forest plot | 2 | Mean Difference (IV, Fixed, 95% CI) | Subtotals only | |
| 3.1 Mean score | 2 | 90 | Mean Difference (IV, Fixed, 95% CI) | ‐0.05 [‐0.09, ‐0.01] |
| 3.2 Change score | 1 | 57 | Mean Difference (IV, Fixed, 95% CI) | 1.4 [0.14, 2.66] |
| 4 Femur BMDs at 24 months Show forest plot | 1 | Mean Difference (IV, Fixed, 95% CI) | Subtotals only | |
| 4.1 Mean score | 1 | 32 | Mean Difference (IV, Fixed, 95% CI) | ‐0.07 [‐0.16, 0.02] |
| 4.2 Change score | 0 | 0 | Mean Difference (IV, Fixed, 95% CI) | 0.0 [0.0, 0.0] |
| Outcome or subgroup title | No. of studies | No. of participants | Statistical method | Effect size |
| 1 Weight Show forest plot | 3 | Mean Difference (IV, Fixed, 95% CI) | Subtotals only | |
| 1.1 Mean weight at the endpoint (3 months) | 1 | 42 | Mean Difference (IV, Fixed, 95% CI) | 1.30 [‐3.86, 6.46] |
| 1.2 Mean weight at the endpoint (6 months) | 1 | 37 | Mean Difference (IV, Fixed, 95% CI) | 5.40 [‐4.79, 15.59] |
| 1.3 Mean weight at the endpoint (12 months) | 1 | 37 | Mean Difference (IV, Fixed, 95% CI) | 6.30 [‐3.83, 16.43] |
| 1.4 Weight gain | 1 | 37 | Mean Difference (IV, Fixed, 95% CI) | 1.18 [‐0.25, 2.61] |
| 2 Body mass index Show forest plot | 2 | Mean Difference (IV, Fixed, 95% CI) | Subtotals only | |
| 2.1 Body mass index at 3 months | 1 | 42 | Mean Difference (IV, Fixed, 95% CI) | 1.0 [‐0.64, 2.64] |
| 2.2 Body mass index at 6 months | 1 | 37 | Mean Difference (IV, Fixed, 95% CI) | 1.60 [‐2.31, 5.51] |
| 2.3 Body mass index at 12 months | 1 | 37 | Mean Difference (IV, Fixed, 95% CI) | 2.10 [‐1.83, 6.03] |
| 3 Waist:hip ratio Show forest plot | 1 | Mean Difference (IV, Fixed, 95% CI) | Subtotals only | |
| 3.1 At 6 months | 1 | 37 | Mean Difference (IV, Fixed, 95% CI) | ‐0.05 [‐0.08, ‐0.02] |
| 3.2 At 12 months | 1 | 37 | Mean Difference (IV, Fixed, 95% CI) | ‐0.03 [‐0.06, 0.00] |
| Outcome or subgroup title | No. of studies | No. of participants | Statistical method | Effect size |
| 1 Cognitive performance Show forest plot | 1 | Mean Difference (IV, Fixed, 95% CI) | Subtotals only | |
| 1.1 Identical Pictures | 1 | 26 | Mean Difference (IV, Fixed, 95% CI) | ‐2.40 [‐6.67, 1.87] |
| 1.2 Shape Memory | 1 | 26 | Mean Difference (IV, Fixed, 95% CI) | 0.10 [‐2.19, 2.39] |
| 2 Cognition difficulty Show forest plot | 1 | 95 | Mean Difference (IV, Fixed, 95% CI) | 0.0 [‐0.21, 0.21] |
| Outcome or subgroup title | No. of studies | No. of participants | Statistical method | Effect size |
| 1 Vasomotor symptom Show forest plot | 2 | 166 | Mean Difference (IV, Fixed, 95% CI) | 0.09 [‐0.18, 0.37] |
| Outcome or subgroup title | No. of studies | No. of participants | Statistical method | Effect size |
| 1 Mean scores of facial and body hair growth Show forest plot | 1 | Mean Difference (IV, Fixed, 95% CI) | Subtotals only | |
| 2 Incidence of facial and body hair growth Show forest plot | 7 | 2127 | Peto Odds Ratio (Peto, Fixed, 95% CI) | 1.52 [1.07, 2.17] |
| Outcome or subgroup title | No. of studies | No. of participants | Statistical method | Effect size |
| 1 Mean scores of acne Show forest plot | 1 | 216 | Mean Difference (IV, Fixed, 95% CI) | 0.1 [‐0.03, 0.23] |
| 2 Incidence of acne Show forest plot | 7 | 2127 | Peto Odds Ratio (Peto, Fixed, 95% CI) | 1.51 [1.07, 2.14] |
| Outcome or subgroup title | No. of studies | No. of participants | Statistical method | Effect size |
| 1 Incidence of increased breast density Show forest plot | 1 | 87 | Odds Ratio (M‐H, Fixed, 95% CI) | 1.35 [0.46, 3.95] |
| 2 Area of dense breast Show forest plot | 1 | 87 | Mean Difference (IV, Fixed, 95% CI) | 0.0 [‐7.62, 7.62] |
| Outcome or subgroup title | No. of studies | No. of participants | Statistical method | Effect size |
| 1 Total cholesterol at less than 3 months Show forest plot | 4 | 231 | Mean Difference (IV, Random, 95% CI) | ‐14.92 [‐27.81, ‐2.03] |
| 2 Triglyceride at less than 3 months Show forest plot | 4 | Mean Difference (IV, Random, 95% CI) | Totals not selected | |
| 3 LDL cholesterol at less than 3 months Show forest plot | 3 | Mean Difference (IV, Random, 95% CI) | Totals not selected | |
| 4 HDL cholesterol at less than 3 months Show forest plot | 4 | 231 | Mean Difference (IV, Random, 95% CI) | ‐17.11 [‐23.47, ‐10.75] |
| 5 Total cholesterol at 3 ‐ <6 months Show forest plot | 2 | 256 | Mean Difference (IV, Random, 95% CI) | ‐9.42 [‐31.76, 12.93] |
| 5.1 Mean score | 1 | 40 | Mean Difference (IV, Random, 95% CI) | 3.87 [‐15.08, 22.82] |
| 5.2 Change score | 1 | 216 | Mean Difference (IV, Random, 95% CI) | ‐19.2 [‐26.16, ‐12.24] |
| 6 Triglyceride at 3 ‐ <6 months Show forest plot | 2 | 256 | Mean Difference (IV, Fixed, 95% CI) | ‐25.62 [‐38.53, ‐12.72] |
| 6.1 Mean score | 1 | 40 | Mean Difference (IV, Fixed, 95% CI) | ‐44.29 [‐85.55, ‐3.03] |
| 6.2 Change score | 1 | 216 | Mean Difference (IV, Fixed, 95% CI) | ‐23.6 [‐37.18, ‐10.02] |
| 7 LDL cholesterol at 3 ‐ <6 months Show forest plot | 2 | 256 | Mean Difference (IV, Random, 95% CI) | 18.78 [‐18.39, 55.94] |
| 7.1 Mean score | 1 | 40 | Mean Difference (IV, Random, 95% CI) | 38.67 [21.22, 56.12] |
| 7.2 Change score | 1 | 216 | Mean Difference (IV, Random, 95% CI) | 0.7 [‐5.58, 6.98] |
| 8 HDL cholesterol at 3 ‐ <6 months Show forest plot | 2 | 256 | Mean Difference (IV, Random, 95% CI) | ‐18.72 [‐26.04, ‐11.39] |
| 8.1 Mean score | 1 | 40 | Mean Difference (IV, Random, 95% CI) | ‐23.2 [‐30.19, ‐16.21] |
| 8.2 Change score | 1 | 216 | Mean Difference (IV, Random, 95% CI) | ‐15.60 [‐18.59, ‐12.61] |
| 9 Total cholesterol/HDL cholesterol at 3 ‐ <6 months | 0 | 0 | Mean Difference (IV, Fixed, 95% CI) | 0.0 [0.0, 0.0] |
| 10 Total cholesterol at 6 ‐ <12 months Show forest plot | 10 | 1910 | Mean Difference (IV, Random, 95% CI) | ‐2.93 [‐7.18, 1.32] |
| 10.1 Mean score | 3 | 101 | Mean Difference (IV, Random, 95% CI) | ‐6.27 [‐20.41, 7.88] |
| 10.2 Change score | 7 | 1809 | Mean Difference (IV, Random, 95% CI) | ‐2.74 [‐7.47, 2.00] |
| 11 Triglyceride at 6 ‐ <12 months Show forest plot | 10 | 1909 | Mean Difference (IV, Random, 95% CI) | ‐5.79 [‐14.25, 2.67] |
| 11.1 Mean score | 3 | 101 | Mean Difference (IV, Random, 95% CI) | 7.00 [‐8.74, 22.74] |
| 11.2 Change score | 7 | 1808 | Mean Difference (IV, Random, 95% CI) | ‐8.64 [‐18.40, 1.11] |
| 12 LDL cholesterol at 6 ‐ <12 months Show forest plot | 10 | 1906 | Mean Difference (IV, Fixed, 95% CI) | 1.86 [‐0.15, 3.87] |
| 12.1 Mean score | 3 | 101 | Mean Difference (IV, Fixed, 95% CI) | 3.24 [‐10.76, 17.23] |
| 12.2 Change score | 7 | 1805 | Mean Difference (IV, Fixed, 95% CI) | 1.83 [‐0.20, 3.86] |
| 13 HDL cholesterol at 6 ‐ <12 months Show forest plot | 10 | 1907 | Mean Difference (IV, Random, 95% CI) | ‐5.84 [‐9.10, ‐2.58] |
| 13.1 Mean score | 3 | 101 | Mean Difference (IV, Random, 95% CI) | ‐9.38 [‐13.64, ‐5.12] |
| 13.2 Change score | 7 | 1806 | Mean Difference (IV, Random, 95% CI) | ‐4.74 [‐8.42, ‐1.07] |
| 14 Total cholesterol/HDL at 6 ‐ <12 months Show forest plot | 1 | 45 | Mean Difference (IV, Fixed, 95% CI) | 20.6 [12.76, 28.44] |
| 14.1 Change score | 1 | 45 | Mean Difference (IV, Fixed, 95% CI) | 20.6 [12.76, 28.44] |
| 15 Total cholesterol at 12 months Show forest plot | 4 | 231 | Mean Difference (IV, Random, 95% CI) | ‐7.99 [‐23.45, 7.48] |
| 15.1 Mean score | 2 | 70 | Mean Difference (IV, Random, 95% CI) | 1.75 [‐15.03, 18.52] |
| 15.2 Change score | 2 | 161 | Mean Difference (IV, Random, 95% CI) | ‐14.35 [‐38.05, 9.35] |
| 16 Triglyceride at 12 months Show forest plot | 4 | 231 | Mean Difference (IV, Random, 95% CI) | ‐23.38 [‐55.53, 8.76] |
| 16.1 Mean score | 2 | 70 | Mean Difference (IV, Random, 95% CI) | 3.92 [‐21.60, 29.43] |
| 16.2 Change score | 2 | 161 | Mean Difference (IV, Random, 95% CI) | ‐45.29 [‐80.17, ‐10.40] |
| 17 LDL cholesterol at 12 months Show forest plot | 4 | 231 | Mean Difference (IV, Fixed, 95% CI) | 8.84 [2.13, 15.54] |
| 17.1 Mean score | 2 | 70 | Mean Difference (IV, Fixed, 95% CI) | 5.81 [‐10.02, 21.64] |
| 17.2 Change score | 2 | 161 | Mean Difference (IV, Fixed, 95% CI) | 9.50 [2.10, 16.90] |
| 18 HDL cholesterol at 12 months Show forest plot | 4 | 231 | Mean Difference (IV, Random, 95% CI) | ‐14.49 [‐25.28, ‐3.70] |
| 18.1 Mean score | 2 | 70 | Mean Difference (IV, Random, 95% CI) | ‐7.22 [‐13.99, ‐0.45] |
| 18.2 Change score | 2 | 161 | Mean Difference (IV, Random, 95% CI) | ‐23.64 [‐28.95, ‐18.33] |
| 19 Total cholesterol/HDL at 12 months Show forest plot | 1 | 45 | Mean Difference (IV, Fixed, 95% CI) | 15.40 [4.40, 26.40] |
| 19.1 Mean score | 0 | 0 | Mean Difference (IV, Fixed, 95% CI) | 0.0 [0.0, 0.0] |
| 19.2 Change score | 1 | 45 | Mean Difference (IV, Fixed, 95% CI) | 15.40 [4.40, 26.40] |
| 20 Total cholesterol at 24 months Show forest plot | 3 | 167 | Mean Difference (IV, Random, 95% CI) | ‐11.69 [‐32.36, 8.97] |
| 20.1 Mean change | 1 | 32 | Mean Difference (IV, Random, 95% CI) | 3.87 [‐24.74, 32.48] |
| 20.2 Change score | 2 | 135 | Mean Difference (IV, Random, 95% CI) | ‐16.63 [‐42.67, 9.42] |
| 21 Triglyceride at 24 months Show forest plot | 3 | 167 | Mean Difference (IV, Fixed, 95% CI) | ‐52.46 [‐69.58, ‐35.35] |
| 21.1 Mean change | 1 | 32 | Mean Difference (IV, Fixed, 95% CI) | 0.0 [‐54.94, 54.94] |
| 21.2 Change score | 2 | 135 | Mean Difference (IV, Fixed, 95% CI) | ‐58.11 [‐76.12, ‐40.09] |
| 22 LDL cholesterol at 24 months Show forest plot | 3 | 167 | Mean Difference (IV, Fixed, 95% CI) | 9.15 [1.09, 17.20] |
| 22.1 Mean change | 1 | 32 | Mean Difference (IV, Fixed, 95% CI) | 3.87 [‐20.94, 28.68] |
| 22.2 Change score | 2 | 135 | Mean Difference (IV, Fixed, 95% CI) | 9.77 [1.26, 18.29] |
| 23 HDL cholesterol at 24 months Show forest plot | 3 | 167 | Mean Difference (IV, Random, 95% CI) | ‐17.63 [‐31.45, ‐3.80] |
| 23.1 Mean change | 1 | 32 | Mean Difference (IV, Random, 95% CI) | 0.0 [‐11.76, 11.76] |
| 23.2 Change score | 2 | 135 | Mean Difference (IV, Random, 95% CI) | ‐26.34 [‐28.00, ‐22.69] |
| 24 Total cholesterol/HDL at 24 months Show forest plot | 1 | 45 | Mean Difference (IV, Fixed, 95% CI) | 20.80 [11.00, 30.60] |
| 24.1 Mean change | 0 | 0 | Mean Difference (IV, Fixed, 95% CI) | 0.0 [0.0, 0.0] |
| 24.2 Change score | 1 | 45 | Mean Difference (IV, Fixed, 95% CI) | 20.80 [11.00, 30.60] |
| Outcome or subgroup title | No. of studies | No. of participants | Statistical method | Effect size |
| 1 Total cholesterol Show forest plot | 17 | 2488 | Mean Difference (IV, Random, 95% CI) | ‐7.59 [‐13.08, ‐2.10] |
| 1.1 Testosterone patch | 5 | 1738 | Mean Difference (IV, Random, 95% CI) | 0.08 [‐2.37, 2.52] |
| 1.2 Testosterone implant | 2 | 63 | Mean Difference (IV, Random, 95% CI) | ‐2.34 [‐23.12, 18.45] |
| 1.3 Oral testosterone | 10 | 687 | Mean Difference (IV, Random, 95% CI) | ‐14.02 [‐21.63, ‐6.40] |
| 2 HDL cholesterol Show forest plot | 17 | Mean Difference (IV, Random, 95% CI) | Subtotals only | |
| 2.1 Testosterone patch | 5 | 1735 | Mean Difference (IV, Random, 95% CI) | ‐1.09 [‐1.98, ‐0.19] |
| 2.2 Testosterone implant | 2 | 63 | Mean Difference (IV, Random, 95% CI) | ‐5.01 [‐11.72, 1.70] |
| 2.3 Oral testosterone | 10 | 687 | Mean Difference (IV, Random, 95% CI) | ‐18.63 [‐22.18, ‐15.08] |
| 3 LDL cholesterol Show forest plot | 16 | 2406 | Mean Difference (IV, Random, 95% CI) | 4.41 [0.76, 8.07] |
| 3.1 Testosterone patch | 5 | 1734 | Mean Difference (IV, Random, 95% CI) | 1.77 [‐0.34, 3.87] |
| 3.2 Testosterone implant | 2 | 64 | Mean Difference (IV, Random, 95% CI) | 3.37 [‐13.92, 20.66] |
| 3.3 Oral testosterone | 9 | 608 | Mean Difference (IV, Random, 95% CI) | 10.39 [1.46, 19.32] |
| 4 Triglyceride Show forest plot | 17 | 2487 | Mean Difference (IV, Random, 95% CI) | ‐14.80 [‐23.24, ‐6.36] |
| 4.1 Testosterone patch | 5 | 1737 | Mean Difference (IV, Random, 95% CI) | ‐3.64 [‐8.73, 1.44] |
| 4.2 Testosterone implant | 2 | 63 | Mean Difference (IV, Random, 95% CI) | 9.10 [‐16.04, 34.24] |
| 4.3 Oral testosterone | 10 | 687 | Mean Difference (IV, Random, 95% CI) | ‐27.07 [‐41.44, ‐12.70] |
| 5 Total cholesterol/HDL Show forest plot | 1 | 45 | Mean Difference (IV, Fixed, 95% CI) | 20.80 [11.00, 30.60] |
| 5.1 Testosterone patch | 0 | 0 | Mean Difference (IV, Fixed, 95% CI) | 0.0 [0.0, 0.0] |
| 5.2 Testosterone implant | 0 | 0 | Mean Difference (IV, Fixed, 95% CI) | 0.0 [0.0, 0.0] |
| 5.3 Oral testosterone | 1 | 45 | Mean Difference (IV, Fixed, 95% CI) | 20.80 [11.00, 30.60] |
| Outcome or subgroup title | No. of studies | No. of participants | Statistical method | Effect size |
| 1 Discontinuation rate (overall) Show forest plot | 21 | 3124 | Peto Odds Ratio (Peto, Fixed, 95% CI) | 0.99 [0.83, 1.19] |
| 2 Discontinuation rate (type of menopause) Show forest plot | 20 | Peto Odds Ratio (Peto, Fixed, 95% CI) | Subtotals only | |
| 2.1 Surgical menopause | 8 | 1942 | Peto Odds Ratio (Peto, Fixed, 95% CI) | 1.09 [0.87, 1.36] |
| 2.2 Natural menopause | 5 | 764 | Peto Odds Ratio (Peto, Fixed, 95% CI) | 0.88 [0.60, 1.29] |
| 2.3 Both | 7 | 419 | Peto Odds Ratio (Peto, Fixed, 95% CI) | 1.44 [0.79, 2.63] |
| 3 Discontinuation rate (menopausal status) Show forest plot | 22 | Peto Odds Ratio (Peto, Fixed, 95% CI) | Subtotals only | |
| 3.1 Perimenopausal | 0 | 0 | Peto Odds Ratio (Peto, Fixed, 95% CI) | 0.0 [0.0, 0.0] |
| 3.2 Postmenopausal | 19 | 3076 | Peto Odds Ratio (Peto, Fixed, 95% CI) | 1.04 [0.86, 1.25] |
| 3.3 Both | 3 | 148 | Peto Odds Ratio (Peto, Fixed, 95% CI) | 3.26 [0.85, 12.47] |
| 4 Discontinuation rate (route of hormone therapy) Show forest plot | 22 | Peto Odds Ratio (Peto, Fixed, 95% CI) | Subtotals only | |
| 4.1 Oral HT | 13 | 1840 | Peto Odds Ratio (Peto, Fixed, 95% CI) | 1.01 [0.79, 1.30] |
| 4.2 Non‐oral HT | 7 | 289 | Peto Odds Ratio (Peto, Fixed, 95% CI) | 1.32 [0.62, 2.82] |
| 4.3 Oral and non‐oral HT | 2 | 1095 | Peto Odds Ratio (Peto, Fixed, 95% CI) | 1.09 [0.82, 1.46] |
| 5 Discontinuation rate (type of testosterone) Show forest plot | 22 | Peto Odds Ratio (Peto, Fixed, 95% CI) | Subtotals only | |
| 5.1 Methyl testosterone | 10 | 955 | Peto Odds Ratio (Peto, Fixed, 95% CI) | 1.33 [0.89, 1.98] |
| 5.2 Testosterone | 9 | 2087 | Peto Odds Ratio (Peto, Fixed, 95% CI) | 0.98 [0.79, 1.21] |
| 5.3 Other | 3 | 182 | Peto Odds Ratio (Peto, Fixed, 95% CI) | 1.68 [0.53, 5.29] |
| 6 Discontinuation rate (duration of treatment) Show forest plot | 22 | Peto Odds Ratio (Peto, Fixed, 95% CI) | Subtotals only | |
| 6.1 Less than 3 months | 3 | 195 | Peto Odds Ratio (Peto, Fixed, 95% CI) | 1.20 [0.46, 3.10] |
| 6.2 3 ‐ <6 months | 5 | 428 | Peto Odds Ratio (Peto, Fixed, 95% CI) | 1.61 [0.87, 2.99] |
| 6.3 6 ‐ < 12 months | 10 | 2164 | Peto Odds Ratio (Peto, Fixed, 95% CI) | 0.98 [0.80, 1.21] |
| 6.4 12 ‐ < 24 months | 2 | 92 | Peto Odds Ratio (Peto, Fixed, 95% CI) | 0.93 [0.12, 6.98] |
| 6.5 24 months | 2 | 345 | Peto Odds Ratio (Peto, Fixed, 95% CI) | 1.31 [0.71, 2.42] |
| 7 Discontinuation rate (blinding) Show forest plot | 22 | Peto Odds Ratio (Peto, Fixed, 95% CI) | Subtotals only | |
| 7.1 Double‐blind | 18 | 3088 | Peto Odds Ratio (Peto, Fixed, 95% CI) | 1.05 [0.87, 1.26] |
| 7.2 Open or single‐blind | 4 | 136 | Peto Odds Ratio (Peto, Fixed, 95% CI) | 1.85 [0.53, 6.49] |
| 8 Discontinuation rate (disease status) Show forest plot | 21 | Peto Odds Ratio (Peto, Fixed, 95% CI) | Subtotals only | |
| 8.1 Inadequate symptom control | 9 | 2048 | Peto Odds Ratio (Peto, Fixed, 95% CI) | 1.00 [0.80, 1.25] |
| 8.2 Low T plus inadequate symptom control | 2 | 303 | Peto Odds Ratio (Peto, Fixed, 95% CI) | 1.02 [0.62, 1.67] |
| 8.3 No symptom | 10 | 771 | Peto Odds Ratio (Peto, Fixed, 95% CI) | 1.49 [0.90, 2.46] |
| Outcome or subgroup title | No. of studies | No. of participants | Statistical method | Effect size |
| 1 Discontinuation rate due to adverse events (overall) Show forest plot | 20 | 3096 | Peto Odds Ratio (Peto, Fixed, 95% CI) | 1.24 [0.95, 1.62] |
| 2 Discontinuation rate due to adverse events (type of menopause) Show forest plot | 19 | Peto Odds Ratio (Peto, Fixed, 95% CI) | Subtotals only | |
| 2.1 Surgical menopause | 8 | 1942 | Peto Odds Ratio (Peto, Fixed, 95% CI) | 1.16 [0.85, 1.59] |
| 2.2 Natural menopause | 4 | 704 | Peto Odds Ratio (Peto, Fixed, 95% CI) | 1.31 [0.72, 2.39] |
| 2.3 Both | 7 | 424 | Peto Odds Ratio (Peto, Fixed, 95% CI) | 1.94 [0.79, 4.78] |
| 3 Discontinuation rate due to adverse events (menopausal status) Show forest plot | 20 | Peto Odds Ratio (Peto, Fixed, 95% CI) | Subtotals only | |
| 3.1 Perimenopausal | 0 | 0 | Peto Odds Ratio (Peto, Fixed, 95% CI) | 0.0 [0.0, 0.0] |
| 3.2 Postmenopausal | 17 | 2948 | Peto Odds Ratio (Peto, Fixed, 95% CI) | 1.24 [0.95, 1.61] |
| 3.3 Both | 3 | 148 | Peto Odds Ratio (Peto, Fixed, 95% CI) | 1.99 [0.20, 19.45] |
| 4 Discontinuation rate due to adverse events (route of hormone therapy) Show forest plot | 19 | Peto Odds Ratio (Peto, Fixed, 95% CI) | Subtotals only | |
| 4.1 Oral HT | 11 | 1707 | Peto Odds Ratio (Peto, Fixed, 95% CI) | 1.31 [0.92, 1.86] |
| 4.2 Non‐oral HT | 7 | 294 | Peto Odds Ratio (Peto, Fixed, 95% CI) | 1.42 [0.48, 4.20] |
| 4.3 Oral and non‐oral HT | 2 | 606 | Peto Odds Ratio (Peto, Fixed, 95% CI) | 1.04 [0.57, 1.92] |
| 5 Discontinuation rate due to adverse events (type of testosterone) Show forest plot | 20 | Peto Odds Ratio (Peto, Fixed, 95% CI) | Subtotals only | |
| 5.1 Methyl testosterone | 8 | 827 | Peto Odds Ratio (Peto, Fixed, 95% CI) | 1.56 [0.94, 2.57] |
| 5.2 Testosterone | 9 | 2087 | Peto Odds Ratio (Peto, Fixed, 95% CI) | 1.13 [0.82, 1.55] |
| 5.3 Other | 3 | 182 | Peto Odds Ratio (Peto, Fixed, 95% CI) | 1.53 [0.25, 9.35] |
| 6 Discontinuation rate due to adverse events (duration of treatment) Show forest plot | 20 | Peto Odds Ratio (Peto, Fixed, 95% CI) | Subtotals only | |
| 6.1 Less than 3 months | 2 | 122 | Peto Odds Ratio (Peto, Fixed, 95% CI) | 3.90 [0.76, 20.16] |
| 6.2 3 ‐ < 6 months | 5 | 428 | Peto Odds Ratio (Peto, Fixed, 95% CI) | 1.94 [0.79, 4.77] |
| 6.3 6 ‐ < 12 months | 10 | 2164 | Peto Odds Ratio (Peto, Fixed, 95% CI) | 1.13 [0.82, 1.54] |
| 6.4 12 ‐ <24 months | 1 | 37 | Peto Odds Ratio (Peto, Fixed, 95% CI) | 0.0 [0.0, 0.0] |
| 6.5 24 months | 2 | 345 | Peto Odds Ratio (Peto, Fixed, 95% CI) | 1.25 [0.67, 2.33] |
| 7 Discontinuation rate due to adverse events (blinding) Show forest plot | 20 | Peto Odds Ratio (Peto, Fixed, 95% CI) | Subtotals only | |
| 7.1 Double‐blind | 16 | 2960 | Peto Odds Ratio (Peto, Fixed, 95% CI) | 1.21 [0.93, 1.59] |
| 7.2 Open or single‐blind | 4 | 136 | Peto Odds Ratio (Peto, Fixed, 95% CI) | 3.59 [0.59, 21.94] |
| 8 Discontinuation rate due to adverse events (disease status) Show forest plot | 19 | Peto Odds Ratio (Peto, Fixed, 95% CI) | Subtotals only | |
| 8.1 Inadequate symptom control | 8 | 1988 | Peto Odds Ratio (Peto, Fixed, 95% CI) | 1.19 [0.85, 1.67] |
| 8.2 Low T plus inadequate symptom control | 2 | 303 | Peto Odds Ratio (Peto, Fixed, 95% CI) | 1.05 [0.52, 2.12] |
| 8.3 No symptom | 9 | 703 | Peto Odds Ratio (Peto, Fixed, 95% CI) | 1.36 [0.77, 2.39] |
| Outcome or subgroup title | No. of studies | No. of participants | Statistical method | Effect size |
| 1 Discontinuation rate (allocation quality) Show forest plot | 14 | 2773 | Peto Odds Ratio (Peto, Fixed, 95% CI) | 0.98 [0.81, 1.17] |
| 2 Discontinuation rate due to adverse events (allocation quality) Show forest plot | 14 | 2778 | Peto Odds Ratio (Peto, Fixed, 95% CI) | 1.20 [0.91, 1.57] |
| 3 Discontinuation rate (quality of randomisation)) Show forest plot | 17 | 2902 | Peto Odds Ratio (Peto, Fixed, 95% CI) | 0.97 [0.81, 1.16] |
| 4 Discontinuation rate due to adverse events (quality of randomisation) Show forest plot | 17 | 2931 | Peto Odds Ratio (Peto, Fixed, 95% CI) | 1.24 [0.95, 1.61] |
| 5 Discontinuation rate (blinding method) Show forest plot | 17 | 3057 | Peto Odds Ratio (Peto, Fixed, 95% CI) | 0.97 [0.81, 1.17] |
| 6 Discontinuation rate due to adverse events (blinding method) Show forest plot | 15 | 2929 | Peto Odds Ratio (Peto, Fixed, 95% CI) | 1.21 [0.93, 1.59] |
| 7 Discontinuation rate (large studies) Show forest plot | 15 | 723 | Peto Odds Ratio (Peto, Fixed, 95% CI) | 1.38 [0.77, 2.49] |
| 8 Discontinuation rate due to adverse events (large studies) Show forest plot | 13 | 595 | Peto Odds Ratio (Peto, Fixed, 95% CI) | 1.44 [0.57, 3.64] |
| 9 Discontinuation rate (methyl testosterone doses) Show forest plot | 10 | Peto Odds Ratio (Peto, Fixed, 95% CI) | Subtotals only | |
| 9.1 Methyl testosterone, all doses | 10 | 955 | Peto Odds Ratio (Peto, Fixed, 95% CI) | 0.96 [0.68, 1.35] |
| 9.2 Methyl testosterone 1.25mg | 5 | 473 | Peto Odds Ratio (Peto, Fixed, 95% CI) | 0.89 [0.55, 1.43] |
| 9.3 Methyl testosterone 2 mg | 1 | 60 | Peto Odds Ratio (Peto, Fixed, 95% CI) | 0.93 [0.12, 6.98] |
| 9.4 Methyl testosterone 2.5mg | 6 | 431 | Peto Odds Ratio (Peto, Fixed, 95% CI) | 0.95 [0.57, 1.58] |
| 10 Discontinuation rate due to adverse events (methyl testosterone doses) Show forest plot | 8 | Peto Odds Ratio (Peto, Fixed, 95% CI) | Subtotals only | |
| 10.1 Methyl testosterone, all doses | 8 | 827 | Peto Odds Ratio (Peto, Fixed, 95% CI) | 1.43 [0.92, 2.22] |
| 10.2 Methyl testosterone 1.25mg | 5 | 477 | Peto Odds Ratio (Peto, Fixed, 95% CI) | 1.26 [0.71, 2.23] |
| 10.3 Methyl testosterone 2.5mg | 5 | 358 | Peto Odds Ratio (Peto, Fixed, 95% CI) | 1.60 [0.80, 3.23] |
| 11 Discontinuation rate (estrogen doses) Show forest plot | 24 | Peto Odds Ratio (Peto, Fixed, 95% CI) | Subtotals only | |
| 11.1 Estrogen, all doses | 24 | 3394 | Peto Odds Ratio (Peto, Fixed, 95% CI) | 0.98 [0.82, 1.17] |
| 11.2 Conjugated estrogen 0.625mg or equivalent doses of other estrogens | 7 | 766 | Peto Odds Ratio (Peto, Fixed, 95% CI) | 1.00 [0.70, 1.41] |
| 11.3 Conjugated estrogen 1.25mg or equivalent doses of other estrogens | 15 | 907 | Peto Odds Ratio (Peto, Fixed, 95% CI) | 1.01 [0.68, 1.52] |
| 12 Discontinuation rate due to adverse events (estrogen doses) Show forest plot | 22 | Peto Odds Ratio (Peto, Fixed, 95% CI) | Subtotals only | |
| 12.1 Estrogen, all doses | 22 | 3266 | Peto Odds Ratio (Peto, Fixed, 95% CI) | 1.22 [0.93, 1.58] |
| 12.2 Conjugated estrogen 0.625mg or equivalent doses of other estrogens | 6 | 706 | Peto Odds Ratio (Peto, Fixed, 95% CI) | 1.34 [0.80, 2.24] |
| 12.3 Conjugated estrogen 1.25mg or equivalent doses of other estrogens | 14 | 839 | Peto Odds Ratio (Peto, Fixed, 95% CI) | 1.42 [0.76, 2.65] |