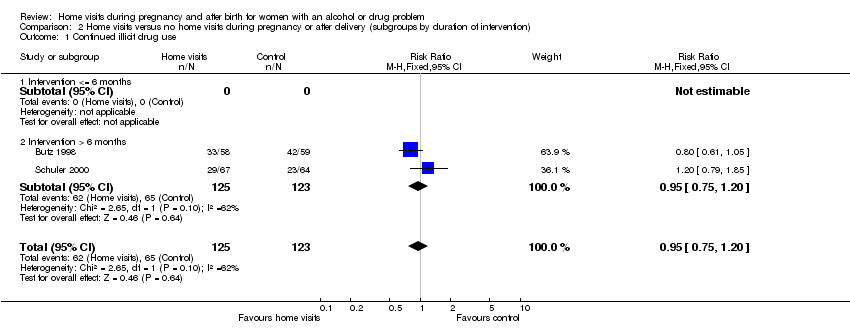
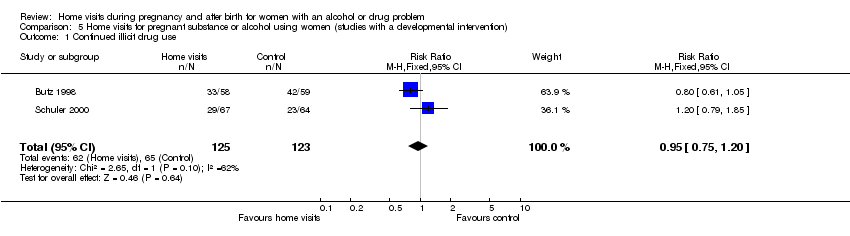
| 1 Continued illicit drug use Show forest plot | 2 | 248 | Risk Ratio (M‐H, Fixed, 95% CI) | 0.95 [0.75, 1.20] |
|
| 1.1 Intervention by nurse | 1 | 117 | Risk Ratio (M‐H, Fixed, 95% CI) | 0.80 [0.61, 1.05] |
| 1.2 Intervention by trained social worker | 0 | 0 | Risk Ratio (M‐H, Fixed, 95% CI) | 0.0 [0.0, 0.0] |
| 1.3 Intervention by trained counsellor | 0 | 0 | Risk Ratio (M‐H, Fixed, 95% CI) | 0.0 [0.0, 0.0] |
| 1.4 Intervention by trained lay worker | 1 | 131 | Risk Ratio (M‐H, Fixed, 95% CI) | 1.20 [0.79, 1.85] |
| 1.5 Intervention by multidisciplinary team | 0 | 0 | Risk Ratio (M‐H, Fixed, 95% CI) | 0.0 [0.0, 0.0] |
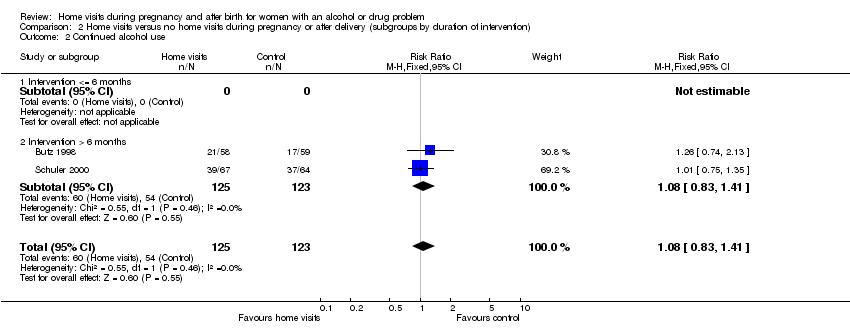
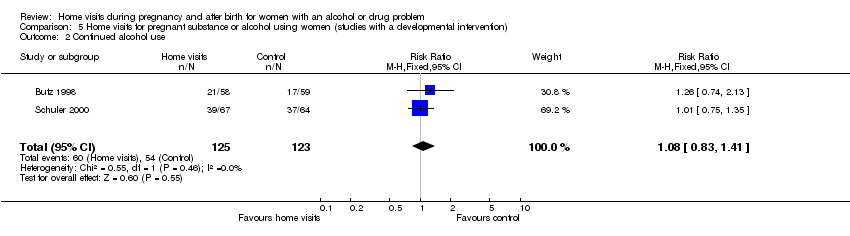
| 2 Continued alcohol use Show forest plot | 2 | 248 | Risk Ratio (M‐H, Fixed, 95% CI) | 1.08 [0.83, 1.41] |
|
| 2.1 Intervention by nurse | 1 | 117 | Risk Ratio (M‐H, Fixed, 95% CI) | 1.26 [0.74, 2.13] |
| 2.2 Intervention by trained social worker | 0 | 0 | Risk Ratio (M‐H, Fixed, 95% CI) | 0.0 [0.0, 0.0] |
| 2.3 Intervention by trained counsellor | 0 | 0 | Risk Ratio (M‐H, Fixed, 95% CI) | 0.0 [0.0, 0.0] |
| 2.4 Intervention by trained lay worker | 1 | 131 | Risk Ratio (M‐H, Fixed, 95% CI) | 1.01 [0.75, 1.35] |
| 2.5 Intervention by multidisciplinary team | 0 | 0 | Risk Ratio (M‐H, Fixed, 95% CI) | 0.0 [0.0, 0.0] |
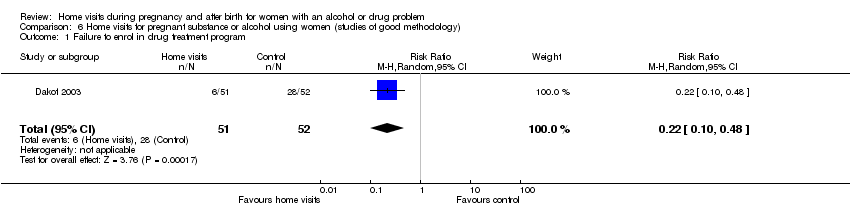
| 3 Failure to enrol in drug treatment program Show forest plot | 2 | 211 | Risk Ratio (M‐H, Random, 95% CI) | 0.45 [0.10, 1.94] |
|
| 3.1 Intervention by nurse | 0 | 0 | Risk Ratio (M‐H, Random, 95% CI) | 0.0 [0.0, 0.0] |
| 3.2 Intervention by trained social worker | 0 | 0 | Risk Ratio (M‐H, Random, 95% CI) | 0.0 [0.0, 0.0] |
| 3.3 Intervention by trained counsellor | 1 | 103 | Risk Ratio (M‐H, Random, 95% CI) | 0.22 [0.10, 0.48] |
| 3.4 Intervention by trained lay worker | 1 | 108 | Risk Ratio (M‐H, Random, 95% CI) | 0.84 [0.63, 1.12] |
| 3.5 Intervention by multidisciplinary team | 0 | 0 | Risk Ratio (M‐H, Random, 95% CI) | 0.0 [0.0, 0.0] |
| 4 Failure to remain in drug treatment at 4 weeks Show forest plot | 1 | 103 | Risk Ratio (M‐H, Fixed, 95% CI) | 0.54 [0.35, 0.84] |
|
| 4.1 Intervention by nurse | 0 | 0 | Risk Ratio (M‐H, Fixed, 95% CI) | 0.0 [0.0, 0.0] |
| 4.2 Intervention by trained social worker | 0 | 0 | Risk Ratio (M‐H, Fixed, 95% CI) | 0.0 [0.0, 0.0] |
| 4.3 Intervention by trained counsellor | 1 | 103 | Risk Ratio (M‐H, Fixed, 95% CI) | 0.54 [0.35, 0.84] |
| 4.4 Intervention by trained lay worker | 0 | 0 | Risk Ratio (M‐H, Fixed, 95% CI) | 0.0 [0.0, 0.0] |
| 4.5 Intervention by multidisciplinary team | 0 | 0 | Risk Ratio (M‐H, Fixed, 95% CI) | 0.0 [0.0, 0.0] |
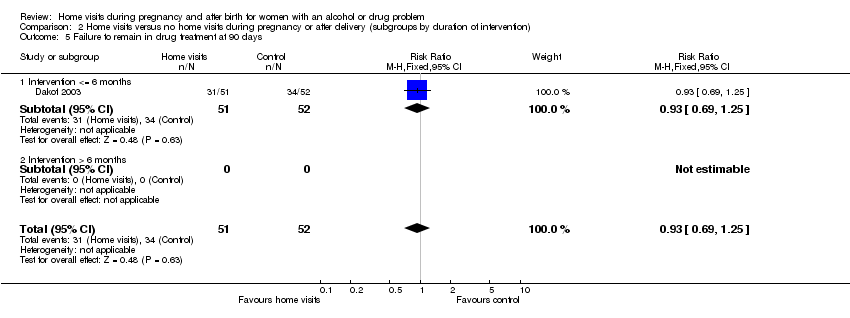
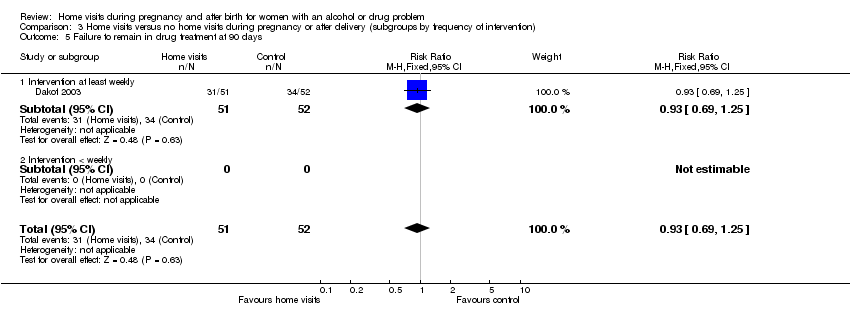
| 5 Failure to remain in drug treatment at 90 days Show forest plot | 1 | 103 | Risk Ratio (M‐H, Fixed, 95% CI) | 0.93 [0.69, 1.25] |
|
| 5.1 Intervention by nurse | 0 | 0 | Risk Ratio (M‐H, Fixed, 95% CI) | 0.0 [0.0, 0.0] |
| 5.2 Intervention by trained social worker | 0 | 0 | Risk Ratio (M‐H, Fixed, 95% CI) | 0.0 [0.0, 0.0] |
| 5.3 Intervention by trained counsellor | 1 | 103 | Risk Ratio (M‐H, Fixed, 95% CI) | 0.93 [0.69, 1.25] |
| 5.4 Intervention by trained lay worker | 0 | 0 | Risk Ratio (M‐H, Fixed, 95% CI) | 0.0 [0.0, 0.0] |
| 5.5 Intervention by multidisciplinary team | 0 | 0 | Risk Ratio (M‐H, Fixed, 95% CI) | 0.0 [0.0, 0.0] |
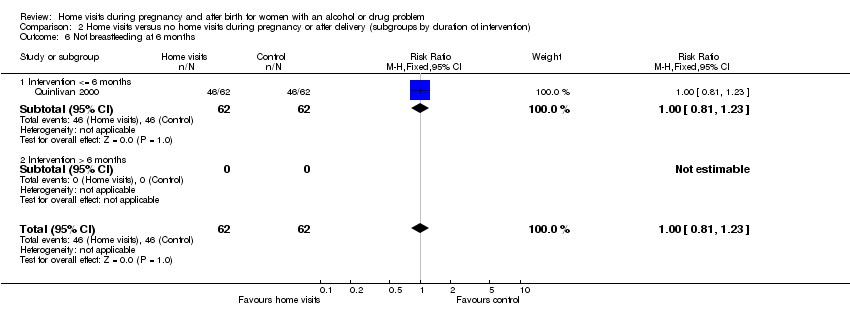
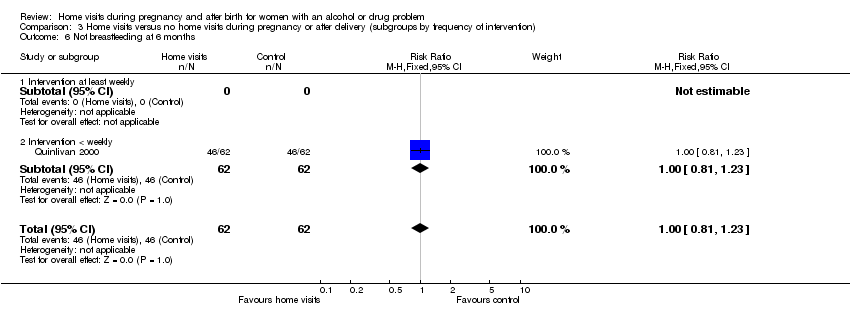
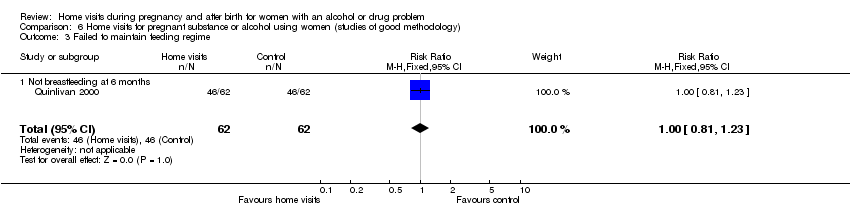
| 6 Not breastfeeding at 6 months Show forest plot | 1 | 124 | Risk Ratio (M‐H, Fixed, 95% CI) | 1.0 [0.81, 1.23] |
|
| 6.1 Intervention by nurse | 1 | 124 | Risk Ratio (M‐H, Fixed, 95% CI) | 1.0 [0.81, 1.23] |
| 6.2 Intervention by trained social worker | 0 | 0 | Risk Ratio (M‐H, Fixed, 95% CI) | 0.0 [0.0, 0.0] |
| 6.3 Intervention by trained counsellor | 0 | 0 | Risk Ratio (M‐H, Fixed, 95% CI) | 0.0 [0.0, 0.0] |
| 6.4 Intervention by trained lay worker | 0 | 0 | Risk Ratio (M‐H, Fixed, 95% CI) | 0.0 [0.0, 0.0] |
| 6.5 Intervention by multidisciplinary team | 0 | 0 | Risk Ratio (M‐H, Fixed, 95% CI) | 0.0 [0.0, 0.0] |
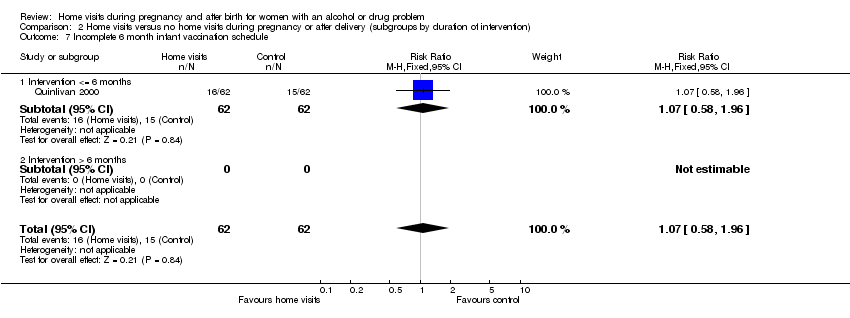
| 7 Incomplete 6 month infant vaccination schedule Show forest plot | 1 | 124 | Risk Ratio (M‐H, Fixed, 95% CI) | 1.07 [0.58, 1.96] |
|
| 7.1 Intervention by nurse | 1 | 124 | Risk Ratio (M‐H, Fixed, 95% CI) | 1.07 [0.58, 1.96] |
| 7.2 Intervention by trained social worker | 0 | 0 | Risk Ratio (M‐H, Fixed, 95% CI) | 0.0 [0.0, 0.0] |
| 7.3 Intervention by trained counsellor | 0 | 0 | Risk Ratio (M‐H, Fixed, 95% CI) | 0.0 [0.0, 0.0] |
| 7.4 Intervention by trained lay worker | 0 | 0 | Risk Ratio (M‐H, Fixed, 95% CI) | 0.0 [0.0, 0.0] |
| 7.5 Intervention by multidisciplinary team | 0 | 0 | Risk Ratio (M‐H, Fixed, 95% CI) | 0.0 [0.0, 0.0] |
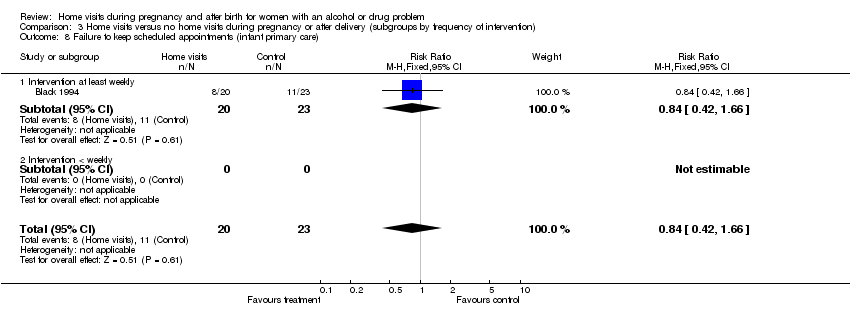
| 8 Failure to keep scheduled appointments (infant primary care) Show forest plot | 1 | 43 | Risk Ratio (M‐H, Fixed, 95% CI) | 0.84 [0.42, 1.66] |
|
| 8.1 Intervention by nurse | 1 | 43 | Risk Ratio (M‐H, Fixed, 95% CI) | 0.84 [0.42, 1.66] |
| 8.2 Intervention by trained social worker | 0 | 0 | Risk Ratio (M‐H, Fixed, 95% CI) | 0.0 [0.0, 0.0] |
| 8.3 Intervention by trained counsellor | 0 | 0 | Risk Ratio (M‐H, Fixed, 95% CI) | 0.0 [0.0, 0.0] |
| 8.4 Intervention by trained lay worker | 0 | 0 | Risk Ratio (M‐H, Fixed, 95% CI) | 0.0 [0.0, 0.0] |
| 8.5 Intervention by multidisciplinary team | 0 | 0 | Risk Ratio (M‐H, Fixed, 95% CI) | 0.0 [0.0, 0.0] |
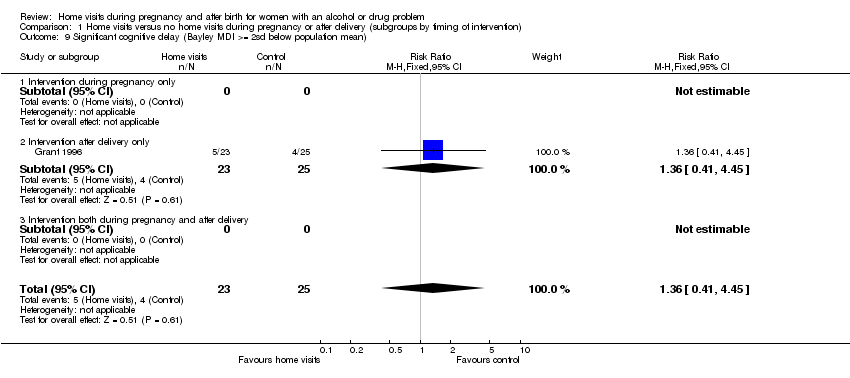
| 9 Significant cognitive delay (Bayley MDI >= 2sd below population mean) Show forest plot | 1 | 48 | Risk Ratio (M‐H, Fixed, 95% CI) | 1.36 [0.41, 4.45] |
|
| 9.1 Intervention by nurse | 0 | 0 | Risk Ratio (M‐H, Fixed, 95% CI) | 0.0 [0.0, 0.0] |
| 9.2 Intervention by trained social worker | 0 | 0 | Risk Ratio (M‐H, Fixed, 95% CI) | 0.0 [0.0, 0.0] |
| 9.3 Intervention by trained counsellor | 0 | 0 | Risk Ratio (M‐H, Fixed, 95% CI) | 0.0 [0.0, 0.0] |
| 9.4 Intervention by trained lay worker | 1 | 48 | Risk Ratio (M‐H, Fixed, 95% CI) | 1.36 [0.41, 4.45] |
| 9.5 Intervention by multidisciplinary team | 0 | 0 | Risk Ratio (M‐H, Fixed, 95% CI) | 0.0 [0.0, 0.0] |
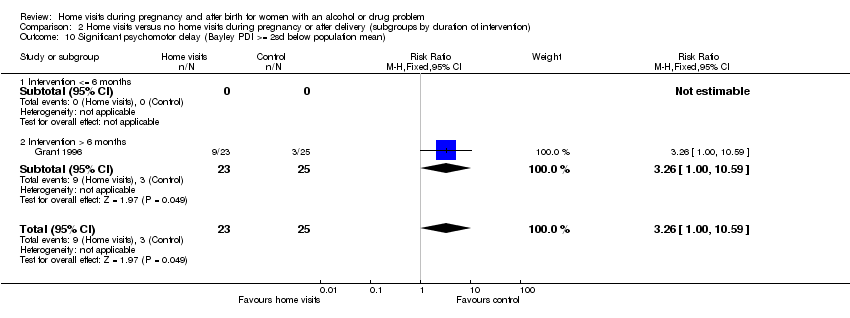
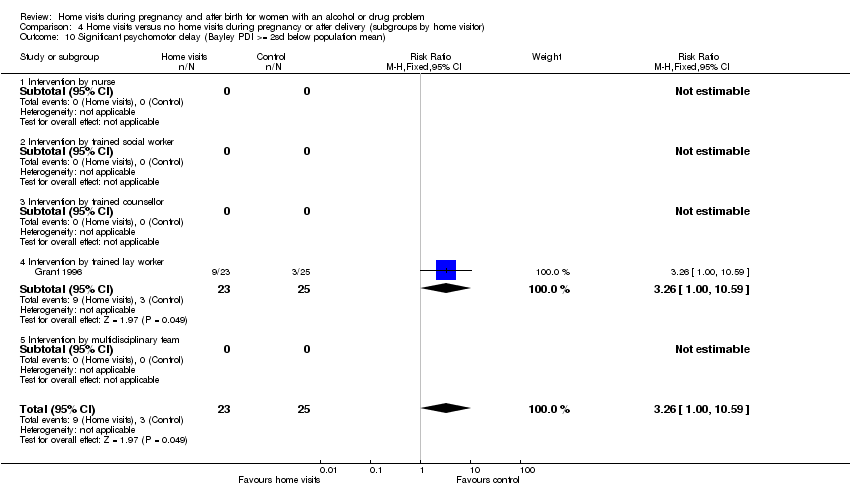
| 10 Significant psychomotor delay (Bayley PDI >= 2sd below population mean) Show forest plot | 1 | 48 | Risk Ratio (M‐H, Fixed, 95% CI) | 3.26 [1.00, 10.59] |
|
| 10.1 Intervention by nurse | 0 | 0 | Risk Ratio (M‐H, Fixed, 95% CI) | 0.0 [0.0, 0.0] |
| 10.2 Intervention by trained social worker | 0 | 0 | Risk Ratio (M‐H, Fixed, 95% CI) | 0.0 [0.0, 0.0] |
| 10.3 Intervention by trained counsellor | 0 | 0 | Risk Ratio (M‐H, Fixed, 95% CI) | 0.0 [0.0, 0.0] |
| 10.4 Intervention by trained lay worker | 1 | 48 | Risk Ratio (M‐H, Fixed, 95% CI) | 3.26 [1.00, 10.59] |
| 10.5 Intervention by multidisciplinary team | 0 | 0 | Risk Ratio (M‐H, Fixed, 95% CI) | 0.0 [0.0, 0.0] |
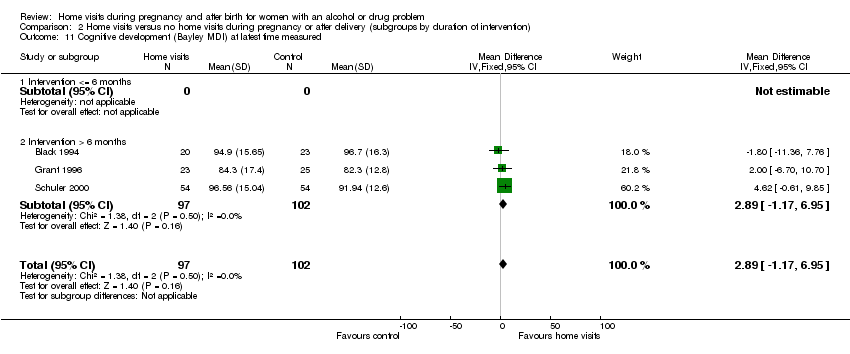
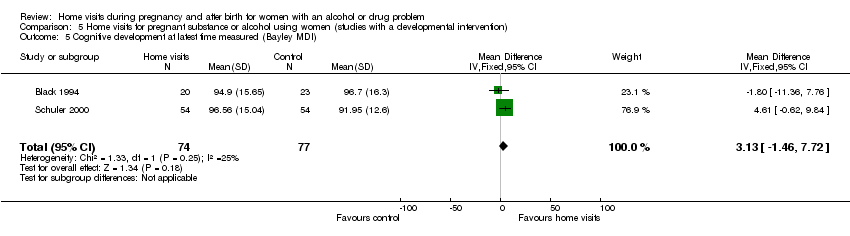
| 11 Cognitive development (Bayley MDI) at latest time measured Show forest plot | 3 | 199 | Mean Difference (IV, Fixed, 95% CI) | 2.89 [‐1.17, 6.95] |
|
| 11.1 Intervention by nurse | 1 | 43 | Mean Difference (IV, Fixed, 95% CI) | ‐1.80 [‐11.36, 7.76] |
| 11.2 Intervention by trained social worker | 0 | 0 | Mean Difference (IV, Fixed, 95% CI) | 0.0 [0.0, 0.0] |
| 11.3 Intervention by trained counsellor | 0 | 0 | Mean Difference (IV, Fixed, 95% CI) | 0.0 [0.0, 0.0] |
| 11.4 Intervention by trained lay worker | 2 | 156 | Mean Difference (IV, Fixed, 95% CI) | 3.92 [‐0.56, 8.41] |
| 11.5 Intervention by multidisciplinary team | 0 | 0 | Mean Difference (IV, Fixed, 95% CI) | 0.0 [0.0, 0.0] |
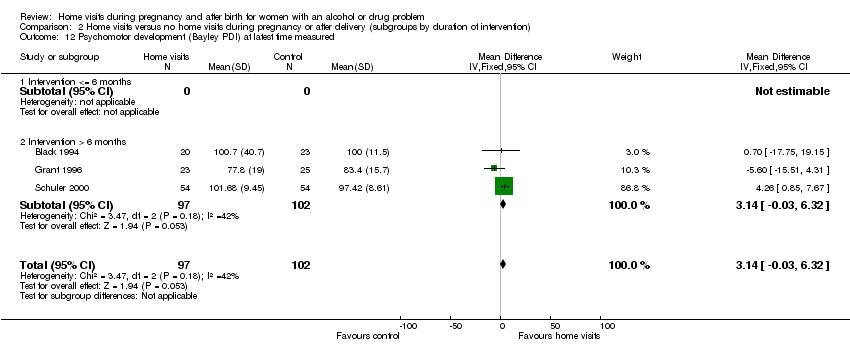
| 12 Psychomotor development (Bayley PDI) at latest time measured Show forest plot | 3 | 199 | Mean Difference (IV, Fixed, 95% CI) | 3.14 [‐0.03, 6.32] |
|
| 12.1 Intervention by nurse | 1 | 43 | Mean Difference (IV, Fixed, 95% CI) | 0.70 [‐17.75, 19.15] |
| 12.2 Intervention by trained social worker | 0 | 0 | Mean Difference (IV, Fixed, 95% CI) | 0.0 [0.0, 0.0] |
| 12.3 Intervention by trained counsellor | 0 | 0 | Mean Difference (IV, Fixed, 95% CI) | 0.0 [0.0, 0.0] |
| 12.4 Intervention by trained lay worker | 2 | 156 | Mean Difference (IV, Fixed, 95% CI) | 3.22 [‐0.01, 6.44] |
| 12.5 Intervention by multidisciplinary team | 0 | 0 | Mean Difference (IV, Fixed, 95% CI) | 0.0 [0.0, 0.0] |
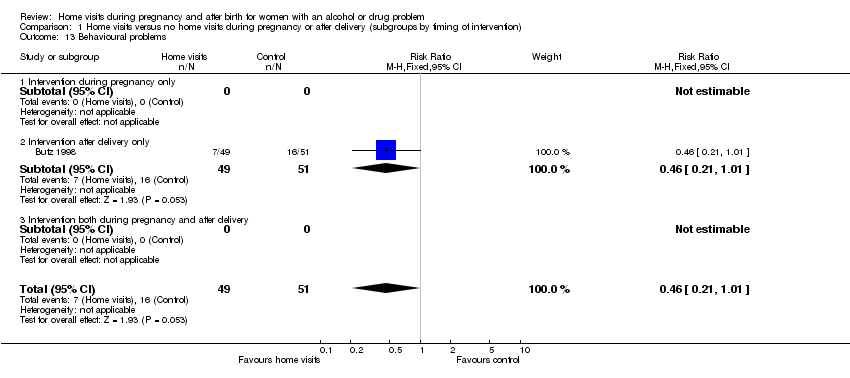
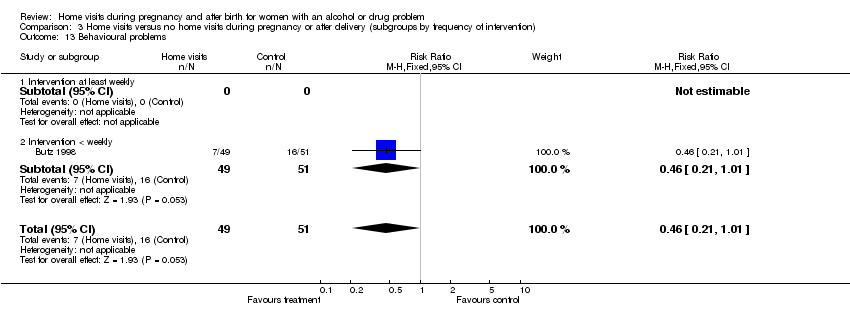
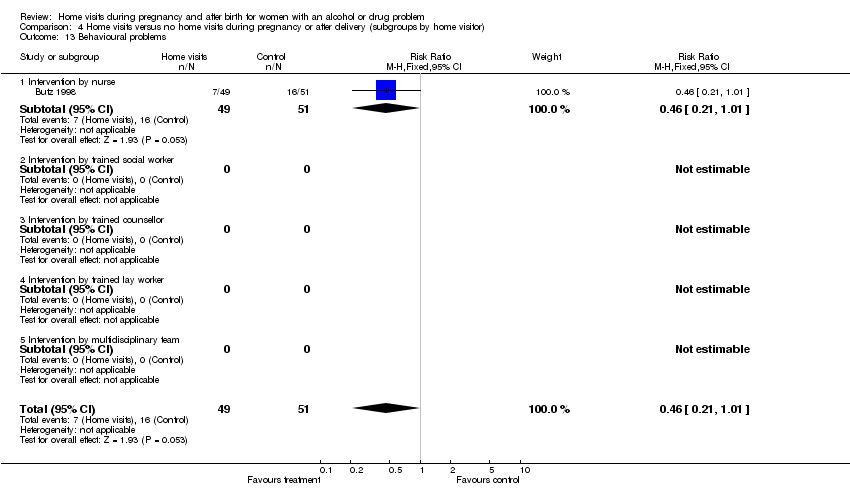
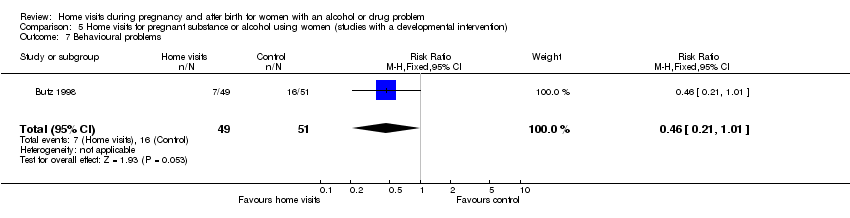
| 13 Behavioural problems Show forest plot | 1 | 100 | Risk Ratio (M‐H, Fixed, 95% CI) | 0.46 [0.21, 1.01] |
|
| 13.1 Intervention by nurse | 1 | 100 | Risk Ratio (M‐H, Fixed, 95% CI) | 0.46 [0.21, 1.01] |
| 13.2 Intervention by trained social worker | 0 | 0 | Risk Ratio (M‐H, Fixed, 95% CI) | 0.0 [0.0, 0.0] |
| 13.3 Intervention by trained counsellor | 0 | 0 | Risk Ratio (M‐H, Fixed, 95% CI) | 0.0 [0.0, 0.0] |
| 13.4 Intervention by trained lay worker | 0 | 0 | Risk Ratio (M‐H, Fixed, 95% CI) | 0.0 [0.0, 0.0] |
| 13.5 Intervention by multidisciplinary team | 0 | 0 | Risk Ratio (M‐H, Fixed, 95% CI) | 0.0 [0.0, 0.0] |
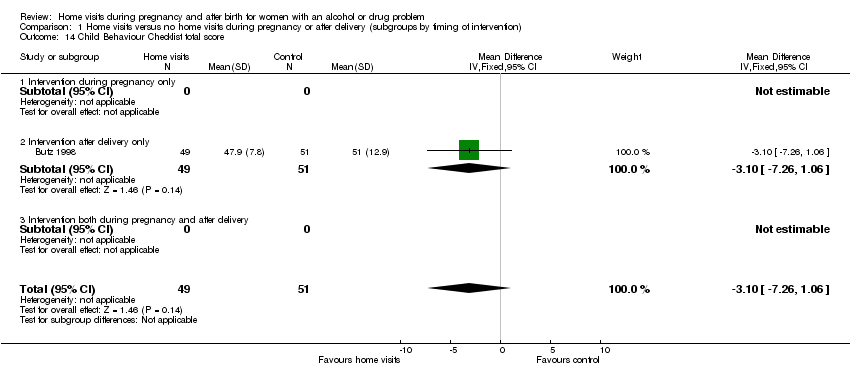
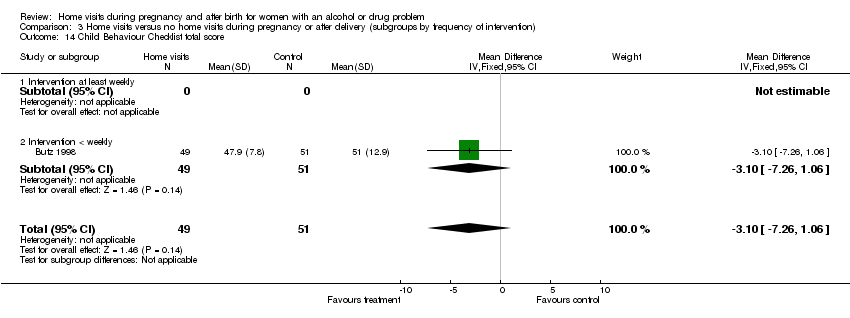
| 14 Child Behaviour Checklist total score Show forest plot | 1 | 100 | Mean Difference (IV, Fixed, 95% CI) | ‐3.10 [‐7.26, 1.06] |
|
| 14.1 Intervention by nurse | 1 | 100 | Mean Difference (IV, Fixed, 95% CI) | ‐3.10 [‐7.26, 1.06] |
| 14.2 Intervention by trained social worker | 0 | 0 | Mean Difference (IV, Fixed, 95% CI) | 0.0 [0.0, 0.0] |
| 14.3 Intervention by trained counsellor | 0 | 0 | Mean Difference (IV, Fixed, 95% CI) | 0.0 [0.0, 0.0] |
| 14.4 Intervention by trained lay worker | 0 | 0 | Mean Difference (IV, Fixed, 95% CI) | 0.0 [0.0, 0.0] |
| 14.5 Intervention by multidisciplinary team | 0 | 0 | Mean Difference (IV, Fixed, 95% CI) | 0.0 [0.0, 0.0] |
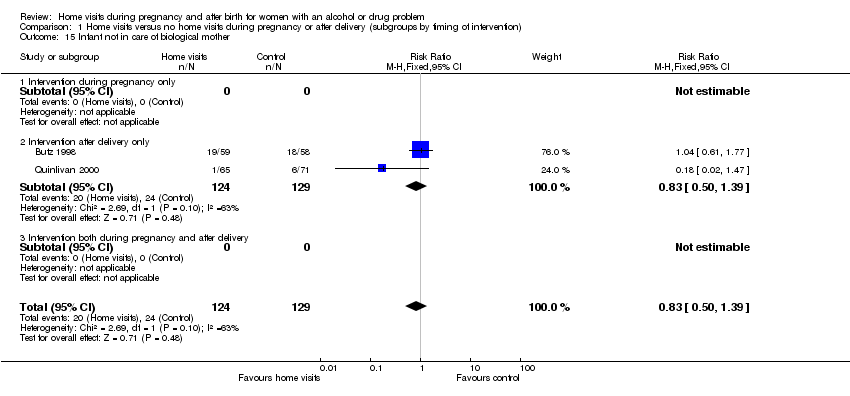
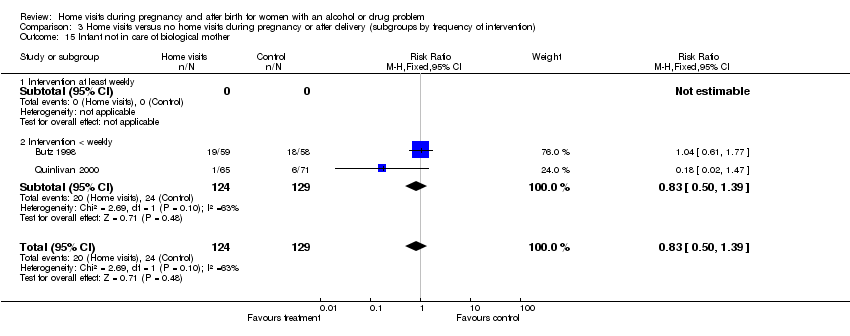
| 15 Infant not in care of biological mother Show forest plot | 2 | 253 | Risk Ratio (M‐H, Fixed, 95% CI) | 0.83 [0.50, 1.39] |
|
| 15.1 Intervention by nurse | 2 | 253 | Risk Ratio (M‐H, Fixed, 95% CI) | 0.83 [0.50, 1.39] |
| 15.2 Intervention by trained social worker | 0 | 0 | Risk Ratio (M‐H, Fixed, 95% CI) | 0.0 [0.0, 0.0] |
| 15.3 Intervention by trained counsellor | 0 | 0 | Risk Ratio (M‐H, Fixed, 95% CI) | 0.0 [0.0, 0.0] |
| 15.4 Intervention by trained lay worker | 0 | 0 | Risk Ratio (M‐H, Fixed, 95% CI) | 0.0 [0.0, 0.0] |
| 15.5 Intervention by multidisciplinary team | 0 | 0 | Risk Ratio (M‐H, Fixed, 95% CI) | 0.0 [0.0, 0.0] |
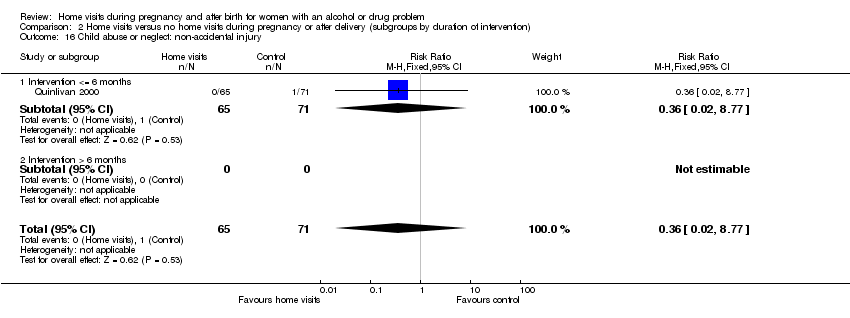
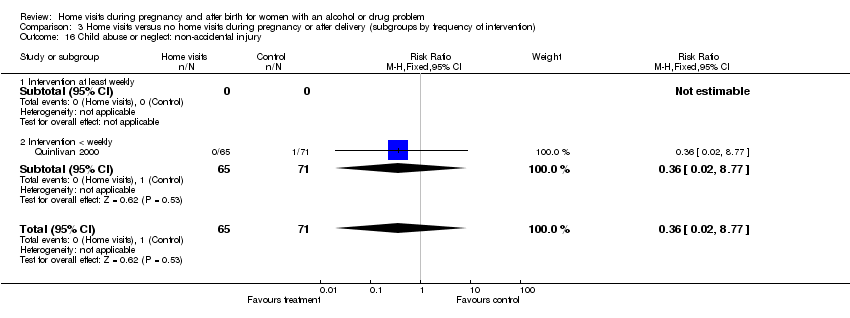
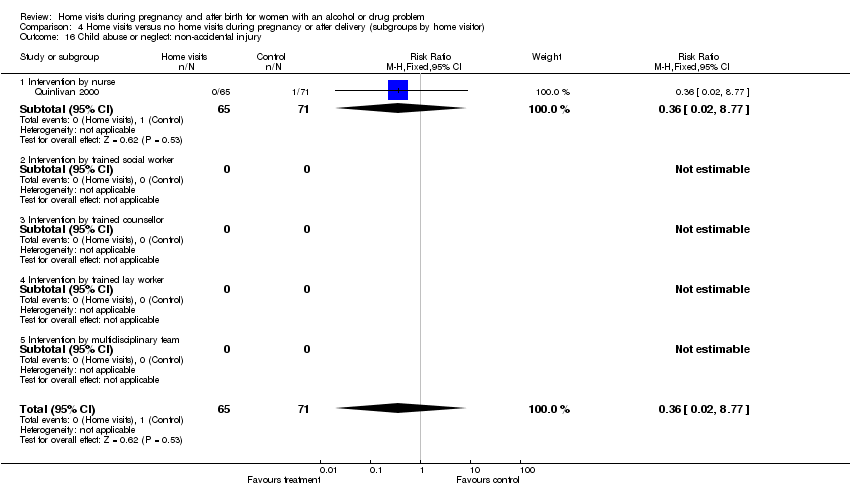
| 16 Child abuse or neglect: non‐accidental injury Show forest plot | 1 | 136 | Risk Ratio (M‐H, Fixed, 95% CI) | 0.36 [0.02, 8.77] |
|
| 16.1 Intervention by nurse | 1 | 136 | Risk Ratio (M‐H, Fixed, 95% CI) | 0.36 [0.02, 8.77] |
| 16.2 Intervention by trained social worker | 0 | 0 | Risk Ratio (M‐H, Fixed, 95% CI) | 0.0 [0.0, 0.0] |
| 16.3 Intervention by trained counsellor | 0 | 0 | Risk Ratio (M‐H, Fixed, 95% CI) | 0.0 [0.0, 0.0] |
| 16.4 Intervention by trained lay worker | 0 | 0 | Risk Ratio (M‐H, Fixed, 95% CI) | 0.0 [0.0, 0.0] |
| 16.5 Intervention by multidisciplinary team | 0 | 0 | Risk Ratio (M‐H, Fixed, 95% CI) | 0.0 [0.0, 0.0] |
| 17 Non‐accidental injury and non‐voluntary foster care Show forest plot | 1 | 136 | Risk Ratio (M‐H, Fixed, 95% CI) | 0.16 [0.02, 1.23] |
|
| 17.1 Intervention by nurse | 1 | 136 | Risk Ratio (M‐H, Fixed, 95% CI) | 0.16 [0.02, 1.23] |
| 17.2 Intervention by trained social worker | 0 | 0 | Risk Ratio (M‐H, Fixed, 95% CI) | 0.0 [0.0, 0.0] |
| 17.3 ntervention by trained counsellor | 0 | 0 | Risk Ratio (M‐H, Fixed, 95% CI) | 0.0 [0.0, 0.0] |
| 17.4 Intervention by trained lay worker | 0 | 0 | Risk Ratio (M‐H, Fixed, 95% CI) | 0.0 [0.0, 0.0] |
| 17.5 Intervention by multidisciplinary team | 0 | 0 | Risk Ratio (M‐H, Fixed, 95% CI) | 0.0 [0.0, 0.0] |
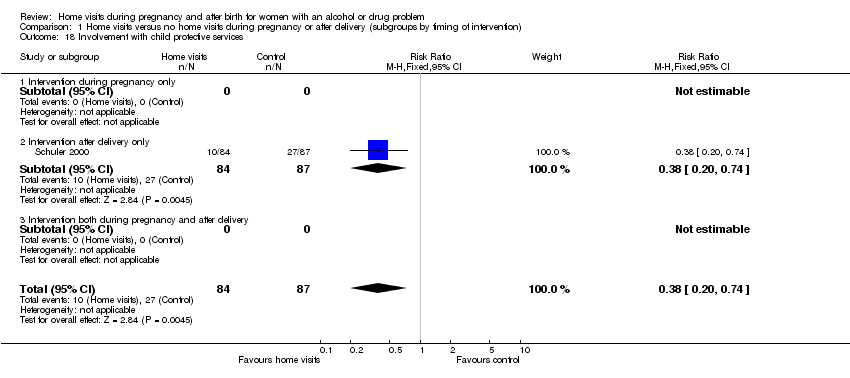
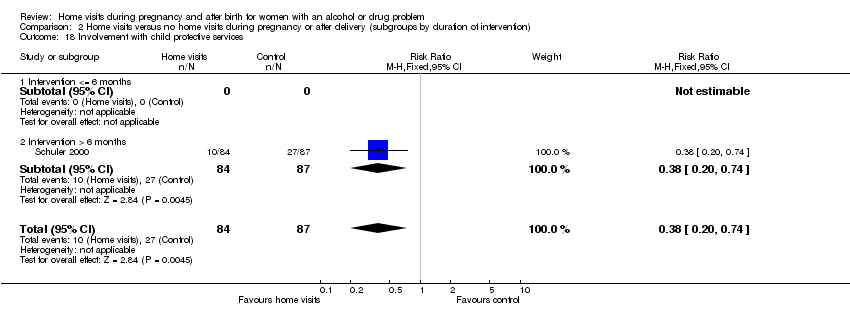
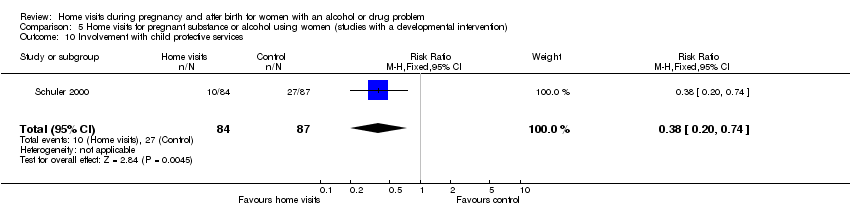
| 18 Involvement with child protective services Show forest plot | 1 | 171 | Risk Ratio (M‐H, Fixed, 95% CI) | 0.38 [0.20, 0.74] |
|
| 18.1 Intervention by nurse | 0 | 0 | Risk Ratio (M‐H, Fixed, 95% CI) | 0.0 [0.0, 0.0] |
| 18.2 Intervention by trained social worker | 0 | 0 | Risk Ratio (M‐H, Fixed, 95% CI) | 0.0 [0.0, 0.0] |
| 18.3 Intervention by trained counsellor | 0 | 0 | Risk Ratio (M‐H, Fixed, 95% CI) | 0.0 [0.0, 0.0] |
| 18.4 Intervention by trained lay worker | 1 | 171 | Risk Ratio (M‐H, Fixed, 95% CI) | 0.38 [0.20, 0.74] |
| 18.5 Intervention by multidisciplinary team | 0 | 0 | Risk Ratio (M‐H, Fixed, 95% CI) | 0.0 [0.0, 0.0] |
| 19 Child abuse potential inventory (z score) Show forest plot | 1 | 43 | Mean Difference (IV, Fixed, 95% CI) | ‐0.90 [‐1.61, ‐0.19] |
|
| 19.1 Intervention by nurse | 1 | 43 | Mean Difference (IV, Fixed, 95% CI) | ‐0.90 [‐1.61, ‐0.19] |
| 19.2 Intervention by trained social worker | 0 | 0 | Mean Difference (IV, Fixed, 95% CI) | 0.0 [0.0, 0.0] |
| 19.3 Intervention by trained counsellor | 0 | 0 | Mean Difference (IV, Fixed, 95% CI) | 0.0 [0.0, 0.0] |
| 19.4 Intervention by trained lay worker | 0 | 0 | Mean Difference (IV, Fixed, 95% CI) | 0.0 [0.0, 0.0] |
| 19.5 Intervention by multidisciplinary team | 0 | 0 | Mean Difference (IV, Fixed, 95% CI) | 0.0 [0.0, 0.0] |
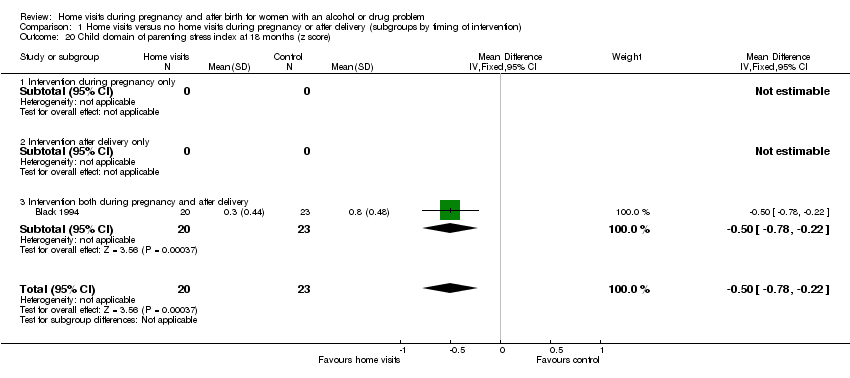
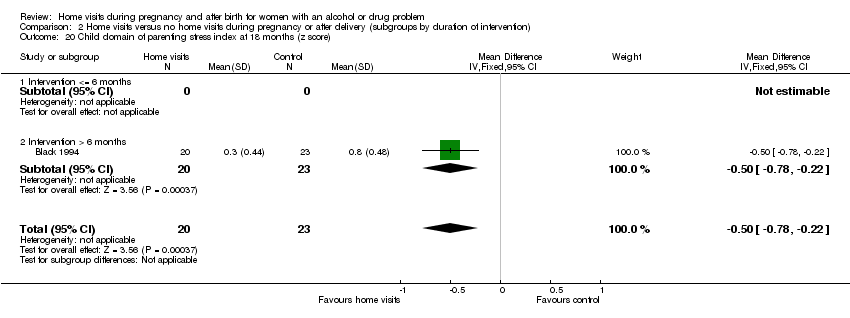
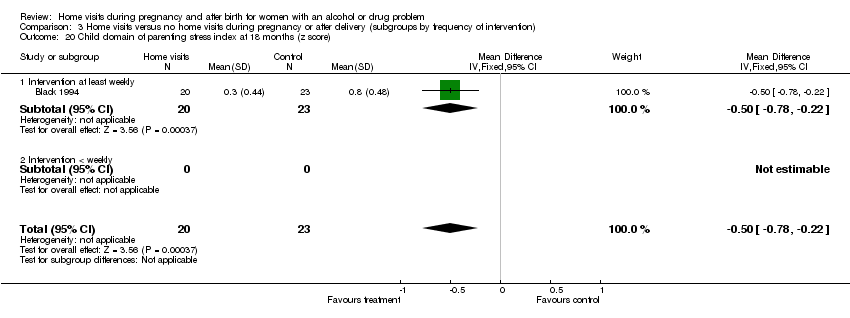
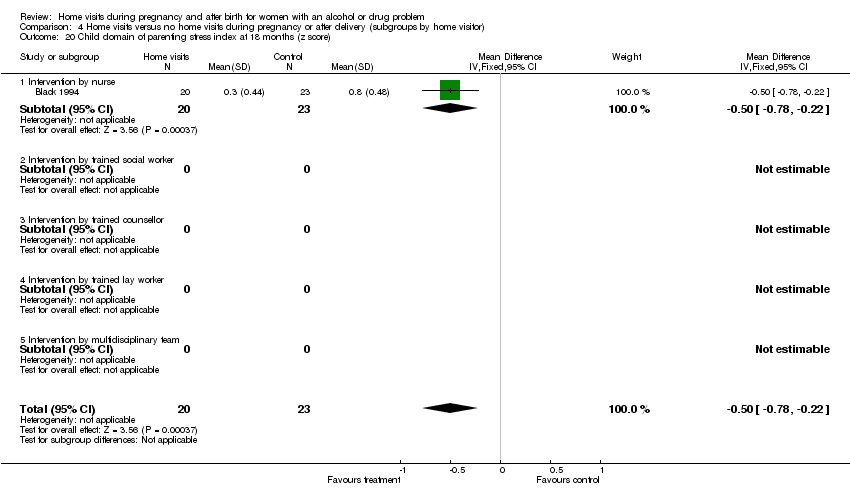
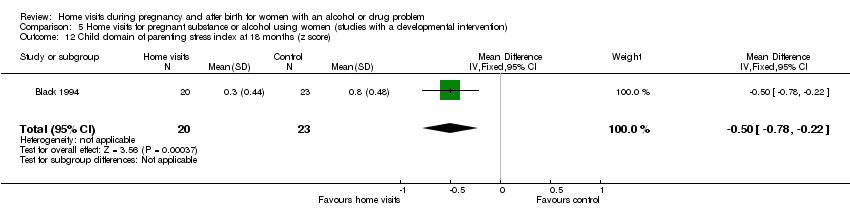
| 20 Child domain of parenting stress index at 18 months (z score) Show forest plot | 1 | 43 | Mean Difference (IV, Fixed, 95% CI) | ‐0.5 [‐0.78, ‐0.22] |
|
| 20.1 Intervention by nurse | 1 | 43 | Mean Difference (IV, Fixed, 95% CI) | ‐0.5 [‐0.78, ‐0.22] |
| 20.2 Intervention by trained social worker | 0 | 0 | Mean Difference (IV, Fixed, 95% CI) | 0.0 [0.0, 0.0] |
| 20.3 Intervention by trained counsellor | 0 | 0 | Mean Difference (IV, Fixed, 95% CI) | 0.0 [0.0, 0.0] |
| 20.4 Intervention by trained lay worker | 0 | 0 | Mean Difference (IV, Fixed, 95% CI) | 0.0 [0.0, 0.0] |
| 20.5 Intervention by multidisciplinary team | 0 | 0 | Mean Difference (IV, Fixed, 95% CI) | 0.0 [0.0, 0.0] |
| 21 HOME score Show forest plot | 1 | 43 | Mean Difference (IV, Fixed, 95% CI) | 3.70 [‐0.06, 7.46] |
|
| 21.1 Intervention by nurse | 1 | 43 | Mean Difference (IV, Fixed, 95% CI) | 3.70 [‐0.06, 7.46] |
| 21.2 Intervention by trained social worker | 0 | 0 | Mean Difference (IV, Fixed, 95% CI) | 0.0 [0.0, 0.0] |
| 21.3 Intervention by trained counsellor | 0 | 0 | Mean Difference (IV, Fixed, 95% CI) | 0.0 [0.0, 0.0] |
| 21.4 Intervention by trained lay worker | 0 | 0 | Mean Difference (IV, Fixed, 95% CI) | 0.0 [0.0, 0.0] |
| 21.5 Intervention by multidisciplinary team | 0 | 0 | Mean Difference (IV, Fixed, 95% CI) | 0.0 [0.0, 0.0] |
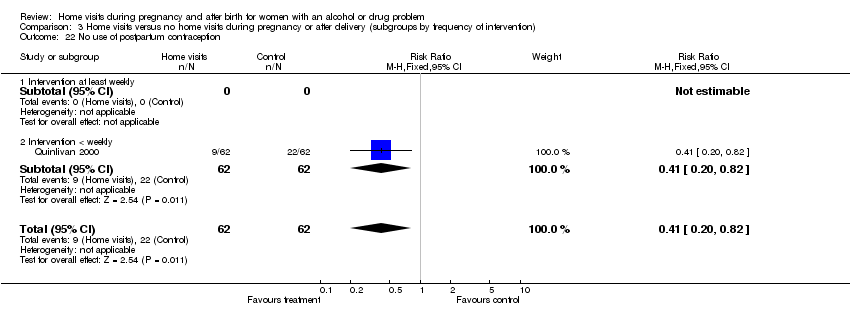
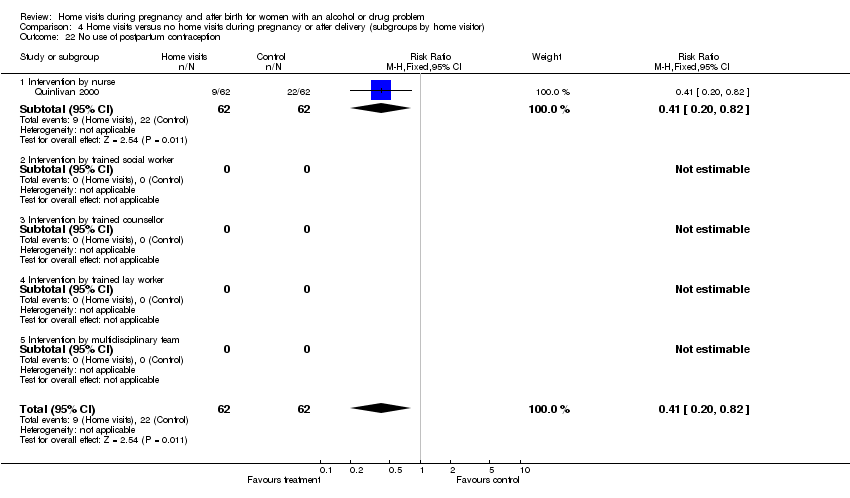
| 22 No use of postpartum contraception Show forest plot | 1 | 124 | Risk Ratio (M‐H, Fixed, 95% CI) | 0.41 [0.20, 0.82] |
|
| 22.1 Intervention by nurse | 1 | 124 | Risk Ratio (M‐H, Fixed, 95% CI) | 0.41 [0.20, 0.82] |
| 22.2 Intervention by trained social worker | 0 | 0 | Risk Ratio (M‐H, Fixed, 95% CI) | 0.0 [0.0, 0.0] |
| 22.3 Intervention by trained counsellor | 0 | 0 | Risk Ratio (M‐H, Fixed, 95% CI) | 0.0 [0.0, 0.0] |
| 22.4 Intervention by trained lay worker | 0 | 0 | Risk Ratio (M‐H, Fixed, 95% CI) | 0.0 [0.0, 0.0] |
| 22.5 Intervention by multidisciplinary team | 0 | 0 | Risk Ratio (M‐H, Fixed, 95% CI) | 0.0 [0.0, 0.0] |