Visitas domiciliarias durante el embarazo y el postparto para mujeres con problemas de alcohol o drogas
Referencias
Referencias de los estudios incluidos en esta revisión
Referencias de los estudios excluidos de esta revisión
Referencias de los estudios en espera de evaluación
Referencias adicionales
Characteristics of studies
Characteristics of included studies [ordered by study ID]
Ir a:
| Methods | Randomised: yes, prepartum, method not reported. | |
| Participants | Inclusion criteria: large metropolitan teaching hospital in Baltimore, primarily single, African‐American, low‐income, inner city, multiparous, polydrug users with incomplete schooling. Maternal cocaine or heroin use in pregnancy obtained from questionnaire. Enrolled prenatally. | |
| Interventions | Treatment group (n = 31): two part‐time community health nurses experienced with women and children, and with drug‐abusing families provided 1 hour visits, home visitation pre and postpartum, armed escort. Biweekly home visits extending to 18 months. Two visits before birth. Caseload per nurse was 31 families. Formed alliance, addressed personal, family and environmental needs and facilitated child‐parent interaction. Provided information and advocacy for parents, incorporated the Carolina preschool curriculum and Hawaii Early Learning Program. | |
| Outcomes | Reported primary outcome(s): promotion of positive behaviours and attitudes among drug using women and development in their children. | |
| Notes | Trial of predominately postpartum home visits up to 18 months by trained community health nurses for drug using women. | |
| Risk of bias | ||
| Bias | Authors' judgement | Support for judgement |
| Allocation concealment? | Unclear risk | B ‐ Unclear |
| Methods | Randomised: yes, computer generated, envelopes used. | |
| Participants | Inclusion criteria: delivery at one of two urban hospitals, maternal age 19‐40 years, maternal use of opiates and/or cocaine in pregnancy (self reported or positive toxicology of maternal urine in labour or infant urine). | |
| Interventions | Treatment group (n = 59): 16 community pediatric nurse specialist home visits from birth to 18 months. Provided emotional support, modelled positive parent‐child interactions, provided health monitoring of infant and parent education, parental skills training, used Hawaii Early Learning Profile and Carolina Preschool Curriculum. Supervised by Pediatric nurse practitioner. | |
| Outcomes | Reported primary outcome(s): Child Behaviour Checklist at 36 months. | |
| Notes | Trial of postnatal home visits to 18 months by trained community pediatric health nurses for drug using mothers. | |
| Risk of bias | ||
| Bias | Authors' judgement | Support for judgement |
| Allocation concealment? | Low risk | A ‐ Adequate |
| Methods | Randomised: yes, postpartum, used an 'urn randomisation procedure' which included variables modality of treatment referred to, age, HIV status and extent of child welfare system sanctions. | |
| Participants | 'Black' mothers (95% African‐American) referred after childbirth by hospital or from Department of Children and Families after a child abuse/neglect report. Inclusion criteria: 'black', female, >= 18 years old, toxicology of mother or infant positive for cocaine. | |
| Interventions | Treatment Group: | |
| Outcomes | Primary outcomes: enrolment in treatment program, 4 weeks and 90 day retention in treatment. | |
| Notes | Trial of postnatal and childhood short‐term home‐based intervention program administered by trained counselors with aim of engagement and retention in drug abuse treatment program. | |
| Risk of bias | ||
| Bias | Authors' judgement | Support for judgement |
| Allocation concealment? | Low risk | A ‐ Adequate |
| Methods | Randomised: yes, prepartum, method not reported. | |
| Participants | Hospital referred first day postpartum. Inclusion criteria: singleton birth, self report of heavy drug and/or alcohol use in pregnancy. Recruited within one month of delivery. Not successfully engaged with community services. Minimal or no prenatal care. | |
| Interventions | Home visit group (n = 35): The Seattle Birth to 3 years Program ‐ a 3 year home visiting advocacy program by paraprofessional advocates with many similar life experiences. Weekly home visits for 6 weeks, then twice monthly or more to 3 years. Linked clients with health care, parenting classes, therapeutic child care and substance abuse treatment programs. Clients not required to obtain drug/alcohol treatment. No specific developmental intervention, but developmental assessment performed in intervention group at 4 months, 2 and 3 years with discussion of progress with parents. | |
| Outcomes | Primary outcomes: Bayley Scales of Infant Development at 3 years. | |
| Notes | Trial of postnatal paraprofessional home visits in drug using women. | |
| Risk of bias | ||
| Bias | Authors' judgement | Support for judgement |
| Allocation concealment? | Unclear risk | B ‐ Unclear |
| Methods | Randomised: yes, computer generated, envelopes used. | |
| Participants | Teenagers attending first antenatal clinic appointment at an Australian public care teenage pregnancy clinic. Inclusion criteria: < 18 years, ability to speak English, intention to continue with pregnancy. Exclusion criteria: lived over 150 km from hospital or known fetal abnormality. Rates of alcohol use up to beginning of pregnancy were 79% in home visit group and 69% in control group. Rates of illicit drug use at beginning of pregnancy were 61% in home visit group and 51% in control group. | |
| Interventions | Home visits group (n = 65): structured postnatal home visits by nurse midwife at 1 and 2 weeks, 1, 2, 4 and 6 months. Visits lasted 1‐4 hours. Obstetrician phone advice available. Interventions included lactation and mothercraft education and advice, general and obstetric health surveillance, contraception and child health advice, provided information on drug and alcohol use and services, education on parenting skills and confirmed appointments for vaccinations. | |
| Outcomes | Primary outcomes: adverse neonatal outcomes, knowledge about contraception, vaccination schedules and breastfeeding. | |
| Notes | Neonatal deaths at 13 and 17 days and 4 months not documented as having received home visits. | |
| Risk of bias | ||
| Bias | Authors' judgement | Support for judgement |
| Allocation concealment? | Low risk | A ‐ Adequate |
| Methods | Randomised: yes, 2 weeks postpartum, method not reported. | |
| Participants | Inclusion criteria: teaching hospital Baltimore, largely African‐American women, with positive urine toxicology at birth or history of recent drug use. Enrolled postpartum. | |
| Interventions | Treatment group (n = 114): Infant Health and Development Program comprising of a home‐based intervention in first year, child attendance at a child‐development centre and parent group meetings from the 2nd year. Weekly home visits from birth to 6 months, then biweekly to 18 months by lay African American women. Home visits had goal of increasing maternal empowerment and enhancing mother's ability to manage self‐identified problems using existing services and supports. Child component included Hawaii Early Learning Program. | |
| Outcomes | Reported primary outcome(s): at 18 months observed mother‐infant interaction using Child Abuse Potential Inventory and observed mother child interaction using videotaped observations. Bayley Scales of Infant Development at 18 months. | |
| Notes | Trial of postnatal home visits by lay African‐American women in women with a positive drug screen at delivery. | |
| Risk of bias | ||
| Bias | Authors' judgement | Support for judgement |
| Allocation concealment? | Unclear risk | B ‐ Unclear |
NICU: neonatal intensive care unit
Characteristics of excluded studies [ordered by study ID]
Ir a:
| Study | Reason for exclusion |
| Observational study of breastfeeding. Drug and alcohol rates not reported. | |
| Randomised study of postnatal child health nurse and social work home visitation in high‐risk families including those using drugs or alcohol. Prevalence of drug and/or alcohol use not reported. | |
| Non‐random control study of postpartum nurse home visiting for high‐risk mothers. Prevalence of drug and alcohol problems not reported. | |
| Non‐random control study of postpartum nurse home visiting for high‐risk mothers. Prevalence of drug and alcohol problems not reported. | |
| Enrolled high‐risk women with 30% incidence of daily alcohol drinking. | |
| Randomised study of community based lay home visiting of families with infants with non‐organic failure to thrive. | |
| Randomised trial of home‐based videotape intervention in adolescent mothers. | |
| Report of a nested randomised trial, part of a larger trial in adolescent mothers, of a home‐based lay worker and videotape intervention. | |
| Trial of hospital based intensive care for high‐risk women (low‐income and screening questionnaire). Prevalence of drug and alcohol use not reported. | |
| Enrolled pregnant women at high obstetric (not social) risk. Not women with a drug or alcohol problem. | |
| Trial of early postpartum hospital discharge. Substance using women excluded. | |
| Nonrandom study of foster parent training. | |
| Random study of enhanced hospital based prenatal care, relapse prevention groups, urine toxicology and therapeutic child care in substance using pregnant women. Not a study of home visits. | |
| Non‐random assignment to enhanced hospital based prenatal care, relapse prevention groups, urine toxicology and therapeutic child care during visits in substance using pregnant women. | |
| Randomised trial of extended postnatal home visitation by paraprofession people to high‐risk families. Maternal substance use documented for 19%. | |
| Trial of postpartum in hospital teaching of infant comforting and interacting techniques to substance abusing mothers. | |
| Nonrandom study of a hospital outpatient methadone program. | |
| Did not report rates of drug or alcohol use. Enrolled antenatally on basis of being high‐risk including low family function rating and at least one stressful life event (not specified as drug or alcohol related). | |
| Randomised trial of lay mother home visitation in first time mothers. | |
| Randomised trial of a single home visit incorporating an injury prevention package in families with children < 8 years age. | |
| Randomised trial of antenatal and postpartum nurse home visitation to high‐risk pregnant women. Low rate of reported drug or alcohol use in population. | |
| Randomised trial of nurse home visitation during pregnancy and early postpartum in adolescent women. Women with a chemical dependency excluded. Low rates of alcohol and marijuana use at baseline. | |
| Randomised trial of antenatal and postpartum home visiting by a team (nurse, indigenous home visitor and social worker) for high psychosocial risk women. Reported incidence of drug use 15% in last month. | |
| Randomised trial of midwifery support worker home visitation for postpartum women. Incidence of drug and alcohol use not reported. | |
| Non randomised study of home visits combined with a pediatric mobile clinic. | |
| Randomised trial of antenatal and postnatal nurse home visitation in high psychosocial risk women. Not selected on basis of drug or alcohol use. | |
| Randomised trial of antenatal and postpartum paraprofessional versus nurse home visitation versus control in women. Rate of reported drug or alcohol use approximately 20%. | |
| Randomised trial of case manager (degrees in social sciences) home visiting for low‐income mothers and infants. Prevalence of drug and alcohol use not reported. | |
| Randomised trial of home visits to young women between 15‐24 years with no history of substance use by trained volunteers. | |
| Randomised trial of intensive day treatment versus traditional outpatient treatment for postpartum women. No home visitation. | |
| Observational study. | |
| Enrolled socially disadvantaged infants in Columbia. Rates of drug and alcohol use not reported. | |
| Non‐random study of outpatient substance abuse treatment for pregnant women. | |
| Trial of continuous treatment teams of patients with a dual diagnosis. Community based services a component of the treatment team approach. Not a study of home visits. | |
| Observational study. |
Data and analyses
| Outcome or subgroup title | No. of studies | No. of participants | Statistical method | Effect size |
| 1 Continued illicit drug use Show forest plot | 2 | 248 | Risk Ratio (M‐H, Fixed, 95% CI) | 0.95 [0.75, 1.20] |
| Analysis 1.1  Comparison 1 Home visits versus no home visits during pregnancy or after delivery (subgroups by timing of intervention), Outcome 1 Continued illicit drug use. | ||||
| 1.1 Intervention during pregnancy only | 0 | 0 | Risk Ratio (M‐H, Fixed, 95% CI) | 0.0 [0.0, 0.0] |
| 1.2 Intervention after delivery only | 2 | 248 | Risk Ratio (M‐H, Fixed, 95% CI) | 0.95 [0.75, 1.20] |
| 1.3 Intervention both during pregnancy and after delivery | 0 | 0 | Risk Ratio (M‐H, Fixed, 95% CI) | 0.0 [0.0, 0.0] |
| 2 Continued alcohol use Show forest plot | 2 | 248 | Risk Ratio (M‐H, Fixed, 95% CI) | 1.08 [0.83, 1.41] |
| Analysis 1.2  Comparison 1 Home visits versus no home visits during pregnancy or after delivery (subgroups by timing of intervention), Outcome 2 Continued alcohol use. | ||||
| 2.1 Intervention during pregnancy only | 0 | 0 | Risk Ratio (M‐H, Fixed, 95% CI) | 0.0 [0.0, 0.0] |
| 2.2 Intervention after delivery only | 2 | 248 | Risk Ratio (M‐H, Fixed, 95% CI) | 1.08 [0.83, 1.41] |
| 2.3 Intervention both during pregnancy and after delivery | 0 | 0 | Risk Ratio (M‐H, Fixed, 95% CI) | 0.0 [0.0, 0.0] |
| 3 Failure to enrol in drug treatment program Show forest plot | 2 | 211 | Risk Ratio (M‐H, Random, 95% CI) | 0.45 [0.10, 1.94] |
| Analysis 1.3  Comparison 1 Home visits versus no home visits during pregnancy or after delivery (subgroups by timing of intervention), Outcome 3 Failure to enrol in drug treatment program. | ||||
| 3.1 Intervention during pregnancy only | 0 | 0 | Risk Ratio (M‐H, Random, 95% CI) | 0.0 [0.0, 0.0] |
| 3.2 Intervention after delivery only | 2 | 211 | Risk Ratio (M‐H, Random, 95% CI) | 0.45 [0.10, 1.94] |
| 3.3 Intervention both during pregnancy and after delivery | 0 | 0 | Risk Ratio (M‐H, Random, 95% CI) | 0.0 [0.0, 0.0] |
| 4 Failure to remain in drug treatment at 4 weeks Show forest plot | 1 | 103 | Risk Ratio (M‐H, Fixed, 95% CI) | 0.54 [0.35, 0.84] |
| Analysis 1.4  Comparison 1 Home visits versus no home visits during pregnancy or after delivery (subgroups by timing of intervention), Outcome 4 Failure to remain in drug treatment at 4 weeks. | ||||
| 4.1 Intervention during pregnancy only | 0 | 0 | Risk Ratio (M‐H, Fixed, 95% CI) | 0.0 [0.0, 0.0] |
| 4.2 Intervention after delivery only | 1 | 103 | Risk Ratio (M‐H, Fixed, 95% CI) | 0.54 [0.35, 0.84] |
| 4.3 Intervention both during pregnancy and after delivery | 0 | 0 | Risk Ratio (M‐H, Fixed, 95% CI) | 0.0 [0.0, 0.0] |
| 5 Failure to remain in drug treatment at 90 days Show forest plot | 1 | 103 | Risk Ratio (M‐H, Fixed, 95% CI) | 0.93 [0.69, 1.25] |
| Analysis 1.5  Comparison 1 Home visits versus no home visits during pregnancy or after delivery (subgroups by timing of intervention), Outcome 5 Failure to remain in drug treatment at 90 days. | ||||
| 5.1 Intervention during pregnancy only | 0 | 0 | Risk Ratio (M‐H, Fixed, 95% CI) | 0.0 [0.0, 0.0] |
| 5.2 Intervention after delivery only | 1 | 103 | Risk Ratio (M‐H, Fixed, 95% CI) | 0.93 [0.69, 1.25] |
| 5.3 Intervention both during pregnancy and after delivery | 0 | 0 | Risk Ratio (M‐H, Fixed, 95% CI) | 0.0 [0.0, 0.0] |
| 6 Not breastfeeding at 6 months Show forest plot | 1 | 124 | Risk Ratio (M‐H, Fixed, 95% CI) | 1.0 [0.81, 1.23] |
| Analysis 1.6  Comparison 1 Home visits versus no home visits during pregnancy or after delivery (subgroups by timing of intervention), Outcome 6 Not breastfeeding at 6 months. | ||||
| 6.1 Intervention during pregnancy only | 0 | 0 | Risk Ratio (M‐H, Fixed, 95% CI) | 0.0 [0.0, 0.0] |
| 6.2 Intervention after delivery only | 1 | 124 | Risk Ratio (M‐H, Fixed, 95% CI) | 1.0 [0.81, 1.23] |
| 6.3 Intervention both during pregnancy and after delivery | 0 | 0 | Risk Ratio (M‐H, Fixed, 95% CI) | 0.0 [0.0, 0.0] |
| 7 Incomplete 6 month infant vaccination schedule Show forest plot | 1 | 124 | Risk Ratio (M‐H, Fixed, 95% CI) | 1.07 [0.58, 1.96] |
| Analysis 1.7  Comparison 1 Home visits versus no home visits during pregnancy or after delivery (subgroups by timing of intervention), Outcome 7 Incomplete 6 month infant vaccination schedule. | ||||
| 7.1 Intervention during pregnancy only | 0 | 0 | Risk Ratio (M‐H, Fixed, 95% CI) | 0.0 [0.0, 0.0] |
| 7.2 Intervention after delivery only | 1 | 124 | Risk Ratio (M‐H, Fixed, 95% CI) | 1.07 [0.58, 1.96] |
| 7.3 Intervention both during pregnancy and after delivery | 0 | 0 | Risk Ratio (M‐H, Fixed, 95% CI) | 0.0 [0.0, 0.0] |
| 8 Failure to keep scheduled appointments (infant primary care) Show forest plot | 1 | 43 | Risk Ratio (M‐H, Fixed, 95% CI) | 0.84 [0.42, 1.66] |
| Analysis 1.8  Comparison 1 Home visits versus no home visits during pregnancy or after delivery (subgroups by timing of intervention), Outcome 8 Failure to keep scheduled appointments (infant primary care). | ||||
| 8.1 Intervention during pregnancy only | 0 | 0 | Risk Ratio (M‐H, Fixed, 95% CI) | 0.0 [0.0, 0.0] |
| 8.2 Intervention after delivery only | 0 | 0 | Risk Ratio (M‐H, Fixed, 95% CI) | 0.0 [0.0, 0.0] |
| 8.3 Intervention both during pregnancy and after delivery | 1 | 43 | Risk Ratio (M‐H, Fixed, 95% CI) | 0.84 [0.42, 1.66] |
| 9 Significant cognitive delay (Bayley MDI >= 2sd below population mean) Show forest plot | 1 | 48 | Risk Ratio (M‐H, Fixed, 95% CI) | 1.36 [0.41, 4.45] |
| Analysis 1.9  Comparison 1 Home visits versus no home visits during pregnancy or after delivery (subgroups by timing of intervention), Outcome 9 Significant cognitive delay (Bayley MDI >= 2sd below population mean). | ||||
| 9.1 Intervention during pregnancy only | 0 | 0 | Risk Ratio (M‐H, Fixed, 95% CI) | 0.0 [0.0, 0.0] |
| 9.2 Intervention after delivery only | 1 | 48 | Risk Ratio (M‐H, Fixed, 95% CI) | 1.36 [0.41, 4.45] |
| 9.3 Intervention both during pregnancy and after delivery | 0 | 0 | Risk Ratio (M‐H, Fixed, 95% CI) | 0.0 [0.0, 0.0] |
| 10 Significant psychomotor delay (Bayley PDI >= 2sd below population mean) Show forest plot | 1 | 48 | Risk Ratio (M‐H, Fixed, 95% CI) | 3.26 [1.00, 10.59] |
| Analysis 1.10  Comparison 1 Home visits versus no home visits during pregnancy or after delivery (subgroups by timing of intervention), Outcome 10 Significant psychomotor delay (Bayley PDI >= 2sd below population mean). | ||||
| 10.1 Intervention during pregnancy only | 0 | 0 | Risk Ratio (M‐H, Fixed, 95% CI) | 0.0 [0.0, 0.0] |
| 10.2 Intervention after delivery only | 1 | 48 | Risk Ratio (M‐H, Fixed, 95% CI) | 3.26 [1.00, 10.59] |
| 10.3 Intervention both during pregnancy and after delivery | 0 | 0 | Risk Ratio (M‐H, Fixed, 95% CI) | 0.0 [0.0, 0.0] |
| 11 Cognitive development (Bayley MDI) at latest time measured Show forest plot | 3 | 199 | Mean Difference (IV, Fixed, 95% CI) | 2.89 [‐1.17, 6.95] |
| Analysis 1.11  Comparison 1 Home visits versus no home visits during pregnancy or after delivery (subgroups by timing of intervention), Outcome 11 Cognitive development (Bayley MDI) at latest time measured. | ||||
| 11.1 Intervention during pregnancy only | 0 | 0 | Mean Difference (IV, Fixed, 95% CI) | 0.0 [0.0, 0.0] |
| 11.2 Intervention after delivery only | 2 | 156 | Mean Difference (IV, Fixed, 95% CI) | 3.92 [‐0.56, 8.41] |
| 11.3 Intervention both during pregnancy and after delivery | 1 | 43 | Mean Difference (IV, Fixed, 95% CI) | ‐1.80 [‐11.36, 7.76] |
| 12 Psychomotor development (Bayley PDI) at latest time measured Show forest plot | 3 | 199 | Mean Difference (IV, Fixed, 95% CI) | 3.14 [‐0.03, 6.32] |
| Analysis 1.12  Comparison 1 Home visits versus no home visits during pregnancy or after delivery (subgroups by timing of intervention), Outcome 12 Psychomotor development (Bayley PDI) at latest time measured. | ||||
| 12.1 Intervention during pregnancy only | 0 | 0 | Mean Difference (IV, Fixed, 95% CI) | 0.0 [0.0, 0.0] |
| 12.2 Intervention after delivery only | 2 | 156 | Mean Difference (IV, Fixed, 95% CI) | 3.22 [‐0.01, 6.44] |
| 12.3 Intervention both during pregnancy and after delivery | 1 | 43 | Mean Difference (IV, Fixed, 95% CI) | 0.70 [‐17.75, 19.15] |
| 13 Behavioural problems Show forest plot | 1 | 100 | Risk Ratio (M‐H, Fixed, 95% CI) | 0.46 [0.21, 1.01] |
| Analysis 1.13  Comparison 1 Home visits versus no home visits during pregnancy or after delivery (subgroups by timing of intervention), Outcome 13 Behavioural problems. | ||||
| 13.1 Intervention during pregnancy only | 0 | 0 | Risk Ratio (M‐H, Fixed, 95% CI) | 0.0 [0.0, 0.0] |
| 13.2 Intervention after delivery only | 1 | 100 | Risk Ratio (M‐H, Fixed, 95% CI) | 0.46 [0.21, 1.01] |
| 13.3 Intervention both during pregnancy and after delivery | 0 | 0 | Risk Ratio (M‐H, Fixed, 95% CI) | 0.0 [0.0, 0.0] |
| 14 Child Behaviour Checklist total score Show forest plot | 1 | 100 | Mean Difference (IV, Fixed, 95% CI) | ‐3.10 [‐7.26, 1.06] |
| Analysis 1.14  Comparison 1 Home visits versus no home visits during pregnancy or after delivery (subgroups by timing of intervention), Outcome 14 Child Behaviour Checklist total score. | ||||
| 14.1 Intervention during pregnancy only | 0 | 0 | Mean Difference (IV, Fixed, 95% CI) | 0.0 [0.0, 0.0] |
| 14.2 Intervention after delivery only | 1 | 100 | Mean Difference (IV, Fixed, 95% CI) | ‐3.10 [‐7.26, 1.06] |
| 14.3 Intervention both during pregnancy and after delivery | 0 | 0 | Mean Difference (IV, Fixed, 95% CI) | 0.0 [0.0, 0.0] |
| 15 Infant not in care of biological mother Show forest plot | 2 | 253 | Risk Ratio (M‐H, Fixed, 95% CI) | 0.83 [0.50, 1.39] |
| Analysis 1.15  Comparison 1 Home visits versus no home visits during pregnancy or after delivery (subgroups by timing of intervention), Outcome 15 Infant not in care of biological mother. | ||||
| 15.1 Intervention during pregnancy only | 0 | 0 | Risk Ratio (M‐H, Fixed, 95% CI) | 0.0 [0.0, 0.0] |
| 15.2 Intervention after delivery only | 2 | 253 | Risk Ratio (M‐H, Fixed, 95% CI) | 0.83 [0.50, 1.39] |
| 15.3 Intervention both during pregnancy and after delivery | 0 | 0 | Risk Ratio (M‐H, Fixed, 95% CI) | 0.0 [0.0, 0.0] |
| 16 Child abuse or neglect: non‐accidental injury Show forest plot | 1 | 136 | Risk Ratio (M‐H, Fixed, 95% CI) | 0.36 [0.02, 8.77] |
| Analysis 1.16  Comparison 1 Home visits versus no home visits during pregnancy or after delivery (subgroups by timing of intervention), Outcome 16 Child abuse or neglect: non‐accidental injury. | ||||
| 16.1 Intervention during pregnancy only | 0 | 0 | Risk Ratio (M‐H, Fixed, 95% CI) | 0.0 [0.0, 0.0] |
| 16.2 Intervention after delivery only | 1 | 136 | Risk Ratio (M‐H, Fixed, 95% CI) | 0.36 [0.02, 8.77] |
| 16.3 Intervention both during pregnancy and after delivery | 0 | 0 | Risk Ratio (M‐H, Fixed, 95% CI) | 0.0 [0.0, 0.0] |
| 17 Non‐accidental injury and non‐voluntary foster care Show forest plot | 1 | 136 | Risk Ratio (M‐H, Fixed, 95% CI) | 0.16 [0.02, 1.23] |
| Analysis 1.17  Comparison 1 Home visits versus no home visits during pregnancy or after delivery (subgroups by timing of intervention), Outcome 17 Non‐accidental injury and non‐voluntary foster care. | ||||
| 17.1 Intervention during pregnancy only | 0 | 0 | Risk Ratio (M‐H, Fixed, 95% CI) | 0.0 [0.0, 0.0] |
| 17.2 Intervention after delivery only | 1 | 136 | Risk Ratio (M‐H, Fixed, 95% CI) | 0.16 [0.02, 1.23] |
| 17.3 Intervention both during pregnancy and after delivery | 0 | 0 | Risk Ratio (M‐H, Fixed, 95% CI) | 0.0 [0.0, 0.0] |
| 18 Involvement with child protective services Show forest plot | 1 | 171 | Risk Ratio (M‐H, Fixed, 95% CI) | 0.38 [0.20, 0.74] |
| Analysis 1.18  Comparison 1 Home visits versus no home visits during pregnancy or after delivery (subgroups by timing of intervention), Outcome 18 Involvement with child protective services. | ||||
| 18.1 Intervention during pregnancy only | 0 | 0 | Risk Ratio (M‐H, Fixed, 95% CI) | 0.0 [0.0, 0.0] |
| 18.2 Intervention after delivery only | 1 | 171 | Risk Ratio (M‐H, Fixed, 95% CI) | 0.38 [0.20, 0.74] |
| 18.3 Intervention both during pregnancy and after delivery | 0 | 0 | Risk Ratio (M‐H, Fixed, 95% CI) | 0.0 [0.0, 0.0] |
| 19 Child abuse potential inventory (z score) Show forest plot | 1 | 43 | Mean Difference (IV, Fixed, 95% CI) | ‐0.90 [‐1.61, ‐0.19] |
| Analysis 1.19  Comparison 1 Home visits versus no home visits during pregnancy or after delivery (subgroups by timing of intervention), Outcome 19 Child abuse potential inventory (z score). | ||||
| 19.1 Intervention during pregnancy only | 0 | 0 | Mean Difference (IV, Fixed, 95% CI) | 0.0 [0.0, 0.0] |
| 19.2 Intervention after delivery only | 0 | 0 | Mean Difference (IV, Fixed, 95% CI) | 0.0 [0.0, 0.0] |
| 19.3 Intervention both during pregnancy and after delivery | 1 | 43 | Mean Difference (IV, Fixed, 95% CI) | ‐0.90 [‐1.61, ‐0.19] |
| 20 Child domain of parenting stress index at 18 months (z score) Show forest plot | 1 | 43 | Mean Difference (IV, Fixed, 95% CI) | ‐0.5 [‐0.78, ‐0.22] |
| Analysis 1.20  Comparison 1 Home visits versus no home visits during pregnancy or after delivery (subgroups by timing of intervention), Outcome 20 Child domain of parenting stress index at 18 months (z score). | ||||
| 20.1 Intervention during pregnancy only | 0 | 0 | Mean Difference (IV, Fixed, 95% CI) | 0.0 [0.0, 0.0] |
| 20.2 Intervention after delivery only | 0 | 0 | Mean Difference (IV, Fixed, 95% CI) | 0.0 [0.0, 0.0] |
| 20.3 Intervention both during pregnancy and after delivery | 1 | 43 | Mean Difference (IV, Fixed, 95% CI) | ‐0.5 [‐0.78, ‐0.22] |
| 21 HOME score Show forest plot | 1 | 43 | Mean Difference (IV, Fixed, 95% CI) | 3.70 [‐0.06, 7.46] |
| Analysis 1.21  Comparison 1 Home visits versus no home visits during pregnancy or after delivery (subgroups by timing of intervention), Outcome 21 HOME score. | ||||
| 21.1 Intervention during pregnancy only | 0 | 0 | Mean Difference (IV, Fixed, 95% CI) | 0.0 [0.0, 0.0] |
| 21.2 Intervention after delivery only | 0 | 0 | Mean Difference (IV, Fixed, 95% CI) | 0.0 [0.0, 0.0] |
| 21.3 Intervention both during pregnancy and after delivery | 1 | 43 | Mean Difference (IV, Fixed, 95% CI) | 3.70 [‐0.06, 7.46] |
| 22 No use of postpartum contraception Show forest plot | 1 | 124 | Risk Ratio (M‐H, Fixed, 95% CI) | 0.41 [0.20, 0.82] |
| Analysis 1.22  Comparison 1 Home visits versus no home visits during pregnancy or after delivery (subgroups by timing of intervention), Outcome 22 No use of postpartum contraception. | ||||
| 22.1 Intervention during pregnancy only | 0 | 0 | Risk Ratio (M‐H, Fixed, 95% CI) | 0.0 [0.0, 0.0] |
| 22.2 Intervention after delivery only | 1 | 124 | Risk Ratio (M‐H, Fixed, 95% CI) | 0.41 [0.20, 0.82] |
| 22.3 Intervention both during pregnancy and after delivery | 0 | 0 | Risk Ratio (M‐H, Fixed, 95% CI) | 0.0 [0.0, 0.0] |
| 23 Cognitive development (Bayley MDI) at latest time measured Show forest plot | 1 | 108 | Mean Difference (IV, Fixed, 95% CI) | 4.42 [‐0.82, 9.65] |
| Analysis 1.23  Comparison 1 Home visits versus no home visits during pregnancy or after delivery (subgroups by timing of intervention), Outcome 23 Cognitive development (Bayley MDI) at latest time measured. | ||||
| 23.4 Infants of mothers with no ongoing drug use (intervention after birth only) | 1 | 36 | Mean Difference (IV, Fixed, 95% CI) | 13.0 [3.39, 22.61] |
| 23.5 Infants of mothers with ongoing drug use (intervention after birth only) | 1 | 72 | Mean Difference (IV, Fixed, 95% CI) | 0.80 [‐5.44, 7.04] |
| Outcome or subgroup title | No. of studies | No. of participants | Statistical method | Effect size |
| 1 Continued illicit drug use Show forest plot | 2 | 248 | Risk Ratio (M‐H, Fixed, 95% CI) | 0.95 [0.75, 1.20] |
| Analysis 2.1  Comparison 2 Home visits versus no home visits during pregnancy or after delivery (subgroups by duration of intervention), Outcome 1 Continued illicit drug use. | ||||
| 1.1 Intervention <= 6 months | 0 | 0 | Risk Ratio (M‐H, Fixed, 95% CI) | 0.0 [0.0, 0.0] |
| 1.2 Intervention > 6 months | 2 | 248 | Risk Ratio (M‐H, Fixed, 95% CI) | 0.95 [0.75, 1.20] |
| 2 Continued alcohol use Show forest plot | 2 | 248 | Risk Ratio (M‐H, Fixed, 95% CI) | 1.08 [0.83, 1.41] |
| Analysis 2.2  Comparison 2 Home visits versus no home visits during pregnancy or after delivery (subgroups by duration of intervention), Outcome 2 Continued alcohol use. | ||||
| 2.1 Intervention <= 6 months | 0 | 0 | Risk Ratio (M‐H, Fixed, 95% CI) | 0.0 [0.0, 0.0] |
| 2.2 Intervention > 6 months | 2 | 248 | Risk Ratio (M‐H, Fixed, 95% CI) | 1.08 [0.83, 1.41] |
| 3 Failure to enrol in drug treatment program Show forest plot | 2 | 211 | Risk Ratio (M‐H, Random, 95% CI) | 0.45 [0.10, 1.94] |
| Analysis 2.3  Comparison 2 Home visits versus no home visits during pregnancy or after delivery (subgroups by duration of intervention), Outcome 3 Failure to enrol in drug treatment program. | ||||
| 3.1 Intervention <= 6 months | 1 | 103 | Risk Ratio (M‐H, Random, 95% CI) | 0.22 [0.10, 0.48] |
| 3.2 Intervention > 6 months | 1 | 108 | Risk Ratio (M‐H, Random, 95% CI) | 0.84 [0.63, 1.12] |
| 4 Failure to remain in drug treatment at 4 weeks Show forest plot | 1 | 103 | Risk Ratio (M‐H, Fixed, 95% CI) | 0.54 [0.35, 0.84] |
| Analysis 2.4  Comparison 2 Home visits versus no home visits during pregnancy or after delivery (subgroups by duration of intervention), Outcome 4 Failure to remain in drug treatment at 4 weeks. | ||||
| 4.1 Intervention <= 6 months | 1 | 103 | Risk Ratio (M‐H, Fixed, 95% CI) | 0.54 [0.35, 0.84] |
| 4.2 Intervention > 6 months | 0 | 0 | Risk Ratio (M‐H, Fixed, 95% CI) | 0.0 [0.0, 0.0] |
| 5 Failure to remain in drug treatment at 90 days Show forest plot | 1 | 103 | Risk Ratio (M‐H, Fixed, 95% CI) | 0.93 [0.69, 1.25] |
| Analysis 2.5  Comparison 2 Home visits versus no home visits during pregnancy or after delivery (subgroups by duration of intervention), Outcome 5 Failure to remain in drug treatment at 90 days. | ||||
| 5.1 Intervention <= 6 months | 1 | 103 | Risk Ratio (M‐H, Fixed, 95% CI) | 0.93 [0.69, 1.25] |
| 5.2 Intervention > 6 months | 0 | 0 | Risk Ratio (M‐H, Fixed, 95% CI) | 0.0 [0.0, 0.0] |
| 6 Not breastfeeding at 6 months Show forest plot | 1 | 124 | Risk Ratio (M‐H, Fixed, 95% CI) | 1.0 [0.81, 1.23] |
| Analysis 2.6  Comparison 2 Home visits versus no home visits during pregnancy or after delivery (subgroups by duration of intervention), Outcome 6 Not breastfeeding at 6 months. | ||||
| 6.1 Intervention <= 6 months | 1 | 124 | Risk Ratio (M‐H, Fixed, 95% CI) | 1.0 [0.81, 1.23] |
| 6.2 Intervention > 6 months | 0 | 0 | Risk Ratio (M‐H, Fixed, 95% CI) | 0.0 [0.0, 0.0] |
| 7 Incomplete 6 month infant vaccination schedule Show forest plot | 1 | 124 | Risk Ratio (M‐H, Fixed, 95% CI) | 1.07 [0.58, 1.96] |
| Analysis 2.7  Comparison 2 Home visits versus no home visits during pregnancy or after delivery (subgroups by duration of intervention), Outcome 7 Incomplete 6 month infant vaccination schedule. | ||||
| 7.1 Intervention <= 6 months | 1 | 124 | Risk Ratio (M‐H, Fixed, 95% CI) | 1.07 [0.58, 1.96] |
| 7.2 Intervention > 6 months | 0 | 0 | Risk Ratio (M‐H, Fixed, 95% CI) | 0.0 [0.0, 0.0] |
| 8 Failure to keep scheduled appointments (infant primary care) Show forest plot | 1 | 43 | Risk Ratio (M‐H, Fixed, 95% CI) | 0.84 [0.42, 1.66] |
| Analysis 2.8  Comparison 2 Home visits versus no home visits during pregnancy or after delivery (subgroups by duration of intervention), Outcome 8 Failure to keep scheduled appointments (infant primary care). | ||||
| 8.1 Intervention <= 6 months | 0 | 0 | Risk Ratio (M‐H, Fixed, 95% CI) | 0.0 [0.0, 0.0] |
| 8.2 Intervention > 6 months | 1 | 43 | Risk Ratio (M‐H, Fixed, 95% CI) | 0.84 [0.42, 1.66] |
| 9 Significant cognitive delay (Bayley MDI >= 2sd below population mean) Show forest plot | 1 | 48 | Risk Ratio (M‐H, Fixed, 95% CI) | 1.36 [0.41, 4.45] |
| Analysis 2.9  Comparison 2 Home visits versus no home visits during pregnancy or after delivery (subgroups by duration of intervention), Outcome 9 Significant cognitive delay (Bayley MDI >= 2sd below population mean). | ||||
| 9.1 Intervention <= 6 months | 0 | 0 | Risk Ratio (M‐H, Fixed, 95% CI) | 0.0 [0.0, 0.0] |
| 9.2 Intervention > 6 months | 1 | 48 | Risk Ratio (M‐H, Fixed, 95% CI) | 1.36 [0.41, 4.45] |
| 10 Significant psychomotor delay (Bayley PDI >= 2sd below population mean) Show forest plot | 1 | 48 | Risk Ratio (M‐H, Fixed, 95% CI) | 3.26 [1.00, 10.59] |
| Analysis 2.10  Comparison 2 Home visits versus no home visits during pregnancy or after delivery (subgroups by duration of intervention), Outcome 10 Significant psychomotor delay (Bayley PDI >= 2sd below population mean). | ||||
| 10.1 Intervention <= 6 months | 0 | 0 | Risk Ratio (M‐H, Fixed, 95% CI) | 0.0 [0.0, 0.0] |
| 10.2 Intervention > 6 months | 1 | 48 | Risk Ratio (M‐H, Fixed, 95% CI) | 3.26 [1.00, 10.59] |
| 11 Cognitive development (Bayley MDI) at latest time measured Show forest plot | 3 | 199 | Mean Difference (IV, Fixed, 95% CI) | 2.89 [‐1.17, 6.95] |
| Analysis 2.11  Comparison 2 Home visits versus no home visits during pregnancy or after delivery (subgroups by duration of intervention), Outcome 11 Cognitive development (Bayley MDI) at latest time measured. | ||||
| 11.1 Intervention <= 6 months | 0 | 0 | Mean Difference (IV, Fixed, 95% CI) | 0.0 [0.0, 0.0] |
| 11.2 Intervention > 6 months | 3 | 199 | Mean Difference (IV, Fixed, 95% CI) | 2.89 [‐1.17, 6.95] |
| 12 Psychomotor development (Bayley PDI) at latest time measured Show forest plot | 3 | 199 | Mean Difference (IV, Fixed, 95% CI) | 3.14 [‐0.03, 6.32] |
| Analysis 2.12  Comparison 2 Home visits versus no home visits during pregnancy or after delivery (subgroups by duration of intervention), Outcome 12 Psychomotor development (Bayley PDI) at latest time measured. | ||||
| 12.1 Intervention <= 6 months | 0 | 0 | Mean Difference (IV, Fixed, 95% CI) | 0.0 [0.0, 0.0] |
| 12.2 Intervention > 6 months | 3 | 199 | Mean Difference (IV, Fixed, 95% CI) | 3.14 [‐0.03, 6.32] |
| 13 Behavioural problems Show forest plot | 1 | 100 | Risk Ratio (M‐H, Fixed, 95% CI) | 0.46 [0.21, 1.01] |
| Analysis 2.13  Comparison 2 Home visits versus no home visits during pregnancy or after delivery (subgroups by duration of intervention), Outcome 13 Behavioural problems. | ||||
| 13.1 Intervention <= 6 months | 0 | 0 | Risk Ratio (M‐H, Fixed, 95% CI) | 0.0 [0.0, 0.0] |
| 13.2 Intervention > 6 months | 1 | 100 | Risk Ratio (M‐H, Fixed, 95% CI) | 0.46 [0.21, 1.01] |
| 14 Child Behaviour Checklist total score Show forest plot | 1 | 100 | Mean Difference (IV, Fixed, 95% CI) | ‐3.10 [‐7.26, 1.06] |
| Analysis 2.14  Comparison 2 Home visits versus no home visits during pregnancy or after delivery (subgroups by duration of intervention), Outcome 14 Child Behaviour Checklist total score. | ||||
| 14.1 Intervention <= 6 months | 0 | 0 | Mean Difference (IV, Fixed, 95% CI) | 0.0 [0.0, 0.0] |
| 14.2 Intervention > 6 months | 1 | 100 | Mean Difference (IV, Fixed, 95% CI) | ‐3.10 [‐7.26, 1.06] |
| 15 Infant not in care of biological mother Show forest plot | 2 | 253 | Risk Ratio (M‐H, Fixed, 95% CI) | 0.83 [0.50, 1.39] |
| Analysis 2.15  Comparison 2 Home visits versus no home visits during pregnancy or after delivery (subgroups by duration of intervention), Outcome 15 Infant not in care of biological mother. | ||||
| 15.1 Intervention <= 6 months | 1 | 136 | Risk Ratio (M‐H, Fixed, 95% CI) | 0.18 [0.02, 1.47] |
| 15.2 Intervention > 6 months | 1 | 117 | Risk Ratio (M‐H, Fixed, 95% CI) | 1.04 [0.61, 1.77] |
| 16 Child abuse or neglect: non‐accidental injury Show forest plot | 1 | 136 | Risk Ratio (M‐H, Fixed, 95% CI) | 0.36 [0.02, 8.77] |
| Analysis 2.16  Comparison 2 Home visits versus no home visits during pregnancy or after delivery (subgroups by duration of intervention), Outcome 16 Child abuse or neglect: non‐accidental injury. | ||||
| 16.1 Intervention <= 6 months | 1 | 136 | Risk Ratio (M‐H, Fixed, 95% CI) | 0.36 [0.02, 8.77] |
| 16.2 Intervention > 6 months | 0 | 0 | Risk Ratio (M‐H, Fixed, 95% CI) | 0.0 [0.0, 0.0] |
| 17 Non‐accidental injury and non‐voluntary foster care Show forest plot | 1 | 136 | Risk Ratio (M‐H, Fixed, 95% CI) | 0.16 [0.02, 1.23] |
| Analysis 2.17  Comparison 2 Home visits versus no home visits during pregnancy or after delivery (subgroups by duration of intervention), Outcome 17 Non‐accidental injury and non‐voluntary foster care. | ||||
| 17.1 Intervention <= 6 months | 1 | 136 | Risk Ratio (M‐H, Fixed, 95% CI) | 0.16 [0.02, 1.23] |
| 17.2 Intervention > 6 months | 0 | 0 | Risk Ratio (M‐H, Fixed, 95% CI) | 0.0 [0.0, 0.0] |
| 18 Involvement with child protective services Show forest plot | 1 | 171 | Risk Ratio (M‐H, Fixed, 95% CI) | 0.38 [0.20, 0.74] |
| Analysis 2.18  Comparison 2 Home visits versus no home visits during pregnancy or after delivery (subgroups by duration of intervention), Outcome 18 Involvement with child protective services. | ||||
| 18.1 Intervention <= 6 months | 0 | 0 | Risk Ratio (M‐H, Fixed, 95% CI) | 0.0 [0.0, 0.0] |
| 18.2 Intervention > 6 months | 1 | 171 | Risk Ratio (M‐H, Fixed, 95% CI) | 0.38 [0.20, 0.74] |
| 19 Child abuse potential inventory (z score) Show forest plot | 1 | 43 | Mean Difference (IV, Fixed, 95% CI) | ‐0.90 [‐1.61, ‐0.19] |
| Analysis 2.19  Comparison 2 Home visits versus no home visits during pregnancy or after delivery (subgroups by duration of intervention), Outcome 19 Child abuse potential inventory (z score). | ||||
| 19.1 Intervention <= 6 months | 0 | 0 | Mean Difference (IV, Fixed, 95% CI) | 0.0 [0.0, 0.0] |
| 19.2 Intervention > 6 months | 1 | 43 | Mean Difference (IV, Fixed, 95% CI) | ‐0.90 [‐1.61, ‐0.19] |
| 20 Child domain of parenting stress index at 18 months (z score) Show forest plot | 1 | 43 | Mean Difference (IV, Fixed, 95% CI) | ‐0.5 [‐0.78, ‐0.22] |
| Analysis 2.20  Comparison 2 Home visits versus no home visits during pregnancy or after delivery (subgroups by duration of intervention), Outcome 20 Child domain of parenting stress index at 18 months (z score). | ||||
| 20.1 Intervention <= 6 months | 0 | 0 | Mean Difference (IV, Fixed, 95% CI) | 0.0 [0.0, 0.0] |
| 20.2 Intervention > 6 months | 1 | 43 | Mean Difference (IV, Fixed, 95% CI) | ‐0.5 [‐0.78, ‐0.22] |
| 21 HOME score Show forest plot | 1 | 43 | Mean Difference (IV, Fixed, 95% CI) | 3.70 [‐0.06, 7.46] |
| Analysis 2.21  Comparison 2 Home visits versus no home visits during pregnancy or after delivery (subgroups by duration of intervention), Outcome 21 HOME score. | ||||
| 21.1 Intervention <= 6 months | 0 | 0 | Mean Difference (IV, Fixed, 95% CI) | 0.0 [0.0, 0.0] |
| 21.2 Intervention > 6 months | 1 | 43 | Mean Difference (IV, Fixed, 95% CI) | 3.70 [‐0.06, 7.46] |
| 22 No use of postpartum contraception Show forest plot | 1 | 124 | Risk Ratio (M‐H, Fixed, 95% CI) | 0.41 [0.20, 0.82] |
| Analysis 2.22  Comparison 2 Home visits versus no home visits during pregnancy or after delivery (subgroups by duration of intervention), Outcome 22 No use of postpartum contraception. | ||||
| 22.1 Intervention <= 6 months | 0 | 0 | Risk Ratio (M‐H, Fixed, 95% CI) | 0.0 [0.0, 0.0] |
| 22.2 Intervention > 6 months | 1 | 124 | Risk Ratio (M‐H, Fixed, 95% CI) | 0.41 [0.20, 0.82] |
| Outcome or subgroup title | No. of studies | No. of participants | Statistical method | Effect size |
| 1 Continued illicit drug use Show forest plot | 2 | 248 | Risk Ratio (M‐H, Fixed, 95% CI) | 0.95 [0.75, 1.20] |
| Analysis 3.1  Comparison 3 Home visits versus no home visits during pregnancy or after delivery (subgroups by frequency of intervention), Outcome 1 Continued illicit drug use. | ||||
| 1.1 Intervention at least weekly | 1 | 131 | Risk Ratio (M‐H, Fixed, 95% CI) | 1.20 [0.79, 1.85] |
| 1.2 Intervention < weekly | 1 | 117 | Risk Ratio (M‐H, Fixed, 95% CI) | 0.80 [0.61, 1.05] |
| 2 Continued alcohol use Show forest plot | 2 | 248 | Risk Ratio (M‐H, Fixed, 95% CI) | 1.08 [0.83, 1.41] |
| Analysis 3.2  Comparison 3 Home visits versus no home visits during pregnancy or after delivery (subgroups by frequency of intervention), Outcome 2 Continued alcohol use. | ||||
| 2.1 Intervention at least weekly | 1 | 131 | Risk Ratio (M‐H, Fixed, 95% CI) | 1.01 [0.75, 1.35] |
| 2.2 Intervention < weekly | 1 | 117 | Risk Ratio (M‐H, Fixed, 95% CI) | 1.26 [0.74, 2.13] |
| 3 Failure to enrol in drug treatment program Show forest plot | 2 | 211 | Risk Ratio (M‐H, Random, 95% CI) | 0.45 [0.10, 1.94] |
| Analysis 3.3  Comparison 3 Home visits versus no home visits during pregnancy or after delivery (subgroups by frequency of intervention), Outcome 3 Failure to enrol in drug treatment program. | ||||
| 3.1 Intervention at least weekly | 2 | 211 | Risk Ratio (M‐H, Random, 95% CI) | 0.45 [0.10, 1.94] |
| 3.2 Intervention < weekly | 0 | 0 | Risk Ratio (M‐H, Random, 95% CI) | 0.0 [0.0, 0.0] |
| 4 Failure to remain in drug treatment at 4 weeks Show forest plot | 1 | 103 | Risk Ratio (M‐H, Fixed, 95% CI) | 0.54 [0.35, 0.84] |
| Analysis 3.4  Comparison 3 Home visits versus no home visits during pregnancy or after delivery (subgroups by frequency of intervention), Outcome 4 Failure to remain in drug treatment at 4 weeks. | ||||
| 4.1 Intervention at least weekly | 1 | 103 | Risk Ratio (M‐H, Fixed, 95% CI) | 0.54 [0.35, 0.84] |
| 4.2 Intervention < weekly | 0 | 0 | Risk Ratio (M‐H, Fixed, 95% CI) | 0.0 [0.0, 0.0] |
| 5 Failure to remain in drug treatment at 90 days Show forest plot | 1 | 103 | Risk Ratio (M‐H, Fixed, 95% CI) | 0.93 [0.69, 1.25] |
| Analysis 3.5  Comparison 3 Home visits versus no home visits during pregnancy or after delivery (subgroups by frequency of intervention), Outcome 5 Failure to remain in drug treatment at 90 days. | ||||
| 5.1 Intervention at least weekly | 1 | 103 | Risk Ratio (M‐H, Fixed, 95% CI) | 0.93 [0.69, 1.25] |
| 5.2 Intervention < weekly | 0 | 0 | Risk Ratio (M‐H, Fixed, 95% CI) | 0.0 [0.0, 0.0] |
| 6 Not breastfeeding at 6 months Show forest plot | 1 | 124 | Risk Ratio (M‐H, Fixed, 95% CI) | 1.0 [0.81, 1.23] |
| Analysis 3.6  Comparison 3 Home visits versus no home visits during pregnancy or after delivery (subgroups by frequency of intervention), Outcome 6 Not breastfeeding at 6 months. | ||||
| 6.1 Intervention at least weekly | 0 | 0 | Risk Ratio (M‐H, Fixed, 95% CI) | 0.0 [0.0, 0.0] |
| 6.2 Intervention < weekly | 1 | 124 | Risk Ratio (M‐H, Fixed, 95% CI) | 1.0 [0.81, 1.23] |
| 7 Incomplete 6 month infant vaccination schedule Show forest plot | 1 | 124 | Risk Ratio (M‐H, Fixed, 95% CI) | 1.07 [0.58, 1.96] |
| Analysis 3.7  Comparison 3 Home visits versus no home visits during pregnancy or after delivery (subgroups by frequency of intervention), Outcome 7 Incomplete 6 month infant vaccination schedule. | ||||
| 7.1 Intervention at least weekly | 0 | 0 | Risk Ratio (M‐H, Fixed, 95% CI) | 0.0 [0.0, 0.0] |
| 7.2 Intervention < weekly | 1 | 124 | Risk Ratio (M‐H, Fixed, 95% CI) | 1.07 [0.58, 1.96] |
| 8 Failure to keep scheduled appointments (infant primary care) Show forest plot | 1 | 43 | Risk Ratio (M‐H, Fixed, 95% CI) | 0.84 [0.42, 1.66] |
| Analysis 3.8  Comparison 3 Home visits versus no home visits during pregnancy or after delivery (subgroups by frequency of intervention), Outcome 8 Failure to keep scheduled appointments (infant primary care). | ||||
| 8.1 Intervention at least weekly | 1 | 43 | Risk Ratio (M‐H, Fixed, 95% CI) | 0.84 [0.42, 1.66] |
| 8.2 Intervention < weekly | 0 | 0 | Risk Ratio (M‐H, Fixed, 95% CI) | 0.0 [0.0, 0.0] |
| 9 Significant cognitive delay (Bayley MDI >= 2sd below population mean) Show forest plot | 1 | 48 | Risk Ratio (M‐H, Fixed, 95% CI) | 1.36 [0.41, 4.45] |
| Analysis 3.9  Comparison 3 Home visits versus no home visits during pregnancy or after delivery (subgroups by frequency of intervention), Outcome 9 Significant cognitive delay (Bayley MDI >= 2sd below population mean). | ||||
| 9.1 Intervention at least weekly | 1 | 48 | Risk Ratio (M‐H, Fixed, 95% CI) | 1.36 [0.41, 4.45] |
| 9.2 Intervention < weekly | 0 | 0 | Risk Ratio (M‐H, Fixed, 95% CI) | 0.0 [0.0, 0.0] |
| 10 Significant psychomotor delay (Bayley PDI >= 2sd below population mean) Show forest plot | 1 | 48 | Risk Ratio (M‐H, Fixed, 95% CI) | 3.26 [1.00, 10.59] |
| Analysis 3.10  Comparison 3 Home visits versus no home visits during pregnancy or after delivery (subgroups by frequency of intervention), Outcome 10 Significant psychomotor delay (Bayley PDI >= 2sd below population mean). | ||||
| 10.1 Intervention at least weekly | 1 | 48 | Risk Ratio (M‐H, Fixed, 95% CI) | 3.26 [1.00, 10.59] |
| 10.2 Intervention < weekly | 0 | 0 | Risk Ratio (M‐H, Fixed, 95% CI) | 0.0 [0.0, 0.0] |
| 11 Cognitive development (Bayley MDI) at latest time measured Show forest plot | 3 | 199 | Mean Difference (IV, Fixed, 95% CI) | 2.89 [‐1.17, 6.95] |
| Analysis 3.11  Comparison 3 Home visits versus no home visits during pregnancy or after delivery (subgroups by frequency of intervention), Outcome 11 Cognitive development (Bayley MDI) at latest time measured. | ||||
| 11.1 Intervention at least weekly | 3 | 199 | Mean Difference (IV, Fixed, 95% CI) | 2.89 [‐1.17, 6.95] |
| 11.2 Intervention < weekly | 0 | 0 | Mean Difference (IV, Fixed, 95% CI) | 0.0 [0.0, 0.0] |
| 12 Psychomotor development (Bayley PDI) at latest time measured Show forest plot | 3 | 199 | Mean Difference (IV, Fixed, 95% CI) | 3.14 [‐0.03, 6.32] |
| Analysis 3.12  Comparison 3 Home visits versus no home visits during pregnancy or after delivery (subgroups by frequency of intervention), Outcome 12 Psychomotor development (Bayley PDI) at latest time measured. | ||||
| 12.1 Intervention at least weekly | 3 | 199 | Mean Difference (IV, Fixed, 95% CI) | 3.14 [‐0.03, 6.32] |
| 12.2 Intervention < weekly | 0 | 0 | Mean Difference (IV, Fixed, 95% CI) | 0.0 [0.0, 0.0] |
| 13 Behavioural problems Show forest plot | 1 | 100 | Risk Ratio (M‐H, Fixed, 95% CI) | 0.46 [0.21, 1.01] |
| Analysis 3.13  Comparison 3 Home visits versus no home visits during pregnancy or after delivery (subgroups by frequency of intervention), Outcome 13 Behavioural problems. | ||||
| 13.1 Intervention at least weekly | 0 | 0 | Risk Ratio (M‐H, Fixed, 95% CI) | 0.0 [0.0, 0.0] |
| 13.2 Intervention < weekly | 1 | 100 | Risk Ratio (M‐H, Fixed, 95% CI) | 0.46 [0.21, 1.01] |
| 14 Child Behaviour Checklist total score Show forest plot | 1 | 100 | Mean Difference (IV, Fixed, 95% CI) | ‐3.10 [‐7.26, 1.06] |
| Analysis 3.14  Comparison 3 Home visits versus no home visits during pregnancy or after delivery (subgroups by frequency of intervention), Outcome 14 Child Behaviour Checklist total score. | ||||
| 14.1 Intervention at least weekly | 0 | 0 | Mean Difference (IV, Fixed, 95% CI) | 0.0 [0.0, 0.0] |
| 14.2 Intervention < weekly | 1 | 100 | Mean Difference (IV, Fixed, 95% CI) | ‐3.10 [‐7.26, 1.06] |
| 15 Infant not in care of biological mother Show forest plot | 2 | 253 | Risk Ratio (M‐H, Fixed, 95% CI) | 0.83 [0.50, 1.39] |
| Analysis 3.15  Comparison 3 Home visits versus no home visits during pregnancy or after delivery (subgroups by frequency of intervention), Outcome 15 Infant not in care of biological mother. | ||||
| 15.1 Intervention at least weekly | 0 | 0 | Risk Ratio (M‐H, Fixed, 95% CI) | 0.0 [0.0, 0.0] |
| 15.2 Intervention < weekly | 2 | 253 | Risk Ratio (M‐H, Fixed, 95% CI) | 0.83 [0.50, 1.39] |
| 16 Child abuse or neglect: non‐accidental injury Show forest plot | 1 | 136 | Risk Ratio (M‐H, Fixed, 95% CI) | 0.36 [0.02, 8.77] |
| Analysis 3.16  Comparison 3 Home visits versus no home visits during pregnancy or after delivery (subgroups by frequency of intervention), Outcome 16 Child abuse or neglect: non‐accidental injury. | ||||
| 16.1 Intervention at least weekly | 0 | 0 | Risk Ratio (M‐H, Fixed, 95% CI) | 0.0 [0.0, 0.0] |
| 16.2 Intervention < weekly | 1 | 136 | Risk Ratio (M‐H, Fixed, 95% CI) | 0.36 [0.02, 8.77] |
| 17 Non‐accidental injury and non‐voluntary foster care Show forest plot | 1 | 136 | Risk Ratio (M‐H, Fixed, 95% CI) | 0.16 [0.02, 1.23] |
| Analysis 3.17  Comparison 3 Home visits versus no home visits during pregnancy or after delivery (subgroups by frequency of intervention), Outcome 17 Non‐accidental injury and non‐voluntary foster care. | ||||
| 17.1 Intervention at least weekly | 0 | 0 | Risk Ratio (M‐H, Fixed, 95% CI) | 0.0 [0.0, 0.0] |
| 17.2 Intervention < weekly | 1 | 136 | Risk Ratio (M‐H, Fixed, 95% CI) | 0.16 [0.02, 1.23] |
| 18 Involvement with child protective services Show forest plot | 1 | 171 | Risk Ratio (M‐H, Fixed, 95% CI) | 0.38 [0.20, 0.74] |
| Analysis 3.18  Comparison 3 Home visits versus no home visits during pregnancy or after delivery (subgroups by frequency of intervention), Outcome 18 Involvement with child protective services. | ||||
| 18.1 Intervention at least weekly | 1 | 171 | Risk Ratio (M‐H, Fixed, 95% CI) | 0.38 [0.20, 0.74] |
| 18.2 Intervention < weekly | 0 | 0 | Risk Ratio (M‐H, Fixed, 95% CI) | 0.0 [0.0, 0.0] |
| 19 Child abuse potential inventory (z score) Show forest plot | 1 | 43 | Mean Difference (IV, Fixed, 95% CI) | ‐0.90 [‐1.61, ‐0.19] |
| Analysis 3.19  Comparison 3 Home visits versus no home visits during pregnancy or after delivery (subgroups by frequency of intervention), Outcome 19 Child abuse potential inventory (z score). | ||||
| 19.1 Intervention at least weekly | 1 | 43 | Mean Difference (IV, Fixed, 95% CI) | ‐0.90 [‐1.61, ‐0.19] |
| 19.2 Intervention < weekly | 0 | 0 | Mean Difference (IV, Fixed, 95% CI) | 0.0 [0.0, 0.0] |
| 20 Child domain of parenting stress index at 18 months (z score) Show forest plot | 1 | 43 | Mean Difference (IV, Fixed, 95% CI) | ‐0.5 [‐0.78, ‐0.22] |
| Analysis 3.20  Comparison 3 Home visits versus no home visits during pregnancy or after delivery (subgroups by frequency of intervention), Outcome 20 Child domain of parenting stress index at 18 months (z score). | ||||
| 20.1 Intervention at least weekly | 1 | 43 | Mean Difference (IV, Fixed, 95% CI) | ‐0.5 [‐0.78, ‐0.22] |
| 20.2 Intervention < weekly | 0 | 0 | Mean Difference (IV, Fixed, 95% CI) | 0.0 [0.0, 0.0] |
| 21 HOME score Show forest plot | 1 | 43 | Mean Difference (IV, Fixed, 95% CI) | 3.70 [‐0.06, 7.46] |
| Analysis 3.21  Comparison 3 Home visits versus no home visits during pregnancy or after delivery (subgroups by frequency of intervention), Outcome 21 HOME score. | ||||
| 21.1 Intervention at least weekly | 1 | 43 | Mean Difference (IV, Fixed, 95% CI) | 3.70 [‐0.06, 7.46] |
| 21.2 Intervention < weekly | 0 | 0 | Mean Difference (IV, Fixed, 95% CI) | 0.0 [0.0, 0.0] |
| 22 No use of postpartum contraception Show forest plot | 1 | 124 | Risk Ratio (M‐H, Fixed, 95% CI) | 0.41 [0.20, 0.82] |
| Analysis 3.22  Comparison 3 Home visits versus no home visits during pregnancy or after delivery (subgroups by frequency of intervention), Outcome 22 No use of postpartum contraception. | ||||
| 22.1 Intervention at least weekly | 0 | 0 | Risk Ratio (M‐H, Fixed, 95% CI) | 0.0 [0.0, 0.0] |
| 22.2 Intervention < weekly | 1 | 124 | Risk Ratio (M‐H, Fixed, 95% CI) | 0.41 [0.20, 0.82] |
| Outcome or subgroup title | No. of studies | No. of participants | Statistical method | Effect size |
| 1 Continued illicit drug use Show forest plot | 2 | 248 | Risk Ratio (M‐H, Fixed, 95% CI) | 0.95 [0.75, 1.20] |
| Analysis 4.1  Comparison 4 Home visits versus no home visits during pregnancy or after delivery (subgroups by home visitor), Outcome 1 Continued illicit drug use. | ||||
| 1.1 Intervention by nurse | 1 | 117 | Risk Ratio (M‐H, Fixed, 95% CI) | 0.80 [0.61, 1.05] |
| 1.2 Intervention by trained social worker | 0 | 0 | Risk Ratio (M‐H, Fixed, 95% CI) | 0.0 [0.0, 0.0] |
| 1.3 Intervention by trained counsellor | 0 | 0 | Risk Ratio (M‐H, Fixed, 95% CI) | 0.0 [0.0, 0.0] |
| 1.4 Intervention by trained lay worker | 1 | 131 | Risk Ratio (M‐H, Fixed, 95% CI) | 1.20 [0.79, 1.85] |
| 1.5 Intervention by multidisciplinary team | 0 | 0 | Risk Ratio (M‐H, Fixed, 95% CI) | 0.0 [0.0, 0.0] |
| 2 Continued alcohol use Show forest plot | 2 | 248 | Risk Ratio (M‐H, Fixed, 95% CI) | 1.08 [0.83, 1.41] |
| Analysis 4.2  Comparison 4 Home visits versus no home visits during pregnancy or after delivery (subgroups by home visitor), Outcome 2 Continued alcohol use. | ||||
| 2.1 Intervention by nurse | 1 | 117 | Risk Ratio (M‐H, Fixed, 95% CI) | 1.26 [0.74, 2.13] |
| 2.2 Intervention by trained social worker | 0 | 0 | Risk Ratio (M‐H, Fixed, 95% CI) | 0.0 [0.0, 0.0] |
| 2.3 Intervention by trained counsellor | 0 | 0 | Risk Ratio (M‐H, Fixed, 95% CI) | 0.0 [0.0, 0.0] |
| 2.4 Intervention by trained lay worker | 1 | 131 | Risk Ratio (M‐H, Fixed, 95% CI) | 1.01 [0.75, 1.35] |
| 2.5 Intervention by multidisciplinary team | 0 | 0 | Risk Ratio (M‐H, Fixed, 95% CI) | 0.0 [0.0, 0.0] |
| 3 Failure to enrol in drug treatment program Show forest plot | 2 | 211 | Risk Ratio (M‐H, Random, 95% CI) | 0.45 [0.10, 1.94] |
| Analysis 4.3  Comparison 4 Home visits versus no home visits during pregnancy or after delivery (subgroups by home visitor), Outcome 3 Failure to enrol in drug treatment program. | ||||
| 3.1 Intervention by nurse | 0 | 0 | Risk Ratio (M‐H, Random, 95% CI) | 0.0 [0.0, 0.0] |
| 3.2 Intervention by trained social worker | 0 | 0 | Risk Ratio (M‐H, Random, 95% CI) | 0.0 [0.0, 0.0] |
| 3.3 Intervention by trained counsellor | 1 | 103 | Risk Ratio (M‐H, Random, 95% CI) | 0.22 [0.10, 0.48] |
| 3.4 Intervention by trained lay worker | 1 | 108 | Risk Ratio (M‐H, Random, 95% CI) | 0.84 [0.63, 1.12] |
| 3.5 Intervention by multidisciplinary team | 0 | 0 | Risk Ratio (M‐H, Random, 95% CI) | 0.0 [0.0, 0.0] |
| 4 Failure to remain in drug treatment at 4 weeks Show forest plot | 1 | 103 | Risk Ratio (M‐H, Fixed, 95% CI) | 0.54 [0.35, 0.84] |
| Analysis 4.4  Comparison 4 Home visits versus no home visits during pregnancy or after delivery (subgroups by home visitor), Outcome 4 Failure to remain in drug treatment at 4 weeks. | ||||
| 4.1 Intervention by nurse | 0 | 0 | Risk Ratio (M‐H, Fixed, 95% CI) | 0.0 [0.0, 0.0] |
| 4.2 Intervention by trained social worker | 0 | 0 | Risk Ratio (M‐H, Fixed, 95% CI) | 0.0 [0.0, 0.0] |
| 4.3 Intervention by trained counsellor | 1 | 103 | Risk Ratio (M‐H, Fixed, 95% CI) | 0.54 [0.35, 0.84] |
| 4.4 Intervention by trained lay worker | 0 | 0 | Risk Ratio (M‐H, Fixed, 95% CI) | 0.0 [0.0, 0.0] |
| 4.5 Intervention by multidisciplinary team | 0 | 0 | Risk Ratio (M‐H, Fixed, 95% CI) | 0.0 [0.0, 0.0] |
| 5 Failure to remain in drug treatment at 90 days Show forest plot | 1 | 103 | Risk Ratio (M‐H, Fixed, 95% CI) | 0.93 [0.69, 1.25] |
| Analysis 4.5  Comparison 4 Home visits versus no home visits during pregnancy or after delivery (subgroups by home visitor), Outcome 5 Failure to remain in drug treatment at 90 days. | ||||
| 5.1 Intervention by nurse | 0 | 0 | Risk Ratio (M‐H, Fixed, 95% CI) | 0.0 [0.0, 0.0] |
| 5.2 Intervention by trained social worker | 0 | 0 | Risk Ratio (M‐H, Fixed, 95% CI) | 0.0 [0.0, 0.0] |
| 5.3 Intervention by trained counsellor | 1 | 103 | Risk Ratio (M‐H, Fixed, 95% CI) | 0.93 [0.69, 1.25] |
| 5.4 Intervention by trained lay worker | 0 | 0 | Risk Ratio (M‐H, Fixed, 95% CI) | 0.0 [0.0, 0.0] |
| 5.5 Intervention by multidisciplinary team | 0 | 0 | Risk Ratio (M‐H, Fixed, 95% CI) | 0.0 [0.0, 0.0] |
| 6 Not breastfeeding at 6 months Show forest plot | 1 | 124 | Risk Ratio (M‐H, Fixed, 95% CI) | 1.0 [0.81, 1.23] |
| Analysis 4.6  Comparison 4 Home visits versus no home visits during pregnancy or after delivery (subgroups by home visitor), Outcome 6 Not breastfeeding at 6 months. | ||||
| 6.1 Intervention by nurse | 1 | 124 | Risk Ratio (M‐H, Fixed, 95% CI) | 1.0 [0.81, 1.23] |
| 6.2 Intervention by trained social worker | 0 | 0 | Risk Ratio (M‐H, Fixed, 95% CI) | 0.0 [0.0, 0.0] |
| 6.3 Intervention by trained counsellor | 0 | 0 | Risk Ratio (M‐H, Fixed, 95% CI) | 0.0 [0.0, 0.0] |
| 6.4 Intervention by trained lay worker | 0 | 0 | Risk Ratio (M‐H, Fixed, 95% CI) | 0.0 [0.0, 0.0] |
| 6.5 Intervention by multidisciplinary team | 0 | 0 | Risk Ratio (M‐H, Fixed, 95% CI) | 0.0 [0.0, 0.0] |
| 7 Incomplete 6 month infant vaccination schedule Show forest plot | 1 | 124 | Risk Ratio (M‐H, Fixed, 95% CI) | 1.07 [0.58, 1.96] |
| Analysis 4.7  Comparison 4 Home visits versus no home visits during pregnancy or after delivery (subgroups by home visitor), Outcome 7 Incomplete 6 month infant vaccination schedule. | ||||
| 7.1 Intervention by nurse | 1 | 124 | Risk Ratio (M‐H, Fixed, 95% CI) | 1.07 [0.58, 1.96] |
| 7.2 Intervention by trained social worker | 0 | 0 | Risk Ratio (M‐H, Fixed, 95% CI) | 0.0 [0.0, 0.0] |
| 7.3 Intervention by trained counsellor | 0 | 0 | Risk Ratio (M‐H, Fixed, 95% CI) | 0.0 [0.0, 0.0] |
| 7.4 Intervention by trained lay worker | 0 | 0 | Risk Ratio (M‐H, Fixed, 95% CI) | 0.0 [0.0, 0.0] |
| 7.5 Intervention by multidisciplinary team | 0 | 0 | Risk Ratio (M‐H, Fixed, 95% CI) | 0.0 [0.0, 0.0] |
| 8 Failure to keep scheduled appointments (infant primary care) Show forest plot | 1 | 43 | Risk Ratio (M‐H, Fixed, 95% CI) | 0.84 [0.42, 1.66] |
| Analysis 4.8  Comparison 4 Home visits versus no home visits during pregnancy or after delivery (subgroups by home visitor), Outcome 8 Failure to keep scheduled appointments (infant primary care). | ||||
| 8.1 Intervention by nurse | 1 | 43 | Risk Ratio (M‐H, Fixed, 95% CI) | 0.84 [0.42, 1.66] |
| 8.2 Intervention by trained social worker | 0 | 0 | Risk Ratio (M‐H, Fixed, 95% CI) | 0.0 [0.0, 0.0] |
| 8.3 Intervention by trained counsellor | 0 | 0 | Risk Ratio (M‐H, Fixed, 95% CI) | 0.0 [0.0, 0.0] |
| 8.4 Intervention by trained lay worker | 0 | 0 | Risk Ratio (M‐H, Fixed, 95% CI) | 0.0 [0.0, 0.0] |
| 8.5 Intervention by multidisciplinary team | 0 | 0 | Risk Ratio (M‐H, Fixed, 95% CI) | 0.0 [0.0, 0.0] |
| 9 Significant cognitive delay (Bayley MDI >= 2sd below population mean) Show forest plot | 1 | 48 | Risk Ratio (M‐H, Fixed, 95% CI) | 1.36 [0.41, 4.45] |
| Analysis 4.9  Comparison 4 Home visits versus no home visits during pregnancy or after delivery (subgroups by home visitor), Outcome 9 Significant cognitive delay (Bayley MDI >= 2sd below population mean). | ||||
| 9.1 Intervention by nurse | 0 | 0 | Risk Ratio (M‐H, Fixed, 95% CI) | 0.0 [0.0, 0.0] |
| 9.2 Intervention by trained social worker | 0 | 0 | Risk Ratio (M‐H, Fixed, 95% CI) | 0.0 [0.0, 0.0] |
| 9.3 Intervention by trained counsellor | 0 | 0 | Risk Ratio (M‐H, Fixed, 95% CI) | 0.0 [0.0, 0.0] |
| 9.4 Intervention by trained lay worker | 1 | 48 | Risk Ratio (M‐H, Fixed, 95% CI) | 1.36 [0.41, 4.45] |
| 9.5 Intervention by multidisciplinary team | 0 | 0 | Risk Ratio (M‐H, Fixed, 95% CI) | 0.0 [0.0, 0.0] |
| 10 Significant psychomotor delay (Bayley PDI >= 2sd below population mean) Show forest plot | 1 | 48 | Risk Ratio (M‐H, Fixed, 95% CI) | 3.26 [1.00, 10.59] |
| Analysis 4.10  Comparison 4 Home visits versus no home visits during pregnancy or after delivery (subgroups by home visitor), Outcome 10 Significant psychomotor delay (Bayley PDI >= 2sd below population mean). | ||||
| 10.1 Intervention by nurse | 0 | 0 | Risk Ratio (M‐H, Fixed, 95% CI) | 0.0 [0.0, 0.0] |
| 10.2 Intervention by trained social worker | 0 | 0 | Risk Ratio (M‐H, Fixed, 95% CI) | 0.0 [0.0, 0.0] |
| 10.3 Intervention by trained counsellor | 0 | 0 | Risk Ratio (M‐H, Fixed, 95% CI) | 0.0 [0.0, 0.0] |
| 10.4 Intervention by trained lay worker | 1 | 48 | Risk Ratio (M‐H, Fixed, 95% CI) | 3.26 [1.00, 10.59] |
| 10.5 Intervention by multidisciplinary team | 0 | 0 | Risk Ratio (M‐H, Fixed, 95% CI) | 0.0 [0.0, 0.0] |
| 11 Cognitive development (Bayley MDI) at latest time measured Show forest plot | 3 | 199 | Mean Difference (IV, Fixed, 95% CI) | 2.89 [‐1.17, 6.95] |
| Analysis 4.11  Comparison 4 Home visits versus no home visits during pregnancy or after delivery (subgroups by home visitor), Outcome 11 Cognitive development (Bayley MDI) at latest time measured. | ||||
| 11.1 Intervention by nurse | 1 | 43 | Mean Difference (IV, Fixed, 95% CI) | ‐1.80 [‐11.36, 7.76] |
| 11.2 Intervention by trained social worker | 0 | 0 | Mean Difference (IV, Fixed, 95% CI) | 0.0 [0.0, 0.0] |
| 11.3 Intervention by trained counsellor | 0 | 0 | Mean Difference (IV, Fixed, 95% CI) | 0.0 [0.0, 0.0] |
| 11.4 Intervention by trained lay worker | 2 | 156 | Mean Difference (IV, Fixed, 95% CI) | 3.92 [‐0.56, 8.41] |
| 11.5 Intervention by multidisciplinary team | 0 | 0 | Mean Difference (IV, Fixed, 95% CI) | 0.0 [0.0, 0.0] |
| 12 Psychomotor development (Bayley PDI) at latest time measured Show forest plot | 3 | 199 | Mean Difference (IV, Fixed, 95% CI) | 3.14 [‐0.03, 6.32] |
| Analysis 4.12  Comparison 4 Home visits versus no home visits during pregnancy or after delivery (subgroups by home visitor), Outcome 12 Psychomotor development (Bayley PDI) at latest time measured. | ||||
| 12.1 Intervention by nurse | 1 | 43 | Mean Difference (IV, Fixed, 95% CI) | 0.70 [‐17.75, 19.15] |
| 12.2 Intervention by trained social worker | 0 | 0 | Mean Difference (IV, Fixed, 95% CI) | 0.0 [0.0, 0.0] |
| 12.3 Intervention by trained counsellor | 0 | 0 | Mean Difference (IV, Fixed, 95% CI) | 0.0 [0.0, 0.0] |
| 12.4 Intervention by trained lay worker | 2 | 156 | Mean Difference (IV, Fixed, 95% CI) | 3.22 [‐0.01, 6.44] |
| 12.5 Intervention by multidisciplinary team | 0 | 0 | Mean Difference (IV, Fixed, 95% CI) | 0.0 [0.0, 0.0] |
| 13 Behavioural problems Show forest plot | 1 | 100 | Risk Ratio (M‐H, Fixed, 95% CI) | 0.46 [0.21, 1.01] |
| Analysis 4.13  Comparison 4 Home visits versus no home visits during pregnancy or after delivery (subgroups by home visitor), Outcome 13 Behavioural problems. | ||||
| 13.1 Intervention by nurse | 1 | 100 | Risk Ratio (M‐H, Fixed, 95% CI) | 0.46 [0.21, 1.01] |
| 13.2 Intervention by trained social worker | 0 | 0 | Risk Ratio (M‐H, Fixed, 95% CI) | 0.0 [0.0, 0.0] |
| 13.3 Intervention by trained counsellor | 0 | 0 | Risk Ratio (M‐H, Fixed, 95% CI) | 0.0 [0.0, 0.0] |
| 13.4 Intervention by trained lay worker | 0 | 0 | Risk Ratio (M‐H, Fixed, 95% CI) | 0.0 [0.0, 0.0] |
| 13.5 Intervention by multidisciplinary team | 0 | 0 | Risk Ratio (M‐H, Fixed, 95% CI) | 0.0 [0.0, 0.0] |
| 14 Child Behaviour Checklist total score Show forest plot | 1 | 100 | Mean Difference (IV, Fixed, 95% CI) | ‐3.10 [‐7.26, 1.06] |
| Analysis 4.14  Comparison 4 Home visits versus no home visits during pregnancy or after delivery (subgroups by home visitor), Outcome 14 Child Behaviour Checklist total score. | ||||
| 14.1 Intervention by nurse | 1 | 100 | Mean Difference (IV, Fixed, 95% CI) | ‐3.10 [‐7.26, 1.06] |
| 14.2 Intervention by trained social worker | 0 | 0 | Mean Difference (IV, Fixed, 95% CI) | 0.0 [0.0, 0.0] |
| 14.3 Intervention by trained counsellor | 0 | 0 | Mean Difference (IV, Fixed, 95% CI) | 0.0 [0.0, 0.0] |
| 14.4 Intervention by trained lay worker | 0 | 0 | Mean Difference (IV, Fixed, 95% CI) | 0.0 [0.0, 0.0] |
| 14.5 Intervention by multidisciplinary team | 0 | 0 | Mean Difference (IV, Fixed, 95% CI) | 0.0 [0.0, 0.0] |
| 15 Infant not in care of biological mother Show forest plot | 2 | 253 | Risk Ratio (M‐H, Fixed, 95% CI) | 0.83 [0.50, 1.39] |
| Analysis 4.15  Comparison 4 Home visits versus no home visits during pregnancy or after delivery (subgroups by home visitor), Outcome 15 Infant not in care of biological mother. | ||||
| 15.1 Intervention by nurse | 2 | 253 | Risk Ratio (M‐H, Fixed, 95% CI) | 0.83 [0.50, 1.39] |
| 15.2 Intervention by trained social worker | 0 | 0 | Risk Ratio (M‐H, Fixed, 95% CI) | 0.0 [0.0, 0.0] |
| 15.3 Intervention by trained counsellor | 0 | 0 | Risk Ratio (M‐H, Fixed, 95% CI) | 0.0 [0.0, 0.0] |
| 15.4 Intervention by trained lay worker | 0 | 0 | Risk Ratio (M‐H, Fixed, 95% CI) | 0.0 [0.0, 0.0] |
| 15.5 Intervention by multidisciplinary team | 0 | 0 | Risk Ratio (M‐H, Fixed, 95% CI) | 0.0 [0.0, 0.0] |
| 16 Child abuse or neglect: non‐accidental injury Show forest plot | 1 | 136 | Risk Ratio (M‐H, Fixed, 95% CI) | 0.36 [0.02, 8.77] |
| Analysis 4.16  Comparison 4 Home visits versus no home visits during pregnancy or after delivery (subgroups by home visitor), Outcome 16 Child abuse or neglect: non‐accidental injury. | ||||
| 16.1 Intervention by nurse | 1 | 136 | Risk Ratio (M‐H, Fixed, 95% CI) | 0.36 [0.02, 8.77] |
| 16.2 Intervention by trained social worker | 0 | 0 | Risk Ratio (M‐H, Fixed, 95% CI) | 0.0 [0.0, 0.0] |
| 16.3 Intervention by trained counsellor | 0 | 0 | Risk Ratio (M‐H, Fixed, 95% CI) | 0.0 [0.0, 0.0] |
| 16.4 Intervention by trained lay worker | 0 | 0 | Risk Ratio (M‐H, Fixed, 95% CI) | 0.0 [0.0, 0.0] |
| 16.5 Intervention by multidisciplinary team | 0 | 0 | Risk Ratio (M‐H, Fixed, 95% CI) | 0.0 [0.0, 0.0] |
| 17 Non‐accidental injury and non‐voluntary foster care Show forest plot | 1 | 136 | Risk Ratio (M‐H, Fixed, 95% CI) | 0.16 [0.02, 1.23] |
| Analysis 4.17  Comparison 4 Home visits versus no home visits during pregnancy or after delivery (subgroups by home visitor), Outcome 17 Non‐accidental injury and non‐voluntary foster care. | ||||
| 17.1 Intervention by nurse | 1 | 136 | Risk Ratio (M‐H, Fixed, 95% CI) | 0.16 [0.02, 1.23] |
| 17.2 Intervention by trained social worker | 0 | 0 | Risk Ratio (M‐H, Fixed, 95% CI) | 0.0 [0.0, 0.0] |
| 17.3 ntervention by trained counsellor | 0 | 0 | Risk Ratio (M‐H, Fixed, 95% CI) | 0.0 [0.0, 0.0] |
| 17.4 Intervention by trained lay worker | 0 | 0 | Risk Ratio (M‐H, Fixed, 95% CI) | 0.0 [0.0, 0.0] |
| 17.5 Intervention by multidisciplinary team | 0 | 0 | Risk Ratio (M‐H, Fixed, 95% CI) | 0.0 [0.0, 0.0] |
| 18 Involvement with child protective services Show forest plot | 1 | 171 | Risk Ratio (M‐H, Fixed, 95% CI) | 0.38 [0.20, 0.74] |
| Analysis 4.18  Comparison 4 Home visits versus no home visits during pregnancy or after delivery (subgroups by home visitor), Outcome 18 Involvement with child protective services. | ||||
| 18.1 Intervention by nurse | 0 | 0 | Risk Ratio (M‐H, Fixed, 95% CI) | 0.0 [0.0, 0.0] |
| 18.2 Intervention by trained social worker | 0 | 0 | Risk Ratio (M‐H, Fixed, 95% CI) | 0.0 [0.0, 0.0] |
| 18.3 Intervention by trained counsellor | 0 | 0 | Risk Ratio (M‐H, Fixed, 95% CI) | 0.0 [0.0, 0.0] |
| 18.4 Intervention by trained lay worker | 1 | 171 | Risk Ratio (M‐H, Fixed, 95% CI) | 0.38 [0.20, 0.74] |
| 18.5 Intervention by multidisciplinary team | 0 | 0 | Risk Ratio (M‐H, Fixed, 95% CI) | 0.0 [0.0, 0.0] |
| 19 Child abuse potential inventory (z score) Show forest plot | 1 | 43 | Mean Difference (IV, Fixed, 95% CI) | ‐0.90 [‐1.61, ‐0.19] |
| Analysis 4.19  Comparison 4 Home visits versus no home visits during pregnancy or after delivery (subgroups by home visitor), Outcome 19 Child abuse potential inventory (z score). | ||||
| 19.1 Intervention by nurse | 1 | 43 | Mean Difference (IV, Fixed, 95% CI) | ‐0.90 [‐1.61, ‐0.19] |
| 19.2 Intervention by trained social worker | 0 | 0 | Mean Difference (IV, Fixed, 95% CI) | 0.0 [0.0, 0.0] |
| 19.3 Intervention by trained counsellor | 0 | 0 | Mean Difference (IV, Fixed, 95% CI) | 0.0 [0.0, 0.0] |
| 19.4 Intervention by trained lay worker | 0 | 0 | Mean Difference (IV, Fixed, 95% CI) | 0.0 [0.0, 0.0] |
| 19.5 Intervention by multidisciplinary team | 0 | 0 | Mean Difference (IV, Fixed, 95% CI) | 0.0 [0.0, 0.0] |
| 20 Child domain of parenting stress index at 18 months (z score) Show forest plot | 1 | 43 | Mean Difference (IV, Fixed, 95% CI) | ‐0.5 [‐0.78, ‐0.22] |
| Analysis 4.20  Comparison 4 Home visits versus no home visits during pregnancy or after delivery (subgroups by home visitor), Outcome 20 Child domain of parenting stress index at 18 months (z score). | ||||
| 20.1 Intervention by nurse | 1 | 43 | Mean Difference (IV, Fixed, 95% CI) | ‐0.5 [‐0.78, ‐0.22] |
| 20.2 Intervention by trained social worker | 0 | 0 | Mean Difference (IV, Fixed, 95% CI) | 0.0 [0.0, 0.0] |
| 20.3 Intervention by trained counsellor | 0 | 0 | Mean Difference (IV, Fixed, 95% CI) | 0.0 [0.0, 0.0] |
| 20.4 Intervention by trained lay worker | 0 | 0 | Mean Difference (IV, Fixed, 95% CI) | 0.0 [0.0, 0.0] |
| 20.5 Intervention by multidisciplinary team | 0 | 0 | Mean Difference (IV, Fixed, 95% CI) | 0.0 [0.0, 0.0] |
| 21 HOME score Show forest plot | 1 | 43 | Mean Difference (IV, Fixed, 95% CI) | 3.70 [‐0.06, 7.46] |
| Analysis 4.21  Comparison 4 Home visits versus no home visits during pregnancy or after delivery (subgroups by home visitor), Outcome 21 HOME score. | ||||
| 21.1 Intervention by nurse | 1 | 43 | Mean Difference (IV, Fixed, 95% CI) | 3.70 [‐0.06, 7.46] |
| 21.2 Intervention by trained social worker | 0 | 0 | Mean Difference (IV, Fixed, 95% CI) | 0.0 [0.0, 0.0] |
| 21.3 Intervention by trained counsellor | 0 | 0 | Mean Difference (IV, Fixed, 95% CI) | 0.0 [0.0, 0.0] |
| 21.4 Intervention by trained lay worker | 0 | 0 | Mean Difference (IV, Fixed, 95% CI) | 0.0 [0.0, 0.0] |
| 21.5 Intervention by multidisciplinary team | 0 | 0 | Mean Difference (IV, Fixed, 95% CI) | 0.0 [0.0, 0.0] |
| 22 No use of postpartum contraception Show forest plot | 1 | 124 | Risk Ratio (M‐H, Fixed, 95% CI) | 0.41 [0.20, 0.82] |
| Analysis 4.22  Comparison 4 Home visits versus no home visits during pregnancy or after delivery (subgroups by home visitor), Outcome 22 No use of postpartum contraception. | ||||
| 22.1 Intervention by nurse | 1 | 124 | Risk Ratio (M‐H, Fixed, 95% CI) | 0.41 [0.20, 0.82] |
| 22.2 Intervention by trained social worker | 0 | 0 | Risk Ratio (M‐H, Fixed, 95% CI) | 0.0 [0.0, 0.0] |
| 22.3 Intervention by trained counsellor | 0 | 0 | Risk Ratio (M‐H, Fixed, 95% CI) | 0.0 [0.0, 0.0] |
| 22.4 Intervention by trained lay worker | 0 | 0 | Risk Ratio (M‐H, Fixed, 95% CI) | 0.0 [0.0, 0.0] |
| 22.5 Intervention by multidisciplinary team | 0 | 0 | Risk Ratio (M‐H, Fixed, 95% CI) | 0.0 [0.0, 0.0] |
| Outcome or subgroup title | No. of studies | No. of participants | Statistical method | Effect size |
| 1 Continued illicit drug use Show forest plot | 2 | 248 | Risk Ratio (M‐H, Fixed, 95% CI) | 0.95 [0.75, 1.20] |
| Analysis 5.1  Comparison 5 Home visits for pregnant substance or alcohol using women (studies with a developmental intervention), Outcome 1 Continued illicit drug use. | ||||
| 2 Continued alcohol use Show forest plot | 2 | 248 | Risk Ratio (M‐H, Fixed, 95% CI) | 1.08 [0.83, 1.41] |
| Analysis 5.2  Comparison 5 Home visits for pregnant substance or alcohol using women (studies with a developmental intervention), Outcome 2 Continued alcohol use. | ||||
| 3 Failure to enrol in drug treatment program Show forest plot | 1 | 108 | Risk Ratio (M‐H, Fixed, 95% CI) | 0.84 [0.63, 1.12] |
| Analysis 5.3  Comparison 5 Home visits for pregnant substance or alcohol using women (studies with a developmental intervention), Outcome 3 Failure to enrol in drug treatment program. | ||||
| 4 Failure to keep scheduled appointments (infant primary care) Show forest plot | 1 | 43 | Risk Ratio (M‐H, Fixed, 95% CI) | 0.84 [0.42, 1.66] |
| Analysis 5.4  Comparison 5 Home visits for pregnant substance or alcohol using women (studies with a developmental intervention), Outcome 4 Failure to keep scheduled appointments (infant primary care). | ||||
| 5 Cognitive development at latest time measured (Bayley MDI) Show forest plot | 2 | 151 | Mean Difference (IV, Fixed, 95% CI) | 3.13 [‐1.46, 7.72] |
| Analysis 5.5  Comparison 5 Home visits for pregnant substance or alcohol using women (studies with a developmental intervention), Outcome 5 Cognitive development at latest time measured (Bayley MDI). | ||||
| 6 Psychomotor development at latest time measured (Bayley PDI) Show forest plot | 2 | 151 | Mean Difference (IV, Fixed, 95% CI) | 4.14 [0.79, 7.50] |
| Analysis 5.6  Comparison 5 Home visits for pregnant substance or alcohol using women (studies with a developmental intervention), Outcome 6 Psychomotor development at latest time measured (Bayley PDI). | ||||
| 7 Behavioural problems Show forest plot | 1 | 100 | Risk Ratio (M‐H, Fixed, 95% CI) | 0.46 [0.21, 1.01] |
| Analysis 5.7  Comparison 5 Home visits for pregnant substance or alcohol using women (studies with a developmental intervention), Outcome 7 Behavioural problems. | ||||
| 8 Child Behaviour Checklist total score Show forest plot | 1 | 100 | Mean Difference (IV, Fixed, 95% CI) | ‐3.10 [‐7.26, 1.06] |
| Analysis 5.8  Comparison 5 Home visits for pregnant substance or alcohol using women (studies with a developmental intervention), Outcome 8 Child Behaviour Checklist total score. | ||||
| 9 Infant not in care of biological mother Show forest plot | 1 | 117 | Risk Ratio (M‐H, Fixed, 95% CI) | 1.04 [0.61, 1.77] |
| Analysis 5.9  Comparison 5 Home visits for pregnant substance or alcohol using women (studies with a developmental intervention), Outcome 9 Infant not in care of biological mother. | ||||
| 10 Involvement with child protective services Show forest plot | 1 | 171 | Risk Ratio (M‐H, Fixed, 95% CI) | 0.38 [0.20, 0.74] |
| Analysis 5.10  Comparison 5 Home visits for pregnant substance or alcohol using women (studies with a developmental intervention), Outcome 10 Involvement with child protective services. | ||||
| 11 Child abuse potential inventory (z score) Show forest plot | 1 | 43 | Std. Mean Difference (IV, Fixed, 95% CI) | ‐0.73 [‐1.35, ‐0.11] |
| Analysis 5.11  Comparison 5 Home visits for pregnant substance or alcohol using women (studies with a developmental intervention), Outcome 11 Child abuse potential inventory (z score). | ||||
| 12 Child domain of parenting stress index at 18 months (z score) Show forest plot | 1 | 43 | Mean Difference (IV, Fixed, 95% CI) | ‐0.5 [‐0.78, ‐0.22] |
| Analysis 5.12  Comparison 5 Home visits for pregnant substance or alcohol using women (studies with a developmental intervention), Outcome 12 Child domain of parenting stress index at 18 months (z score). | ||||
| 13 HOME score Show forest plot | 1 | 43 | Mean Difference (IV, Fixed, 95% CI) | 3.70 [‐0.06, 7.46] |
| Analysis 5.13  Comparison 5 Home visits for pregnant substance or alcohol using women (studies with a developmental intervention), Outcome 13 HOME score. | ||||
| Outcome or subgroup title | No. of studies | No. of participants | Statistical method | Effect size |
| 1 Failure to enrol in drug treatment program Show forest plot | 1 | 103 | Risk Ratio (M‐H, Random, 95% CI) | 0.22 [0.10, 0.48] |
| Analysis 6.1  Comparison 6 Home visits for pregnant substance or alcohol using women (studies of good methodology), Outcome 1 Failure to enrol in drug treatment program. | ||||
| 2 Failure to remain in drug treatment Show forest plot | 1 | Risk Ratio (M‐H, Fixed, 95% CI) | Subtotals only | |
| Analysis 6.2  Comparison 6 Home visits for pregnant substance or alcohol using women (studies of good methodology), Outcome 2 Failure to remain in drug treatment. | ||||
| 2.1 At 4 weeks | 1 | 103 | Risk Ratio (M‐H, Fixed, 95% CI) | 0.54 [0.35, 0.84] |
| 2.2 At 90 days | 1 | 103 | Risk Ratio (M‐H, Fixed, 95% CI) | 0.93 [0.69, 1.25] |
| 3 Failed to maintain feeding regime Show forest plot | 1 | 124 | Risk Ratio (M‐H, Fixed, 95% CI) | 1.0 [0.81, 1.23] |
| Analysis 6.3  Comparison 6 Home visits for pregnant substance or alcohol using women (studies of good methodology), Outcome 3 Failed to maintain feeding regime. | ||||
| 3.1 Not breastfeeding at 6 months | 1 | 124 | Risk Ratio (M‐H, Fixed, 95% CI) | 1.0 [0.81, 1.23] |
| 4 Incomplete vaccination schedule Show forest plot | 1 | 124 | Risk Ratio (M‐H, Fixed, 95% CI) | 1.07 [0.58, 1.96] |
| Analysis 6.4  Comparison 6 Home visits for pregnant substance or alcohol using women (studies of good methodology), Outcome 4 Incomplete vaccination schedule. | ||||
| 4.1 Incomplete 6 month infant vaccination schedule | 1 | 124 | Risk Ratio (M‐H, Fixed, 95% CI) | 1.07 [0.58, 1.96] |
| 5 Infant not in care of biological mother Show forest plot | 1 | 136 | Risk Ratio (M‐H, Fixed, 95% CI) | 0.18 [0.02, 1.47] |
| Analysis 6.5  Comparison 6 Home visits for pregnant substance or alcohol using women (studies of good methodology), Outcome 5 Infant not in care of biological mother. | ||||
| 6 Child abuse or neglect Show forest plot | 1 | 136 | Risk Ratio (M‐H, Fixed, 95% CI) | 0.36 [0.02, 8.77] |
| Analysis 6.6  Comparison 6 Home visits for pregnant substance or alcohol using women (studies of good methodology), Outcome 6 Child abuse or neglect. | ||||
| 6.1 Non‐accidental injury | 1 | 136 | Risk Ratio (M‐H, Fixed, 95% CI) | 0.36 [0.02, 8.77] |
| 7 Non‐accidental injury and non‐voluntary foster care Show forest plot | 1 | 136 | Risk Ratio (M‐H, Fixed, 95% CI) | 0.16 [0.02, 1.23] |
| Analysis 6.7  Comparison 6 Home visits for pregnant substance or alcohol using women (studies of good methodology), Outcome 7 Non‐accidental injury and non‐voluntary foster care. | ||||
| 8 No use of postpartum contraception Show forest plot | 1 | 124 | Risk Ratio (M‐H, Fixed, 95% CI) | 0.41 [0.20, 0.82] |
| Analysis 6.8  Comparison 6 Home visits for pregnant substance or alcohol using women (studies of good methodology), Outcome 8 No use of postpartum contraception. | ||||

Comparison 1 Home visits versus no home visits during pregnancy or after delivery (subgroups by timing of intervention), Outcome 1 Continued illicit drug use.

Comparison 1 Home visits versus no home visits during pregnancy or after delivery (subgroups by timing of intervention), Outcome 2 Continued alcohol use.

Comparison 1 Home visits versus no home visits during pregnancy or after delivery (subgroups by timing of intervention), Outcome 3 Failure to enrol in drug treatment program.

Comparison 1 Home visits versus no home visits during pregnancy or after delivery (subgroups by timing of intervention), Outcome 4 Failure to remain in drug treatment at 4 weeks.

Comparison 1 Home visits versus no home visits during pregnancy or after delivery (subgroups by timing of intervention), Outcome 5 Failure to remain in drug treatment at 90 days.

Comparison 1 Home visits versus no home visits during pregnancy or after delivery (subgroups by timing of intervention), Outcome 6 Not breastfeeding at 6 months.

Comparison 1 Home visits versus no home visits during pregnancy or after delivery (subgroups by timing of intervention), Outcome 7 Incomplete 6 month infant vaccination schedule.

Comparison 1 Home visits versus no home visits during pregnancy or after delivery (subgroups by timing of intervention), Outcome 8 Failure to keep scheduled appointments (infant primary care).
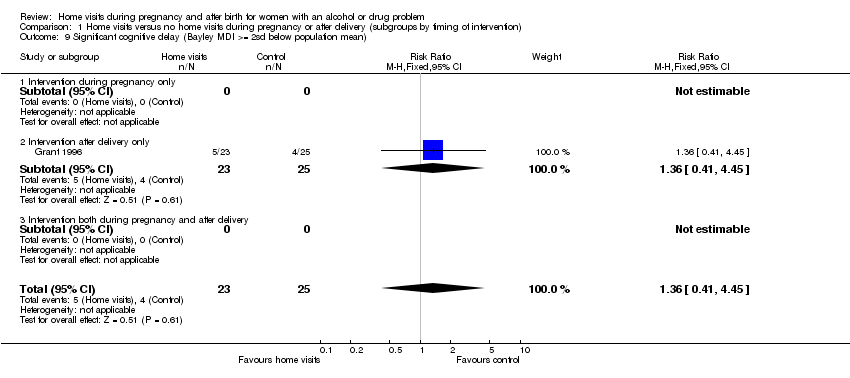
Comparison 1 Home visits versus no home visits during pregnancy or after delivery (subgroups by timing of intervention), Outcome 9 Significant cognitive delay (Bayley MDI >= 2sd below population mean).

Comparison 1 Home visits versus no home visits during pregnancy or after delivery (subgroups by timing of intervention), Outcome 10 Significant psychomotor delay (Bayley PDI >= 2sd below population mean).

Comparison 1 Home visits versus no home visits during pregnancy or after delivery (subgroups by timing of intervention), Outcome 11 Cognitive development (Bayley MDI) at latest time measured.

Comparison 1 Home visits versus no home visits during pregnancy or after delivery (subgroups by timing of intervention), Outcome 12 Psychomotor development (Bayley PDI) at latest time measured.
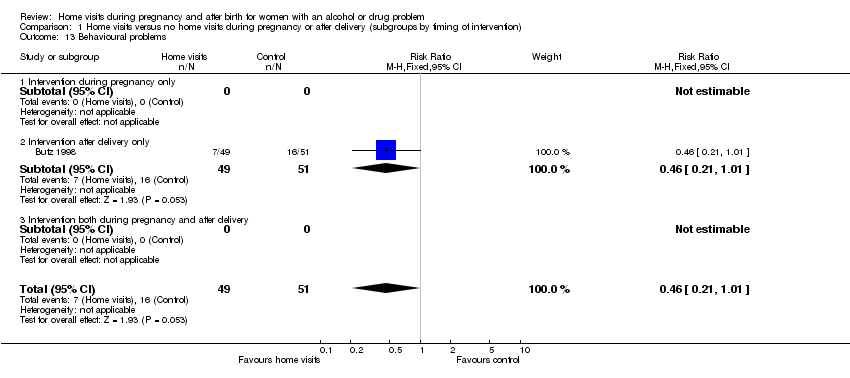
Comparison 1 Home visits versus no home visits during pregnancy or after delivery (subgroups by timing of intervention), Outcome 13 Behavioural problems.
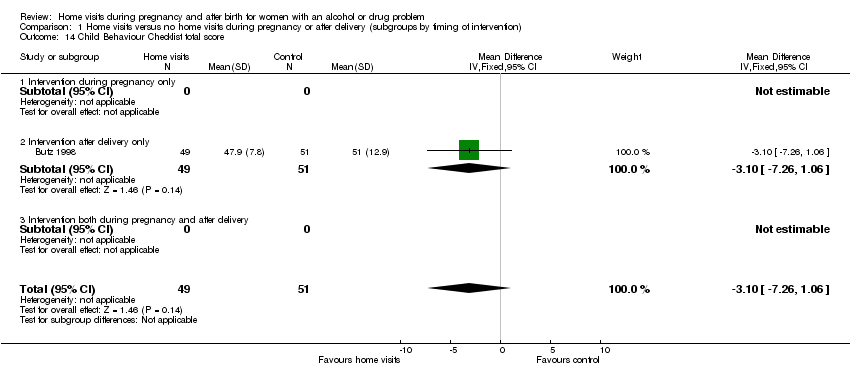
Comparison 1 Home visits versus no home visits during pregnancy or after delivery (subgroups by timing of intervention), Outcome 14 Child Behaviour Checklist total score.
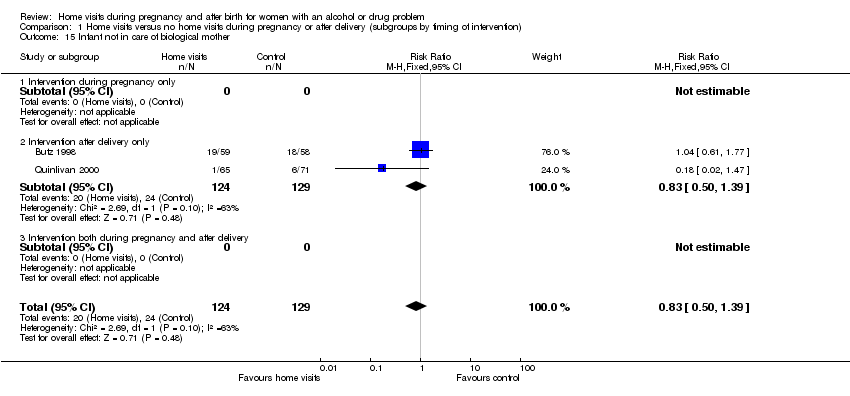
Comparison 1 Home visits versus no home visits during pregnancy or after delivery (subgroups by timing of intervention), Outcome 15 Infant not in care of biological mother.

Comparison 1 Home visits versus no home visits during pregnancy or after delivery (subgroups by timing of intervention), Outcome 16 Child abuse or neglect: non‐accidental injury.

Comparison 1 Home visits versus no home visits during pregnancy or after delivery (subgroups by timing of intervention), Outcome 17 Non‐accidental injury and non‐voluntary foster care.
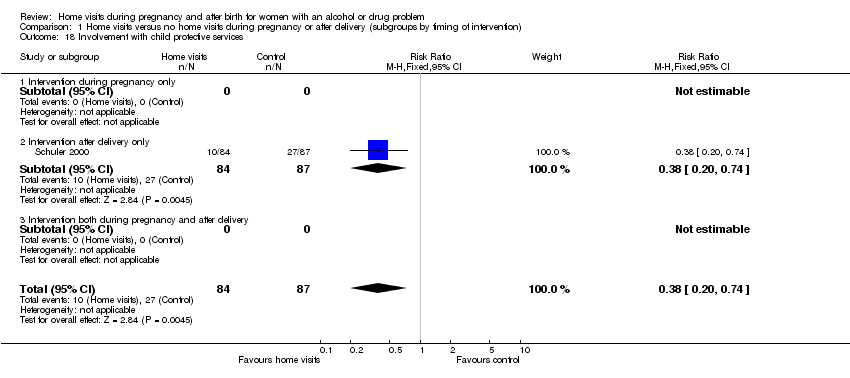
Comparison 1 Home visits versus no home visits during pregnancy or after delivery (subgroups by timing of intervention), Outcome 18 Involvement with child protective services.

Comparison 1 Home visits versus no home visits during pregnancy or after delivery (subgroups by timing of intervention), Outcome 19 Child abuse potential inventory (z score).
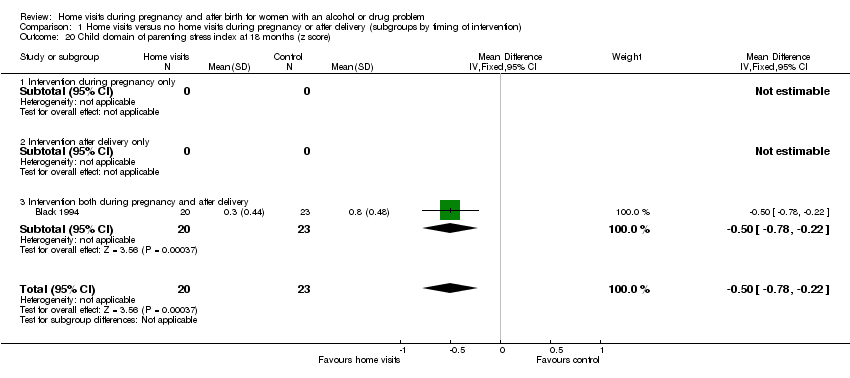
Comparison 1 Home visits versus no home visits during pregnancy or after delivery (subgroups by timing of intervention), Outcome 20 Child domain of parenting stress index at 18 months (z score).

Comparison 1 Home visits versus no home visits during pregnancy or after delivery (subgroups by timing of intervention), Outcome 21 HOME score.

Comparison 1 Home visits versus no home visits during pregnancy or after delivery (subgroups by timing of intervention), Outcome 22 No use of postpartum contraception.

Comparison 1 Home visits versus no home visits during pregnancy or after delivery (subgroups by timing of intervention), Outcome 23 Cognitive development (Bayley MDI) at latest time measured.
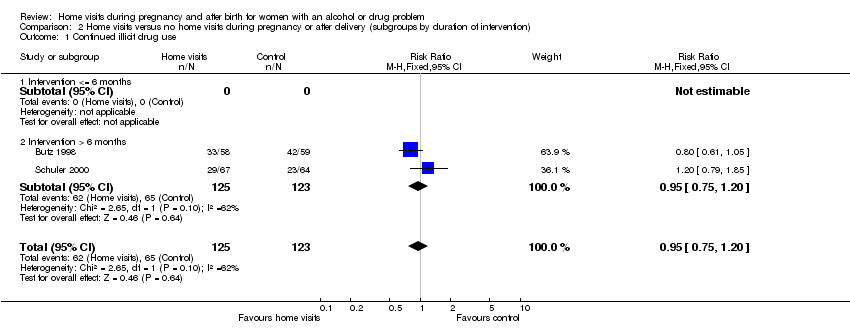
Comparison 2 Home visits versus no home visits during pregnancy or after delivery (subgroups by duration of intervention), Outcome 1 Continued illicit drug use.
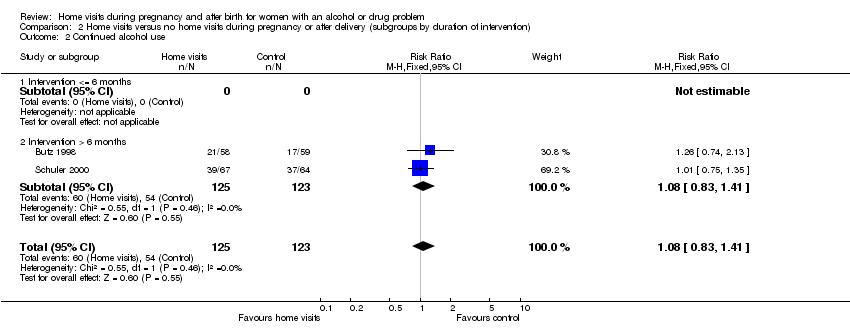
Comparison 2 Home visits versus no home visits during pregnancy or after delivery (subgroups by duration of intervention), Outcome 2 Continued alcohol use.

Comparison 2 Home visits versus no home visits during pregnancy or after delivery (subgroups by duration of intervention), Outcome 3 Failure to enrol in drug treatment program.

Comparison 2 Home visits versus no home visits during pregnancy or after delivery (subgroups by duration of intervention), Outcome 4 Failure to remain in drug treatment at 4 weeks.
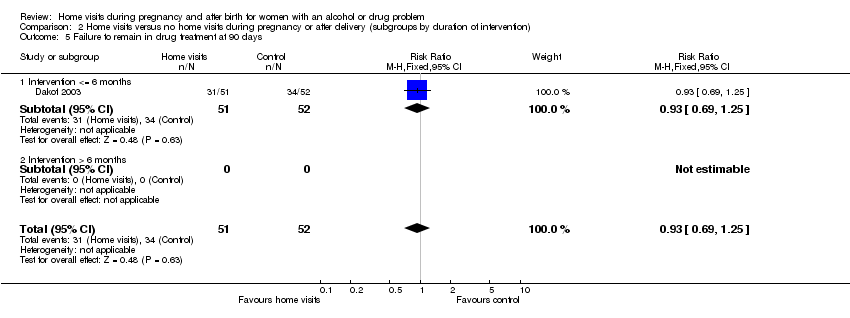
Comparison 2 Home visits versus no home visits during pregnancy or after delivery (subgroups by duration of intervention), Outcome 5 Failure to remain in drug treatment at 90 days.
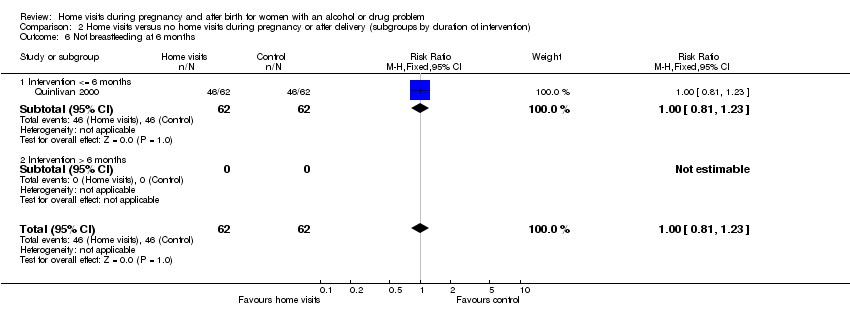
Comparison 2 Home visits versus no home visits during pregnancy or after delivery (subgroups by duration of intervention), Outcome 6 Not breastfeeding at 6 months.
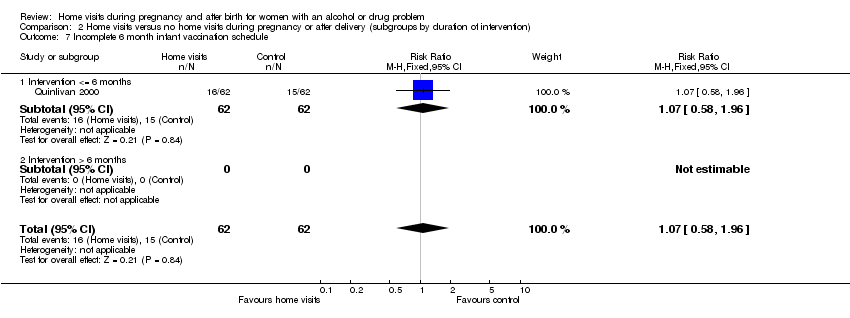
Comparison 2 Home visits versus no home visits during pregnancy or after delivery (subgroups by duration of intervention), Outcome 7 Incomplete 6 month infant vaccination schedule.

Comparison 2 Home visits versus no home visits during pregnancy or after delivery (subgroups by duration of intervention), Outcome 8 Failure to keep scheduled appointments (infant primary care).

Comparison 2 Home visits versus no home visits during pregnancy or after delivery (subgroups by duration of intervention), Outcome 9 Significant cognitive delay (Bayley MDI >= 2sd below population mean).
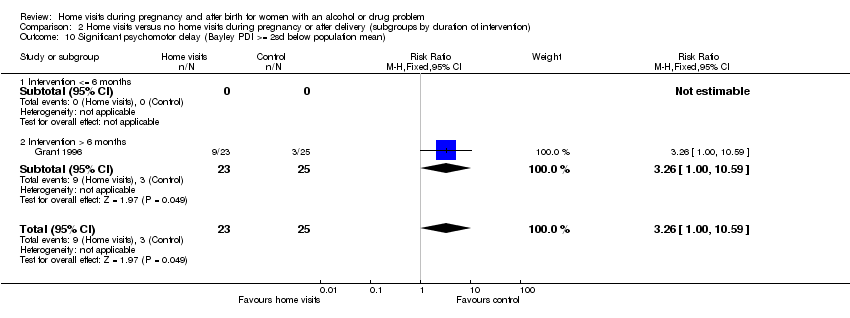
Comparison 2 Home visits versus no home visits during pregnancy or after delivery (subgroups by duration of intervention), Outcome 10 Significant psychomotor delay (Bayley PDI >= 2sd below population mean).
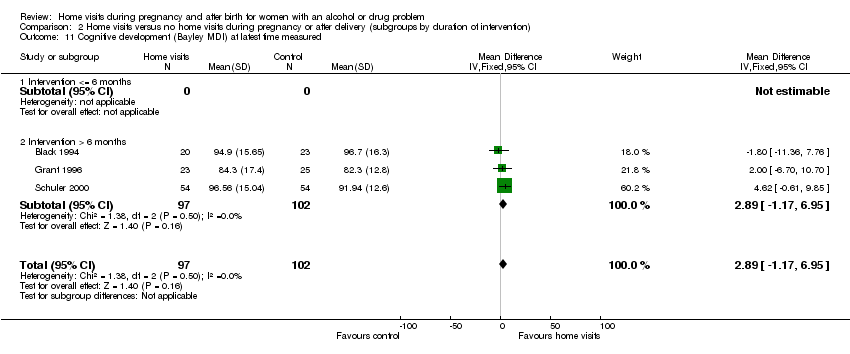
Comparison 2 Home visits versus no home visits during pregnancy or after delivery (subgroups by duration of intervention), Outcome 11 Cognitive development (Bayley MDI) at latest time measured.
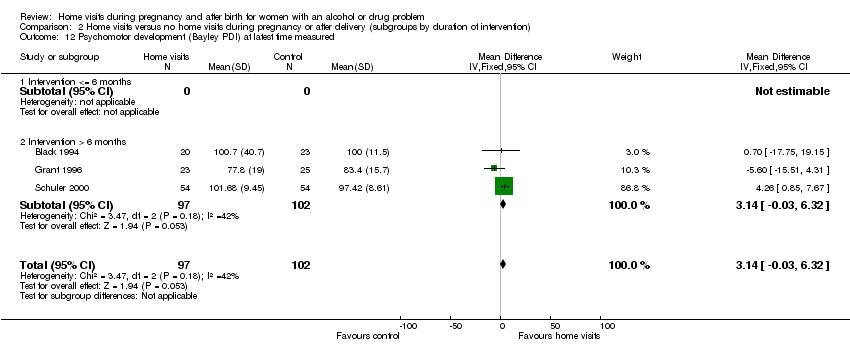
Comparison 2 Home visits versus no home visits during pregnancy or after delivery (subgroups by duration of intervention), Outcome 12 Psychomotor development (Bayley PDI) at latest time measured.

Comparison 2 Home visits versus no home visits during pregnancy or after delivery (subgroups by duration of intervention), Outcome 13 Behavioural problems.

Comparison 2 Home visits versus no home visits during pregnancy or after delivery (subgroups by duration of intervention), Outcome 14 Child Behaviour Checklist total score.

Comparison 2 Home visits versus no home visits during pregnancy or after delivery (subgroups by duration of intervention), Outcome 15 Infant not in care of biological mother.
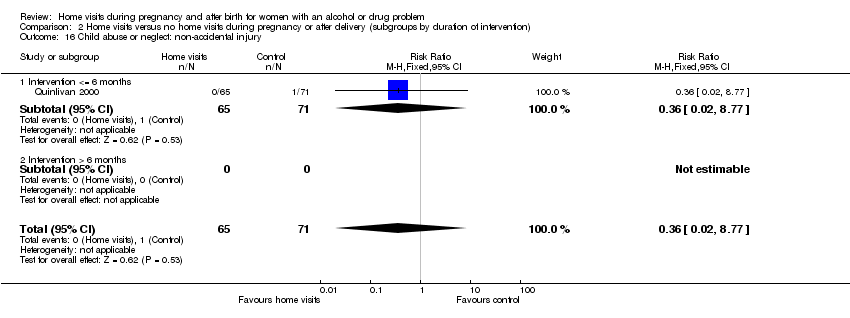
Comparison 2 Home visits versus no home visits during pregnancy or after delivery (subgroups by duration of intervention), Outcome 16 Child abuse or neglect: non‐accidental injury.

Comparison 2 Home visits versus no home visits during pregnancy or after delivery (subgroups by duration of intervention), Outcome 17 Non‐accidental injury and non‐voluntary foster care.
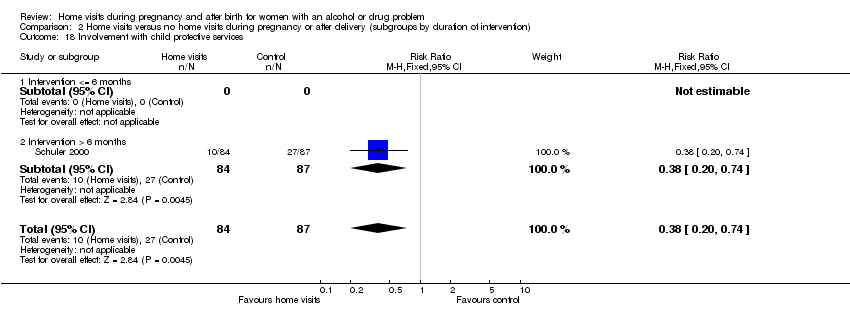
Comparison 2 Home visits versus no home visits during pregnancy or after delivery (subgroups by duration of intervention), Outcome 18 Involvement with child protective services.

Comparison 2 Home visits versus no home visits during pregnancy or after delivery (subgroups by duration of intervention), Outcome 19 Child abuse potential inventory (z score).
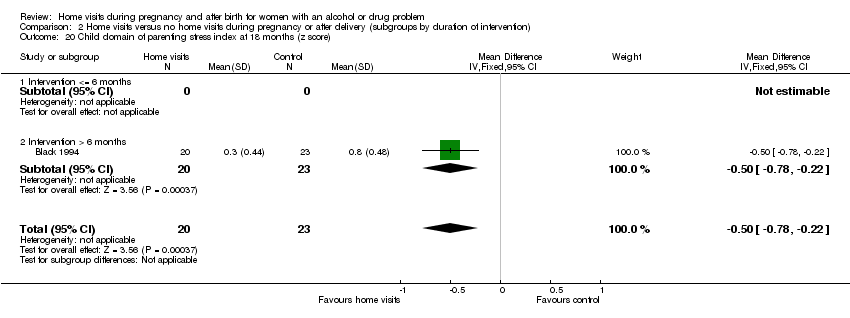
Comparison 2 Home visits versus no home visits during pregnancy or after delivery (subgroups by duration of intervention), Outcome 20 Child domain of parenting stress index at 18 months (z score).

Comparison 2 Home visits versus no home visits during pregnancy or after delivery (subgroups by duration of intervention), Outcome 21 HOME score.

Comparison 2 Home visits versus no home visits during pregnancy or after delivery (subgroups by duration of intervention), Outcome 22 No use of postpartum contraception.

Comparison 3 Home visits versus no home visits during pregnancy or after delivery (subgroups by frequency of intervention), Outcome 1 Continued illicit drug use.

Comparison 3 Home visits versus no home visits during pregnancy or after delivery (subgroups by frequency of intervention), Outcome 2 Continued alcohol use.

Comparison 3 Home visits versus no home visits during pregnancy or after delivery (subgroups by frequency of intervention), Outcome 3 Failure to enrol in drug treatment program.

Comparison 3 Home visits versus no home visits during pregnancy or after delivery (subgroups by frequency of intervention), Outcome 4 Failure to remain in drug treatment at 4 weeks.
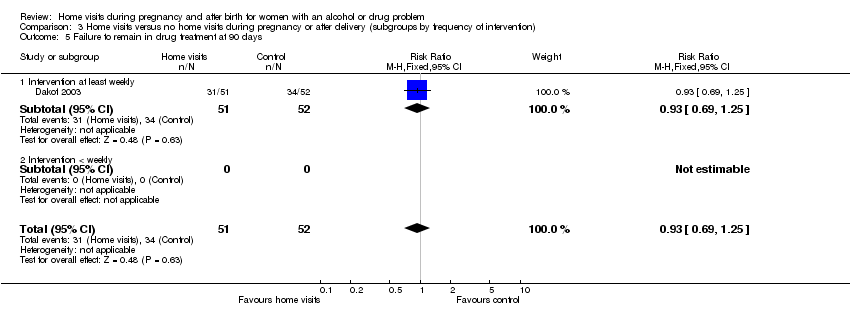
Comparison 3 Home visits versus no home visits during pregnancy or after delivery (subgroups by frequency of intervention), Outcome 5 Failure to remain in drug treatment at 90 days.
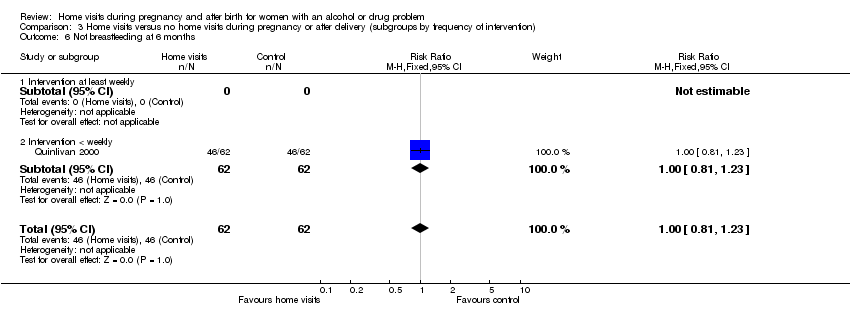
Comparison 3 Home visits versus no home visits during pregnancy or after delivery (subgroups by frequency of intervention), Outcome 6 Not breastfeeding at 6 months.

Comparison 3 Home visits versus no home visits during pregnancy or after delivery (subgroups by frequency of intervention), Outcome 7 Incomplete 6 month infant vaccination schedule.
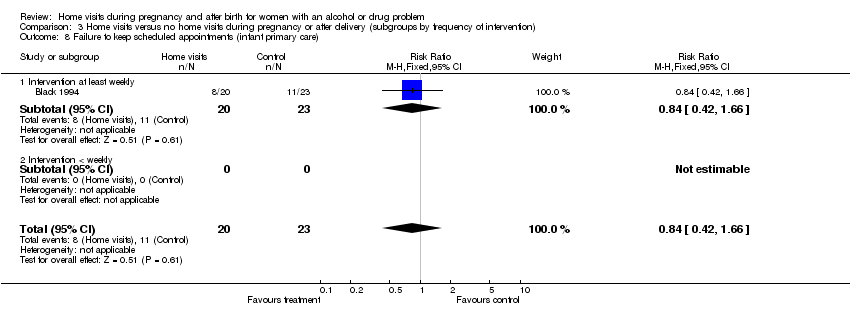
Comparison 3 Home visits versus no home visits during pregnancy or after delivery (subgroups by frequency of intervention), Outcome 8 Failure to keep scheduled appointments (infant primary care).

Comparison 3 Home visits versus no home visits during pregnancy or after delivery (subgroups by frequency of intervention), Outcome 9 Significant cognitive delay (Bayley MDI >= 2sd below population mean).

Comparison 3 Home visits versus no home visits during pregnancy or after delivery (subgroups by frequency of intervention), Outcome 10 Significant psychomotor delay (Bayley PDI >= 2sd below population mean).

Comparison 3 Home visits versus no home visits during pregnancy or after delivery (subgroups by frequency of intervention), Outcome 11 Cognitive development (Bayley MDI) at latest time measured.

Comparison 3 Home visits versus no home visits during pregnancy or after delivery (subgroups by frequency of intervention), Outcome 12 Psychomotor development (Bayley PDI) at latest time measured.
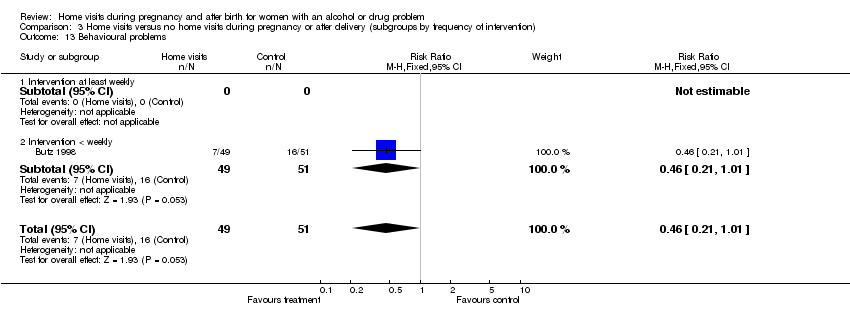
Comparison 3 Home visits versus no home visits during pregnancy or after delivery (subgroups by frequency of intervention), Outcome 13 Behavioural problems.
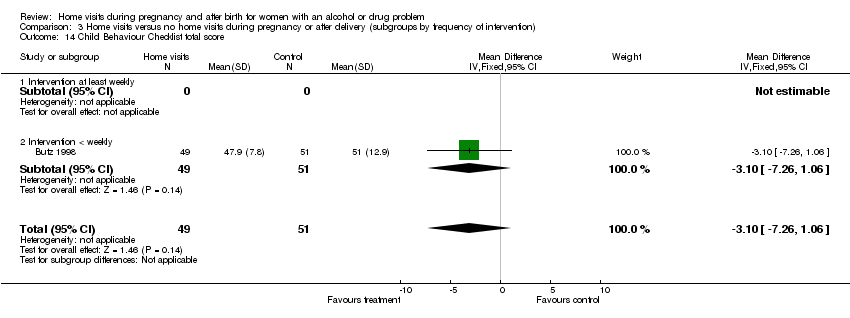
Comparison 3 Home visits versus no home visits during pregnancy or after delivery (subgroups by frequency of intervention), Outcome 14 Child Behaviour Checklist total score.
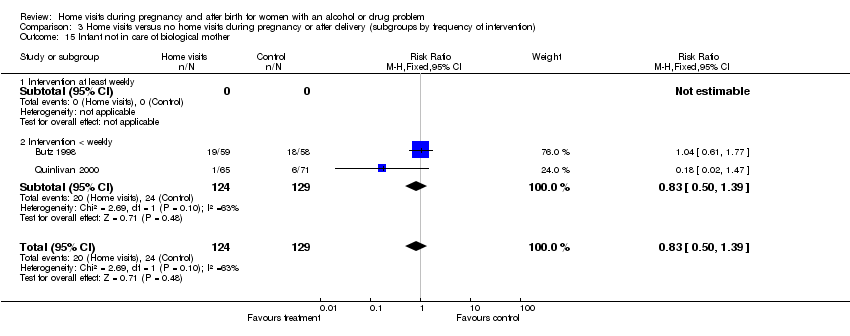
Comparison 3 Home visits versus no home visits during pregnancy or after delivery (subgroups by frequency of intervention), Outcome 15 Infant not in care of biological mother.
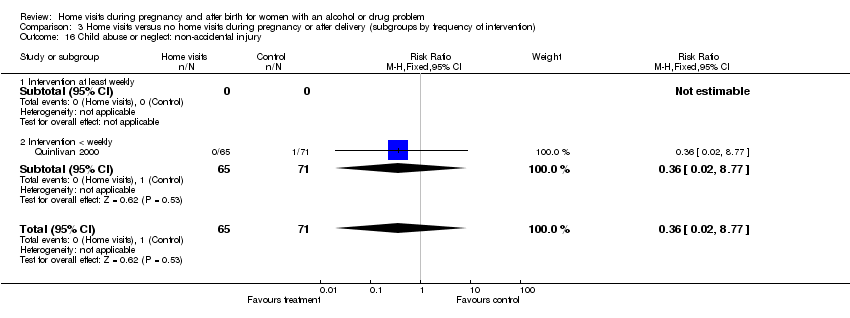
Comparison 3 Home visits versus no home visits during pregnancy or after delivery (subgroups by frequency of intervention), Outcome 16 Child abuse or neglect: non‐accidental injury.

Comparison 3 Home visits versus no home visits during pregnancy or after delivery (subgroups by frequency of intervention), Outcome 17 Non‐accidental injury and non‐voluntary foster care.

Comparison 3 Home visits versus no home visits during pregnancy or after delivery (subgroups by frequency of intervention), Outcome 18 Involvement with child protective services.

Comparison 3 Home visits versus no home visits during pregnancy or after delivery (subgroups by frequency of intervention), Outcome 19 Child abuse potential inventory (z score).
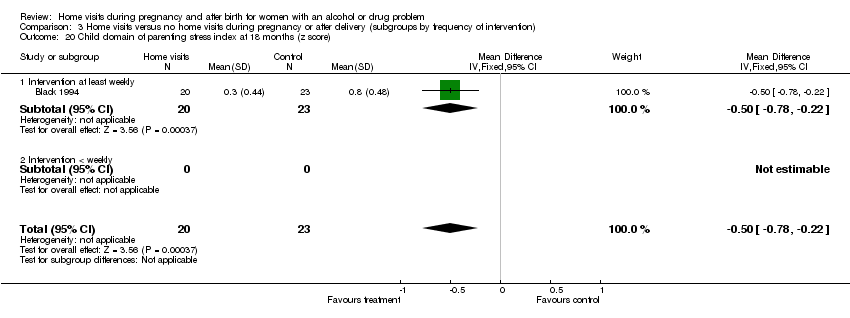
Comparison 3 Home visits versus no home visits during pregnancy or after delivery (subgroups by frequency of intervention), Outcome 20 Child domain of parenting stress index at 18 months (z score).

Comparison 3 Home visits versus no home visits during pregnancy or after delivery (subgroups by frequency of intervention), Outcome 21 HOME score.
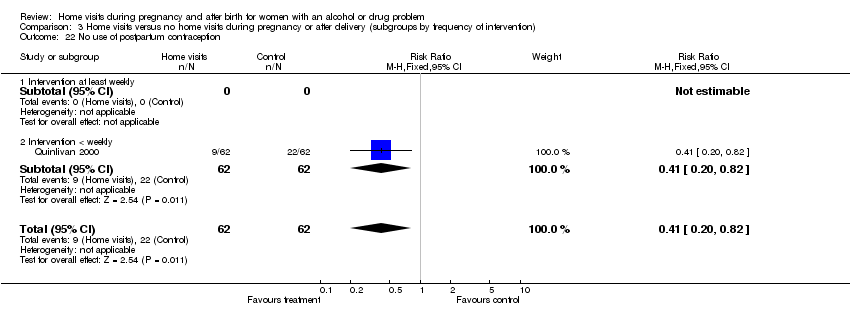
Comparison 3 Home visits versus no home visits during pregnancy or after delivery (subgroups by frequency of intervention), Outcome 22 No use of postpartum contraception.

Comparison 4 Home visits versus no home visits during pregnancy or after delivery (subgroups by home visitor), Outcome 1 Continued illicit drug use.

Comparison 4 Home visits versus no home visits during pregnancy or after delivery (subgroups by home visitor), Outcome 2 Continued alcohol use.

Comparison 4 Home visits versus no home visits during pregnancy or after delivery (subgroups by home visitor), Outcome 3 Failure to enrol in drug treatment program.

Comparison 4 Home visits versus no home visits during pregnancy or after delivery (subgroups by home visitor), Outcome 4 Failure to remain in drug treatment at 4 weeks.

Comparison 4 Home visits versus no home visits during pregnancy or after delivery (subgroups by home visitor), Outcome 5 Failure to remain in drug treatment at 90 days.

Comparison 4 Home visits versus no home visits during pregnancy or after delivery (subgroups by home visitor), Outcome 6 Not breastfeeding at 6 months.

Comparison 4 Home visits versus no home visits during pregnancy or after delivery (subgroups by home visitor), Outcome 7 Incomplete 6 month infant vaccination schedule.

Comparison 4 Home visits versus no home visits during pregnancy or after delivery (subgroups by home visitor), Outcome 8 Failure to keep scheduled appointments (infant primary care).

Comparison 4 Home visits versus no home visits during pregnancy or after delivery (subgroups by home visitor), Outcome 9 Significant cognitive delay (Bayley MDI >= 2sd below population mean).
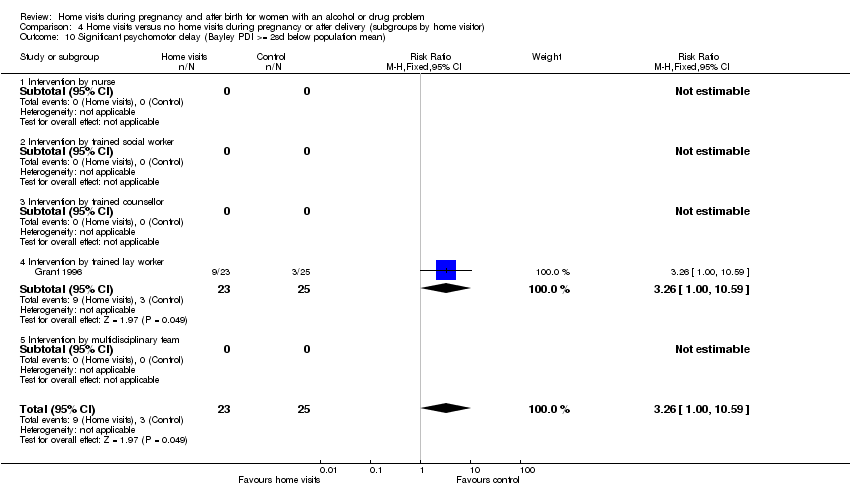
Comparison 4 Home visits versus no home visits during pregnancy or after delivery (subgroups by home visitor), Outcome 10 Significant psychomotor delay (Bayley PDI >= 2sd below population mean).

Comparison 4 Home visits versus no home visits during pregnancy or after delivery (subgroups by home visitor), Outcome 11 Cognitive development (Bayley MDI) at latest time measured.

Comparison 4 Home visits versus no home visits during pregnancy or after delivery (subgroups by home visitor), Outcome 12 Psychomotor development (Bayley PDI) at latest time measured.
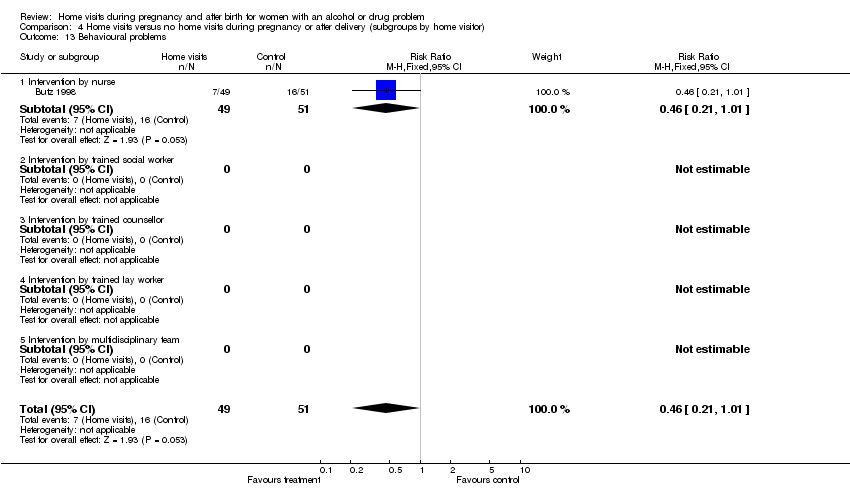
Comparison 4 Home visits versus no home visits during pregnancy or after delivery (subgroups by home visitor), Outcome 13 Behavioural problems.

Comparison 4 Home visits versus no home visits during pregnancy or after delivery (subgroups by home visitor), Outcome 14 Child Behaviour Checklist total score.

Comparison 4 Home visits versus no home visits during pregnancy or after delivery (subgroups by home visitor), Outcome 15 Infant not in care of biological mother.
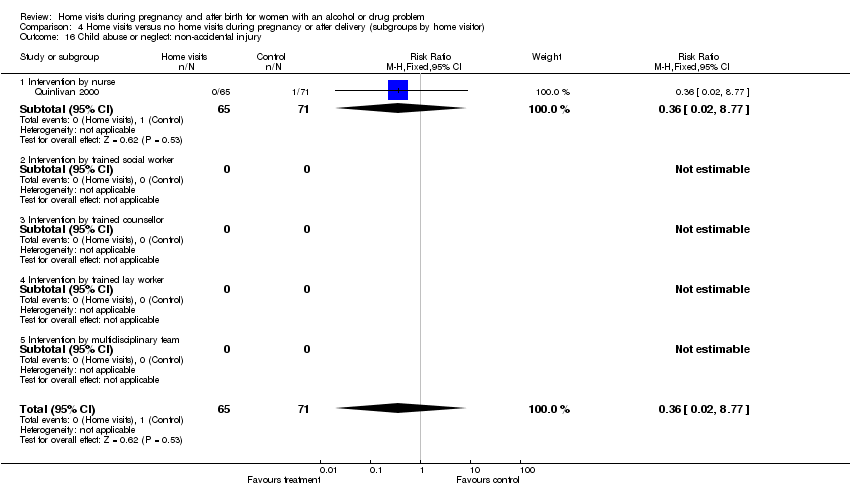
Comparison 4 Home visits versus no home visits during pregnancy or after delivery (subgroups by home visitor), Outcome 16 Child abuse or neglect: non‐accidental injury.

Comparison 4 Home visits versus no home visits during pregnancy or after delivery (subgroups by home visitor), Outcome 17 Non‐accidental injury and non‐voluntary foster care.

Comparison 4 Home visits versus no home visits during pregnancy or after delivery (subgroups by home visitor), Outcome 18 Involvement with child protective services.

Comparison 4 Home visits versus no home visits during pregnancy or after delivery (subgroups by home visitor), Outcome 19 Child abuse potential inventory (z score).
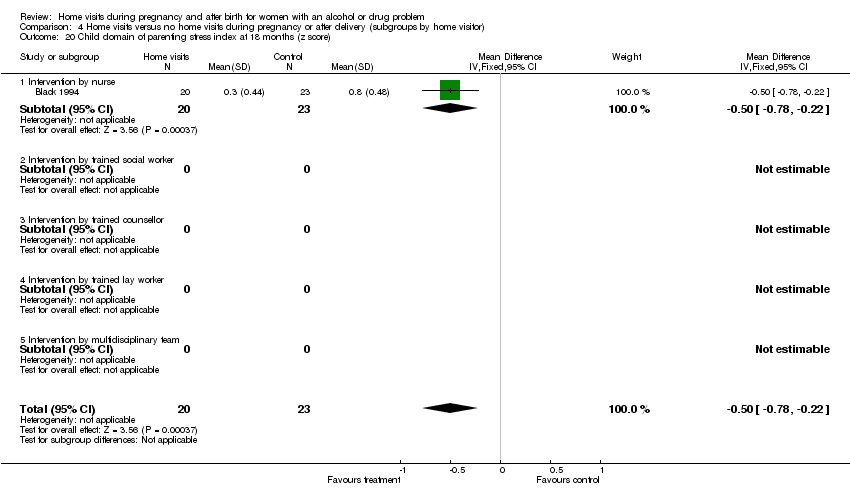
Comparison 4 Home visits versus no home visits during pregnancy or after delivery (subgroups by home visitor), Outcome 20 Child domain of parenting stress index at 18 months (z score).

Comparison 4 Home visits versus no home visits during pregnancy or after delivery (subgroups by home visitor), Outcome 21 HOME score.
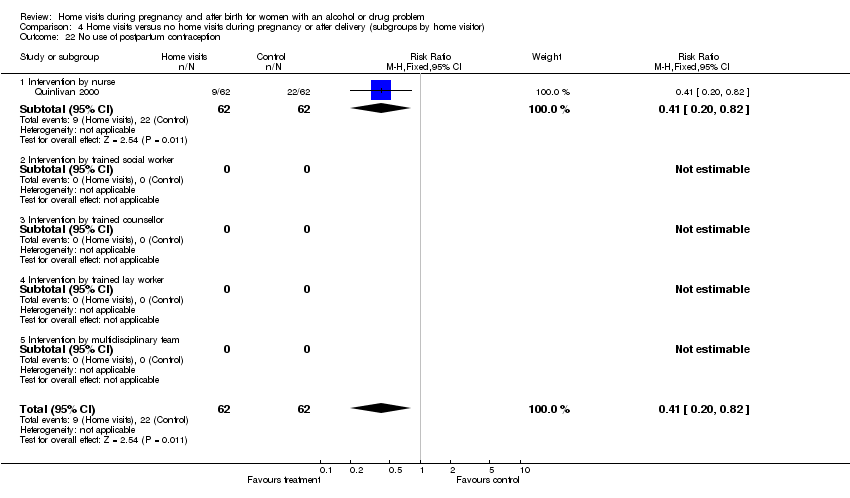
Comparison 4 Home visits versus no home visits during pregnancy or after delivery (subgroups by home visitor), Outcome 22 No use of postpartum contraception.
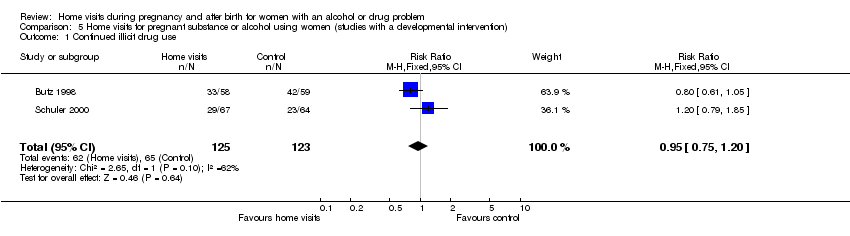
Comparison 5 Home visits for pregnant substance or alcohol using women (studies with a developmental intervention), Outcome 1 Continued illicit drug use.
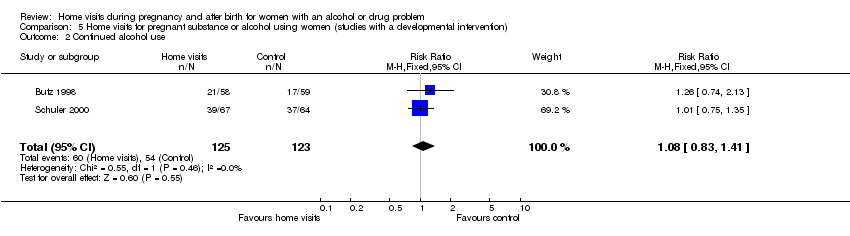
Comparison 5 Home visits for pregnant substance or alcohol using women (studies with a developmental intervention), Outcome 2 Continued alcohol use.

Comparison 5 Home visits for pregnant substance or alcohol using women (studies with a developmental intervention), Outcome 3 Failure to enrol in drug treatment program.

Comparison 5 Home visits for pregnant substance or alcohol using women (studies with a developmental intervention), Outcome 4 Failure to keep scheduled appointments (infant primary care).
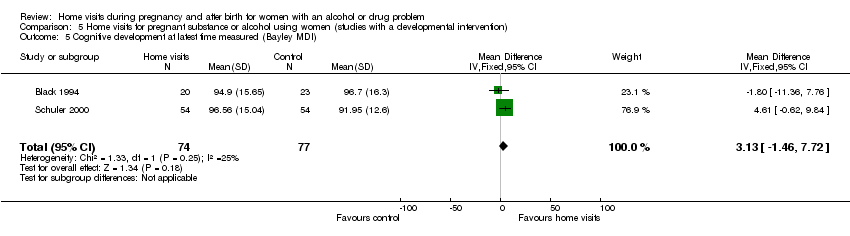
Comparison 5 Home visits for pregnant substance or alcohol using women (studies with a developmental intervention), Outcome 5 Cognitive development at latest time measured (Bayley MDI).

Comparison 5 Home visits for pregnant substance or alcohol using women (studies with a developmental intervention), Outcome 6 Psychomotor development at latest time measured (Bayley PDI).
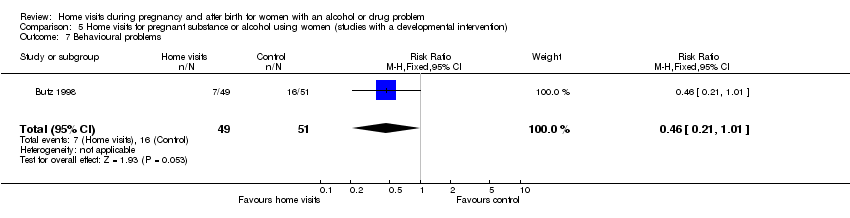
Comparison 5 Home visits for pregnant substance or alcohol using women (studies with a developmental intervention), Outcome 7 Behavioural problems.

Comparison 5 Home visits for pregnant substance or alcohol using women (studies with a developmental intervention), Outcome 8 Child Behaviour Checklist total score.

Comparison 5 Home visits for pregnant substance or alcohol using women (studies with a developmental intervention), Outcome 9 Infant not in care of biological mother.
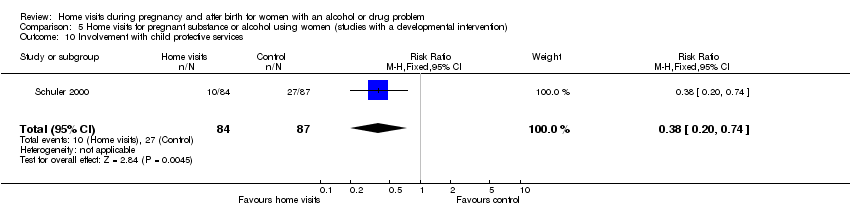
Comparison 5 Home visits for pregnant substance or alcohol using women (studies with a developmental intervention), Outcome 10 Involvement with child protective services.

Comparison 5 Home visits for pregnant substance or alcohol using women (studies with a developmental intervention), Outcome 11 Child abuse potential inventory (z score).
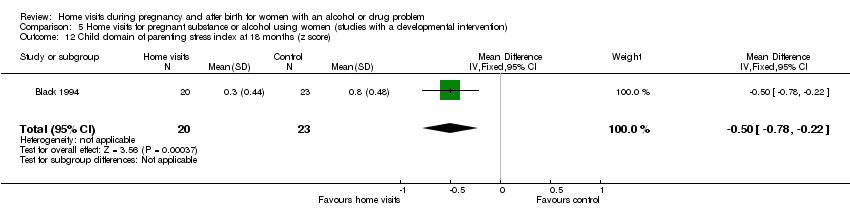
Comparison 5 Home visits for pregnant substance or alcohol using women (studies with a developmental intervention), Outcome 12 Child domain of parenting stress index at 18 months (z score).

Comparison 5 Home visits for pregnant substance or alcohol using women (studies with a developmental intervention), Outcome 13 HOME score.
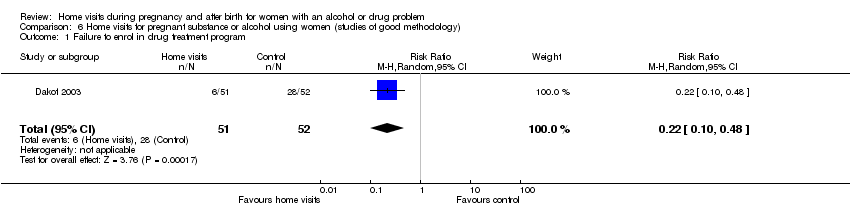
Comparison 6 Home visits for pregnant substance or alcohol using women (studies of good methodology), Outcome 1 Failure to enrol in drug treatment program.

Comparison 6 Home visits for pregnant substance or alcohol using women (studies of good methodology), Outcome 2 Failure to remain in drug treatment.
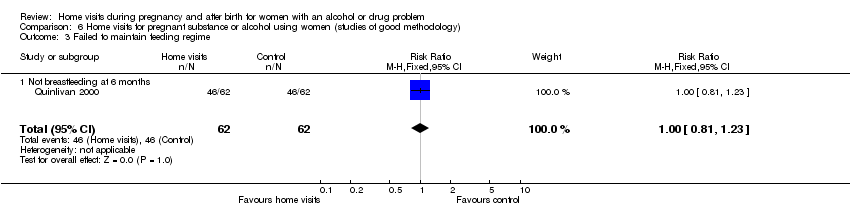
Comparison 6 Home visits for pregnant substance or alcohol using women (studies of good methodology), Outcome 3 Failed to maintain feeding regime.

Comparison 6 Home visits for pregnant substance or alcohol using women (studies of good methodology), Outcome 4 Incomplete vaccination schedule.

Comparison 6 Home visits for pregnant substance or alcohol using women (studies of good methodology), Outcome 5 Infant not in care of biological mother.

Comparison 6 Home visits for pregnant substance or alcohol using women (studies of good methodology), Outcome 6 Child abuse or neglect.

Comparison 6 Home visits for pregnant substance or alcohol using women (studies of good methodology), Outcome 7 Non‐accidental injury and non‐voluntary foster care.

Comparison 6 Home visits for pregnant substance or alcohol using women (studies of good methodology), Outcome 8 No use of postpartum contraception.
| Outcome or subgroup title | No. of studies | No. of participants | Statistical method | Effect size |
| 1 Continued illicit drug use Show forest plot | 2 | 248 | Risk Ratio (M‐H, Fixed, 95% CI) | 0.95 [0.75, 1.20] |
| 1.1 Intervention during pregnancy only | 0 | 0 | Risk Ratio (M‐H, Fixed, 95% CI) | 0.0 [0.0, 0.0] |
| 1.2 Intervention after delivery only | 2 | 248 | Risk Ratio (M‐H, Fixed, 95% CI) | 0.95 [0.75, 1.20] |
| 1.3 Intervention both during pregnancy and after delivery | 0 | 0 | Risk Ratio (M‐H, Fixed, 95% CI) | 0.0 [0.0, 0.0] |
| 2 Continued alcohol use Show forest plot | 2 | 248 | Risk Ratio (M‐H, Fixed, 95% CI) | 1.08 [0.83, 1.41] |
| 2.1 Intervention during pregnancy only | 0 | 0 | Risk Ratio (M‐H, Fixed, 95% CI) | 0.0 [0.0, 0.0] |
| 2.2 Intervention after delivery only | 2 | 248 | Risk Ratio (M‐H, Fixed, 95% CI) | 1.08 [0.83, 1.41] |
| 2.3 Intervention both during pregnancy and after delivery | 0 | 0 | Risk Ratio (M‐H, Fixed, 95% CI) | 0.0 [0.0, 0.0] |
| 3 Failure to enrol in drug treatment program Show forest plot | 2 | 211 | Risk Ratio (M‐H, Random, 95% CI) | 0.45 [0.10, 1.94] |
| 3.1 Intervention during pregnancy only | 0 | 0 | Risk Ratio (M‐H, Random, 95% CI) | 0.0 [0.0, 0.0] |
| 3.2 Intervention after delivery only | 2 | 211 | Risk Ratio (M‐H, Random, 95% CI) | 0.45 [0.10, 1.94] |
| 3.3 Intervention both during pregnancy and after delivery | 0 | 0 | Risk Ratio (M‐H, Random, 95% CI) | 0.0 [0.0, 0.0] |
| 4 Failure to remain in drug treatment at 4 weeks Show forest plot | 1 | 103 | Risk Ratio (M‐H, Fixed, 95% CI) | 0.54 [0.35, 0.84] |
| 4.1 Intervention during pregnancy only | 0 | 0 | Risk Ratio (M‐H, Fixed, 95% CI) | 0.0 [0.0, 0.0] |
| 4.2 Intervention after delivery only | 1 | 103 | Risk Ratio (M‐H, Fixed, 95% CI) | 0.54 [0.35, 0.84] |
| 4.3 Intervention both during pregnancy and after delivery | 0 | 0 | Risk Ratio (M‐H, Fixed, 95% CI) | 0.0 [0.0, 0.0] |
| 5 Failure to remain in drug treatment at 90 days Show forest plot | 1 | 103 | Risk Ratio (M‐H, Fixed, 95% CI) | 0.93 [0.69, 1.25] |
| 5.1 Intervention during pregnancy only | 0 | 0 | Risk Ratio (M‐H, Fixed, 95% CI) | 0.0 [0.0, 0.0] |
| 5.2 Intervention after delivery only | 1 | 103 | Risk Ratio (M‐H, Fixed, 95% CI) | 0.93 [0.69, 1.25] |
| 5.3 Intervention both during pregnancy and after delivery | 0 | 0 | Risk Ratio (M‐H, Fixed, 95% CI) | 0.0 [0.0, 0.0] |
| 6 Not breastfeeding at 6 months Show forest plot | 1 | 124 | Risk Ratio (M‐H, Fixed, 95% CI) | 1.0 [0.81, 1.23] |
| 6.1 Intervention during pregnancy only | 0 | 0 | Risk Ratio (M‐H, Fixed, 95% CI) | 0.0 [0.0, 0.0] |
| 6.2 Intervention after delivery only | 1 | 124 | Risk Ratio (M‐H, Fixed, 95% CI) | 1.0 [0.81, 1.23] |
| 6.3 Intervention both during pregnancy and after delivery | 0 | 0 | Risk Ratio (M‐H, Fixed, 95% CI) | 0.0 [0.0, 0.0] |
| 7 Incomplete 6 month infant vaccination schedule Show forest plot | 1 | 124 | Risk Ratio (M‐H, Fixed, 95% CI) | 1.07 [0.58, 1.96] |
| 7.1 Intervention during pregnancy only | 0 | 0 | Risk Ratio (M‐H, Fixed, 95% CI) | 0.0 [0.0, 0.0] |
| 7.2 Intervention after delivery only | 1 | 124 | Risk Ratio (M‐H, Fixed, 95% CI) | 1.07 [0.58, 1.96] |
| 7.3 Intervention both during pregnancy and after delivery | 0 | 0 | Risk Ratio (M‐H, Fixed, 95% CI) | 0.0 [0.0, 0.0] |
| 8 Failure to keep scheduled appointments (infant primary care) Show forest plot | 1 | 43 | Risk Ratio (M‐H, Fixed, 95% CI) | 0.84 [0.42, 1.66] |
| 8.1 Intervention during pregnancy only | 0 | 0 | Risk Ratio (M‐H, Fixed, 95% CI) | 0.0 [0.0, 0.0] |
| 8.2 Intervention after delivery only | 0 | 0 | Risk Ratio (M‐H, Fixed, 95% CI) | 0.0 [0.0, 0.0] |
| 8.3 Intervention both during pregnancy and after delivery | 1 | 43 | Risk Ratio (M‐H, Fixed, 95% CI) | 0.84 [0.42, 1.66] |
| 9 Significant cognitive delay (Bayley MDI >= 2sd below population mean) Show forest plot | 1 | 48 | Risk Ratio (M‐H, Fixed, 95% CI) | 1.36 [0.41, 4.45] |
| 9.1 Intervention during pregnancy only | 0 | 0 | Risk Ratio (M‐H, Fixed, 95% CI) | 0.0 [0.0, 0.0] |
| 9.2 Intervention after delivery only | 1 | 48 | Risk Ratio (M‐H, Fixed, 95% CI) | 1.36 [0.41, 4.45] |
| 9.3 Intervention both during pregnancy and after delivery | 0 | 0 | Risk Ratio (M‐H, Fixed, 95% CI) | 0.0 [0.0, 0.0] |
| 10 Significant psychomotor delay (Bayley PDI >= 2sd below population mean) Show forest plot | 1 | 48 | Risk Ratio (M‐H, Fixed, 95% CI) | 3.26 [1.00, 10.59] |
| 10.1 Intervention during pregnancy only | 0 | 0 | Risk Ratio (M‐H, Fixed, 95% CI) | 0.0 [0.0, 0.0] |
| 10.2 Intervention after delivery only | 1 | 48 | Risk Ratio (M‐H, Fixed, 95% CI) | 3.26 [1.00, 10.59] |
| 10.3 Intervention both during pregnancy and after delivery | 0 | 0 | Risk Ratio (M‐H, Fixed, 95% CI) | 0.0 [0.0, 0.0] |
| 11 Cognitive development (Bayley MDI) at latest time measured Show forest plot | 3 | 199 | Mean Difference (IV, Fixed, 95% CI) | 2.89 [‐1.17, 6.95] |
| 11.1 Intervention during pregnancy only | 0 | 0 | Mean Difference (IV, Fixed, 95% CI) | 0.0 [0.0, 0.0] |
| 11.2 Intervention after delivery only | 2 | 156 | Mean Difference (IV, Fixed, 95% CI) | 3.92 [‐0.56, 8.41] |
| 11.3 Intervention both during pregnancy and after delivery | 1 | 43 | Mean Difference (IV, Fixed, 95% CI) | ‐1.80 [‐11.36, 7.76] |
| 12 Psychomotor development (Bayley PDI) at latest time measured Show forest plot | 3 | 199 | Mean Difference (IV, Fixed, 95% CI) | 3.14 [‐0.03, 6.32] |
| 12.1 Intervention during pregnancy only | 0 | 0 | Mean Difference (IV, Fixed, 95% CI) | 0.0 [0.0, 0.0] |
| 12.2 Intervention after delivery only | 2 | 156 | Mean Difference (IV, Fixed, 95% CI) | 3.22 [‐0.01, 6.44] |
| 12.3 Intervention both during pregnancy and after delivery | 1 | 43 | Mean Difference (IV, Fixed, 95% CI) | 0.70 [‐17.75, 19.15] |
| 13 Behavioural problems Show forest plot | 1 | 100 | Risk Ratio (M‐H, Fixed, 95% CI) | 0.46 [0.21, 1.01] |
| 13.1 Intervention during pregnancy only | 0 | 0 | Risk Ratio (M‐H, Fixed, 95% CI) | 0.0 [0.0, 0.0] |
| 13.2 Intervention after delivery only | 1 | 100 | Risk Ratio (M‐H, Fixed, 95% CI) | 0.46 [0.21, 1.01] |
| 13.3 Intervention both during pregnancy and after delivery | 0 | 0 | Risk Ratio (M‐H, Fixed, 95% CI) | 0.0 [0.0, 0.0] |
| 14 Child Behaviour Checklist total score Show forest plot | 1 | 100 | Mean Difference (IV, Fixed, 95% CI) | ‐3.10 [‐7.26, 1.06] |
| 14.1 Intervention during pregnancy only | 0 | 0 | Mean Difference (IV, Fixed, 95% CI) | 0.0 [0.0, 0.0] |
| 14.2 Intervention after delivery only | 1 | 100 | Mean Difference (IV, Fixed, 95% CI) | ‐3.10 [‐7.26, 1.06] |
| 14.3 Intervention both during pregnancy and after delivery | 0 | 0 | Mean Difference (IV, Fixed, 95% CI) | 0.0 [0.0, 0.0] |
| 15 Infant not in care of biological mother Show forest plot | 2 | 253 | Risk Ratio (M‐H, Fixed, 95% CI) | 0.83 [0.50, 1.39] |
| 15.1 Intervention during pregnancy only | 0 | 0 | Risk Ratio (M‐H, Fixed, 95% CI) | 0.0 [0.0, 0.0] |
| 15.2 Intervention after delivery only | 2 | 253 | Risk Ratio (M‐H, Fixed, 95% CI) | 0.83 [0.50, 1.39] |
| 15.3 Intervention both during pregnancy and after delivery | 0 | 0 | Risk Ratio (M‐H, Fixed, 95% CI) | 0.0 [0.0, 0.0] |
| 16 Child abuse or neglect: non‐accidental injury Show forest plot | 1 | 136 | Risk Ratio (M‐H, Fixed, 95% CI) | 0.36 [0.02, 8.77] |
| 16.1 Intervention during pregnancy only | 0 | 0 | Risk Ratio (M‐H, Fixed, 95% CI) | 0.0 [0.0, 0.0] |
| 16.2 Intervention after delivery only | 1 | 136 | Risk Ratio (M‐H, Fixed, 95% CI) | 0.36 [0.02, 8.77] |
| 16.3 Intervention both during pregnancy and after delivery | 0 | 0 | Risk Ratio (M‐H, Fixed, 95% CI) | 0.0 [0.0, 0.0] |
| 17 Non‐accidental injury and non‐voluntary foster care Show forest plot | 1 | 136 | Risk Ratio (M‐H, Fixed, 95% CI) | 0.16 [0.02, 1.23] |
| 17.1 Intervention during pregnancy only | 0 | 0 | Risk Ratio (M‐H, Fixed, 95% CI) | 0.0 [0.0, 0.0] |
| 17.2 Intervention after delivery only | 1 | 136 | Risk Ratio (M‐H, Fixed, 95% CI) | 0.16 [0.02, 1.23] |
| 17.3 Intervention both during pregnancy and after delivery | 0 | 0 | Risk Ratio (M‐H, Fixed, 95% CI) | 0.0 [0.0, 0.0] |
| 18 Involvement with child protective services Show forest plot | 1 | 171 | Risk Ratio (M‐H, Fixed, 95% CI) | 0.38 [0.20, 0.74] |
| 18.1 Intervention during pregnancy only | 0 | 0 | Risk Ratio (M‐H, Fixed, 95% CI) | 0.0 [0.0, 0.0] |
| 18.2 Intervention after delivery only | 1 | 171 | Risk Ratio (M‐H, Fixed, 95% CI) | 0.38 [0.20, 0.74] |
| 18.3 Intervention both during pregnancy and after delivery | 0 | 0 | Risk Ratio (M‐H, Fixed, 95% CI) | 0.0 [0.0, 0.0] |
| 19 Child abuse potential inventory (z score) Show forest plot | 1 | 43 | Mean Difference (IV, Fixed, 95% CI) | ‐0.90 [‐1.61, ‐0.19] |
| 19.1 Intervention during pregnancy only | 0 | 0 | Mean Difference (IV, Fixed, 95% CI) | 0.0 [0.0, 0.0] |
| 19.2 Intervention after delivery only | 0 | 0 | Mean Difference (IV, Fixed, 95% CI) | 0.0 [0.0, 0.0] |
| 19.3 Intervention both during pregnancy and after delivery | 1 | 43 | Mean Difference (IV, Fixed, 95% CI) | ‐0.90 [‐1.61, ‐0.19] |
| 20 Child domain of parenting stress index at 18 months (z score) Show forest plot | 1 | 43 | Mean Difference (IV, Fixed, 95% CI) | ‐0.5 [‐0.78, ‐0.22] |
| 20.1 Intervention during pregnancy only | 0 | 0 | Mean Difference (IV, Fixed, 95% CI) | 0.0 [0.0, 0.0] |
| 20.2 Intervention after delivery only | 0 | 0 | Mean Difference (IV, Fixed, 95% CI) | 0.0 [0.0, 0.0] |
| 20.3 Intervention both during pregnancy and after delivery | 1 | 43 | Mean Difference (IV, Fixed, 95% CI) | ‐0.5 [‐0.78, ‐0.22] |
| 21 HOME score Show forest plot | 1 | 43 | Mean Difference (IV, Fixed, 95% CI) | 3.70 [‐0.06, 7.46] |
| 21.1 Intervention during pregnancy only | 0 | 0 | Mean Difference (IV, Fixed, 95% CI) | 0.0 [0.0, 0.0] |
| 21.2 Intervention after delivery only | 0 | 0 | Mean Difference (IV, Fixed, 95% CI) | 0.0 [0.0, 0.0] |
| 21.3 Intervention both during pregnancy and after delivery | 1 | 43 | Mean Difference (IV, Fixed, 95% CI) | 3.70 [‐0.06, 7.46] |
| 22 No use of postpartum contraception Show forest plot | 1 | 124 | Risk Ratio (M‐H, Fixed, 95% CI) | 0.41 [0.20, 0.82] |
| 22.1 Intervention during pregnancy only | 0 | 0 | Risk Ratio (M‐H, Fixed, 95% CI) | 0.0 [0.0, 0.0] |
| 22.2 Intervention after delivery only | 1 | 124 | Risk Ratio (M‐H, Fixed, 95% CI) | 0.41 [0.20, 0.82] |
| 22.3 Intervention both during pregnancy and after delivery | 0 | 0 | Risk Ratio (M‐H, Fixed, 95% CI) | 0.0 [0.0, 0.0] |
| 23 Cognitive development (Bayley MDI) at latest time measured Show forest plot | 1 | 108 | Mean Difference (IV, Fixed, 95% CI) | 4.42 [‐0.82, 9.65] |
| 23.4 Infants of mothers with no ongoing drug use (intervention after birth only) | 1 | 36 | Mean Difference (IV, Fixed, 95% CI) | 13.0 [3.39, 22.61] |
| 23.5 Infants of mothers with ongoing drug use (intervention after birth only) | 1 | 72 | Mean Difference (IV, Fixed, 95% CI) | 0.80 [‐5.44, 7.04] |
| Outcome or subgroup title | No. of studies | No. of participants | Statistical method | Effect size |
| 1 Continued illicit drug use Show forest plot | 2 | 248 | Risk Ratio (M‐H, Fixed, 95% CI) | 0.95 [0.75, 1.20] |
| 1.1 Intervention <= 6 months | 0 | 0 | Risk Ratio (M‐H, Fixed, 95% CI) | 0.0 [0.0, 0.0] |
| 1.2 Intervention > 6 months | 2 | 248 | Risk Ratio (M‐H, Fixed, 95% CI) | 0.95 [0.75, 1.20] |
| 2 Continued alcohol use Show forest plot | 2 | 248 | Risk Ratio (M‐H, Fixed, 95% CI) | 1.08 [0.83, 1.41] |
| 2.1 Intervention <= 6 months | 0 | 0 | Risk Ratio (M‐H, Fixed, 95% CI) | 0.0 [0.0, 0.0] |
| 2.2 Intervention > 6 months | 2 | 248 | Risk Ratio (M‐H, Fixed, 95% CI) | 1.08 [0.83, 1.41] |
| 3 Failure to enrol in drug treatment program Show forest plot | 2 | 211 | Risk Ratio (M‐H, Random, 95% CI) | 0.45 [0.10, 1.94] |
| 3.1 Intervention <= 6 months | 1 | 103 | Risk Ratio (M‐H, Random, 95% CI) | 0.22 [0.10, 0.48] |
| 3.2 Intervention > 6 months | 1 | 108 | Risk Ratio (M‐H, Random, 95% CI) | 0.84 [0.63, 1.12] |
| 4 Failure to remain in drug treatment at 4 weeks Show forest plot | 1 | 103 | Risk Ratio (M‐H, Fixed, 95% CI) | 0.54 [0.35, 0.84] |
| 4.1 Intervention <= 6 months | 1 | 103 | Risk Ratio (M‐H, Fixed, 95% CI) | 0.54 [0.35, 0.84] |
| 4.2 Intervention > 6 months | 0 | 0 | Risk Ratio (M‐H, Fixed, 95% CI) | 0.0 [0.0, 0.0] |
| 5 Failure to remain in drug treatment at 90 days Show forest plot | 1 | 103 | Risk Ratio (M‐H, Fixed, 95% CI) | 0.93 [0.69, 1.25] |
| 5.1 Intervention <= 6 months | 1 | 103 | Risk Ratio (M‐H, Fixed, 95% CI) | 0.93 [0.69, 1.25] |
| 5.2 Intervention > 6 months | 0 | 0 | Risk Ratio (M‐H, Fixed, 95% CI) | 0.0 [0.0, 0.0] |
| 6 Not breastfeeding at 6 months Show forest plot | 1 | 124 | Risk Ratio (M‐H, Fixed, 95% CI) | 1.0 [0.81, 1.23] |
| 6.1 Intervention <= 6 months | 1 | 124 | Risk Ratio (M‐H, Fixed, 95% CI) | 1.0 [0.81, 1.23] |
| 6.2 Intervention > 6 months | 0 | 0 | Risk Ratio (M‐H, Fixed, 95% CI) | 0.0 [0.0, 0.0] |
| 7 Incomplete 6 month infant vaccination schedule Show forest plot | 1 | 124 | Risk Ratio (M‐H, Fixed, 95% CI) | 1.07 [0.58, 1.96] |
| 7.1 Intervention <= 6 months | 1 | 124 | Risk Ratio (M‐H, Fixed, 95% CI) | 1.07 [0.58, 1.96] |
| 7.2 Intervention > 6 months | 0 | 0 | Risk Ratio (M‐H, Fixed, 95% CI) | 0.0 [0.0, 0.0] |
| 8 Failure to keep scheduled appointments (infant primary care) Show forest plot | 1 | 43 | Risk Ratio (M‐H, Fixed, 95% CI) | 0.84 [0.42, 1.66] |
| 8.1 Intervention <= 6 months | 0 | 0 | Risk Ratio (M‐H, Fixed, 95% CI) | 0.0 [0.0, 0.0] |
| 8.2 Intervention > 6 months | 1 | 43 | Risk Ratio (M‐H, Fixed, 95% CI) | 0.84 [0.42, 1.66] |
| 9 Significant cognitive delay (Bayley MDI >= 2sd below population mean) Show forest plot | 1 | 48 | Risk Ratio (M‐H, Fixed, 95% CI) | 1.36 [0.41, 4.45] |
| 9.1 Intervention <= 6 months | 0 | 0 | Risk Ratio (M‐H, Fixed, 95% CI) | 0.0 [0.0, 0.0] |
| 9.2 Intervention > 6 months | 1 | 48 | Risk Ratio (M‐H, Fixed, 95% CI) | 1.36 [0.41, 4.45] |
| 10 Significant psychomotor delay (Bayley PDI >= 2sd below population mean) Show forest plot | 1 | 48 | Risk Ratio (M‐H, Fixed, 95% CI) | 3.26 [1.00, 10.59] |
| 10.1 Intervention <= 6 months | 0 | 0 | Risk Ratio (M‐H, Fixed, 95% CI) | 0.0 [0.0, 0.0] |
| 10.2 Intervention > 6 months | 1 | 48 | Risk Ratio (M‐H, Fixed, 95% CI) | 3.26 [1.00, 10.59] |
| 11 Cognitive development (Bayley MDI) at latest time measured Show forest plot | 3 | 199 | Mean Difference (IV, Fixed, 95% CI) | 2.89 [‐1.17, 6.95] |
| 11.1 Intervention <= 6 months | 0 | 0 | Mean Difference (IV, Fixed, 95% CI) | 0.0 [0.0, 0.0] |
| 11.2 Intervention > 6 months | 3 | 199 | Mean Difference (IV, Fixed, 95% CI) | 2.89 [‐1.17, 6.95] |
| 12 Psychomotor development (Bayley PDI) at latest time measured Show forest plot | 3 | 199 | Mean Difference (IV, Fixed, 95% CI) | 3.14 [‐0.03, 6.32] |
| 12.1 Intervention <= 6 months | 0 | 0 | Mean Difference (IV, Fixed, 95% CI) | 0.0 [0.0, 0.0] |
| 12.2 Intervention > 6 months | 3 | 199 | Mean Difference (IV, Fixed, 95% CI) | 3.14 [‐0.03, 6.32] |
| 13 Behavioural problems Show forest plot | 1 | 100 | Risk Ratio (M‐H, Fixed, 95% CI) | 0.46 [0.21, 1.01] |
| 13.1 Intervention <= 6 months | 0 | 0 | Risk Ratio (M‐H, Fixed, 95% CI) | 0.0 [0.0, 0.0] |
| 13.2 Intervention > 6 months | 1 | 100 | Risk Ratio (M‐H, Fixed, 95% CI) | 0.46 [0.21, 1.01] |
| 14 Child Behaviour Checklist total score Show forest plot | 1 | 100 | Mean Difference (IV, Fixed, 95% CI) | ‐3.10 [‐7.26, 1.06] |
| 14.1 Intervention <= 6 months | 0 | 0 | Mean Difference (IV, Fixed, 95% CI) | 0.0 [0.0, 0.0] |
| 14.2 Intervention > 6 months | 1 | 100 | Mean Difference (IV, Fixed, 95% CI) | ‐3.10 [‐7.26, 1.06] |
| 15 Infant not in care of biological mother Show forest plot | 2 | 253 | Risk Ratio (M‐H, Fixed, 95% CI) | 0.83 [0.50, 1.39] |
| 15.1 Intervention <= 6 months | 1 | 136 | Risk Ratio (M‐H, Fixed, 95% CI) | 0.18 [0.02, 1.47] |
| 15.2 Intervention > 6 months | 1 | 117 | Risk Ratio (M‐H, Fixed, 95% CI) | 1.04 [0.61, 1.77] |
| 16 Child abuse or neglect: non‐accidental injury Show forest plot | 1 | 136 | Risk Ratio (M‐H, Fixed, 95% CI) | 0.36 [0.02, 8.77] |
| 16.1 Intervention <= 6 months | 1 | 136 | Risk Ratio (M‐H, Fixed, 95% CI) | 0.36 [0.02, 8.77] |
| 16.2 Intervention > 6 months | 0 | 0 | Risk Ratio (M‐H, Fixed, 95% CI) | 0.0 [0.0, 0.0] |
| 17 Non‐accidental injury and non‐voluntary foster care Show forest plot | 1 | 136 | Risk Ratio (M‐H, Fixed, 95% CI) | 0.16 [0.02, 1.23] |
| 17.1 Intervention <= 6 months | 1 | 136 | Risk Ratio (M‐H, Fixed, 95% CI) | 0.16 [0.02, 1.23] |
| 17.2 Intervention > 6 months | 0 | 0 | Risk Ratio (M‐H, Fixed, 95% CI) | 0.0 [0.0, 0.0] |
| 18 Involvement with child protective services Show forest plot | 1 | 171 | Risk Ratio (M‐H, Fixed, 95% CI) | 0.38 [0.20, 0.74] |
| 18.1 Intervention <= 6 months | 0 | 0 | Risk Ratio (M‐H, Fixed, 95% CI) | 0.0 [0.0, 0.0] |
| 18.2 Intervention > 6 months | 1 | 171 | Risk Ratio (M‐H, Fixed, 95% CI) | 0.38 [0.20, 0.74] |
| 19 Child abuse potential inventory (z score) Show forest plot | 1 | 43 | Mean Difference (IV, Fixed, 95% CI) | ‐0.90 [‐1.61, ‐0.19] |
| 19.1 Intervention <= 6 months | 0 | 0 | Mean Difference (IV, Fixed, 95% CI) | 0.0 [0.0, 0.0] |
| 19.2 Intervention > 6 months | 1 | 43 | Mean Difference (IV, Fixed, 95% CI) | ‐0.90 [‐1.61, ‐0.19] |
| 20 Child domain of parenting stress index at 18 months (z score) Show forest plot | 1 | 43 | Mean Difference (IV, Fixed, 95% CI) | ‐0.5 [‐0.78, ‐0.22] |
| 20.1 Intervention <= 6 months | 0 | 0 | Mean Difference (IV, Fixed, 95% CI) | 0.0 [0.0, 0.0] |
| 20.2 Intervention > 6 months | 1 | 43 | Mean Difference (IV, Fixed, 95% CI) | ‐0.5 [‐0.78, ‐0.22] |
| 21 HOME score Show forest plot | 1 | 43 | Mean Difference (IV, Fixed, 95% CI) | 3.70 [‐0.06, 7.46] |
| 21.1 Intervention <= 6 months | 0 | 0 | Mean Difference (IV, Fixed, 95% CI) | 0.0 [0.0, 0.0] |
| 21.2 Intervention > 6 months | 1 | 43 | Mean Difference (IV, Fixed, 95% CI) | 3.70 [‐0.06, 7.46] |
| 22 No use of postpartum contraception Show forest plot | 1 | 124 | Risk Ratio (M‐H, Fixed, 95% CI) | 0.41 [0.20, 0.82] |
| 22.1 Intervention <= 6 months | 0 | 0 | Risk Ratio (M‐H, Fixed, 95% CI) | 0.0 [0.0, 0.0] |
| 22.2 Intervention > 6 months | 1 | 124 | Risk Ratio (M‐H, Fixed, 95% CI) | 0.41 [0.20, 0.82] |
| Outcome or subgroup title | No. of studies | No. of participants | Statistical method | Effect size |
| 1 Continued illicit drug use Show forest plot | 2 | 248 | Risk Ratio (M‐H, Fixed, 95% CI) | 0.95 [0.75, 1.20] |
| 1.1 Intervention at least weekly | 1 | 131 | Risk Ratio (M‐H, Fixed, 95% CI) | 1.20 [0.79, 1.85] |
| 1.2 Intervention < weekly | 1 | 117 | Risk Ratio (M‐H, Fixed, 95% CI) | 0.80 [0.61, 1.05] |
| 2 Continued alcohol use Show forest plot | 2 | 248 | Risk Ratio (M‐H, Fixed, 95% CI) | 1.08 [0.83, 1.41] |
| 2.1 Intervention at least weekly | 1 | 131 | Risk Ratio (M‐H, Fixed, 95% CI) | 1.01 [0.75, 1.35] |
| 2.2 Intervention < weekly | 1 | 117 | Risk Ratio (M‐H, Fixed, 95% CI) | 1.26 [0.74, 2.13] |
| 3 Failure to enrol in drug treatment program Show forest plot | 2 | 211 | Risk Ratio (M‐H, Random, 95% CI) | 0.45 [0.10, 1.94] |
| 3.1 Intervention at least weekly | 2 | 211 | Risk Ratio (M‐H, Random, 95% CI) | 0.45 [0.10, 1.94] |
| 3.2 Intervention < weekly | 0 | 0 | Risk Ratio (M‐H, Random, 95% CI) | 0.0 [0.0, 0.0] |
| 4 Failure to remain in drug treatment at 4 weeks Show forest plot | 1 | 103 | Risk Ratio (M‐H, Fixed, 95% CI) | 0.54 [0.35, 0.84] |
| 4.1 Intervention at least weekly | 1 | 103 | Risk Ratio (M‐H, Fixed, 95% CI) | 0.54 [0.35, 0.84] |
| 4.2 Intervention < weekly | 0 | 0 | Risk Ratio (M‐H, Fixed, 95% CI) | 0.0 [0.0, 0.0] |
| 5 Failure to remain in drug treatment at 90 days Show forest plot | 1 | 103 | Risk Ratio (M‐H, Fixed, 95% CI) | 0.93 [0.69, 1.25] |
| 5.1 Intervention at least weekly | 1 | 103 | Risk Ratio (M‐H, Fixed, 95% CI) | 0.93 [0.69, 1.25] |
| 5.2 Intervention < weekly | 0 | 0 | Risk Ratio (M‐H, Fixed, 95% CI) | 0.0 [0.0, 0.0] |
| 6 Not breastfeeding at 6 months Show forest plot | 1 | 124 | Risk Ratio (M‐H, Fixed, 95% CI) | 1.0 [0.81, 1.23] |
| 6.1 Intervention at least weekly | 0 | 0 | Risk Ratio (M‐H, Fixed, 95% CI) | 0.0 [0.0, 0.0] |
| 6.2 Intervention < weekly | 1 | 124 | Risk Ratio (M‐H, Fixed, 95% CI) | 1.0 [0.81, 1.23] |
| 7 Incomplete 6 month infant vaccination schedule Show forest plot | 1 | 124 | Risk Ratio (M‐H, Fixed, 95% CI) | 1.07 [0.58, 1.96] |
| 7.1 Intervention at least weekly | 0 | 0 | Risk Ratio (M‐H, Fixed, 95% CI) | 0.0 [0.0, 0.0] |
| 7.2 Intervention < weekly | 1 | 124 | Risk Ratio (M‐H, Fixed, 95% CI) | 1.07 [0.58, 1.96] |
| 8 Failure to keep scheduled appointments (infant primary care) Show forest plot | 1 | 43 | Risk Ratio (M‐H, Fixed, 95% CI) | 0.84 [0.42, 1.66] |
| 8.1 Intervention at least weekly | 1 | 43 | Risk Ratio (M‐H, Fixed, 95% CI) | 0.84 [0.42, 1.66] |
| 8.2 Intervention < weekly | 0 | 0 | Risk Ratio (M‐H, Fixed, 95% CI) | 0.0 [0.0, 0.0] |
| 9 Significant cognitive delay (Bayley MDI >= 2sd below population mean) Show forest plot | 1 | 48 | Risk Ratio (M‐H, Fixed, 95% CI) | 1.36 [0.41, 4.45] |
| 9.1 Intervention at least weekly | 1 | 48 | Risk Ratio (M‐H, Fixed, 95% CI) | 1.36 [0.41, 4.45] |
| 9.2 Intervention < weekly | 0 | 0 | Risk Ratio (M‐H, Fixed, 95% CI) | 0.0 [0.0, 0.0] |
| 10 Significant psychomotor delay (Bayley PDI >= 2sd below population mean) Show forest plot | 1 | 48 | Risk Ratio (M‐H, Fixed, 95% CI) | 3.26 [1.00, 10.59] |
| 10.1 Intervention at least weekly | 1 | 48 | Risk Ratio (M‐H, Fixed, 95% CI) | 3.26 [1.00, 10.59] |
| 10.2 Intervention < weekly | 0 | 0 | Risk Ratio (M‐H, Fixed, 95% CI) | 0.0 [0.0, 0.0] |
| 11 Cognitive development (Bayley MDI) at latest time measured Show forest plot | 3 | 199 | Mean Difference (IV, Fixed, 95% CI) | 2.89 [‐1.17, 6.95] |
| 11.1 Intervention at least weekly | 3 | 199 | Mean Difference (IV, Fixed, 95% CI) | 2.89 [‐1.17, 6.95] |
| 11.2 Intervention < weekly | 0 | 0 | Mean Difference (IV, Fixed, 95% CI) | 0.0 [0.0, 0.0] |
| 12 Psychomotor development (Bayley PDI) at latest time measured Show forest plot | 3 | 199 | Mean Difference (IV, Fixed, 95% CI) | 3.14 [‐0.03, 6.32] |
| 12.1 Intervention at least weekly | 3 | 199 | Mean Difference (IV, Fixed, 95% CI) | 3.14 [‐0.03, 6.32] |
| 12.2 Intervention < weekly | 0 | 0 | Mean Difference (IV, Fixed, 95% CI) | 0.0 [0.0, 0.0] |
| 13 Behavioural problems Show forest plot | 1 | 100 | Risk Ratio (M‐H, Fixed, 95% CI) | 0.46 [0.21, 1.01] |
| 13.1 Intervention at least weekly | 0 | 0 | Risk Ratio (M‐H, Fixed, 95% CI) | 0.0 [0.0, 0.0] |
| 13.2 Intervention < weekly | 1 | 100 | Risk Ratio (M‐H, Fixed, 95% CI) | 0.46 [0.21, 1.01] |
| 14 Child Behaviour Checklist total score Show forest plot | 1 | 100 | Mean Difference (IV, Fixed, 95% CI) | ‐3.10 [‐7.26, 1.06] |
| 14.1 Intervention at least weekly | 0 | 0 | Mean Difference (IV, Fixed, 95% CI) | 0.0 [0.0, 0.0] |
| 14.2 Intervention < weekly | 1 | 100 | Mean Difference (IV, Fixed, 95% CI) | ‐3.10 [‐7.26, 1.06] |
| 15 Infant not in care of biological mother Show forest plot | 2 | 253 | Risk Ratio (M‐H, Fixed, 95% CI) | 0.83 [0.50, 1.39] |
| 15.1 Intervention at least weekly | 0 | 0 | Risk Ratio (M‐H, Fixed, 95% CI) | 0.0 [0.0, 0.0] |
| 15.2 Intervention < weekly | 2 | 253 | Risk Ratio (M‐H, Fixed, 95% CI) | 0.83 [0.50, 1.39] |
| 16 Child abuse or neglect: non‐accidental injury Show forest plot | 1 | 136 | Risk Ratio (M‐H, Fixed, 95% CI) | 0.36 [0.02, 8.77] |
| 16.1 Intervention at least weekly | 0 | 0 | Risk Ratio (M‐H, Fixed, 95% CI) | 0.0 [0.0, 0.0] |
| 16.2 Intervention < weekly | 1 | 136 | Risk Ratio (M‐H, Fixed, 95% CI) | 0.36 [0.02, 8.77] |
| 17 Non‐accidental injury and non‐voluntary foster care Show forest plot | 1 | 136 | Risk Ratio (M‐H, Fixed, 95% CI) | 0.16 [0.02, 1.23] |
| 17.1 Intervention at least weekly | 0 | 0 | Risk Ratio (M‐H, Fixed, 95% CI) | 0.0 [0.0, 0.0] |
| 17.2 Intervention < weekly | 1 | 136 | Risk Ratio (M‐H, Fixed, 95% CI) | 0.16 [0.02, 1.23] |
| 18 Involvement with child protective services Show forest plot | 1 | 171 | Risk Ratio (M‐H, Fixed, 95% CI) | 0.38 [0.20, 0.74] |
| 18.1 Intervention at least weekly | 1 | 171 | Risk Ratio (M‐H, Fixed, 95% CI) | 0.38 [0.20, 0.74] |
| 18.2 Intervention < weekly | 0 | 0 | Risk Ratio (M‐H, Fixed, 95% CI) | 0.0 [0.0, 0.0] |
| 19 Child abuse potential inventory (z score) Show forest plot | 1 | 43 | Mean Difference (IV, Fixed, 95% CI) | ‐0.90 [‐1.61, ‐0.19] |
| 19.1 Intervention at least weekly | 1 | 43 | Mean Difference (IV, Fixed, 95% CI) | ‐0.90 [‐1.61, ‐0.19] |
| 19.2 Intervention < weekly | 0 | 0 | Mean Difference (IV, Fixed, 95% CI) | 0.0 [0.0, 0.0] |
| 20 Child domain of parenting stress index at 18 months (z score) Show forest plot | 1 | 43 | Mean Difference (IV, Fixed, 95% CI) | ‐0.5 [‐0.78, ‐0.22] |
| 20.1 Intervention at least weekly | 1 | 43 | Mean Difference (IV, Fixed, 95% CI) | ‐0.5 [‐0.78, ‐0.22] |
| 20.2 Intervention < weekly | 0 | 0 | Mean Difference (IV, Fixed, 95% CI) | 0.0 [0.0, 0.0] |
| 21 HOME score Show forest plot | 1 | 43 | Mean Difference (IV, Fixed, 95% CI) | 3.70 [‐0.06, 7.46] |
| 21.1 Intervention at least weekly | 1 | 43 | Mean Difference (IV, Fixed, 95% CI) | 3.70 [‐0.06, 7.46] |
| 21.2 Intervention < weekly | 0 | 0 | Mean Difference (IV, Fixed, 95% CI) | 0.0 [0.0, 0.0] |
| 22 No use of postpartum contraception Show forest plot | 1 | 124 | Risk Ratio (M‐H, Fixed, 95% CI) | 0.41 [0.20, 0.82] |
| 22.1 Intervention at least weekly | 0 | 0 | Risk Ratio (M‐H, Fixed, 95% CI) | 0.0 [0.0, 0.0] |
| 22.2 Intervention < weekly | 1 | 124 | Risk Ratio (M‐H, Fixed, 95% CI) | 0.41 [0.20, 0.82] |
| Outcome or subgroup title | No. of studies | No. of participants | Statistical method | Effect size |
| 1 Continued illicit drug use Show forest plot | 2 | 248 | Risk Ratio (M‐H, Fixed, 95% CI) | 0.95 [0.75, 1.20] |
| 1.1 Intervention by nurse | 1 | 117 | Risk Ratio (M‐H, Fixed, 95% CI) | 0.80 [0.61, 1.05] |
| 1.2 Intervention by trained social worker | 0 | 0 | Risk Ratio (M‐H, Fixed, 95% CI) | 0.0 [0.0, 0.0] |
| 1.3 Intervention by trained counsellor | 0 | 0 | Risk Ratio (M‐H, Fixed, 95% CI) | 0.0 [0.0, 0.0] |
| 1.4 Intervention by trained lay worker | 1 | 131 | Risk Ratio (M‐H, Fixed, 95% CI) | 1.20 [0.79, 1.85] |
| 1.5 Intervention by multidisciplinary team | 0 | 0 | Risk Ratio (M‐H, Fixed, 95% CI) | 0.0 [0.0, 0.0] |
| 2 Continued alcohol use Show forest plot | 2 | 248 | Risk Ratio (M‐H, Fixed, 95% CI) | 1.08 [0.83, 1.41] |
| 2.1 Intervention by nurse | 1 | 117 | Risk Ratio (M‐H, Fixed, 95% CI) | 1.26 [0.74, 2.13] |
| 2.2 Intervention by trained social worker | 0 | 0 | Risk Ratio (M‐H, Fixed, 95% CI) | 0.0 [0.0, 0.0] |
| 2.3 Intervention by trained counsellor | 0 | 0 | Risk Ratio (M‐H, Fixed, 95% CI) | 0.0 [0.0, 0.0] |
| 2.4 Intervention by trained lay worker | 1 | 131 | Risk Ratio (M‐H, Fixed, 95% CI) | 1.01 [0.75, 1.35] |
| 2.5 Intervention by multidisciplinary team | 0 | 0 | Risk Ratio (M‐H, Fixed, 95% CI) | 0.0 [0.0, 0.0] |
| 3 Failure to enrol in drug treatment program Show forest plot | 2 | 211 | Risk Ratio (M‐H, Random, 95% CI) | 0.45 [0.10, 1.94] |
| 3.1 Intervention by nurse | 0 | 0 | Risk Ratio (M‐H, Random, 95% CI) | 0.0 [0.0, 0.0] |
| 3.2 Intervention by trained social worker | 0 | 0 | Risk Ratio (M‐H, Random, 95% CI) | 0.0 [0.0, 0.0] |
| 3.3 Intervention by trained counsellor | 1 | 103 | Risk Ratio (M‐H, Random, 95% CI) | 0.22 [0.10, 0.48] |
| 3.4 Intervention by trained lay worker | 1 | 108 | Risk Ratio (M‐H, Random, 95% CI) | 0.84 [0.63, 1.12] |
| 3.5 Intervention by multidisciplinary team | 0 | 0 | Risk Ratio (M‐H, Random, 95% CI) | 0.0 [0.0, 0.0] |
| 4 Failure to remain in drug treatment at 4 weeks Show forest plot | 1 | 103 | Risk Ratio (M‐H, Fixed, 95% CI) | 0.54 [0.35, 0.84] |
| 4.1 Intervention by nurse | 0 | 0 | Risk Ratio (M‐H, Fixed, 95% CI) | 0.0 [0.0, 0.0] |
| 4.2 Intervention by trained social worker | 0 | 0 | Risk Ratio (M‐H, Fixed, 95% CI) | 0.0 [0.0, 0.0] |
| 4.3 Intervention by trained counsellor | 1 | 103 | Risk Ratio (M‐H, Fixed, 95% CI) | 0.54 [0.35, 0.84] |
| 4.4 Intervention by trained lay worker | 0 | 0 | Risk Ratio (M‐H, Fixed, 95% CI) | 0.0 [0.0, 0.0] |
| 4.5 Intervention by multidisciplinary team | 0 | 0 | Risk Ratio (M‐H, Fixed, 95% CI) | 0.0 [0.0, 0.0] |
| 5 Failure to remain in drug treatment at 90 days Show forest plot | 1 | 103 | Risk Ratio (M‐H, Fixed, 95% CI) | 0.93 [0.69, 1.25] |
| 5.1 Intervention by nurse | 0 | 0 | Risk Ratio (M‐H, Fixed, 95% CI) | 0.0 [0.0, 0.0] |
| 5.2 Intervention by trained social worker | 0 | 0 | Risk Ratio (M‐H, Fixed, 95% CI) | 0.0 [0.0, 0.0] |
| 5.3 Intervention by trained counsellor | 1 | 103 | Risk Ratio (M‐H, Fixed, 95% CI) | 0.93 [0.69, 1.25] |
| 5.4 Intervention by trained lay worker | 0 | 0 | Risk Ratio (M‐H, Fixed, 95% CI) | 0.0 [0.0, 0.0] |
| 5.5 Intervention by multidisciplinary team | 0 | 0 | Risk Ratio (M‐H, Fixed, 95% CI) | 0.0 [0.0, 0.0] |
| 6 Not breastfeeding at 6 months Show forest plot | 1 | 124 | Risk Ratio (M‐H, Fixed, 95% CI) | 1.0 [0.81, 1.23] |
| 6.1 Intervention by nurse | 1 | 124 | Risk Ratio (M‐H, Fixed, 95% CI) | 1.0 [0.81, 1.23] |
| 6.2 Intervention by trained social worker | 0 | 0 | Risk Ratio (M‐H, Fixed, 95% CI) | 0.0 [0.0, 0.0] |
| 6.3 Intervention by trained counsellor | 0 | 0 | Risk Ratio (M‐H, Fixed, 95% CI) | 0.0 [0.0, 0.0] |
| 6.4 Intervention by trained lay worker | 0 | 0 | Risk Ratio (M‐H, Fixed, 95% CI) | 0.0 [0.0, 0.0] |
| 6.5 Intervention by multidisciplinary team | 0 | 0 | Risk Ratio (M‐H, Fixed, 95% CI) | 0.0 [0.0, 0.0] |
| 7 Incomplete 6 month infant vaccination schedule Show forest plot | 1 | 124 | Risk Ratio (M‐H, Fixed, 95% CI) | 1.07 [0.58, 1.96] |
| 7.1 Intervention by nurse | 1 | 124 | Risk Ratio (M‐H, Fixed, 95% CI) | 1.07 [0.58, 1.96] |
| 7.2 Intervention by trained social worker | 0 | 0 | Risk Ratio (M‐H, Fixed, 95% CI) | 0.0 [0.0, 0.0] |
| 7.3 Intervention by trained counsellor | 0 | 0 | Risk Ratio (M‐H, Fixed, 95% CI) | 0.0 [0.0, 0.0] |
| 7.4 Intervention by trained lay worker | 0 | 0 | Risk Ratio (M‐H, Fixed, 95% CI) | 0.0 [0.0, 0.0] |
| 7.5 Intervention by multidisciplinary team | 0 | 0 | Risk Ratio (M‐H, Fixed, 95% CI) | 0.0 [0.0, 0.0] |
| 8 Failure to keep scheduled appointments (infant primary care) Show forest plot | 1 | 43 | Risk Ratio (M‐H, Fixed, 95% CI) | 0.84 [0.42, 1.66] |
| 8.1 Intervention by nurse | 1 | 43 | Risk Ratio (M‐H, Fixed, 95% CI) | 0.84 [0.42, 1.66] |
| 8.2 Intervention by trained social worker | 0 | 0 | Risk Ratio (M‐H, Fixed, 95% CI) | 0.0 [0.0, 0.0] |
| 8.3 Intervention by trained counsellor | 0 | 0 | Risk Ratio (M‐H, Fixed, 95% CI) | 0.0 [0.0, 0.0] |
| 8.4 Intervention by trained lay worker | 0 | 0 | Risk Ratio (M‐H, Fixed, 95% CI) | 0.0 [0.0, 0.0] |
| 8.5 Intervention by multidisciplinary team | 0 | 0 | Risk Ratio (M‐H, Fixed, 95% CI) | 0.0 [0.0, 0.0] |
| 9 Significant cognitive delay (Bayley MDI >= 2sd below population mean) Show forest plot | 1 | 48 | Risk Ratio (M‐H, Fixed, 95% CI) | 1.36 [0.41, 4.45] |
| 9.1 Intervention by nurse | 0 | 0 | Risk Ratio (M‐H, Fixed, 95% CI) | 0.0 [0.0, 0.0] |
| 9.2 Intervention by trained social worker | 0 | 0 | Risk Ratio (M‐H, Fixed, 95% CI) | 0.0 [0.0, 0.0] |
| 9.3 Intervention by trained counsellor | 0 | 0 | Risk Ratio (M‐H, Fixed, 95% CI) | 0.0 [0.0, 0.0] |
| 9.4 Intervention by trained lay worker | 1 | 48 | Risk Ratio (M‐H, Fixed, 95% CI) | 1.36 [0.41, 4.45] |
| 9.5 Intervention by multidisciplinary team | 0 | 0 | Risk Ratio (M‐H, Fixed, 95% CI) | 0.0 [0.0, 0.0] |
| 10 Significant psychomotor delay (Bayley PDI >= 2sd below population mean) Show forest plot | 1 | 48 | Risk Ratio (M‐H, Fixed, 95% CI) | 3.26 [1.00, 10.59] |
| 10.1 Intervention by nurse | 0 | 0 | Risk Ratio (M‐H, Fixed, 95% CI) | 0.0 [0.0, 0.0] |
| 10.2 Intervention by trained social worker | 0 | 0 | Risk Ratio (M‐H, Fixed, 95% CI) | 0.0 [0.0, 0.0] |
| 10.3 Intervention by trained counsellor | 0 | 0 | Risk Ratio (M‐H, Fixed, 95% CI) | 0.0 [0.0, 0.0] |
| 10.4 Intervention by trained lay worker | 1 | 48 | Risk Ratio (M‐H, Fixed, 95% CI) | 3.26 [1.00, 10.59] |
| 10.5 Intervention by multidisciplinary team | 0 | 0 | Risk Ratio (M‐H, Fixed, 95% CI) | 0.0 [0.0, 0.0] |
| 11 Cognitive development (Bayley MDI) at latest time measured Show forest plot | 3 | 199 | Mean Difference (IV, Fixed, 95% CI) | 2.89 [‐1.17, 6.95] |
| 11.1 Intervention by nurse | 1 | 43 | Mean Difference (IV, Fixed, 95% CI) | ‐1.80 [‐11.36, 7.76] |
| 11.2 Intervention by trained social worker | 0 | 0 | Mean Difference (IV, Fixed, 95% CI) | 0.0 [0.0, 0.0] |
| 11.3 Intervention by trained counsellor | 0 | 0 | Mean Difference (IV, Fixed, 95% CI) | 0.0 [0.0, 0.0] |
| 11.4 Intervention by trained lay worker | 2 | 156 | Mean Difference (IV, Fixed, 95% CI) | 3.92 [‐0.56, 8.41] |
| 11.5 Intervention by multidisciplinary team | 0 | 0 | Mean Difference (IV, Fixed, 95% CI) | 0.0 [0.0, 0.0] |
| 12 Psychomotor development (Bayley PDI) at latest time measured Show forest plot | 3 | 199 | Mean Difference (IV, Fixed, 95% CI) | 3.14 [‐0.03, 6.32] |
| 12.1 Intervention by nurse | 1 | 43 | Mean Difference (IV, Fixed, 95% CI) | 0.70 [‐17.75, 19.15] |
| 12.2 Intervention by trained social worker | 0 | 0 | Mean Difference (IV, Fixed, 95% CI) | 0.0 [0.0, 0.0] |
| 12.3 Intervention by trained counsellor | 0 | 0 | Mean Difference (IV, Fixed, 95% CI) | 0.0 [0.0, 0.0] |
| 12.4 Intervention by trained lay worker | 2 | 156 | Mean Difference (IV, Fixed, 95% CI) | 3.22 [‐0.01, 6.44] |
| 12.5 Intervention by multidisciplinary team | 0 | 0 | Mean Difference (IV, Fixed, 95% CI) | 0.0 [0.0, 0.0] |
| 13 Behavioural problems Show forest plot | 1 | 100 | Risk Ratio (M‐H, Fixed, 95% CI) | 0.46 [0.21, 1.01] |
| 13.1 Intervention by nurse | 1 | 100 | Risk Ratio (M‐H, Fixed, 95% CI) | 0.46 [0.21, 1.01] |
| 13.2 Intervention by trained social worker | 0 | 0 | Risk Ratio (M‐H, Fixed, 95% CI) | 0.0 [0.0, 0.0] |
| 13.3 Intervention by trained counsellor | 0 | 0 | Risk Ratio (M‐H, Fixed, 95% CI) | 0.0 [0.0, 0.0] |
| 13.4 Intervention by trained lay worker | 0 | 0 | Risk Ratio (M‐H, Fixed, 95% CI) | 0.0 [0.0, 0.0] |
| 13.5 Intervention by multidisciplinary team | 0 | 0 | Risk Ratio (M‐H, Fixed, 95% CI) | 0.0 [0.0, 0.0] |
| 14 Child Behaviour Checklist total score Show forest plot | 1 | 100 | Mean Difference (IV, Fixed, 95% CI) | ‐3.10 [‐7.26, 1.06] |
| 14.1 Intervention by nurse | 1 | 100 | Mean Difference (IV, Fixed, 95% CI) | ‐3.10 [‐7.26, 1.06] |
| 14.2 Intervention by trained social worker | 0 | 0 | Mean Difference (IV, Fixed, 95% CI) | 0.0 [0.0, 0.0] |
| 14.3 Intervention by trained counsellor | 0 | 0 | Mean Difference (IV, Fixed, 95% CI) | 0.0 [0.0, 0.0] |
| 14.4 Intervention by trained lay worker | 0 | 0 | Mean Difference (IV, Fixed, 95% CI) | 0.0 [0.0, 0.0] |
| 14.5 Intervention by multidisciplinary team | 0 | 0 | Mean Difference (IV, Fixed, 95% CI) | 0.0 [0.0, 0.0] |
| 15 Infant not in care of biological mother Show forest plot | 2 | 253 | Risk Ratio (M‐H, Fixed, 95% CI) | 0.83 [0.50, 1.39] |
| 15.1 Intervention by nurse | 2 | 253 | Risk Ratio (M‐H, Fixed, 95% CI) | 0.83 [0.50, 1.39] |
| 15.2 Intervention by trained social worker | 0 | 0 | Risk Ratio (M‐H, Fixed, 95% CI) | 0.0 [0.0, 0.0] |
| 15.3 Intervention by trained counsellor | 0 | 0 | Risk Ratio (M‐H, Fixed, 95% CI) | 0.0 [0.0, 0.0] |
| 15.4 Intervention by trained lay worker | 0 | 0 | Risk Ratio (M‐H, Fixed, 95% CI) | 0.0 [0.0, 0.0] |
| 15.5 Intervention by multidisciplinary team | 0 | 0 | Risk Ratio (M‐H, Fixed, 95% CI) | 0.0 [0.0, 0.0] |
| 16 Child abuse or neglect: non‐accidental injury Show forest plot | 1 | 136 | Risk Ratio (M‐H, Fixed, 95% CI) | 0.36 [0.02, 8.77] |
| 16.1 Intervention by nurse | 1 | 136 | Risk Ratio (M‐H, Fixed, 95% CI) | 0.36 [0.02, 8.77] |
| 16.2 Intervention by trained social worker | 0 | 0 | Risk Ratio (M‐H, Fixed, 95% CI) | 0.0 [0.0, 0.0] |
| 16.3 Intervention by trained counsellor | 0 | 0 | Risk Ratio (M‐H, Fixed, 95% CI) | 0.0 [0.0, 0.0] |
| 16.4 Intervention by trained lay worker | 0 | 0 | Risk Ratio (M‐H, Fixed, 95% CI) | 0.0 [0.0, 0.0] |
| 16.5 Intervention by multidisciplinary team | 0 | 0 | Risk Ratio (M‐H, Fixed, 95% CI) | 0.0 [0.0, 0.0] |
| 17 Non‐accidental injury and non‐voluntary foster care Show forest plot | 1 | 136 | Risk Ratio (M‐H, Fixed, 95% CI) | 0.16 [0.02, 1.23] |
| 17.1 Intervention by nurse | 1 | 136 | Risk Ratio (M‐H, Fixed, 95% CI) | 0.16 [0.02, 1.23] |
| 17.2 Intervention by trained social worker | 0 | 0 | Risk Ratio (M‐H, Fixed, 95% CI) | 0.0 [0.0, 0.0] |
| 17.3 ntervention by trained counsellor | 0 | 0 | Risk Ratio (M‐H, Fixed, 95% CI) | 0.0 [0.0, 0.0] |
| 17.4 Intervention by trained lay worker | 0 | 0 | Risk Ratio (M‐H, Fixed, 95% CI) | 0.0 [0.0, 0.0] |
| 17.5 Intervention by multidisciplinary team | 0 | 0 | Risk Ratio (M‐H, Fixed, 95% CI) | 0.0 [0.0, 0.0] |
| 18 Involvement with child protective services Show forest plot | 1 | 171 | Risk Ratio (M‐H, Fixed, 95% CI) | 0.38 [0.20, 0.74] |
| 18.1 Intervention by nurse | 0 | 0 | Risk Ratio (M‐H, Fixed, 95% CI) | 0.0 [0.0, 0.0] |
| 18.2 Intervention by trained social worker | 0 | 0 | Risk Ratio (M‐H, Fixed, 95% CI) | 0.0 [0.0, 0.0] |
| 18.3 Intervention by trained counsellor | 0 | 0 | Risk Ratio (M‐H, Fixed, 95% CI) | 0.0 [0.0, 0.0] |
| 18.4 Intervention by trained lay worker | 1 | 171 | Risk Ratio (M‐H, Fixed, 95% CI) | 0.38 [0.20, 0.74] |
| 18.5 Intervention by multidisciplinary team | 0 | 0 | Risk Ratio (M‐H, Fixed, 95% CI) | 0.0 [0.0, 0.0] |
| 19 Child abuse potential inventory (z score) Show forest plot | 1 | 43 | Mean Difference (IV, Fixed, 95% CI) | ‐0.90 [‐1.61, ‐0.19] |
| 19.1 Intervention by nurse | 1 | 43 | Mean Difference (IV, Fixed, 95% CI) | ‐0.90 [‐1.61, ‐0.19] |
| 19.2 Intervention by trained social worker | 0 | 0 | Mean Difference (IV, Fixed, 95% CI) | 0.0 [0.0, 0.0] |
| 19.3 Intervention by trained counsellor | 0 | 0 | Mean Difference (IV, Fixed, 95% CI) | 0.0 [0.0, 0.0] |
| 19.4 Intervention by trained lay worker | 0 | 0 | Mean Difference (IV, Fixed, 95% CI) | 0.0 [0.0, 0.0] |
| 19.5 Intervention by multidisciplinary team | 0 | 0 | Mean Difference (IV, Fixed, 95% CI) | 0.0 [0.0, 0.0] |
| 20 Child domain of parenting stress index at 18 months (z score) Show forest plot | 1 | 43 | Mean Difference (IV, Fixed, 95% CI) | ‐0.5 [‐0.78, ‐0.22] |
| 20.1 Intervention by nurse | 1 | 43 | Mean Difference (IV, Fixed, 95% CI) | ‐0.5 [‐0.78, ‐0.22] |
| 20.2 Intervention by trained social worker | 0 | 0 | Mean Difference (IV, Fixed, 95% CI) | 0.0 [0.0, 0.0] |
| 20.3 Intervention by trained counsellor | 0 | 0 | Mean Difference (IV, Fixed, 95% CI) | 0.0 [0.0, 0.0] |
| 20.4 Intervention by trained lay worker | 0 | 0 | Mean Difference (IV, Fixed, 95% CI) | 0.0 [0.0, 0.0] |
| 20.5 Intervention by multidisciplinary team | 0 | 0 | Mean Difference (IV, Fixed, 95% CI) | 0.0 [0.0, 0.0] |
| 21 HOME score Show forest plot | 1 | 43 | Mean Difference (IV, Fixed, 95% CI) | 3.70 [‐0.06, 7.46] |
| 21.1 Intervention by nurse | 1 | 43 | Mean Difference (IV, Fixed, 95% CI) | 3.70 [‐0.06, 7.46] |
| 21.2 Intervention by trained social worker | 0 | 0 | Mean Difference (IV, Fixed, 95% CI) | 0.0 [0.0, 0.0] |
| 21.3 Intervention by trained counsellor | 0 | 0 | Mean Difference (IV, Fixed, 95% CI) | 0.0 [0.0, 0.0] |
| 21.4 Intervention by trained lay worker | 0 | 0 | Mean Difference (IV, Fixed, 95% CI) | 0.0 [0.0, 0.0] |
| 21.5 Intervention by multidisciplinary team | 0 | 0 | Mean Difference (IV, Fixed, 95% CI) | 0.0 [0.0, 0.0] |
| 22 No use of postpartum contraception Show forest plot | 1 | 124 | Risk Ratio (M‐H, Fixed, 95% CI) | 0.41 [0.20, 0.82] |
| 22.1 Intervention by nurse | 1 | 124 | Risk Ratio (M‐H, Fixed, 95% CI) | 0.41 [0.20, 0.82] |
| 22.2 Intervention by trained social worker | 0 | 0 | Risk Ratio (M‐H, Fixed, 95% CI) | 0.0 [0.0, 0.0] |
| 22.3 Intervention by trained counsellor | 0 | 0 | Risk Ratio (M‐H, Fixed, 95% CI) | 0.0 [0.0, 0.0] |
| 22.4 Intervention by trained lay worker | 0 | 0 | Risk Ratio (M‐H, Fixed, 95% CI) | 0.0 [0.0, 0.0] |
| 22.5 Intervention by multidisciplinary team | 0 | 0 | Risk Ratio (M‐H, Fixed, 95% CI) | 0.0 [0.0, 0.0] |
| Outcome or subgroup title | No. of studies | No. of participants | Statistical method | Effect size |
| 1 Continued illicit drug use Show forest plot | 2 | 248 | Risk Ratio (M‐H, Fixed, 95% CI) | 0.95 [0.75, 1.20] |
| 2 Continued alcohol use Show forest plot | 2 | 248 | Risk Ratio (M‐H, Fixed, 95% CI) | 1.08 [0.83, 1.41] |
| 3 Failure to enrol in drug treatment program Show forest plot | 1 | 108 | Risk Ratio (M‐H, Fixed, 95% CI) | 0.84 [0.63, 1.12] |
| 4 Failure to keep scheduled appointments (infant primary care) Show forest plot | 1 | 43 | Risk Ratio (M‐H, Fixed, 95% CI) | 0.84 [0.42, 1.66] |
| 5 Cognitive development at latest time measured (Bayley MDI) Show forest plot | 2 | 151 | Mean Difference (IV, Fixed, 95% CI) | 3.13 [‐1.46, 7.72] |
| 6 Psychomotor development at latest time measured (Bayley PDI) Show forest plot | 2 | 151 | Mean Difference (IV, Fixed, 95% CI) | 4.14 [0.79, 7.50] |
| 7 Behavioural problems Show forest plot | 1 | 100 | Risk Ratio (M‐H, Fixed, 95% CI) | 0.46 [0.21, 1.01] |
| 8 Child Behaviour Checklist total score Show forest plot | 1 | 100 | Mean Difference (IV, Fixed, 95% CI) | ‐3.10 [‐7.26, 1.06] |
| 9 Infant not in care of biological mother Show forest plot | 1 | 117 | Risk Ratio (M‐H, Fixed, 95% CI) | 1.04 [0.61, 1.77] |
| 10 Involvement with child protective services Show forest plot | 1 | 171 | Risk Ratio (M‐H, Fixed, 95% CI) | 0.38 [0.20, 0.74] |
| 11 Child abuse potential inventory (z score) Show forest plot | 1 | 43 | Std. Mean Difference (IV, Fixed, 95% CI) | ‐0.73 [‐1.35, ‐0.11] |
| 12 Child domain of parenting stress index at 18 months (z score) Show forest plot | 1 | 43 | Mean Difference (IV, Fixed, 95% CI) | ‐0.5 [‐0.78, ‐0.22] |
| 13 HOME score Show forest plot | 1 | 43 | Mean Difference (IV, Fixed, 95% CI) | 3.70 [‐0.06, 7.46] |
| Outcome or subgroup title | No. of studies | No. of participants | Statistical method | Effect size |
| 1 Failure to enrol in drug treatment program Show forest plot | 1 | 103 | Risk Ratio (M‐H, Random, 95% CI) | 0.22 [0.10, 0.48] |
| 2 Failure to remain in drug treatment Show forest plot | 1 | Risk Ratio (M‐H, Fixed, 95% CI) | Subtotals only | |
| 2.1 At 4 weeks | 1 | 103 | Risk Ratio (M‐H, Fixed, 95% CI) | 0.54 [0.35, 0.84] |
| 2.2 At 90 days | 1 | 103 | Risk Ratio (M‐H, Fixed, 95% CI) | 0.93 [0.69, 1.25] |
| 3 Failed to maintain feeding regime Show forest plot | 1 | 124 | Risk Ratio (M‐H, Fixed, 95% CI) | 1.0 [0.81, 1.23] |
| 3.1 Not breastfeeding at 6 months | 1 | 124 | Risk Ratio (M‐H, Fixed, 95% CI) | 1.0 [0.81, 1.23] |
| 4 Incomplete vaccination schedule Show forest plot | 1 | 124 | Risk Ratio (M‐H, Fixed, 95% CI) | 1.07 [0.58, 1.96] |
| 4.1 Incomplete 6 month infant vaccination schedule | 1 | 124 | Risk Ratio (M‐H, Fixed, 95% CI) | 1.07 [0.58, 1.96] |
| 5 Infant not in care of biological mother Show forest plot | 1 | 136 | Risk Ratio (M‐H, Fixed, 95% CI) | 0.18 [0.02, 1.47] |
| 6 Child abuse or neglect Show forest plot | 1 | 136 | Risk Ratio (M‐H, Fixed, 95% CI) | 0.36 [0.02, 8.77] |
| 6.1 Non‐accidental injury | 1 | 136 | Risk Ratio (M‐H, Fixed, 95% CI) | 0.36 [0.02, 8.77] |
| 7 Non‐accidental injury and non‐voluntary foster care Show forest plot | 1 | 136 | Risk Ratio (M‐H, Fixed, 95% CI) | 0.16 [0.02, 1.23] |
| 8 No use of postpartum contraception Show forest plot | 1 | 124 | Risk Ratio (M‐H, Fixed, 95% CI) | 0.41 [0.20, 0.82] |