Rehabilitación física para personas de edad avanzada en la atención a largo plazo
Información
- DOI:
- https://doi.org/10.1002/14651858.CD004294.pub3Copiar DOI

- Base de datos:
-
- Cochrane Database of Systematic Reviews
- Versión publicada:
-
- 28 febrero 2013see what's new
- Tipo:
-
- Intervention
- Etapa:
-
- Review
- Grupo Editorial Cochrane:
-
Grupo Cochrane de Accidentes cerebrovasculares
- Copyright:
-
- Copyright © 2013 The Cochrane Collaboration. Published by John Wiley & Sons, Ltd.
Cifras del artículo
Altmetric:
Citado por:
Autores
Contributions of authors
Anne Forster conceived and designed the review and wrote the funding application, with the assistance of John Young, Jane Smith, and John Green. Jo Hardy and Anne Forster took a lead role in writing the protocol, with advice from John Young, Jane Smith, and John Green. Anne Forster co‐ordinated the review, with assistance from Jo Hardy and Tom Crocker. Jo Hardy and Anne Forster developed the search strategy and organised the retrieval of papers. Anne Forster, Jo Hardy, and Tom Crocker screened search results. Jo Hardy, Tom Crocker, Lesley Brown, and Seline Ozer wrote to authors of papers for additional information. All co‐authors assisted in the identification of papers for inclusion into the review, appraised quality of papers, assisted in the design of the data extraction protocol, and extracted data from papers. For this updated review, Tom Crocker developed the database and managed the data. Lesley Brown, Tom Crocker, and Seline Ozer combined the independent data extractions. Darren Greenwood led and conducted the meta‐analyses, which were reproduced in Review Manager by Tom Crocker. Tom Crocker assimilated the information and led the writing of this update, with support from Anne Forster.
Sources of support
Internal sources
-
NHS R&D Levy Funding, UK.
External sources
-
Physiotherapy Research Foundation, UK.
Declarations of interest
John Young was a co‐applicant for a research grant from BUPA to investigate delirium prevention in care homes. Anne Forster, John Young, and Ruth Lambley were developing a research project to investigate exercise programmes in care homes. This work started after the results of the original Cochrane review had been submitted.
Anne Forster and John Young have conducted a NIHR (National Institute for Health Research) development programme to investigate activity in care homes (barriers, enablers, and its measurement). They are applying for a NIHR programme grant to develop and test the feasibility of an intervention to increase activity in care homes.
Darren Greenwood has received grant funding for statistical analysis from Bradford Teaching Hospitals NHS Foundation Trust, and he has received funding from the Department of Health for a systematic review of diet and stroke.
Acknowledgements
The review authors would like to thank the Physiotherapy Research Foundation for providing the funding for this review. Particular thanks must go to Ruth Lambley who, as an author on the original review, screened search results, managed and assimilated data, and assisted with the co‐ordination of the review and its writing. Thanks to authors of the papers involved in these studies for their prompt responses to queries. Thanks to Brenda Thomas and Hazel Fraser from the Cochrane Stroke Group, Michelle Fiander from EPOC, and Rob de Bie from the Rehabilitation and Related Therapies Field. Thanks to Deirdre Andre, Pat Spoor, and Rosemary Campbell‐Blair, University of Leeds, for assistance with developing the search strategy and undertaking searches. Thanks to Gillian Procter and Sarah Smith for assistance with screening search results, Will Green for assistance with data extraction, Ian Sleigh for assistance with database development, and Chung Fu for retrieving articles for the review.
Version history
| Published | Title | Stage | Authors | Version |
| 2013 Feb 28 | Physical rehabilitation for older people in long‐term care | Review | Tom Crocker, Anne Forster, John Young, Lesley Brown, Seline Ozer, Jane Smith, John Green, Jo Hardy, Eileen Burns, Elizabeth Glidewell, Darren C Greenwood | |
| 2009 Jan 21 | Rehabilitation for older people in long‐term care | Review | Anne Forster, Ruth Lambley, Jo Hardy, John Young, Jane Smith, John Green, Eileen Burns | |
| 2003 Jul 21 | Rehabilitation for older people in long term care | Protocol | Anne Forster, Jo Bailey, Jane Smith, John Young, John Green, Eileen Burns | |
Differences between protocol and review
Title
The title has been amended to clarify that the review focuses on the physical aspects of rehabilitation.
Study criteria
The original intention was to limit inclusion to studies that undertook follow up at a minimum of one month. However, because of a lack of such studies, this criterion was not applied.
Outcome measures
We clarified our meaning of function in activities of daily living to include specific measures of performance in physical ADL function, e.g. mobility.
We specified economic outcomes and additional adverse outcomes.
The original intention was to assess outcomes at the scheduled end of each trial (after follow up). However, as many studies lacked follow up, we assessed outcomes at the end of the intervention for consistency. In the narrative synthesis, we also reported follow‐up data.
We had planned, in the face of varied assessment tools, to dichotomise outcomes into deteriorated versus maintained or improved prior to meta‐analysis. For the same purpose, we specified a global poor outcome (death or deterioration). However, we have not included such varied measures in meta‐analysis because we lack the individual level data required to do this.
Search methods for identification of studies
We originally planned to search SIGLE (System for Information on Grey Literature in Europe), but we did not do so because it is no longer accessible. Furthermore, we planned to handsearch relevant journals, but because of their inclusion in electronic databases and the extensive results returned through electronic searches, we considered this unnecessary. In addition to the planned searches, we searched Google Scholar.
Data collection and analysis
We replaced the assessment of methodological quality described in the protocol and undertaken in the original review with The Cochrane Collaboration’s new 'Risk of bias' assessment tool (Higgins 2011). We reassessed all studies in the original review in line with these criteria. We performed data collection on a standardised electronic database, rather than a paper form. We clarified our approach to analysing data from cluster trials. We originally intended to combine results in a fixed‐effect meta‐analysis where sufficient homogeneity existed. However, because of the extensive heterogeneity in interventions (contents, intensity, and duration), we used a random‐effects meta‐analysis as our primary approach, but we still report the results of fixed‐effect models as sensitivity analyses. We did not perform all the subgroup analyses originally proposed in the protocol because there are too few pathology‐specific interventions for any one pathology, and studies often include both nursing and residential care homes. However, both of these groupings were partly intended to split participants by functional ability. Therefore, we instead grouped studies by baseline function in the measure being analysed. In addition to the subgroups suggested in the protocol, we added gender, duration of intervention, and risk of bias. We specified all of these subgroups before analysis commenced and presented and reported all of them for each measure.
Keywords
MeSH
Medical Subject Headings (MeSH) Keywords
Medical Subject Headings Check Words
Aged; Aged, 80 and over; Female; Humans; Male;
PICO
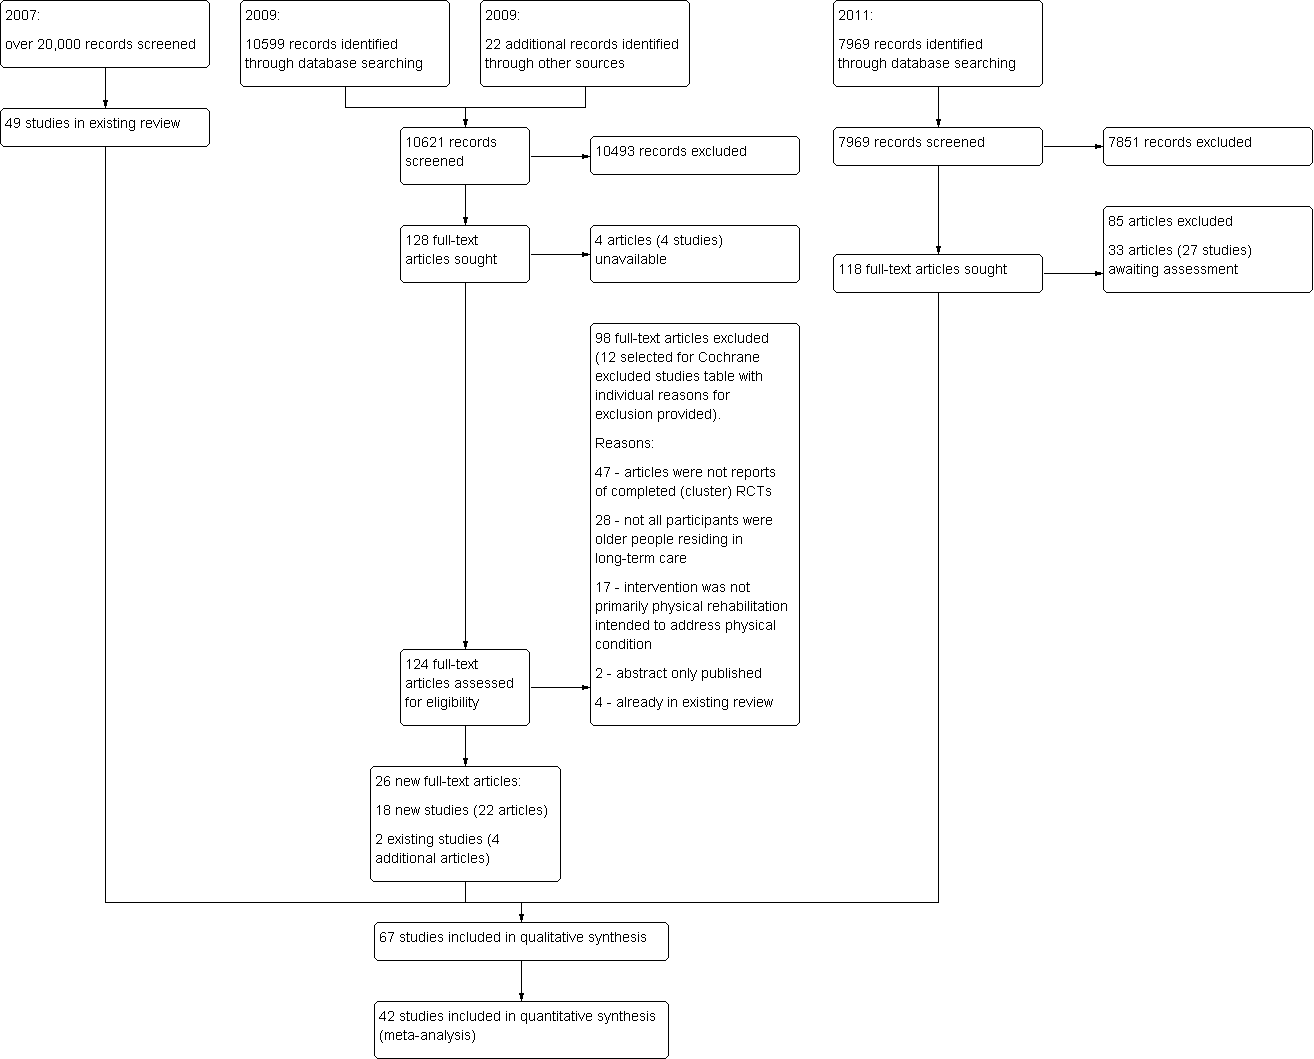
Review update flow diagram
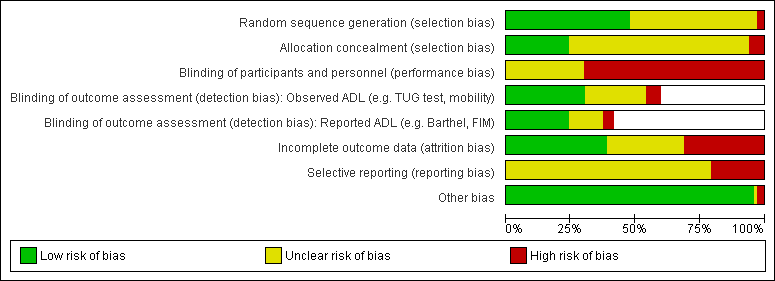
'Risk of bias' graph: review authors' judgements about each 'Risk of bias' item presented as percentages across all included studies

Funnel plot of comparison: 1 Rehabilitation versus control, outcome: 1.1 Barthel Index.

Funnel plot of comparison: 1 Rehabilitation versus control, outcome: 1.4 TUG test

Funnel plot of comparison: 1 Rehabilitation versus control, outcome: 1.5 Walking speed

Funnel plot of comparison: 1 Rehabilitation versus control, outcome: 1.6 Death
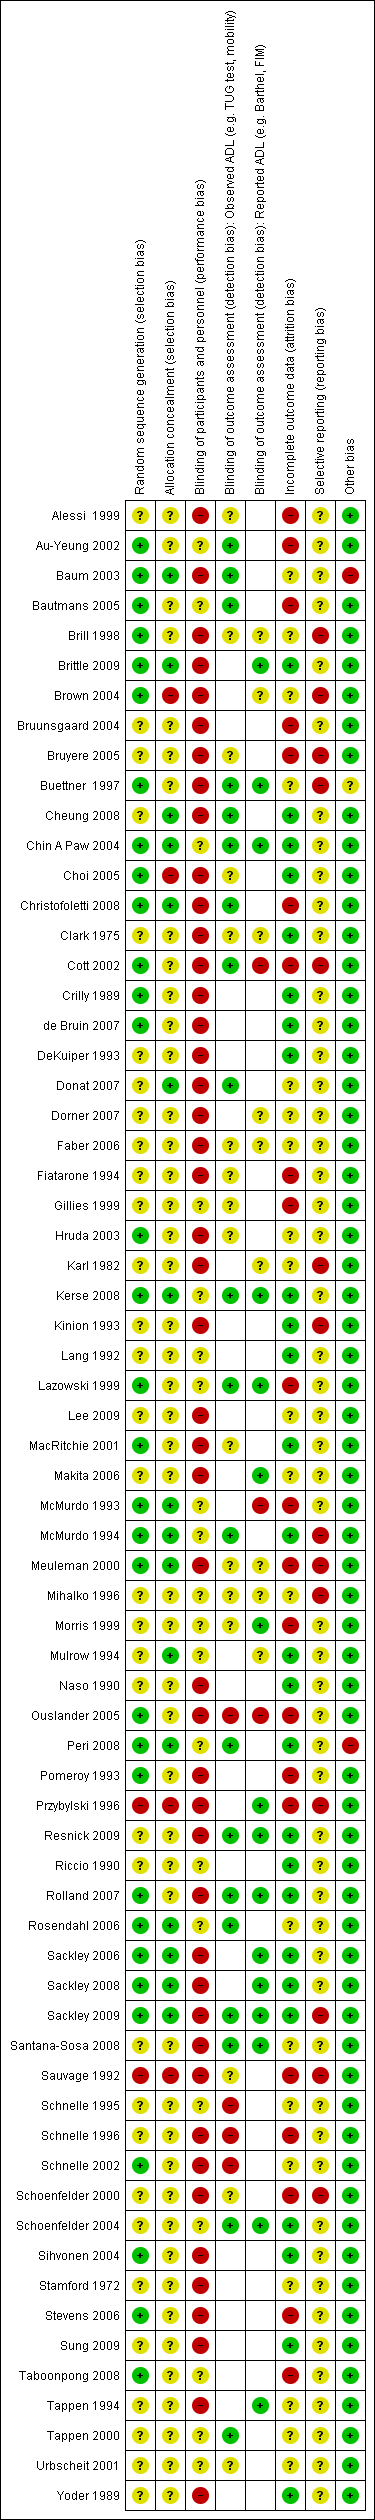
'Risk of bias' summary: review authors' judgements about each 'Risk of bias' item for each included study
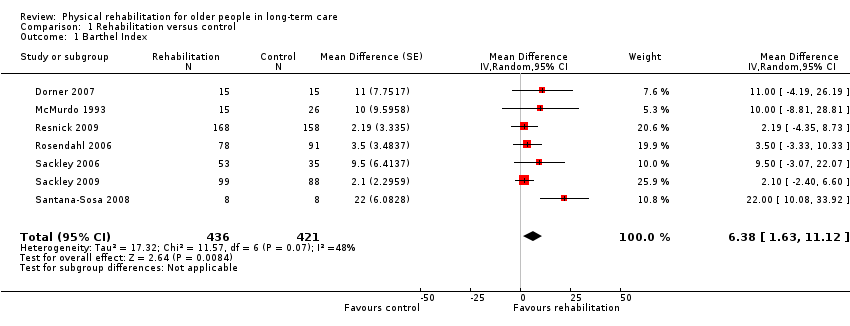
Comparison 1 Rehabilitation versus control, Outcome 1 Barthel Index.
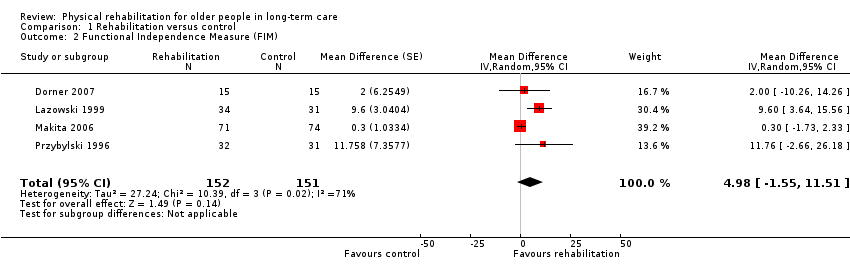
Comparison 1 Rehabilitation versus control, Outcome 2 Functional Independence Measure (FIM).
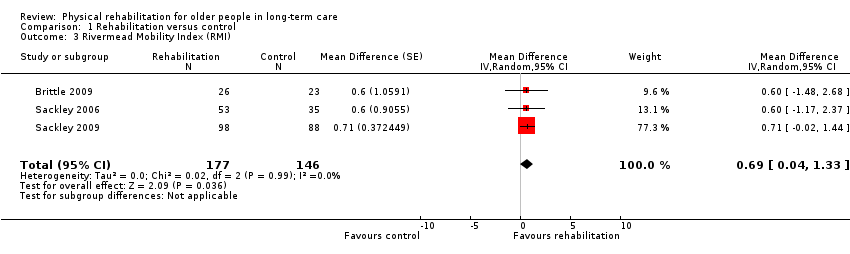
Comparison 1 Rehabilitation versus control, Outcome 3 Rivermead Mobility Index (RMI).
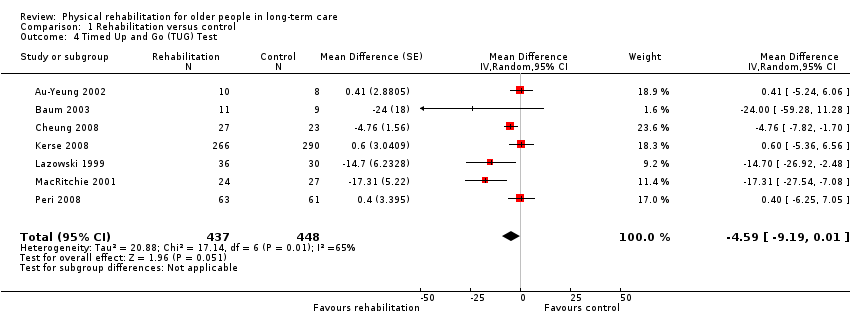
Comparison 1 Rehabilitation versus control, Outcome 4 Timed Up and Go (TUG) Test.
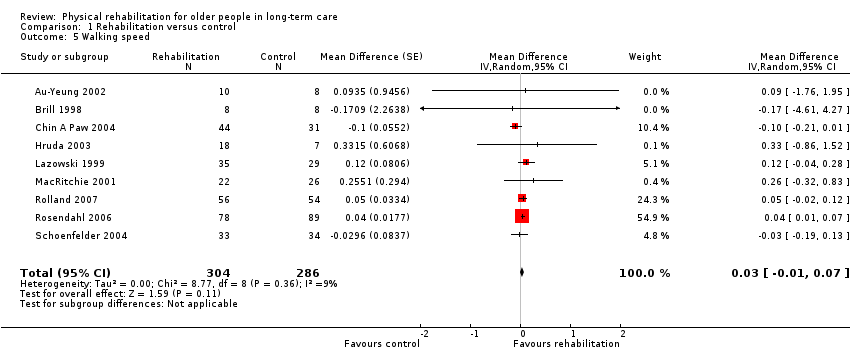
Comparison 1 Rehabilitation versus control, Outcome 5 Walking speed.

Comparison 1 Rehabilitation versus control, Outcome 6 Death.

Comparison 1 Rehabilitation versus control, Outcome 7 Barthel Index (by risk of bias).
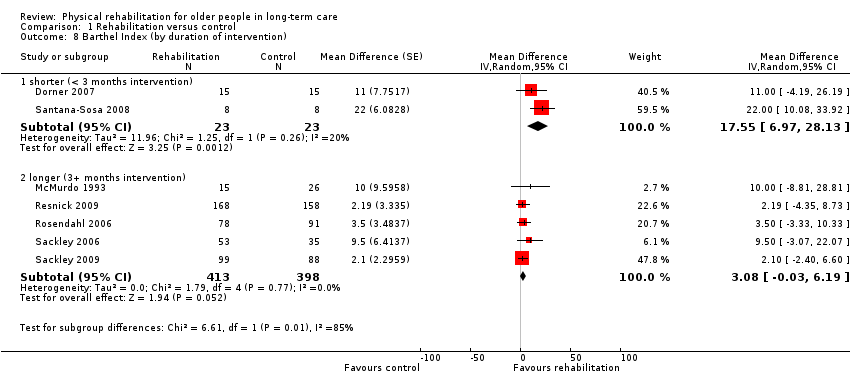
Comparison 1 Rehabilitation versus control, Outcome 8 Barthel Index (by duration of intervention).

Comparison 1 Rehabilitation versus control, Outcome 9 Barthel Index (by mode of delivery).

Comparison 1 Rehabilitation versus control, Outcome 10 Barthel Index (by baseline Barthel Index score).

Comparison 1 Rehabilitation versus control, Outcome 11 Barthel Index (by age).

Comparison 1 Rehabilitation versus control, Outcome 12 Barthel Index (by gender).
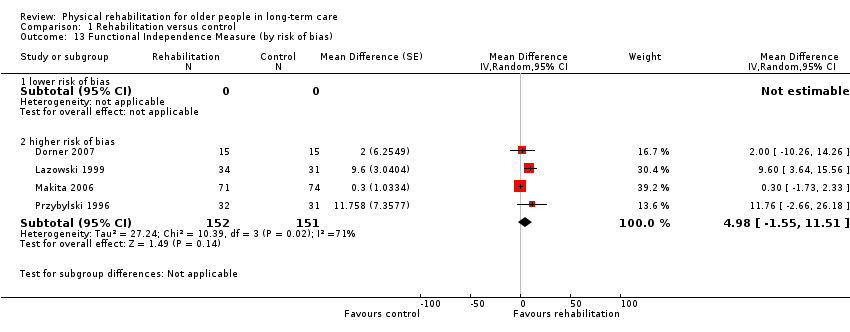
Comparison 1 Rehabilitation versus control, Outcome 13 Functional Independence Measure (by risk of bias).

Comparison 1 Rehabilitation versus control, Outcome 14 Functional Independence Measure (by duration of intervention).
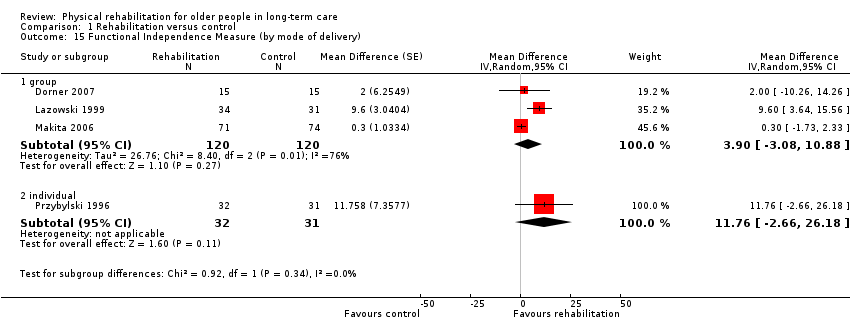
Comparison 1 Rehabilitation versus control, Outcome 15 Functional Independence Measure (by mode of delivery).
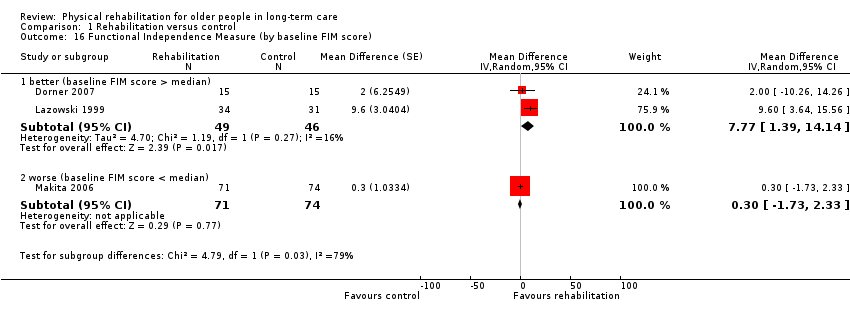
Comparison 1 Rehabilitation versus control, Outcome 16 Functional Independence Measure (by baseline FIM score).

Comparison 1 Rehabilitation versus control, Outcome 17 Functional Independence Measure (by age).

Comparison 1 Rehabilitation versus control, Outcome 18 Functional Independence Measure (by gender).
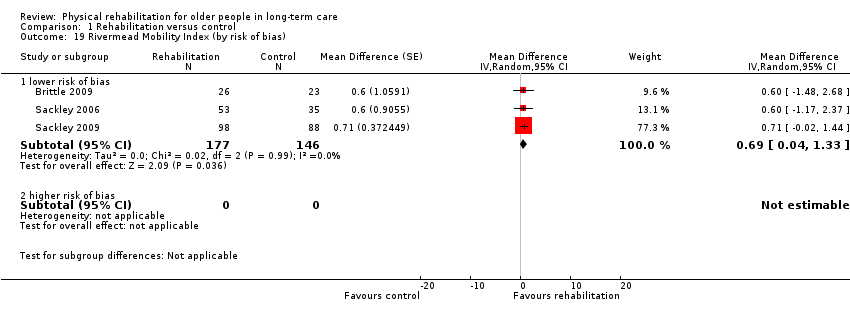
Comparison 1 Rehabilitation versus control, Outcome 19 Rivermead Mobility Index (by risk of bias).

Comparison 1 Rehabilitation versus control, Outcome 20 Rivermead Mobility Index (by duration of intervention).

Comparison 1 Rehabilitation versus control, Outcome 21 Rivermead Mobility Index (by mode of delivery).
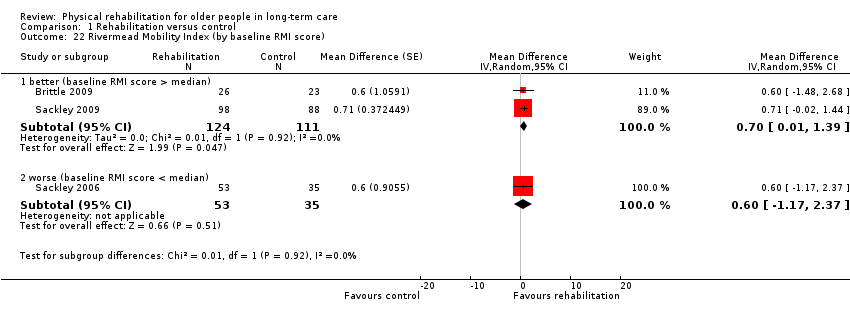
Comparison 1 Rehabilitation versus control, Outcome 22 Rivermead Mobility Index (by baseline RMI score).

Comparison 1 Rehabilitation versus control, Outcome 23 Rivermead Mobility Index (by age).
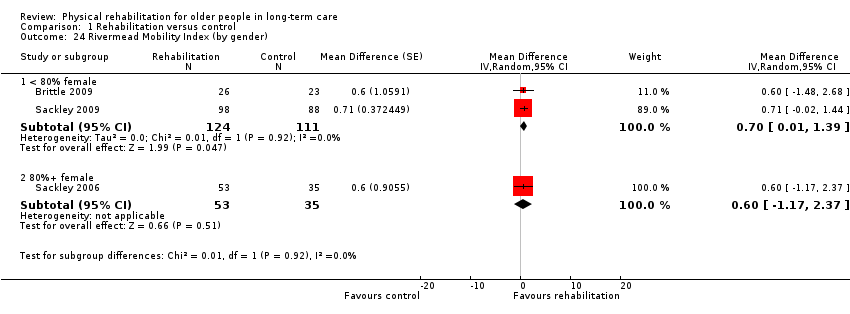
Comparison 1 Rehabilitation versus control, Outcome 24 Rivermead Mobility Index (by gender).

Comparison 1 Rehabilitation versus control, Outcome 25 TUG Test (by risk of bias).
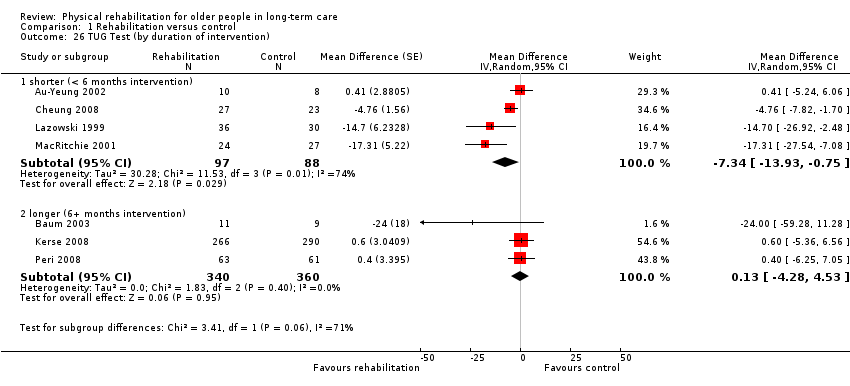
Comparison 1 Rehabilitation versus control, Outcome 26 TUG Test (by duration of intervention).
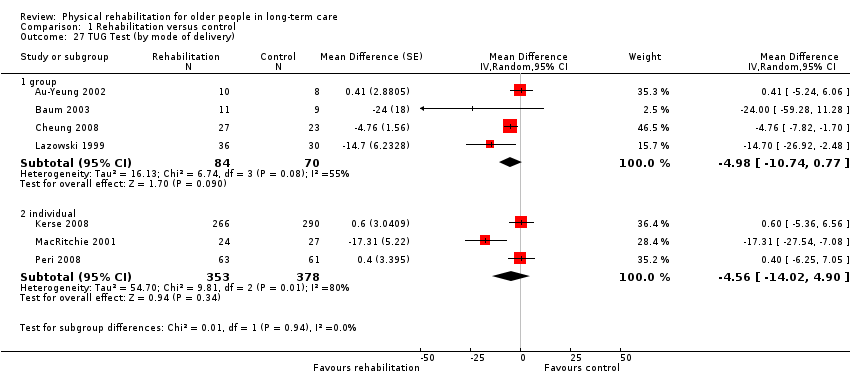
Comparison 1 Rehabilitation versus control, Outcome 27 TUG Test (by mode of delivery).

Comparison 1 Rehabilitation versus control, Outcome 28 TUG Test (by baseline TUG score).
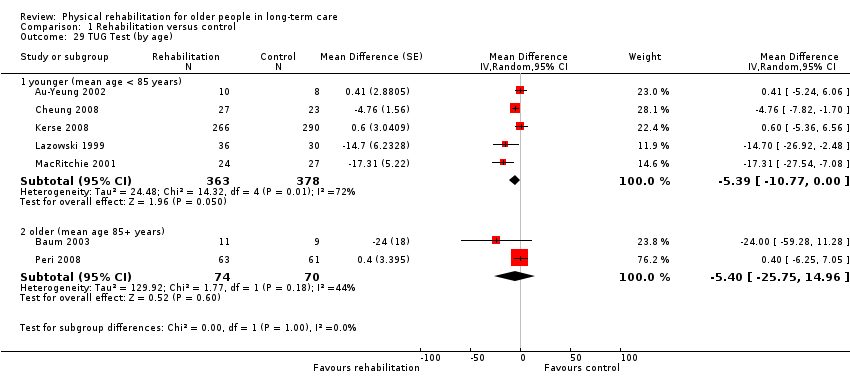
Comparison 1 Rehabilitation versus control, Outcome 29 TUG Test (by age).

Comparison 1 Rehabilitation versus control, Outcome 30 TUG Test (by gender).

Comparison 1 Rehabilitation versus control, Outcome 31 Walking speed (by risk of bias).

Comparison 1 Rehabilitation versus control, Outcome 32 Walking speed (by duration of intervention).
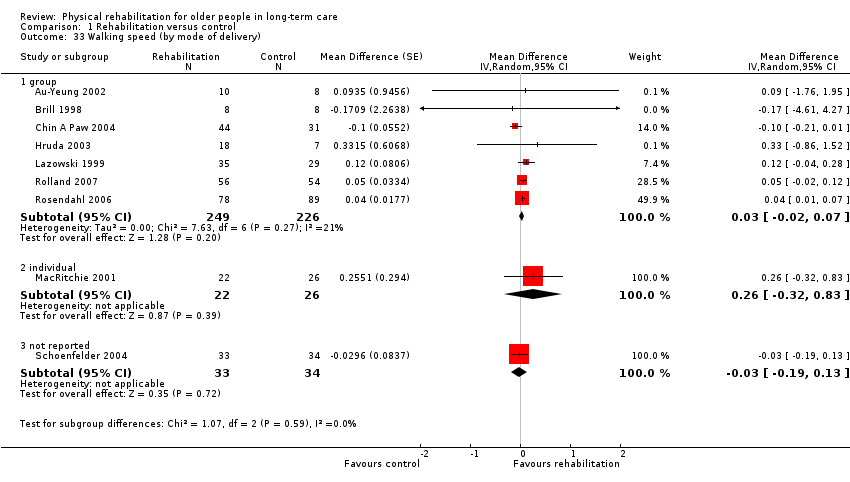
Comparison 1 Rehabilitation versus control, Outcome 33 Walking speed (by mode of delivery).

Comparison 1 Rehabilitation versus control, Outcome 34 Walking speed (by baseline walking speed).
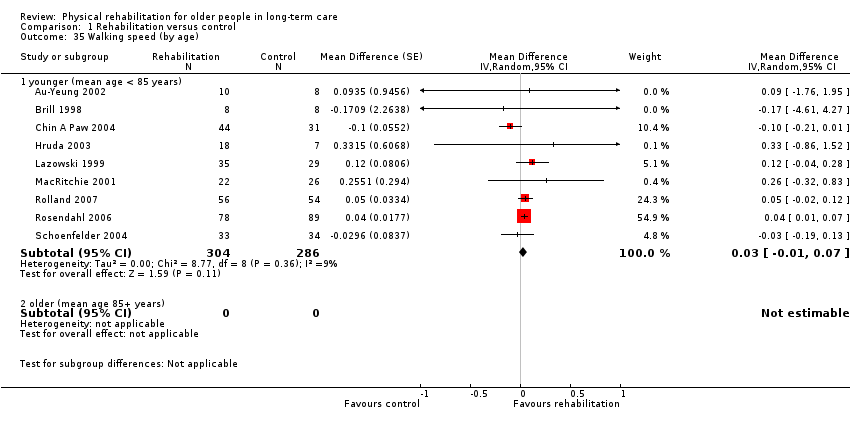
Comparison 1 Rehabilitation versus control, Outcome 35 Walking speed (by age).

Comparison 1 Rehabilitation versus control, Outcome 36 Walking speed (by gender).
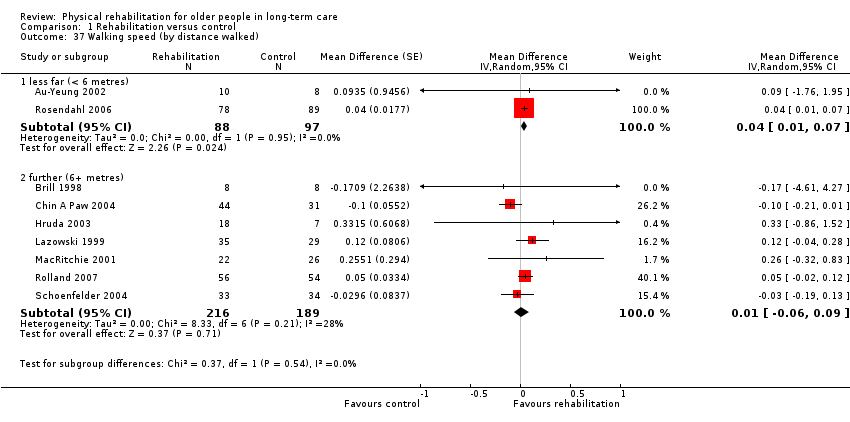
Comparison 1 Rehabilitation versus control, Outcome 37 Walking speed (by distance walked).
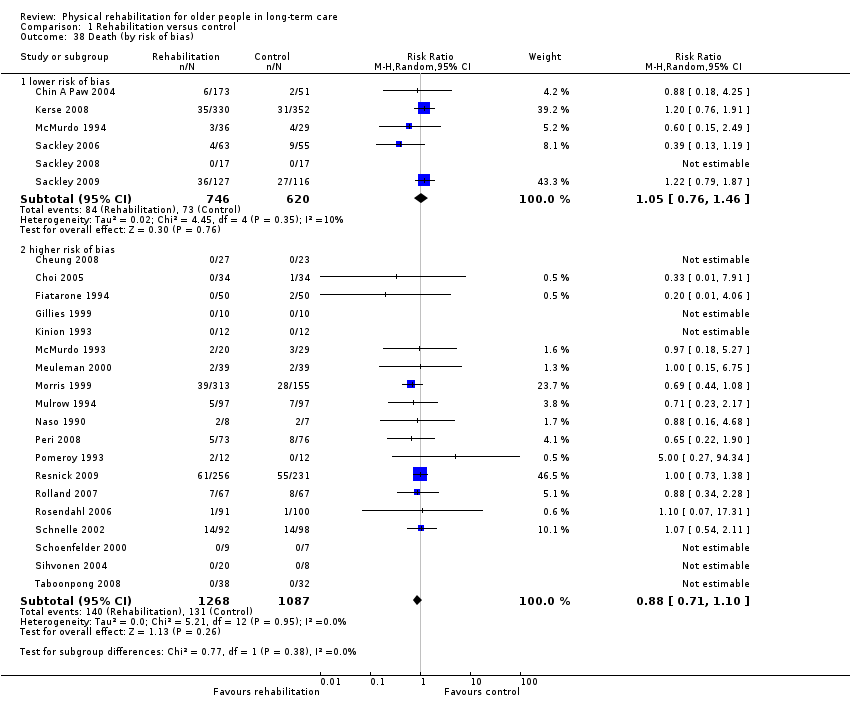
Comparison 1 Rehabilitation versus control, Outcome 38 Death (by risk of bias).

Comparison 1 Rehabilitation versus control, Outcome 39 Death (by duration of intervention).

Comparison 1 Rehabilitation versus control, Outcome 40 Death (by mode of delivery).

Comparison 1 Rehabilitation versus control, Outcome 41 Death (by age).
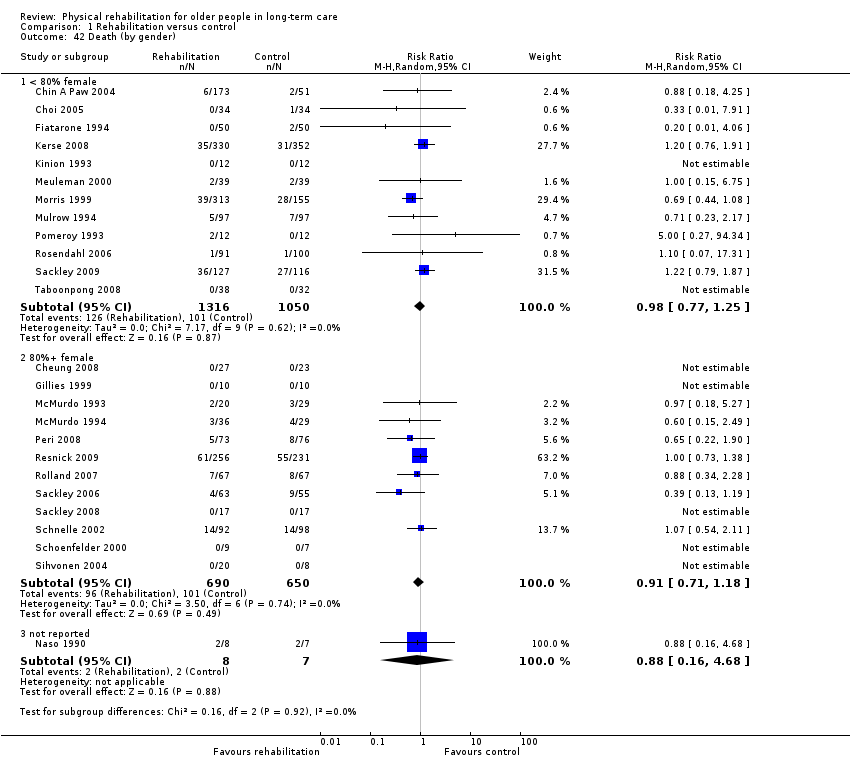
Comparison 1 Rehabilitation versus control, Outcome 42 Death (by gender).

Comparison 1 Rehabilitation versus control, Outcome 43 Sensitivity analysis: Barthel Index (fixed‐effect).

Comparison 1 Rehabilitation versus control, Outcome 44 Sensitivity analysis: Barthel Index (cluster trials).
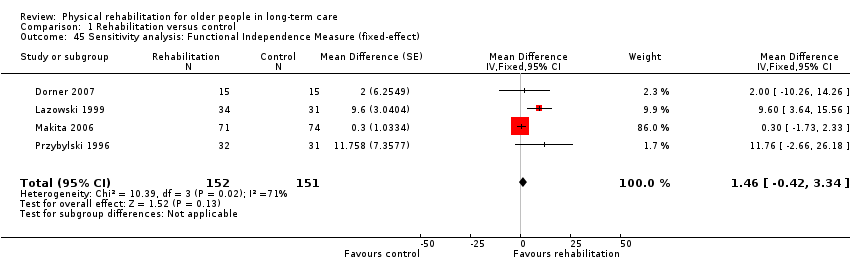
Comparison 1 Rehabilitation versus control, Outcome 45 Sensitivity analysis: Functional Independence Measure (fixed‐effect).
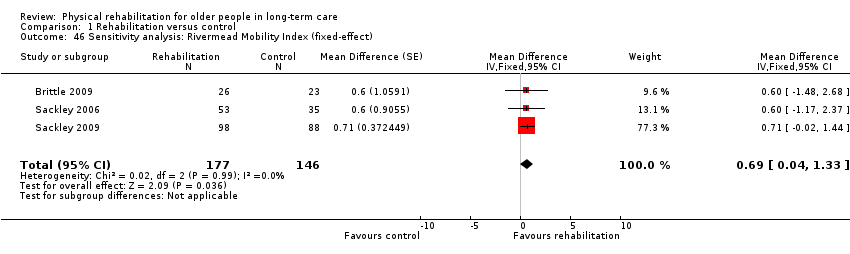
Comparison 1 Rehabilitation versus control, Outcome 46 Sensitivity analysis: Rivermead Mobility Index (fixed‐effect).

Comparison 1 Rehabilitation versus control, Outcome 47 Sensitivity analysis: TUG Test (fixed‐effect).
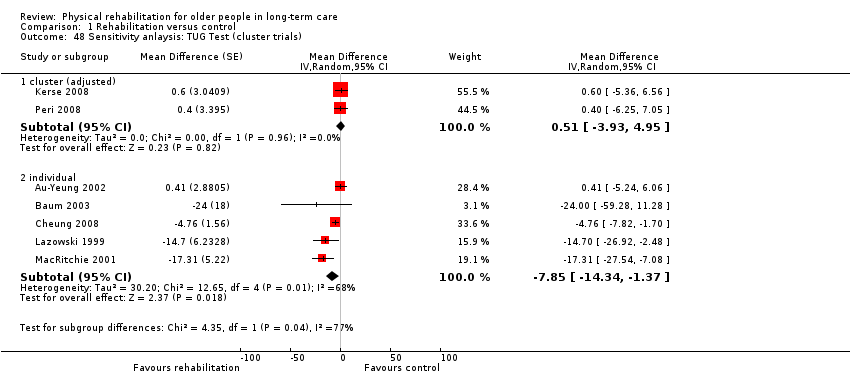
Comparison 1 Rehabilitation versus control, Outcome 48 Sensitivity anlaysis: TUG Test (cluster trials).
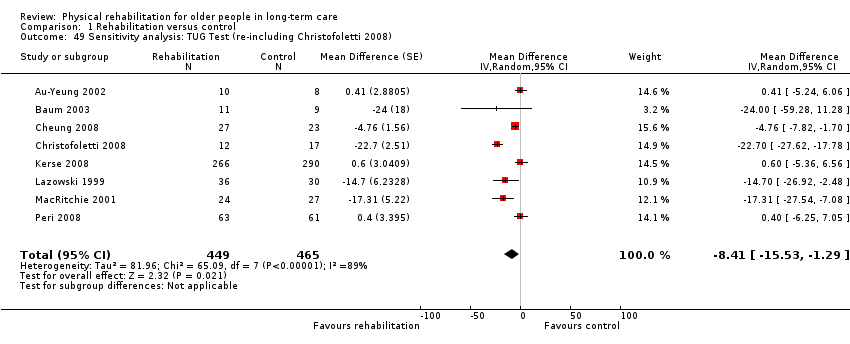
Comparison 1 Rehabilitation versus control, Outcome 49 Sensitivity analysis: TUG Test (re‐including Christofoletti 2008).
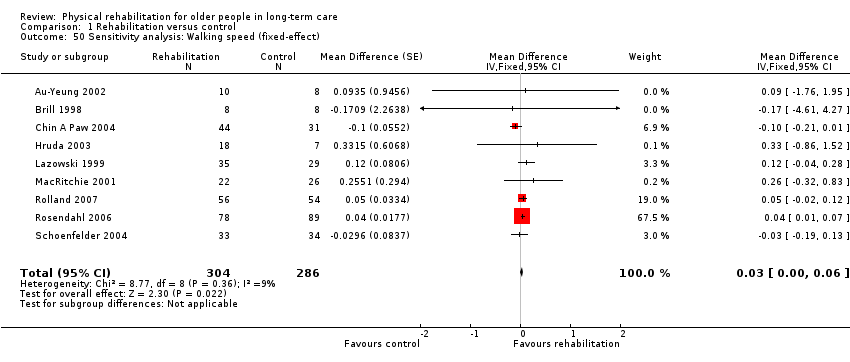
Comparison 1 Rehabilitation versus control, Outcome 50 Sensitivity analysis: Walking speed (fixed‐effect).

Comparison 1 Rehabilitation versus control, Outcome 51 Sensitivity analysis: Walking speed (cluster trials).
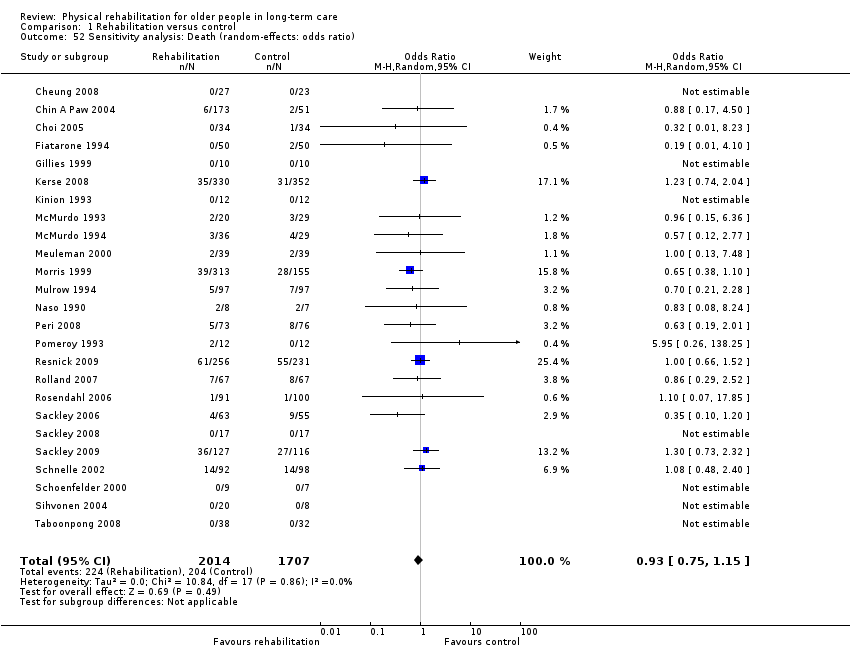
Comparison 1 Rehabilitation versus control, Outcome 52 Sensitivity analysis: Death (random‐effects: odds ratio).

Comparison 1 Rehabilitation versus control, Outcome 53 Sensitivity analysis: Death (random‐effects: risk difference).

Comparison 1 Rehabilitation versus control, Outcome 54 Sensitivity analysis: Death (fixed‐effect).

Comparison 1 Rehabilitation versus control, Outcome 55 Sensitivity analysis: Death (fixed‐effect: Peto odds ratio).

Comparison 1 Rehabilitation versus control, Outcome 56 Sensitivity analysis: Death (cluster trials).

Comparison 1 Rehabilitation versus control, Outcome 57 Sensitivity analysis: Death (including Brittle 2009).

Comparison 2 Rehabilitation (experimental) versus rehabilitation (control), Outcome 1 TUG Test.

Comparison 2 Rehabilitation (experimental) versus rehabilitation (control), Outcome 2 Death.
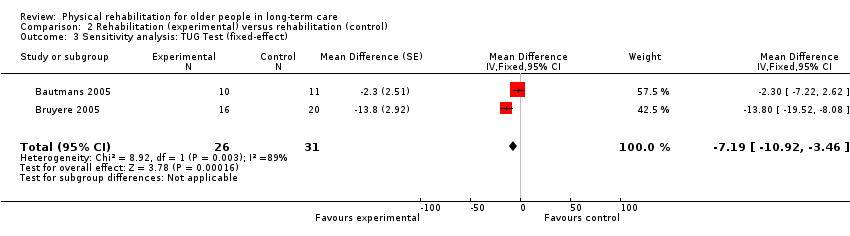
Comparison 2 Rehabilitation (experimental) versus rehabilitation (control), Outcome 3 Sensitivity analysis: TUG Test (fixed‐effect).
| Outcome or subgroup title | No. of studies | No. of participants | Statistical method | Effect size |
| 1 Barthel Index Show forest plot | 7 | 857 | Mean Difference (Random, 95% CI) | 6.38 [1.63, 11.12] |
| 2 Functional Independence Measure (FIM) Show forest plot | 4 | 303 | Mean Difference (Random, 95% CI) | 4.98 [‐1.55, 11.51] |
| 3 Rivermead Mobility Index (RMI) Show forest plot | 3 | 323 | Mean Difference (Random, 95% CI) | 0.69 [0.04, 1.33] |
| 4 Timed Up and Go (TUG) Test Show forest plot | 7 | 885 | Mean Difference (Random, 95% CI) | ‐4.59 [‐9.19, 0.01] |
| 5 Walking speed Show forest plot | 9 | 590 | Mean Difference (Random, 95% CI) | 0.03 [‐0.01, 0.07] |
| 6 Death Show forest plot | 25 | 3721 | Risk Ratio (M‐H, Random, 95% CI) | 0.95 [0.80, 1.13] |
| 7 Barthel Index (by risk of bias) Show forest plot | 7 | Mean Difference (Random, 95% CI) | Subtotals only | |
| 7.1 lower risk of bias | 2 | 275 | Mean Difference (Random, 95% CI) | 3.38 [‐2.10, 8.86] |
| 7.2 higher risk of bias | 5 | 582 | Mean Difference (Random, 95% CI) | 8.25 [1.15, 15.34] |
| 8 Barthel Index (by duration of intervention) Show forest plot | 7 | Mean Difference (Random, 95% CI) | Subtotals only | |
| 8.1 shorter (< 3 months intervention) | 2 | 46 | Mean Difference (Random, 95% CI) | 17.55 [6.97, 28.13] |
| 8.2 longer (3+ months intervention) | 5 | 811 | Mean Difference (Random, 95% CI) | 3.08 [‐0.03, 6.19] |
| 9 Barthel Index (by mode of delivery) Show forest plot | 7 | Mean Difference (Random, 95% CI) | Subtotals only | |
| 9.1 group | 4 | 256 | Mean Difference (Random, 95% CI) | 10.99 [1.51, 20.48] |
| 9.2 individual | 2 | 275 | Mean Difference (Random, 95% CI) | 3.38 [‐2.10, 8.86] |
| 9.3 not reported | 1 | 326 | Mean Difference (Random, 95% CI) | 2.19 [‐4.35, 8.73] |
| 10 Barthel Index (by baseline Barthel Index score) Show forest plot | 6 | Mean Difference (Random, 95% CI) | Subtotals only | |
| 10.1 better (baseline Barthel Index score > median) | 3 | 511 | Mean Difference (Random, 95% CI) | 7.94 [‐1.77, 17.64] |
| 10.2 worse (baseline Barthel Index score < median) | 3 | 305 | Mean Difference (Random, 95% CI) | 3.97 [‐0.83, 8.78] |
| 11 Barthel Index (by age) Show forest plot | 7 | Mean Difference (Random, 95% CI) | Subtotals only | |
| 11.1 younger (mean age < 85 years) | 4 | 552 | Mean Difference (Random, 95% CI) | 8.02 [‐0.25, 16.30] |
| 11.2 older (mean age 85+ years) | 3 | 305 | Mean Difference (Random, 95% CI) | 3.97 [‐0.83, 8.78] |
| 12 Barthel Index (by gender) Show forest plot | 7 | Mean Difference (Random, 95% CI) | Subtotals only | |
| 12.1 < 80% female | 4 | 402 | Mean Difference (Random, 95% CI) | 7.93 [0.18, 15.69] |
| 12.2 80%+ female | 3 | 455 | Mean Difference (Random, 95% CI) | 4.29 [‐1.25, 9.83] |
| 13 Functional Independence Measure (by risk of bias) Show forest plot | 4 | Mean Difference (Random, 95% CI) | Subtotals only | |
| 13.1 lower risk of bias | 0 | 0 | Mean Difference (Random, 95% CI) | 0.0 [0.0, 0.0] |
| 13.2 higher risk of bias | 4 | 303 | Mean Difference (Random, 95% CI) | 4.98 [‐1.55, 11.51] |
| 14 Functional Independence Measure (by duration of intervention) Show forest plot | 4 | Mean Difference (Random, 95% CI) | Subtotals only | |
| 14.1 shorter (< 3 months intervention) | 1 | 30 | Mean Difference (Random, 95% CI) | 2.0 [‐10.26, 14.26] |
| 14.2 longer (3+ months intervention) | 3 | 273 | Mean Difference (Random, 95% CI) | 5.85 [‐2.22, 13.93] |
| 15 Functional Independence Measure (by mode of delivery) Show forest plot | 4 | Mean Difference (Random, 95% CI) | Subtotals only | |
| 15.1 group | 3 | 240 | Mean Difference (Random, 95% CI) | 3.90 [‐3.08, 10.88] |
| 15.2 individual | 1 | 63 | Mean Difference (Random, 95% CI) | 11.76 [‐2.66, 26.18] |
| 16 Functional Independence Measure (by baseline FIM score) Show forest plot | 3 | Mean Difference (Random, 95% CI) | Subtotals only | |
| 16.1 better (baseline FIM score > median) | 2 | 95 | Mean Difference (Random, 95% CI) | 7.77 [1.39, 14.14] |
| 16.2 worse (baseline FIM score < median) | 1 | 145 | Mean Difference (Random, 95% CI) | 0.3 [‐1.73, 2.33] |
| 17 Functional Independence Measure (by age) Show forest plot | 4 | Mean Difference (Random, 95% CI) | Subtotals only | |
| 17.1 younger (mean age < 85 years) | 2 | 128 | Mean Difference (Random, 95% CI) | 9.91 [4.41, 15.42] |
| 17.2 older (mean age 85+ years) | 2 | 175 | Mean Difference (Random, 95% CI) | 0.35 [‐1.65, 2.34] |
| 18 Functional Independence Measure (by gender) Show forest plot | 4 | Mean Difference (Random, 95% CI) | Subtotals only | |
| 18.1 < 80% female | 2 | 93 | Mean Difference (Random, 95% CI) | 6.11 [‐3.33, 15.55] |
| 18.2 80%+ female | 2 | 210 | Mean Difference (Random, 95% CI) | 4.51 [‐4.56, 13.58] |
| 19 Rivermead Mobility Index (by risk of bias) Show forest plot | 3 | Mean Difference (Random, 95% CI) | Subtotals only | |
| 19.1 lower risk of bias | 3 | 323 | Mean Difference (Random, 95% CI) | 0.69 [0.04, 1.33] |
| 19.2 higher risk of bias | 0 | 0 | Mean Difference (Random, 95% CI) | 0.0 [0.0, 0.0] |
| 20 Rivermead Mobility Index (by duration of intervention) Show forest plot | 3 | Mean Difference (Random, 95% CI) | Subtotals only | |
| 20.1 shorter (< 3 months intervention) | 1 | 49 | Mean Difference (Random, 95% CI) | 0.6 [‐1.48, 2.68] |
| 20.2 longer (3+ months intervention) | 2 | 274 | Mean Difference (Random, 95% CI) | 0.69 [0.02, 1.37] |
| 21 Rivermead Mobility Index (by mode of delivery) Show forest plot | 3 | Mean Difference (Random, 95% CI) | Subtotals only | |
| 21.1 group | 1 | 49 | Mean Difference (Random, 95% CI) | 0.6 [‐1.48, 2.68] |
| 21.2 individual | 2 | 274 | Mean Difference (Random, 95% CI) | 0.69 [0.02, 1.37] |
| 22 Rivermead Mobility Index (by baseline RMI score) Show forest plot | 3 | Mean Difference (Random, 95% CI) | Subtotals only | |
| 22.1 better (baseline RMI score > median) | 2 | 235 | Mean Difference (Random, 95% CI) | 0.70 [0.01, 1.39] |
| 22.2 worse (baseline RMI score < median) | 1 | 88 | Mean Difference (Random, 95% CI) | 0.6 [‐1.17, 2.37] |
| 23 Rivermead Mobility Index (by age) Show forest plot | 3 | Mean Difference (Random, 95% CI) | Subtotals only | |
| 23.1 younger (mean age < 85 years) | 1 | 49 | Mean Difference (Random, 95% CI) | 0.6 [‐1.48, 2.68] |
| 23.2 older (mean age 85+ years) | 2 | 274 | Mean Difference (Random, 95% CI) | 0.69 [0.02, 1.37] |
| 24 Rivermead Mobility Index (by gender) Show forest plot | 3 | Mean Difference (Random, 95% CI) | Subtotals only | |
| 24.1 < 80% female | 2 | 235 | Mean Difference (Random, 95% CI) | 0.70 [0.01, 1.39] |
| 24.2 80%+ female | 1 | 88 | Mean Difference (Random, 95% CI) | 0.6 [‐1.17, 2.37] |
| 25 TUG Test (by risk of bias) Show forest plot | 7 | Mean Difference (Random, 95% CI) | Subtotals only | |
| 25.1 lower risk of bias | 1 | 556 | Mean Difference (Random, 95% CI) | 0.6 [‐5.36, 6.56] |
| 25.2 higher risk of bias | 6 | 329 | Mean Difference (Random, 95% CI) | ‐5.92 [‐11.29, ‐0.54] |
| 26 TUG Test (by duration of intervention) Show forest plot | 7 | Mean Difference (Random, 95% CI) | Subtotals only | |
| 26.1 shorter (< 6 months intervention) | 4 | 185 | Mean Difference (Random, 95% CI) | ‐7.34 [‐13.93, ‐0.75] |
| 26.2 longer (6+ months intervention) | 3 | 700 | Mean Difference (Random, 95% CI) | 0.13 [‐4.28, 4.53] |
| 27 TUG Test (by mode of delivery) Show forest plot | 7 | Mean Difference (Random, 95% CI) | Subtotals only | |
| 27.1 group | 4 | 154 | Mean Difference (Random, 95% CI) | ‐4.98 [‐10.74, 0.77] |
| 27.2 individual | 3 | 731 | Mean Difference (Random, 95% CI) | ‐4.56 [‐14.02, 4.90] |
| 28 TUG Test (by baseline TUG score) Show forest plot | 7 | Mean Difference (Random, 95% CI) | Subtotals only | |
| 28.1 better (baseline TUG score < median) | 4 | 185 | Mean Difference (Random, 95% CI) | ‐7.34 [‐13.93, ‐0.75] |
| 28.2 worse (baseline TUG score > median) | 3 | 700 | Mean Difference (Random, 95% CI) | 0.13 [‐4.28, 4.53] |
| 29 TUG Test (by age) Show forest plot | 7 | Mean Difference (Random, 95% CI) | Subtotals only | |
| 29.1 younger (mean age < 85 years) | 5 | 741 | Mean Difference (Random, 95% CI) | ‐5.39 [‐10.77, ‐0.00] |
| 29.2 older (mean age 85+ years) | 2 | 144 | Mean Difference (Random, 95% CI) | ‐5.40 [‐25.75, 14.96] |
| 30 TUG Test (by gender) Show forest plot | 7 | Mean Difference (Random, 95% CI) | Subtotals only | |
| 30.1 < 80% female | 3 | 594 | Mean Difference (Random, 95% CI) | 0.17 [‐3.90, 4.24] |
| 30.2 80%+ female | 4 | 291 | Mean Difference (Random, 95% CI) | ‐7.55 [‐14.28, ‐0.82] |
| 31 Walking speed (by risk of bias) Show forest plot | 9 | Mean Difference (Random, 95% CI) | Subtotals only | |
| 31.1 lower risk of bias | 1 | 75 | Mean Difference (Random, 95% CI) | ‐0.10 [‐0.21, 0.01] |
| 31.2 higher risk of bias | 8 | 515 | Mean Difference (Random, 95% CI) | 0.04 [0.01, 0.07] |
| 32 Walking speed (by duration of intervention) Show forest plot | 9 | Mean Difference (Random, 95% CI) | Subtotals only | |
| 32.1 shorter (< 3 months intervention) | 3 | 59 | Mean Difference (Random, 95% CI) | 0.24 [‐0.74, 1.22] |
| 32.2 longer (3+ months intervention) | 6 | 531 | Mean Difference (Random, 95% CI) | 0.02 [‐0.03, 0.08] |
| 33 Walking speed (by mode of delivery) Show forest plot | 9 | Mean Difference (Random, 95% CI) | Subtotals only | |
| 33.1 group | 7 | 475 | Mean Difference (Random, 95% CI) | 0.03 [‐0.02, 0.07] |
| 33.2 individual | 1 | 48 | Mean Difference (Random, 95% CI) | 0.26 [‐0.32, 0.83] |
| 33.3 not reported | 1 | 67 | Mean Difference (Random, 95% CI) | ‐0.03 [‐0.19, 0.13] |
| 34 Walking speed (by baseline walking speed) Show forest plot | 9 | Mean Difference (Random, 95% CI) | Subtotals only | |
| 34.1 better (baseline walking speed > median) | 5 | 198 | Mean Difference (Random, 95% CI) | ‐0.00 [‐0.15, 0.14] |
| 34.2 worse (baseline walking speed < median) | 4 | 392 | Mean Difference (Random, 95% CI) | 0.04 [0.01, 0.07] |
| 35 Walking speed (by age) Show forest plot | 9 | Mean Difference (Random, 95% CI) | Subtotals only | |
| 35.1 younger (mean age < 85 years) | 9 | 590 | Mean Difference (Random, 95% CI) | 0.03 [‐0.01, 0.07] |
| 35.2 older (mean age 85+ years) | 0 | 0 | Mean Difference (Random, 95% CI) | 0.0 [0.0, 0.0] |
| 36 Walking speed (by gender) Show forest plot | 9 | Mean Difference (Random, 95% CI) | Subtotals only | |
| 36.1 < 80% female | 5 | 437 | Mean Difference (Random, 95% CI) | 0.01 [‐0.04, 0.07] |
| 36.2 80%+ female | 4 | 153 | Mean Difference (Random, 95% CI) | 0.13 [‐0.02, 0.28] |
| 37 Walking speed (by distance walked) Show forest plot | 9 | Mean Difference (Random, 95% CI) | Subtotals only | |
| 37.1 less far (< 6 metres) | 2 | 185 | Mean Difference (Random, 95% CI) | 0.04 [0.01, 0.07] |
| 37.2 further (6+ metres) | 7 | 405 | Mean Difference (Random, 95% CI) | 0.01 [‐0.06, 0.09] |
| 38 Death (by risk of bias) Show forest plot | 25 | Risk Ratio (M‐H, Random, 95% CI) | Subtotals only | |
| 38.1 lower risk of bias | 6 | 1366 | Risk Ratio (M‐H, Random, 95% CI) | 1.05 [0.76, 1.46] |
| 38.2 higher risk of bias | 19 | 2355 | Risk Ratio (M‐H, Random, 95% CI) | 0.88 [0.71, 1.10] |
| 39 Death (by duration of intervention) Show forest plot | 25 | Risk Ratio (M‐H, Random, 95% CI) | Subtotals only | |
| 39.1 shorter intervention (< 3 months) | 10 | 663 | Risk Ratio (M‐H, Random, 95% CI) | 0.64 [0.18, 2.29] |
| 39.2 longer intervention (3+ months) | 15 | 3058 | Risk Ratio (M‐H, Random, 95% CI) | 0.95 [0.80, 1.14] |
| 40 Death (by mode of delivery) Show forest plot | 25 | Risk Ratio (M‐H, Random, 95% CI) | Subtotals only | |
| 40.1 group | 12 | 1007 | Risk Ratio (M‐H, Random, 95% CI) | 0.82 [0.46, 1.49] |
| 40.2 individual | 9 | 2172 | Risk Ratio (M‐H, Random, 95% CI) | 0.91 [0.70, 1.19] |
| 40.3 group and individual | 1 | 24 | Risk Ratio (M‐H, Random, 95% CI) | 5.0 [0.27, 94.34] |
| 40.4 not reported | 3 | 518 | Risk Ratio (M‐H, Random, 95% CI) | 1.00 [0.73, 1.36] |
| 41 Death (by age) Show forest plot | 25 | Risk Ratio (M‐H, Random, 95% CI) | Subtotals only | |
| 41.1 younger (mean age < 85 years) | 16 | 3001 | Risk Ratio (M‐H, Random, 95% CI) | 0.97 [0.81, 1.17] |
| 41.2 older (mean age 85+ years) | 9 | 720 | Risk Ratio (M‐H, Random, 95% CI) | 0.79 [0.49, 1.27] |
| 42 Death (by gender) Show forest plot | 25 | Risk Ratio (M‐H, Random, 95% CI) | Subtotals only | |
| 42.1 < 80% female | 12 | 2366 | Risk Ratio (M‐H, Random, 95% CI) | 0.98 [0.77, 1.25] |
| 42.2 80%+ female | 12 | 1340 | Risk Ratio (M‐H, Random, 95% CI) | 0.91 [0.71, 1.18] |
| 42.3 not reported | 1 | 15 | Risk Ratio (M‐H, Random, 95% CI) | 0.88 [0.16, 4.68] |
| 43 Sensitivity analysis: Barthel Index (fixed‐effect) Show forest plot | 7 | 857 | Mean Difference (Fixed, 95% CI) | 4.54 [1.59, 7.49] |
| 44 Sensitivity analysis: Barthel Index (cluster trials) Show forest plot | 7 | Mean Difference (Random, 95% CI) | Subtotals only | |
| 44.1 cluster (adjusted) | 5 | 811 | Mean Difference (Random, 95% CI) | 3.08 [‐0.03, 6.19] |
| 44.2 individual | 2 | 46 | Mean Difference (Random, 95% CI) | 17.55 [6.97, 28.13] |
| 45 Sensitivity analysis: Functional Independence Measure (fixed‐effect) Show forest plot | 4 | 303 | Mean Difference (Fixed, 95% CI) | 1.46 [‐0.42, 3.34] |
| 46 Sensitivity analysis: Rivermead Mobility Index (fixed‐effect) Show forest plot | 3 | 323 | Mean Difference (Fixed, 95% CI) | 0.69 [0.04, 1.33] |
| 47 Sensitivity analysis: TUG Test (fixed‐effect) Show forest plot | 7 | 885 | Mean Difference (Fixed, 95% CI) | ‐3.66 [‐5.86, ‐1.45] |
| 48 Sensitivity anlaysis: TUG Test (cluster trials) Show forest plot | 7 | Mean Difference (Random, 95% CI) | Subtotals only | |
| 48.1 cluster (adjusted) | 2 | Mean Difference (Random, 95% CI) | 0.51 [‐3.93, 4.95] | |
| 48.2 individual | 5 | Mean Difference (Random, 95% CI) | ‐7.85 [‐14.34, ‐1.37] | |
| 49 Sensitivity analysis: TUG Test (re‐including Christofoletti 2008) Show forest plot | 8 | 914 | Mean Difference (Random, 95% CI) | ‐8.41 [‐15.53, ‐1.29] |
| 50 Sensitivity analysis: Walking speed (fixed‐effect) Show forest plot | 9 | 590 | Mean Difference (Fixed, 95% CI) | 0.03 [0.00, 0.06] |
| 51 Sensitivity analysis: Walking speed (cluster trials) Show forest plot | 9 | Mean Difference (Random, 95% CI) | Subtotals only | |
| 51.1 cluster (unadjusted) | 1 | Mean Difference (Random, 95% CI) | 0.04 [0.01, 0.07] | |
| 51.2 individual | 8 | Mean Difference (Random, 95% CI) | 0.01 [‐0.05, 0.08] | |
| 52 Sensitivity analysis: Death (random‐effects: odds ratio) Show forest plot | 25 | 3721 | Odds Ratio (M‐H, Random, 95% CI) | 0.93 [0.75, 1.15] |
| 53 Sensitivity analysis: Death (random‐effects: risk difference) Show forest plot | 25 | 3721 | Risk Difference (M‐H, Random, 95% CI) | ‐0.01 [‐0.02, 0.01] |
| 54 Sensitivity analysis: Death (fixed‐effect) Show forest plot | 25 | 3721 | Risk Ratio (M‐H, Random, 95% CI) | 0.95 [0.80, 1.13] |
| 55 Sensitivity analysis: Death (fixed‐effect: Peto odds ratio) Show forest plot | 25 | 3721 | Peto Odds Ratio (Peto, Fixed, 95% CI) | 0.93 [0.75, 1.14] |
| 56 Sensitivity analysis: Death (cluster trials) Show forest plot | 25 | Risk Ratio (M‐H, Random, 95% CI) | Subtotals only | |
| 56.1 cluster (unadjusted) | 13 | 2644 | Risk Ratio (M‐H, Random, 95% CI) | 0.95 [0.79, 1.15] |
| 56.2 individual | 12 | 1077 | Risk Ratio (M‐H, Random, 95% CI) | 0.93 [0.60, 1.44] |
| 57 Sensitivity analysis: Death (including Brittle 2009) Show forest plot | 26 | 3777 | Risk Ratio (M‐H, Random, 95% CI) | 0.94 [0.79, 1.11] |
| Outcome or subgroup title | No. of studies | No. of participants | Statistical method | Effect size |
| 1 TUG Test Show forest plot | 2 | 57 | Mean Difference (Random, 95% CI) | ‐7.95 [‐19.22, 3.31] |
| 2 Death Show forest plot | 4 | 118 | Risk Ratio (M‐H, Random, 95% CI) | 2.67 [0.12, 60.93] |
| 3 Sensitivity analysis: TUG Test (fixed‐effect) Show forest plot | 2 | 57 | Mean Difference (Fixed, 95% CI) | ‐7.19 [‐10.92, ‐3.46] |