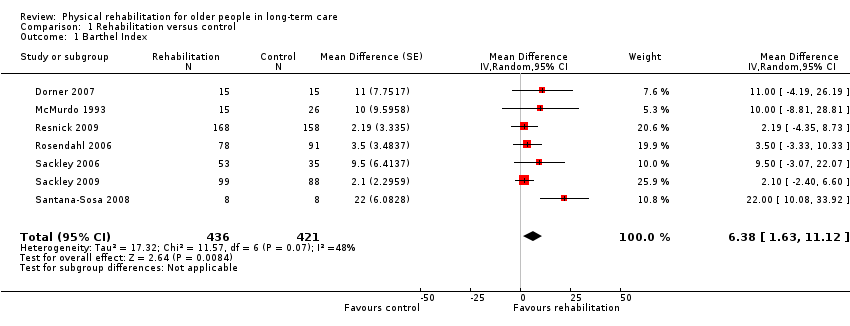
| 1 Barthel Index Show forest plot | 7 | 857 | Mean Difference (Random, 95% CI) | 6.38 [1.63, 11.12] |
|
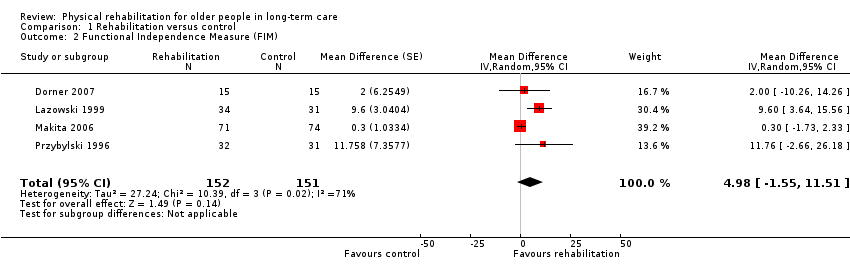
| 2 Functional Independence Measure (FIM) Show forest plot | 4 | 303 | Mean Difference (Random, 95% CI) | 4.98 [‐1.55, 11.51] |
|
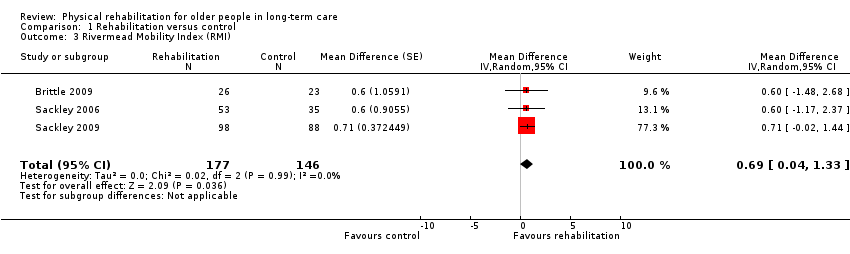
| 3 Rivermead Mobility Index (RMI) Show forest plot | 3 | 323 | Mean Difference (Random, 95% CI) | 0.69 [0.04, 1.33] |
|
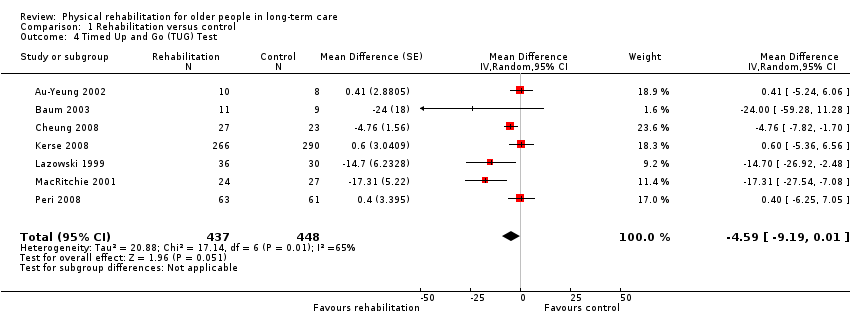
| 4 Timed Up and Go (TUG) Test Show forest plot | 7 | 885 | Mean Difference (Random, 95% CI) | ‐4.59 [‐9.19, 0.01] |
|
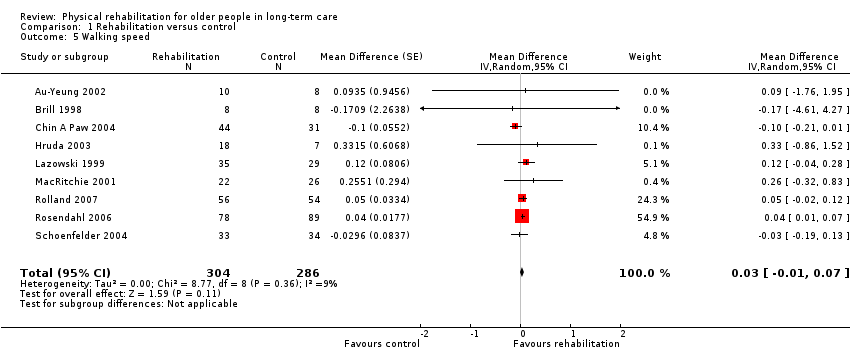
| 5 Walking speed Show forest plot | 9 | 590 | Mean Difference (Random, 95% CI) | 0.03 [‐0.01, 0.07] |
|
| 6 Death Show forest plot | 25 | 3721 | Risk Ratio (M‐H, Random, 95% CI) | 0.95 [0.80, 1.13] |
|
| 7 Barthel Index (by risk of bias) Show forest plot | 7 | | Mean Difference (Random, 95% CI) | Subtotals only |
|
| 7.1 lower risk of bias | 2 | 275 | Mean Difference (Random, 95% CI) | 3.38 [‐2.10, 8.86] |
| 7.2 higher risk of bias | 5 | 582 | Mean Difference (Random, 95% CI) | 8.25 [1.15, 15.34] |
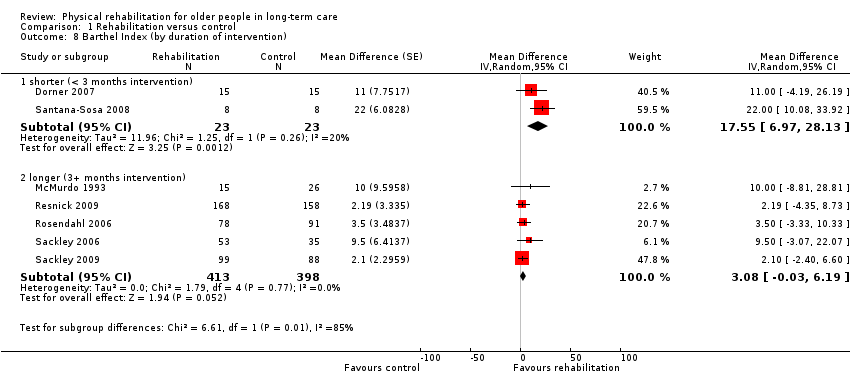
| 8 Barthel Index (by duration of intervention) Show forest plot | 7 | | Mean Difference (Random, 95% CI) | Subtotals only |
|
| 8.1 shorter (< 3 months intervention) | 2 | 46 | Mean Difference (Random, 95% CI) | 17.55 [6.97, 28.13] |
| 8.2 longer (3+ months intervention) | 5 | 811 | Mean Difference (Random, 95% CI) | 3.08 [‐0.03, 6.19] |
| 9 Barthel Index (by mode of delivery) Show forest plot | 7 | | Mean Difference (Random, 95% CI) | Subtotals only |
|
| 9.1 group | 4 | 256 | Mean Difference (Random, 95% CI) | 10.99 [1.51, 20.48] |
| 9.2 individual | 2 | 275 | Mean Difference (Random, 95% CI) | 3.38 [‐2.10, 8.86] |
| 9.3 not reported | 1 | 326 | Mean Difference (Random, 95% CI) | 2.19 [‐4.35, 8.73] |
| 10 Barthel Index (by baseline Barthel Index score) Show forest plot | 6 | | Mean Difference (Random, 95% CI) | Subtotals only |
|
| 10.1 better (baseline Barthel Index score > median) | 3 | 511 | Mean Difference (Random, 95% CI) | 7.94 [‐1.77, 17.64] |
| 10.2 worse (baseline Barthel Index score < median) | 3 | 305 | Mean Difference (Random, 95% CI) | 3.97 [‐0.83, 8.78] |
| 11 Barthel Index (by age) Show forest plot | 7 | | Mean Difference (Random, 95% CI) | Subtotals only |
|
| 11.1 younger (mean age < 85 years) | 4 | 552 | Mean Difference (Random, 95% CI) | 8.02 [‐0.25, 16.30] |
| 11.2 older (mean age 85+ years) | 3 | 305 | Mean Difference (Random, 95% CI) | 3.97 [‐0.83, 8.78] |
| 12 Barthel Index (by gender) Show forest plot | 7 | | Mean Difference (Random, 95% CI) | Subtotals only |
|
| 12.1 < 80% female | 4 | 402 | Mean Difference (Random, 95% CI) | 7.93 [0.18, 15.69] |
| 12.2 80%+ female | 3 | 455 | Mean Difference (Random, 95% CI) | 4.29 [‐1.25, 9.83] |
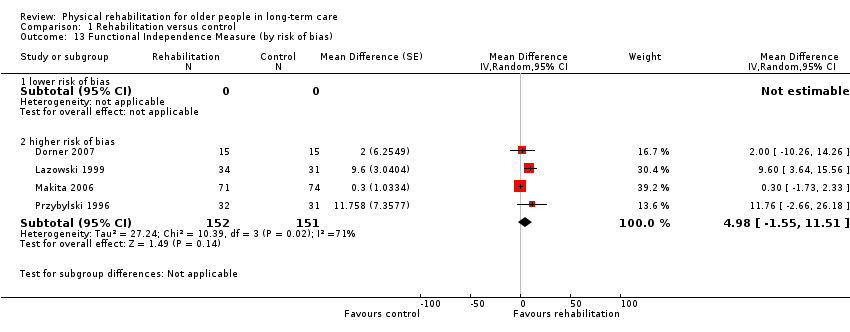
| 13 Functional Independence Measure (by risk of bias) Show forest plot | 4 | | Mean Difference (Random, 95% CI) | Subtotals only |
|
| 13.1 lower risk of bias | 0 | 0 | Mean Difference (Random, 95% CI) | 0.0 [0.0, 0.0] |
| 13.2 higher risk of bias | 4 | 303 | Mean Difference (Random, 95% CI) | 4.98 [‐1.55, 11.51] |
| 14 Functional Independence Measure (by duration of intervention) Show forest plot | 4 | | Mean Difference (Random, 95% CI) | Subtotals only |
|
| 14.1 shorter (< 3 months intervention) | 1 | 30 | Mean Difference (Random, 95% CI) | 2.0 [‐10.26, 14.26] |
| 14.2 longer (3+ months intervention) | 3 | 273 | Mean Difference (Random, 95% CI) | 5.85 [‐2.22, 13.93] |
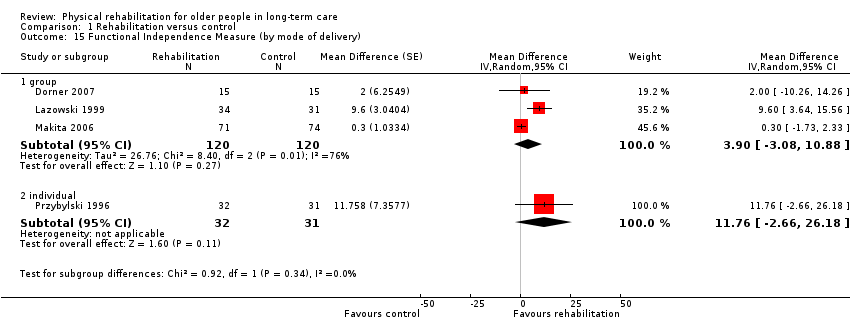
| 15 Functional Independence Measure (by mode of delivery) Show forest plot | 4 | | Mean Difference (Random, 95% CI) | Subtotals only |
|
| 15.1 group | 3 | 240 | Mean Difference (Random, 95% CI) | 3.90 [‐3.08, 10.88] |
| 15.2 individual | 1 | 63 | Mean Difference (Random, 95% CI) | 11.76 [‐2.66, 26.18] |
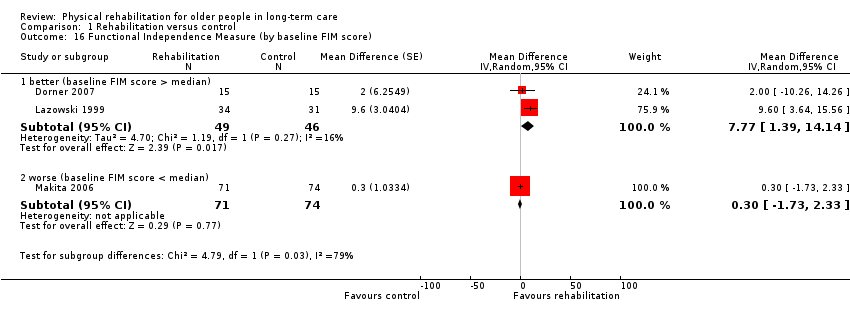
| 16 Functional Independence Measure (by baseline FIM score) Show forest plot | 3 | | Mean Difference (Random, 95% CI) | Subtotals only |
|
| 16.1 better (baseline FIM score > median) | 2 | 95 | Mean Difference (Random, 95% CI) | 7.77 [1.39, 14.14] |
| 16.2 worse (baseline FIM score < median) | 1 | 145 | Mean Difference (Random, 95% CI) | 0.3 [‐1.73, 2.33] |
| 17 Functional Independence Measure (by age) Show forest plot | 4 | | Mean Difference (Random, 95% CI) | Subtotals only |
|
| 17.1 younger (mean age < 85 years) | 2 | 128 | Mean Difference (Random, 95% CI) | 9.91 [4.41, 15.42] |
| 17.2 older (mean age 85+ years) | 2 | 175 | Mean Difference (Random, 95% CI) | 0.35 [‐1.65, 2.34] |
| 18 Functional Independence Measure (by gender) Show forest plot | 4 | | Mean Difference (Random, 95% CI) | Subtotals only |
|
| 18.1 < 80% female | 2 | 93 | Mean Difference (Random, 95% CI) | 6.11 [‐3.33, 15.55] |
| 18.2 80%+ female | 2 | 210 | Mean Difference (Random, 95% CI) | 4.51 [‐4.56, 13.58] |
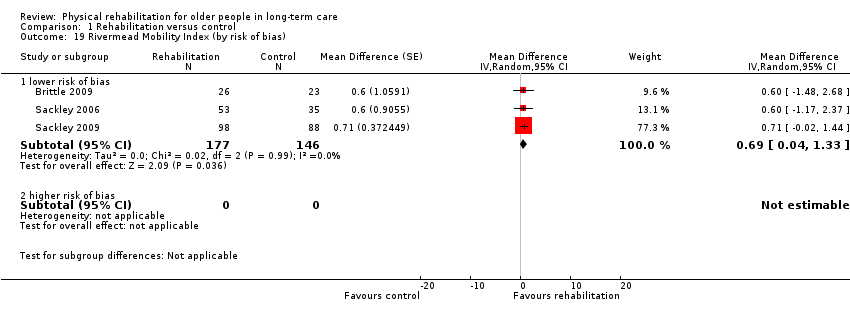
| 19 Rivermead Mobility Index (by risk of bias) Show forest plot | 3 | | Mean Difference (Random, 95% CI) | Subtotals only |
|
| 19.1 lower risk of bias | 3 | 323 | Mean Difference (Random, 95% CI) | 0.69 [0.04, 1.33] |
| 19.2 higher risk of bias | 0 | 0 | Mean Difference (Random, 95% CI) | 0.0 [0.0, 0.0] |
| 20 Rivermead Mobility Index (by duration of intervention) Show forest plot | 3 | | Mean Difference (Random, 95% CI) | Subtotals only |
|
| 20.1 shorter (< 3 months intervention) | 1 | 49 | Mean Difference (Random, 95% CI) | 0.6 [‐1.48, 2.68] |
| 20.2 longer (3+ months intervention) | 2 | 274 | Mean Difference (Random, 95% CI) | 0.69 [0.02, 1.37] |
| 21 Rivermead Mobility Index (by mode of delivery) Show forest plot | 3 | | Mean Difference (Random, 95% CI) | Subtotals only |
|
| 21.1 group | 1 | 49 | Mean Difference (Random, 95% CI) | 0.6 [‐1.48, 2.68] |
| 21.2 individual | 2 | 274 | Mean Difference (Random, 95% CI) | 0.69 [0.02, 1.37] |
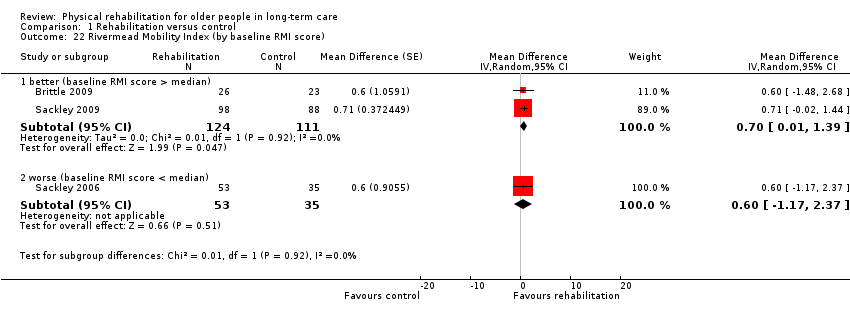
| 22 Rivermead Mobility Index (by baseline RMI score) Show forest plot | 3 | | Mean Difference (Random, 95% CI) | Subtotals only |
|
| 22.1 better (baseline RMI score > median) | 2 | 235 | Mean Difference (Random, 95% CI) | 0.70 [0.01, 1.39] |
| 22.2 worse (baseline RMI score < median) | 1 | 88 | Mean Difference (Random, 95% CI) | 0.6 [‐1.17, 2.37] |
| 23 Rivermead Mobility Index (by age) Show forest plot | 3 | | Mean Difference (Random, 95% CI) | Subtotals only |
|
| 23.1 younger (mean age < 85 years) | 1 | 49 | Mean Difference (Random, 95% CI) | 0.6 [‐1.48, 2.68] |
| 23.2 older (mean age 85+ years) | 2 | 274 | Mean Difference (Random, 95% CI) | 0.69 [0.02, 1.37] |
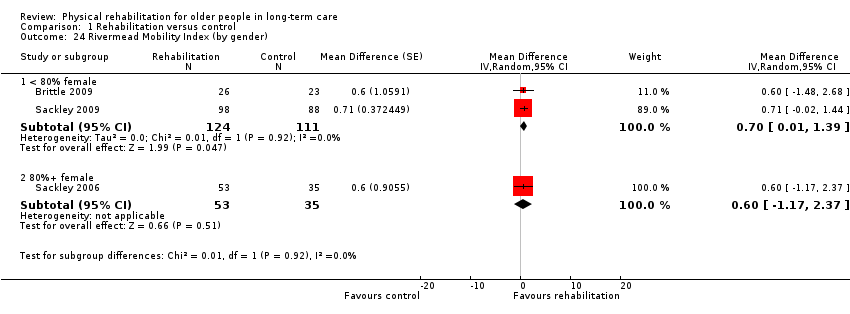
| 24 Rivermead Mobility Index (by gender) Show forest plot | 3 | | Mean Difference (Random, 95% CI) | Subtotals only |
|
| 24.1 < 80% female | 2 | 235 | Mean Difference (Random, 95% CI) | 0.70 [0.01, 1.39] |
| 24.2 80%+ female | 1 | 88 | Mean Difference (Random, 95% CI) | 0.6 [‐1.17, 2.37] |
| 25 TUG Test (by risk of bias) Show forest plot | 7 | | Mean Difference (Random, 95% CI) | Subtotals only |
|
| 25.1 lower risk of bias | 1 | 556 | Mean Difference (Random, 95% CI) | 0.6 [‐5.36, 6.56] |
| 25.2 higher risk of bias | 6 | 329 | Mean Difference (Random, 95% CI) | ‐5.92 [‐11.29, ‐0.54] |
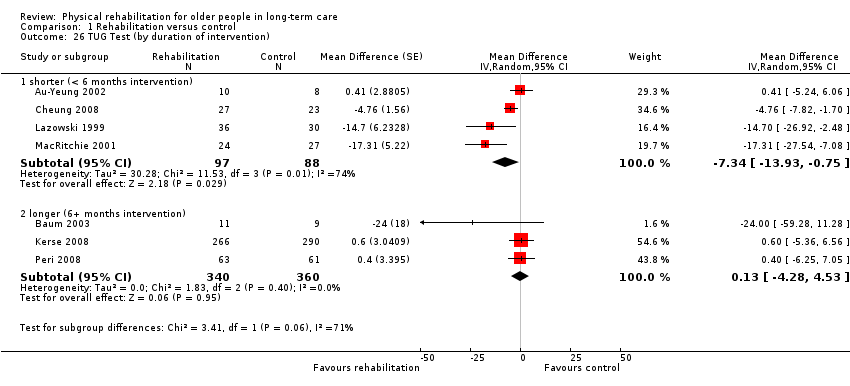
| 26 TUG Test (by duration of intervention) Show forest plot | 7 | | Mean Difference (Random, 95% CI) | Subtotals only |
|
| 26.1 shorter (< 6 months intervention) | 4 | 185 | Mean Difference (Random, 95% CI) | ‐7.34 [‐13.93, ‐0.75] |
| 26.2 longer (6+ months intervention) | 3 | 700 | Mean Difference (Random, 95% CI) | 0.13 [‐4.28, 4.53] |
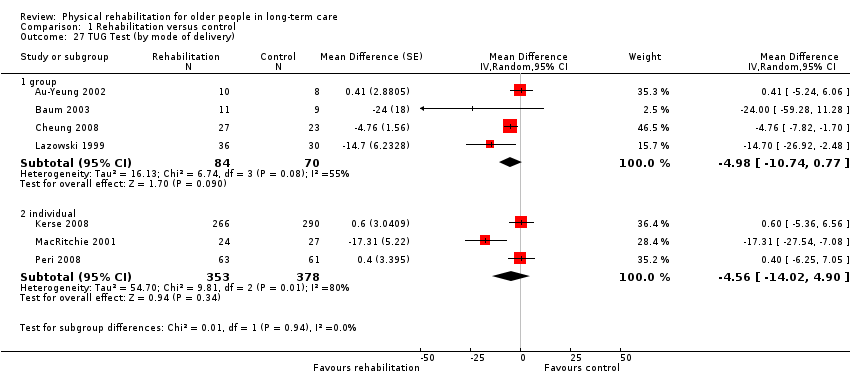
| 27 TUG Test (by mode of delivery) Show forest plot | 7 | | Mean Difference (Random, 95% CI) | Subtotals only |
|
| 27.1 group | 4 | 154 | Mean Difference (Random, 95% CI) | ‐4.98 [‐10.74, 0.77] |
| 27.2 individual | 3 | 731 | Mean Difference (Random, 95% CI) | ‐4.56 [‐14.02, 4.90] |
| 28 TUG Test (by baseline TUG score) Show forest plot | 7 | | Mean Difference (Random, 95% CI) | Subtotals only |
|
| 28.1 better (baseline TUG score < median) | 4 | 185 | Mean Difference (Random, 95% CI) | ‐7.34 [‐13.93, ‐0.75] |
| 28.2 worse (baseline TUG score > median) | 3 | 700 | Mean Difference (Random, 95% CI) | 0.13 [‐4.28, 4.53] |
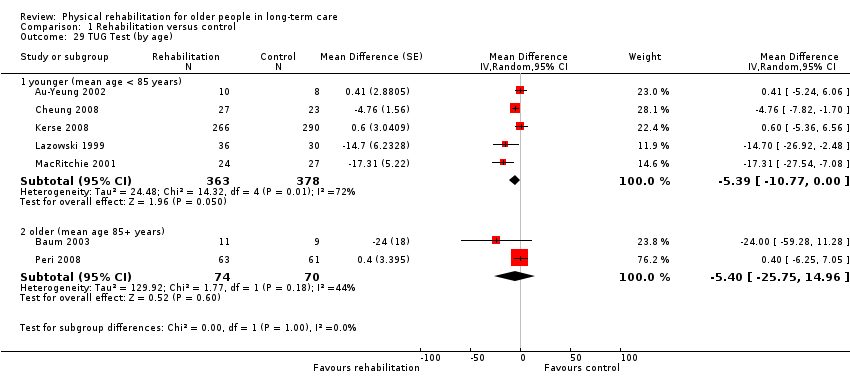
| 29 TUG Test (by age) Show forest plot | 7 | | Mean Difference (Random, 95% CI) | Subtotals only |
|
| 29.1 younger (mean age < 85 years) | 5 | 741 | Mean Difference (Random, 95% CI) | ‐5.39 [‐10.77, ‐0.00] |
| 29.2 older (mean age 85+ years) | 2 | 144 | Mean Difference (Random, 95% CI) | ‐5.40 [‐25.75, 14.96] |
| 30 TUG Test (by gender) Show forest plot | 7 | | Mean Difference (Random, 95% CI) | Subtotals only |
|
| 30.1 < 80% female | 3 | 594 | Mean Difference (Random, 95% CI) | 0.17 [‐3.90, 4.24] |
| 30.2 80%+ female | 4 | 291 | Mean Difference (Random, 95% CI) | ‐7.55 [‐14.28, ‐0.82] |
| 31 Walking speed (by risk of bias) Show forest plot | 9 | | Mean Difference (Random, 95% CI) | Subtotals only |
|
| 31.1 lower risk of bias | 1 | 75 | Mean Difference (Random, 95% CI) | ‐0.10 [‐0.21, 0.01] |
| 31.2 higher risk of bias | 8 | 515 | Mean Difference (Random, 95% CI) | 0.04 [0.01, 0.07] |
| 32 Walking speed (by duration of intervention) Show forest plot | 9 | | Mean Difference (Random, 95% CI) | Subtotals only |
|
| 32.1 shorter (< 3 months intervention) | 3 | 59 | Mean Difference (Random, 95% CI) | 0.24 [‐0.74, 1.22] |
| 32.2 longer (3+ months intervention) | 6 | 531 | Mean Difference (Random, 95% CI) | 0.02 [‐0.03, 0.08] |
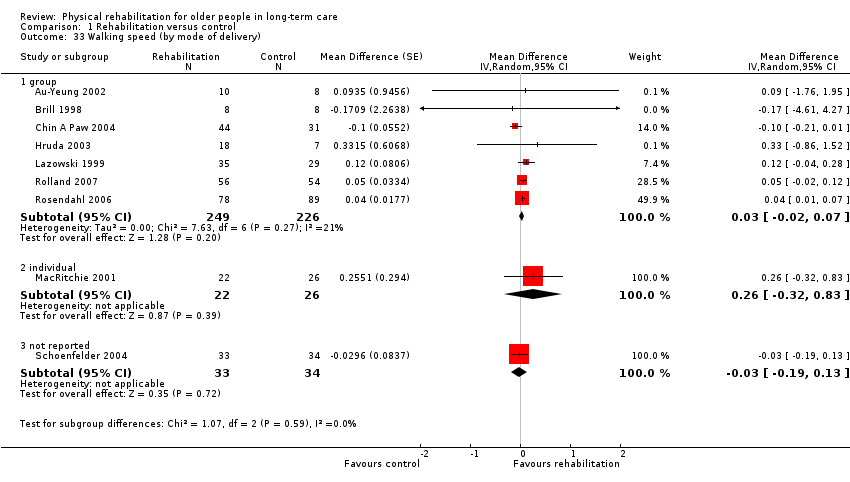
| 33 Walking speed (by mode of delivery) Show forest plot | 9 | | Mean Difference (Random, 95% CI) | Subtotals only |
|
| 33.1 group | 7 | 475 | Mean Difference (Random, 95% CI) | 0.03 [‐0.02, 0.07] |
| 33.2 individual | 1 | 48 | Mean Difference (Random, 95% CI) | 0.26 [‐0.32, 0.83] |
| 33.3 not reported | 1 | 67 | Mean Difference (Random, 95% CI) | ‐0.03 [‐0.19, 0.13] |
| 34 Walking speed (by baseline walking speed) Show forest plot | 9 | | Mean Difference (Random, 95% CI) | Subtotals only |
|
| 34.1 better (baseline walking speed > median) | 5 | 198 | Mean Difference (Random, 95% CI) | ‐0.00 [‐0.15, 0.14] |
| 34.2 worse (baseline walking speed < median) | 4 | 392 | Mean Difference (Random, 95% CI) | 0.04 [0.01, 0.07] |
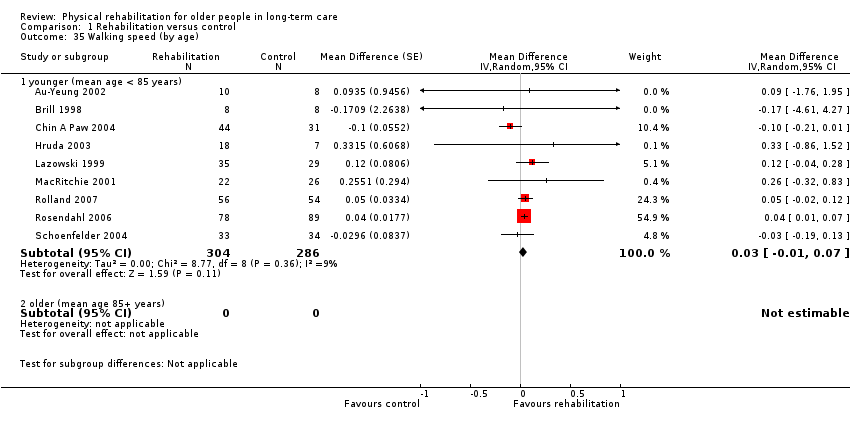
| 35 Walking speed (by age) Show forest plot | 9 | | Mean Difference (Random, 95% CI) | Subtotals only |
|
| 35.1 younger (mean age < 85 years) | 9 | 590 | Mean Difference (Random, 95% CI) | 0.03 [‐0.01, 0.07] |
| 35.2 older (mean age 85+ years) | 0 | 0 | Mean Difference (Random, 95% CI) | 0.0 [0.0, 0.0] |
| 36 Walking speed (by gender) Show forest plot | 9 | | Mean Difference (Random, 95% CI) | Subtotals only |
|
| 36.1 < 80% female | 5 | 437 | Mean Difference (Random, 95% CI) | 0.01 [‐0.04, 0.07] |
| 36.2 80%+ female | 4 | 153 | Mean Difference (Random, 95% CI) | 0.13 [‐0.02, 0.28] |
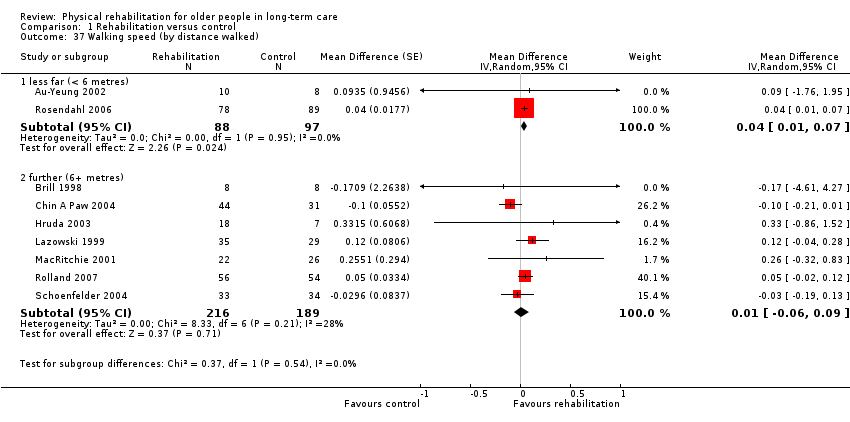
| 37 Walking speed (by distance walked) Show forest plot | 9 | | Mean Difference (Random, 95% CI) | Subtotals only |
|
| 37.1 less far (< 6 metres) | 2 | 185 | Mean Difference (Random, 95% CI) | 0.04 [0.01, 0.07] |
| 37.2 further (6+ metres) | 7 | 405 | Mean Difference (Random, 95% CI) | 0.01 [‐0.06, 0.09] |
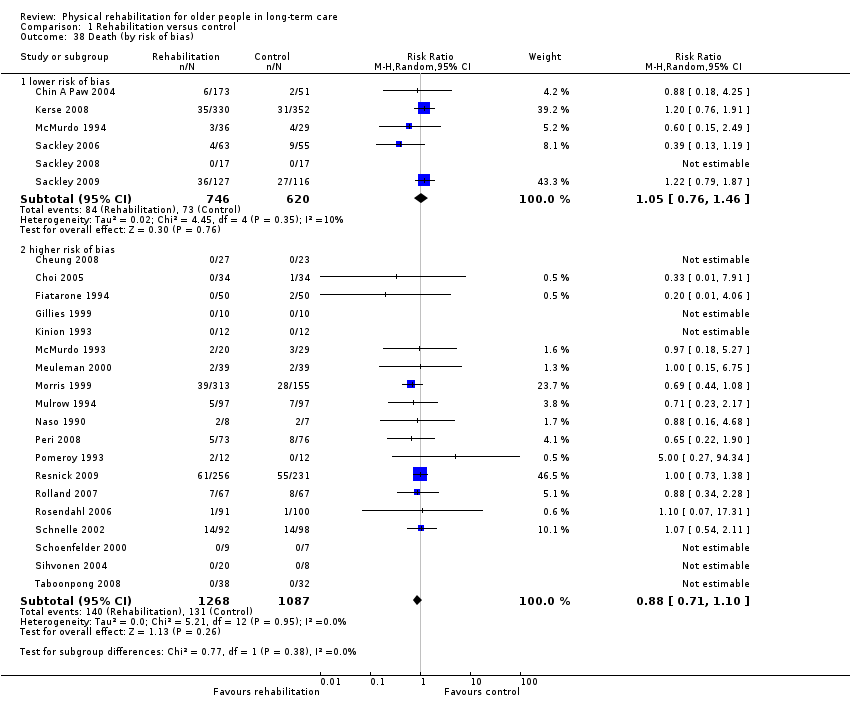
| 38 Death (by risk of bias) Show forest plot | 25 | | Risk Ratio (M‐H, Random, 95% CI) | Subtotals only |
|
| 38.1 lower risk of bias | 6 | 1366 | Risk Ratio (M‐H, Random, 95% CI) | 1.05 [0.76, 1.46] |
| 38.2 higher risk of bias | 19 | 2355 | Risk Ratio (M‐H, Random, 95% CI) | 0.88 [0.71, 1.10] |
| 39 Death (by duration of intervention) Show forest plot | 25 | | Risk Ratio (M‐H, Random, 95% CI) | Subtotals only |
|
| 39.1 shorter intervention (< 3 months) | 10 | 663 | Risk Ratio (M‐H, Random, 95% CI) | 0.64 [0.18, 2.29] |
| 39.2 longer intervention (3+ months) | 15 | 3058 | Risk Ratio (M‐H, Random, 95% CI) | 0.95 [0.80, 1.14] |
| 40 Death (by mode of delivery) Show forest plot | 25 | | Risk Ratio (M‐H, Random, 95% CI) | Subtotals only |
|
| 40.1 group | 12 | 1007 | Risk Ratio (M‐H, Random, 95% CI) | 0.82 [0.46, 1.49] |
| 40.2 individual | 9 | 2172 | Risk Ratio (M‐H, Random, 95% CI) | 0.91 [0.70, 1.19] |
| 40.3 group and individual | 1 | 24 | Risk Ratio (M‐H, Random, 95% CI) | 5.0 [0.27, 94.34] |
| 40.4 not reported | 3 | 518 | Risk Ratio (M‐H, Random, 95% CI) | 1.00 [0.73, 1.36] |
| 41 Death (by age) Show forest plot | 25 | | Risk Ratio (M‐H, Random, 95% CI) | Subtotals only |
|
| 41.1 younger (mean age < 85 years) | 16 | 3001 | Risk Ratio (M‐H, Random, 95% CI) | 0.97 [0.81, 1.17] |
| 41.2 older (mean age 85+ years) | 9 | 720 | Risk Ratio (M‐H, Random, 95% CI) | 0.79 [0.49, 1.27] |
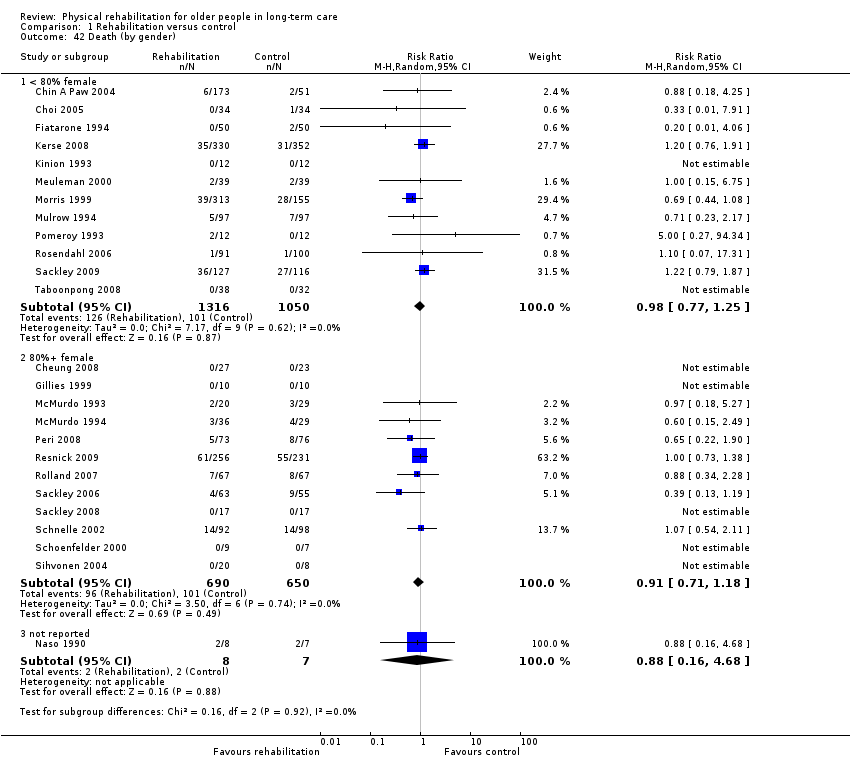
| 42 Death (by gender) Show forest plot | 25 | | Risk Ratio (M‐H, Random, 95% CI) | Subtotals only |
|
| 42.1 < 80% female | 12 | 2366 | Risk Ratio (M‐H, Random, 95% CI) | 0.98 [0.77, 1.25] |
| 42.2 80%+ female | 12 | 1340 | Risk Ratio (M‐H, Random, 95% CI) | 0.91 [0.71, 1.18] |
| 42.3 not reported | 1 | 15 | Risk Ratio (M‐H, Random, 95% CI) | 0.88 [0.16, 4.68] |
| 43 Sensitivity analysis: Barthel Index (fixed‐effect) Show forest plot | 7 | 857 | Mean Difference (Fixed, 95% CI) | 4.54 [1.59, 7.49] |
|
| 44 Sensitivity analysis: Barthel Index (cluster trials) Show forest plot | 7 | | Mean Difference (Random, 95% CI) | Subtotals only |
|
| 44.1 cluster (adjusted) | 5 | 811 | Mean Difference (Random, 95% CI) | 3.08 [‐0.03, 6.19] |
| 44.2 individual | 2 | 46 | Mean Difference (Random, 95% CI) | 17.55 [6.97, 28.13] |
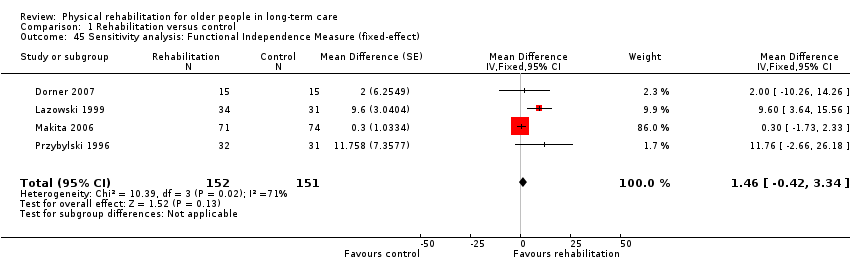
| 45 Sensitivity analysis: Functional Independence Measure (fixed‐effect) Show forest plot | 4 | 303 | Mean Difference (Fixed, 95% CI) | 1.46 [‐0.42, 3.34] |
|
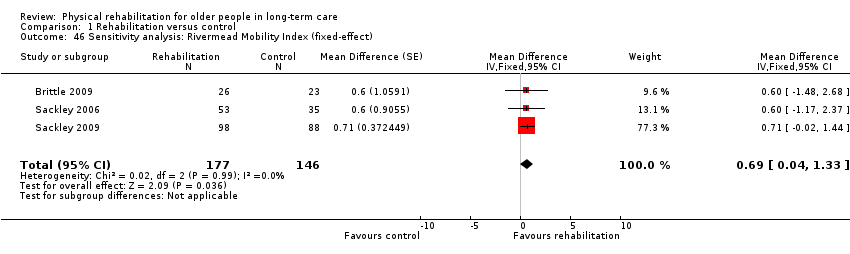
| 46 Sensitivity analysis: Rivermead Mobility Index (fixed‐effect) Show forest plot | 3 | 323 | Mean Difference (Fixed, 95% CI) | 0.69 [0.04, 1.33] |
|
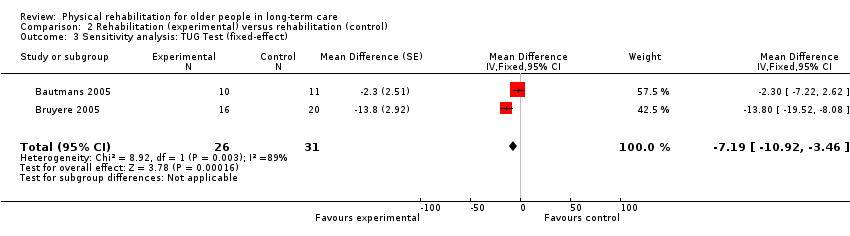
| 47 Sensitivity analysis: TUG Test (fixed‐effect) Show forest plot | 7 | 885 | Mean Difference (Fixed, 95% CI) | ‐3.66 [‐5.86, ‐1.45] |
|
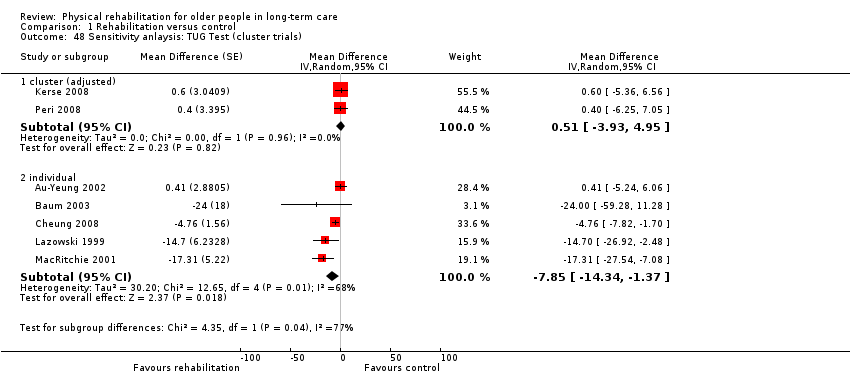
| 48 Sensitivity anlaysis: TUG Test (cluster trials) Show forest plot | 7 | | Mean Difference (Random, 95% CI) | Subtotals only |
|
| 48.1 cluster (adjusted) | 2 | | Mean Difference (Random, 95% CI) | 0.51 [‐3.93, 4.95] |
| 48.2 individual | 5 | | Mean Difference (Random, 95% CI) | ‐7.85 [‐14.34, ‐1.37] |
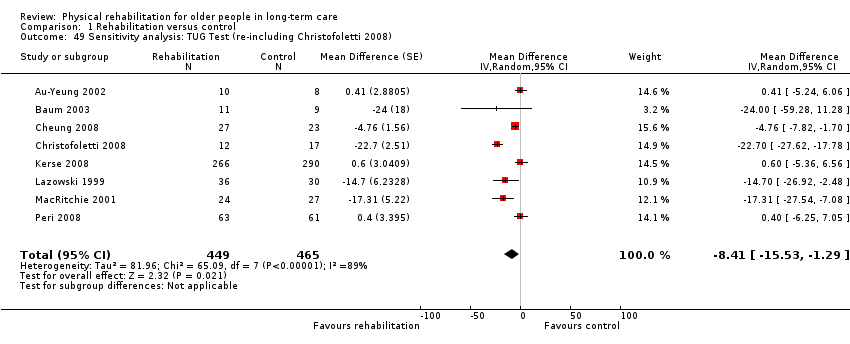
| 49 Sensitivity analysis: TUG Test (re‐including Christofoletti 2008) Show forest plot | 8 | 914 | Mean Difference (Random, 95% CI) | ‐8.41 [‐15.53, ‐1.29] |
|
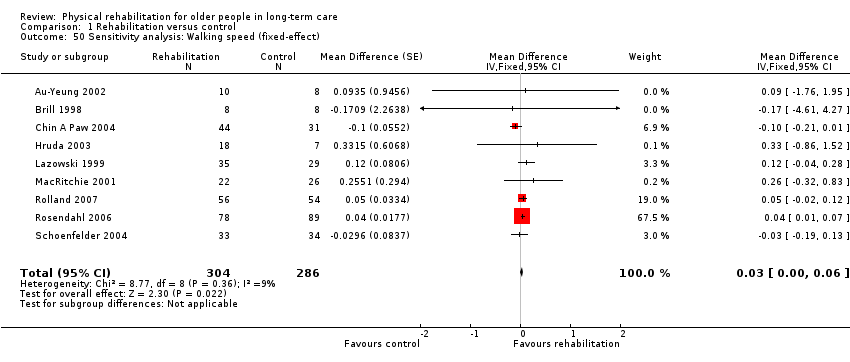
| 50 Sensitivity analysis: Walking speed (fixed‐effect) Show forest plot | 9 | 590 | Mean Difference (Fixed, 95% CI) | 0.03 [0.00, 0.06] |
|
| 51 Sensitivity analysis: Walking speed (cluster trials) Show forest plot | 9 | | Mean Difference (Random, 95% CI) | Subtotals only |
|
| 51.1 cluster (unadjusted) | 1 | | Mean Difference (Random, 95% CI) | 0.04 [0.01, 0.07] |
| 51.2 individual | 8 | | Mean Difference (Random, 95% CI) | 0.01 [‐0.05, 0.08] |
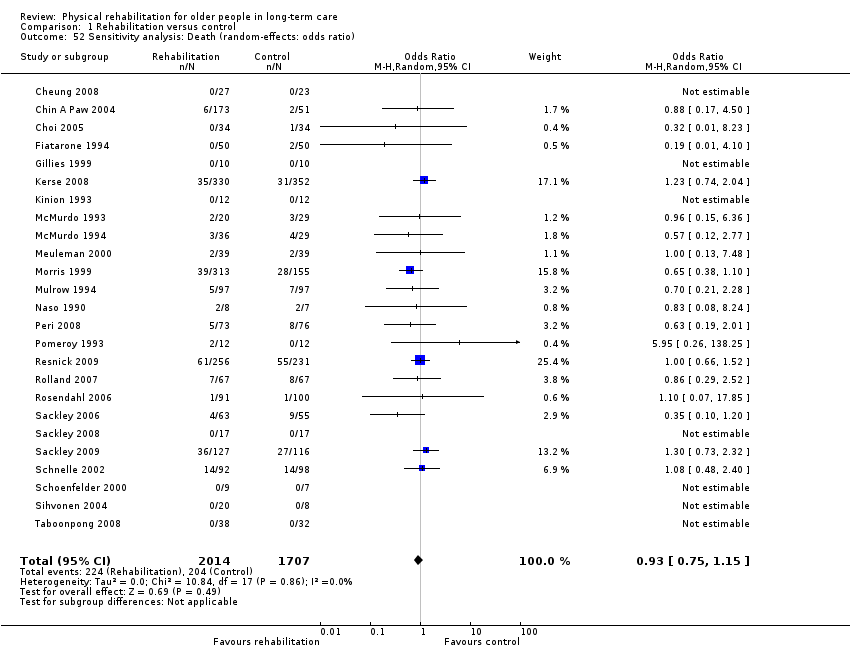
| 52 Sensitivity analysis: Death (random‐effects: odds ratio) Show forest plot | 25 | 3721 | Odds Ratio (M‐H, Random, 95% CI) | 0.93 [0.75, 1.15] |
|
| 53 Sensitivity analysis: Death (random‐effects: risk difference) Show forest plot | 25 | 3721 | Risk Difference (M‐H, Random, 95% CI) | ‐0.01 [‐0.02, 0.01] |
|
| 54 Sensitivity analysis: Death (fixed‐effect) Show forest plot | 25 | 3721 | Risk Ratio (M‐H, Random, 95% CI) | 0.95 [0.80, 1.13] |
|
| 55 Sensitivity analysis: Death (fixed‐effect: Peto odds ratio) Show forest plot | 25 | 3721 | Peto Odds Ratio (Peto, Fixed, 95% CI) | 0.93 [0.75, 1.14] |
|
| 56 Sensitivity analysis: Death (cluster trials) Show forest plot | 25 | | Risk Ratio (M‐H, Random, 95% CI) | Subtotals only |
|
| 56.1 cluster (unadjusted) | 13 | 2644 | Risk Ratio (M‐H, Random, 95% CI) | 0.95 [0.79, 1.15] |
| 56.2 individual | 12 | 1077 | Risk Ratio (M‐H, Random, 95% CI) | 0.93 [0.60, 1.44] |
| 57 Sensitivity analysis: Death (including Brittle 2009) Show forest plot | 26 | 3777 | Risk Ratio (M‐H, Random, 95% CI) | 0.94 [0.79, 1.11] |
|