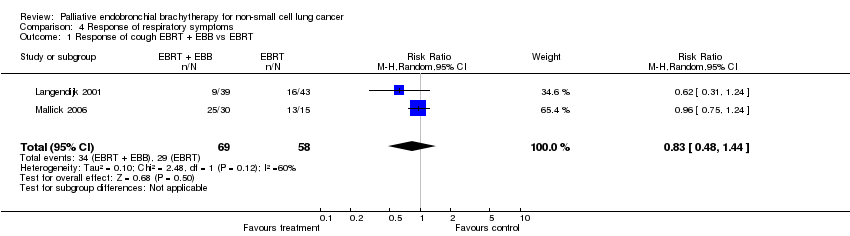
| 1 Response of cough EBRT + EBB vs EBRT Show forest plot | 2 | 127 | Risk Ratio (M‐H, Random, 95% CI) | 0.83 [0.48, 1.44] |
|
| 2 Response rate of hemoptysis (EBRT + EBB) vs EBRT Show forest plot | 1 | | Risk Ratio (M‐H, Fixed, 95% CI) | Totals not selected |
|
| 3 Response rate of chest pain (EBRT + EBB) vs EBRT Show forest plot | 1 | | Risk Ratio (M‐H, Fixed, 95% CI) | Totals not selected |
|
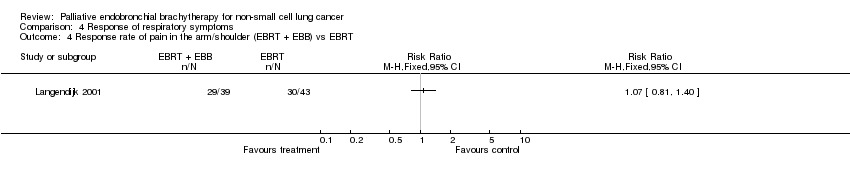
| 4 Response rate of pain in the arm/shoulder (EBRT + EBB) vs EBRT Show forest plot | 1 | | Risk Ratio (M‐H, Fixed, 95% CI) | Totals not selected |
|
| 5 Positive cough response at 8 weeks‐ Clinician assessment (EBB vs EBRT) Show forest plot | 1 | | Risk Ratio (M‐H, Fixed, 95% CI) | Totals not selected |
|
| 6 Positive hemoptysis response at 8 weeks ‐ Clinician assessment (EBB vs EBRT) Show forest plot | 1 | | Risk Ratio (M‐H, Fixed, 95% CI) | Totals not selected |
|
| 7 Positive breathlessness response at 8 weeks ‐ Clinician assessment (EBB vs EBRT) Show forest plot | 1 | | Risk Ratio (M‐H, Fixed, 95% CI) | Totals not selected |
|
| 8 Positive chest pain response at 8 weeks ‐ Clinician assessment (EBB vs EBRT) Show forest plot | 1 | | Risk Ratio (M‐H, Fixed, 95% CI) | Totals not selected |
|
| 9 Positive dysphagia response at 8 weeks ‐ Clinician assessment (EBB vs EBRT) Show forest plot | 1 | | Risk Ratio (M‐H, Fixed, 95% CI) | Totals not selected |
|
| 10 Positive anorexia response at 8 weeks ‐ Clinician assessment (EBB vs EBRT) Show forest plot | 1 | | Risk Ratio (M‐H, Fixed, 95% CI) | Totals not selected |
|
| 11 Positive tiredness response at 8 weeks ‐ Clinician assessment (EBB vs EBRT) Show forest plot | 1 | | Risk Ratio (M‐H, Fixed, 95% CI) | Totals not selected |
|
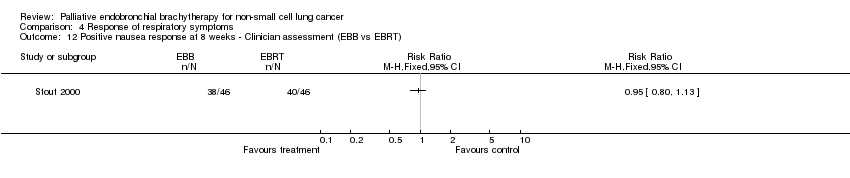
| 12 Positive nausea response at 8 weeks ‐ Clinician assessment (EBB vs EBRT) Show forest plot | 1 | | Risk Ratio (M‐H, Fixed, 95% CI) | Totals not selected |
|
| 13 Positive hoarseness response at 8 weeks ‐ Clinician assessment (EBB vs EBRT) Show forest plot | 1 | | Risk Ratio (M‐H, Fixed, 95% CI) | Totals not selected |
|
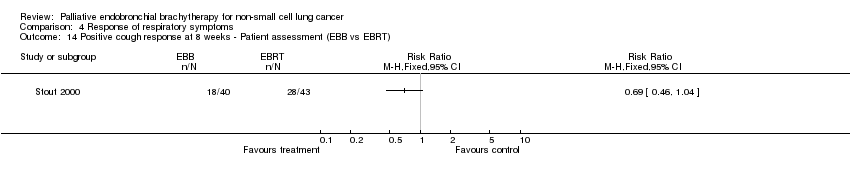
| 14 Positive cough response at 8 weeks ‐ Patient assessment (EBB vs EBRT) Show forest plot | 1 | | Risk Ratio (M‐H, Fixed, 95% CI) | Totals not selected |
|
| 15 Positive hemoptysis response at 8 weeks ‐ Patient assessment (EBB vs EBRT) Show forest plot | 1 | | Risk Ratio (M‐H, Fixed, 95% CI) | Totals not selected |
|
| 16 Positive breathlessness response at 8 weeks ‐ patient assessment (EBB vs EBRT) Show forest plot | 1 | | Risk Ratio (M‐H, Fixed, 95% CI) | Totals not selected |
|
| 17 Positive chest pain response at 8 weeks ‐ Patient assessment (EBB vs EBRT) Show forest plot | 1 | | Risk Ratio (M‐H, Fixed, 95% CI) | Totals not selected |
|
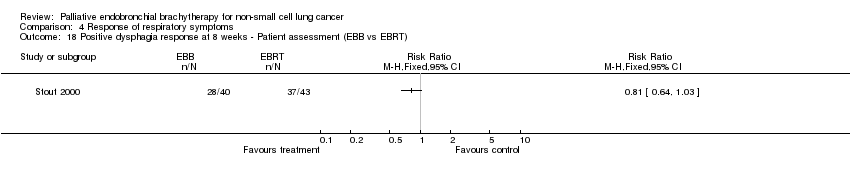
| 18 Positive dysphagia response at 8 weeks ‐ Patient assessment (EBB vs EBRT) Show forest plot | 1 | | Risk Ratio (M‐H, Fixed, 95% CI) | Totals not selected |
|
| 19 Positive anorexia response at 8 weeks ‐ Patient assessment (EBB vs EBRT) Show forest plot | 1 | | Risk Ratio (M‐H, Fixed, 95% CI) | Totals not selected |
|
| 20 Positive tiredness response at 8 weeks ‐ Patient assessment (EBB vs EBRT) Show forest plot | 1 | | Risk Ratio (M‐H, Fixed, 95% CI) | Totals not selected |
|
| 21 Positive nausea response at 8 weeks ‐ Patient assessment (EBB vs EBRT) Show forest plot | 1 | | Risk Ratio (M‐H, Fixed, 95% CI) | Totals not selected |
|
| 22 Positive hoarseness response at 8 weeks ‐ Clinician assessment (EBB vs EBRT) Show forest plot | 1 | | Risk Ratio (M‐H, Fixed, 95% CI) | Totals not selected |
|
| 23 Good global palliation at 8 weeks ‐ Clinician assessment (EBB vs EBRT) Show forest plot | 1 | | Risk Ratio (M‐H, Fixed, 95% CI) | Totals not selected |
|
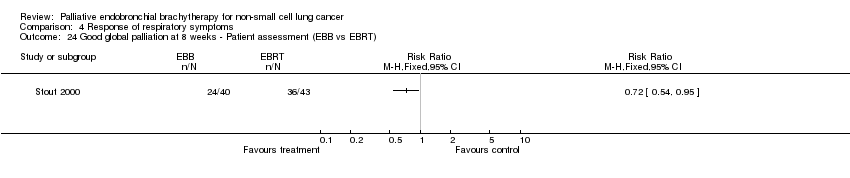
| 24 Good global palliation at 8 weeks ‐ Patient assessment (EBB vs EBRT) Show forest plot | 1 | | Risk Ratio (M‐H, Fixed, 95% CI) | Totals not selected |
|
| 25 Response of cough EBRT + EBB vs EBRT during follow‐up Show forest plot | 1 | | Risk Ratio (M‐H, Fixed, 95% CI) | Totals not selected |
|
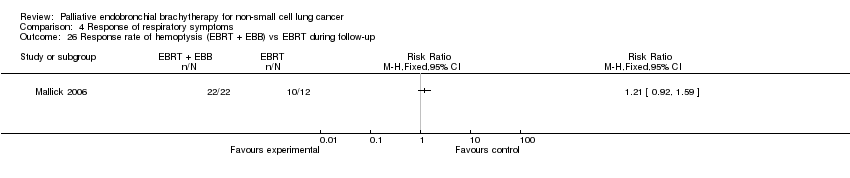
| 26 Response rate of hemoptysis (EBRT + EBB) vs EBRT during follow‐up Show forest plot | 1 | | Risk Ratio (M‐H, Fixed, 95% CI) | Totals not selected |
|
| 27 Response rate obstructive pneumonia EBRT + EBB vs EBRT Show forest plot | 1 | | Risk Ratio (M‐H, Fixed, 95% CI) | Totals not selected |
|
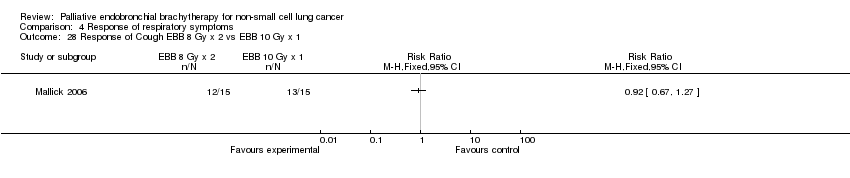
| 28 Response of Cough EBB 8 Gy x 2 vs EBB 10 Gy x 1 Show forest plot | 1 | | Risk Ratio (M‐H, Fixed, 95% CI) | Totals not selected |
|
| 29 Response of hemoptysis EBB 8 Gy x 2 vs EBB 10 Gy x 1 Show forest plot | 1 | | Risk Ratio (M‐H, Fixed, 95% CI) | Totals not selected |
|
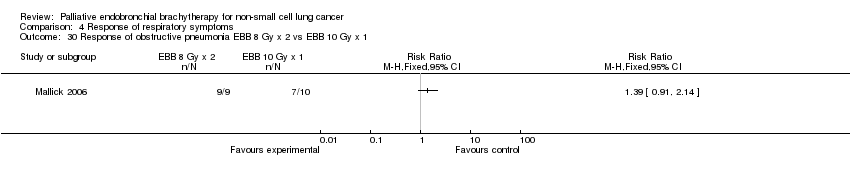
| 30 Response of obstructive pneumonia EBB 8 Gy x 2 vs EBB 10 Gy x 1 Show forest plot | 1 | | Risk Ratio (M‐H, Fixed, 95% CI) | Totals not selected |
|