Antibiotic strategies for eradicating Pseudomonas aeruginosa in people with cystic fibrosis
Información
- DOI:
- https://doi.org/10.1002/14651858.CD004197.pub4Copiar DOI

- Base de datos:
-
- Cochrane Database of Systematic Reviews
- Versión publicada:
-
- 10 noviembre 2014see what's new
- Tipo:
-
- Intervention
- Etapa:
-
- Review
- Grupo Editorial Cochrane:
-
Grupo Cochrane de Fibrosis quística y enfermedades genéticas
- Copyright:
-
- Copyright © 2014 The Cochrane Collaboration. Published by John Wiley & Sons, Ltd.
Cifras del artículo
Altmetric:
Citado por:
Autores
Contributions of authors
Damian Wood wrote the first draft of the review and both Damian Wood and Alan Smyth edited it to produce the final original review version. Both Damian Wood and Alan Smyth have worked on updated versions of the review up until 2007. As from Issue 2, 2009 the new lead author is Simon Langton Hewer. The most recent version of the review was jointly written by Simon Langton‐Hewer and Alan Smyth.
Simon Langton Hewer acts as guarantor of the review.
Declarations of interest
Dr Langton Hewer is the lead investigator on the ongoing trial Torpedo‐CF: Trial of Optimal Therapy for Pseudomonas Eradication in Cystic Fibrosis.
Prof Smyth has received financial support from Forest Laboratories and Gilead (both companies market a nebulised antibiotic) and from MPEX Pharma (nebulised antibiotic in development).
Acknowledgements
Hazel Bunn assisted in formulation of the review protocol. We would also like to thank Dr Damian Wood for his input into the original version of this review and subsequent updates until November 2007.
Version history
| Published | Title | Stage | Authors | Version |
| 2023 Jun 02 | Antibiotic strategies for eradicating Pseudomonas aeruginosa in people with cystic fibrosis | Review | Simon C Langton Hewer, Sherie Smith, Nicola J Rowbotham, Alexander Yule, Alan R Smyth | |
| 2017 Apr 25 | Antibiotic strategies for eradicating Pseudomonas aeruginosa in people with cystic fibrosis | Review | Simon C Langton Hewer, Alan R Smyth | |
| 2014 Nov 10 | Antibiotic strategies for eradicating Pseudomonas aeruginosa in people with cystic fibrosis | Review | Simon C Langton Hewer, Alan R Smyth | |
| 2009 Oct 07 | Antibiotic strategies for eradicating Pseudomonas aeruginosa in people with cystic fibrosis | Review | Simon C Langton Hewer, Alan R Smyth | |
| 2009 Jul 08 | Antibiotic strategies for eradicating Pseudomonas aeruginosa in people with cystic fibrosis | Review | Damian M Wood, Alan R Smyth | |
| 2003 Apr 22 | Antibiotic strategies for eradicating Pseudomonas aeruginosa in people with cystic fibrosis | Protocol | Damian M Wood, Alan R Smyth | |
Differences between protocol and review
2014
The inclusion criteria have been changed to include participants who have received study treatment within six months of the first isolation of P. aeruginosa (previously not more than two months). This is to reflect differences in clinical practice between Europe and North America and to allow trials from earlier decades (where early treatment of P. aeruginosa was not established clinical practice) to be included. A large trial (306 participants), published in 2011, is therefore now eligible for inclusion (Treggiari 2011). However, it is possible that, where infection has been present for as long as six months, it may have become more difficult to eradicate.
In recent years 28 days of inhaled tobramycin has been recommended as 'standard of care' for eradication of P. aeruginosa in guidelines (Döring 2012). This has been reflected in trial design, where investigators have designed their trials to ensure that all patients receive an initial 28‐day course of inhaled tobramycin before randomisation to the next stage of therapy. We have therefore altered our eligibility criteria to allow trials where all patients receive some eradication therapy before randomisation (Treggiari 2011).
We have added cost as an outcome measure, as cost‐effectiveness has become increasingly important in CF care. None of the trials included to date have reported this outcome but future trials may do so.
2009
After new lead reviewer re‐assessed the review, the section 'Objectives' was expanded to include the sentence:
'To investigate whether there is evidence of superiority or improved cost‐effectiveness between antibiotic strategies.'
Currently, we have included both P. aeruginosa free and P. aeruginosa naive patients according to the definition by Lee (Lee 2003). At the update in 2009 we have added plans to analyse these subgroups separately if sufficient data become available from included studies in the future.
2005
Two clinically relevant additional outcomes were added at review stage to the ones we had originally listed:
-
Time to chronic infection (defined as the presence of P. aeruginosa in each monthly sputum sample for six consecutive months or the presence of precipitating antibodies to P. aeruginosa or both)
-
Clinical and radiological scores
Keywords
MeSH
Medical Subject Headings (MeSH) Keywords
- Administration, Inhalation;
- Administration, Oral;
- Anti-Bacterial Agents [administration & dosage, *therapeutic use];
- Ciprofloxacin [administration & dosage, therapeutic use];
- Colistin [administration & dosage, therapeutic use];
- Cystic Fibrosis [*complications, microbiology];
- *Pseudomonas aeruginosa;
- Pseudomonas Infections [*drug therapy];
- Randomized Controlled Trials as Topic;
- Respiratory System [microbiology];
- Tobramycin [administration & dosage, therapeutic use];
Medical Subject Headings Check Words
Adult; Child; Humans;
PICO

Risk of bias summary: review authors' judgements about each risk of bias item for each included study.

Comparison 1 Inhaled tobramycin versus placebo, Outcome 1 Positive respiratory culture for P. aeruginosa (300 mg 2x daily).
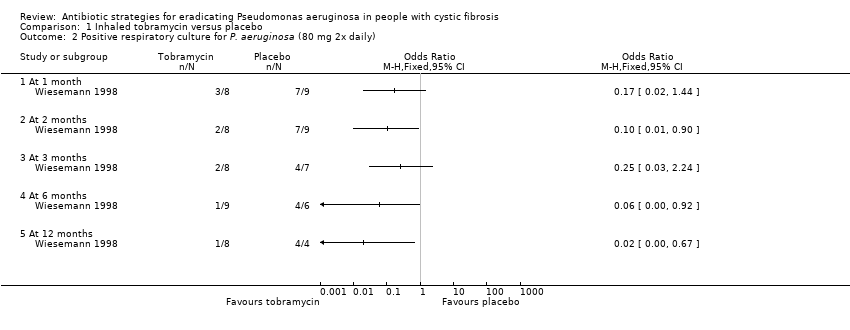
Comparison 1 Inhaled tobramycin versus placebo, Outcome 2 Positive respiratory culture for P. aeruginosa (80 mg 2x daily).
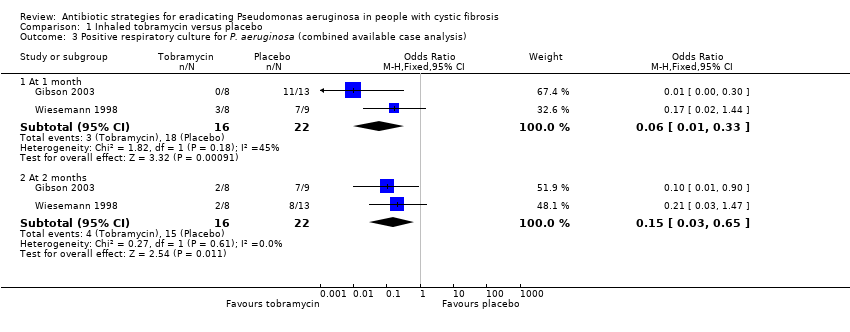
Comparison 1 Inhaled tobramycin versus placebo, Outcome 3 Positive respiratory culture for P. aeruginosa (combined available case analysis).

Comparison 1 Inhaled tobramycin versus placebo, Outcome 4 Positive respiratory culture for P. aeruginosa (combined) ‐ best case.

Comparison 1 Inhaled tobramycin versus placebo, Outcome 5 Positive respiratory culture for P. aeruginosa (combined) ‐ worst case.

Comparison 1 Inhaled tobramycin versus placebo, Outcome 6 Change in weight from baseline.

Comparison 1 Inhaled tobramycin versus placebo, Outcome 7 Adverse events.
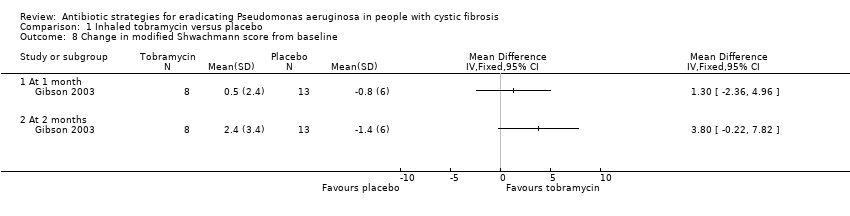
Comparison 1 Inhaled tobramycin versus placebo, Outcome 8 Change in modified Shwachmann score from baseline.

Comparison 2 Oral ciprofloxacin and inhaled colistin versus no treatment, Outcome 1 Proportion colonised with P. aeruginosa.

Comparison 3 Oral ciprofloxacin and inhaled colistin versus inhaled tobramycin, Outcome 1 Positive respiratory culture for P.aeruginosa.

Comparison 3 Oral ciprofloxacin and inhaled colistin versus inhaled tobramycin, Outcome 2 Adverse events.
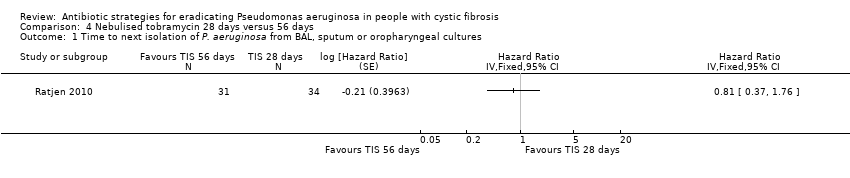
Comparison 4 Nebulised tobramycin 28 days versus 56 days, Outcome 1 Time to next isolation of P. aeruginosa from BAL, sputum or oropharyngeal cultures.

Comparison 4 Nebulised tobramycin 28 days versus 56 days, Outcome 2 Number of respiratory exacerbations.
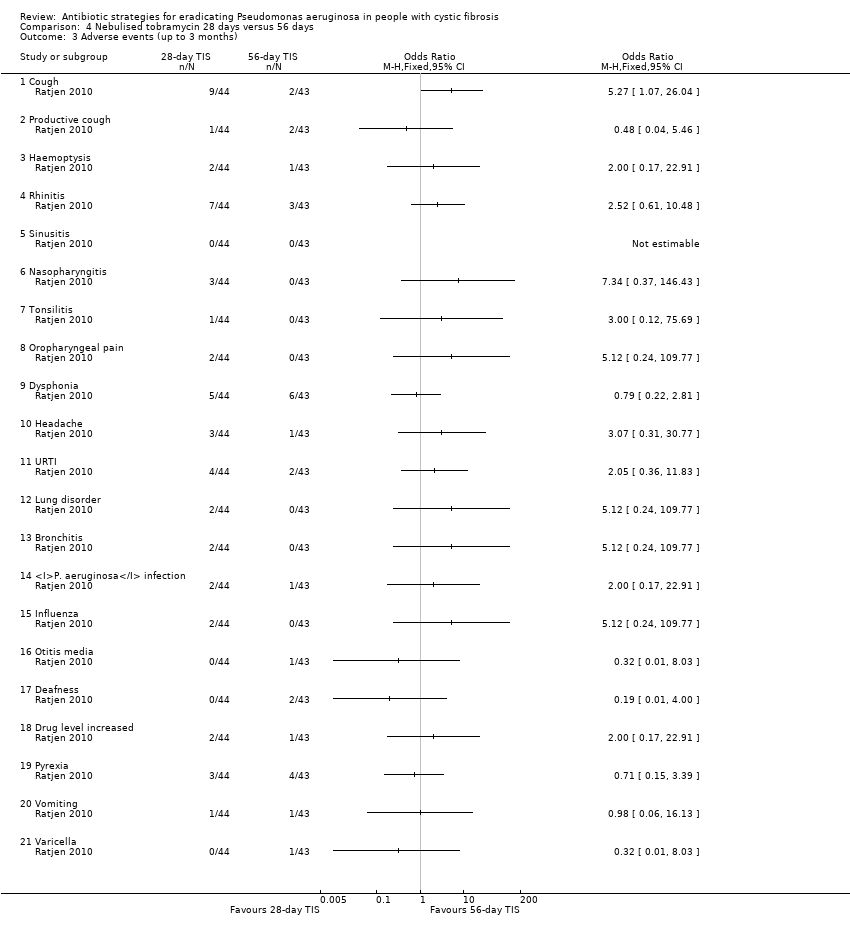
Comparison 4 Nebulised tobramycin 28 days versus 56 days, Outcome 3 Adverse events (up to 3 months).

Comparison 4 Nebulised tobramycin 28 days versus 56 days, Outcome 4 Adverse events (over 3 months).
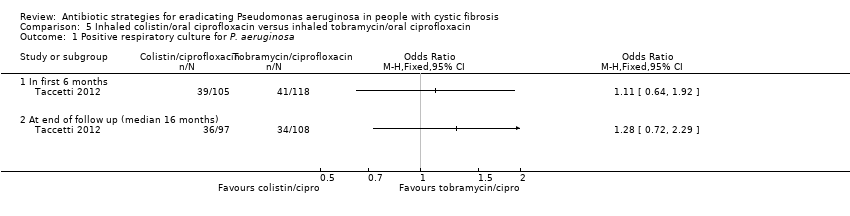
Comparison 5 Inhaled colistin/oral ciprofloxacin versus inhaled tobramycin/oral ciprofloxacin, Outcome 1 Positive respiratory culture for P. aeruginosa.

Comparison 5 Inhaled colistin/oral ciprofloxacin versus inhaled tobramycin/oral ciprofloxacin, Outcome 2 Relative change in % predicted FEV1 from baseline (to mean 54 days).
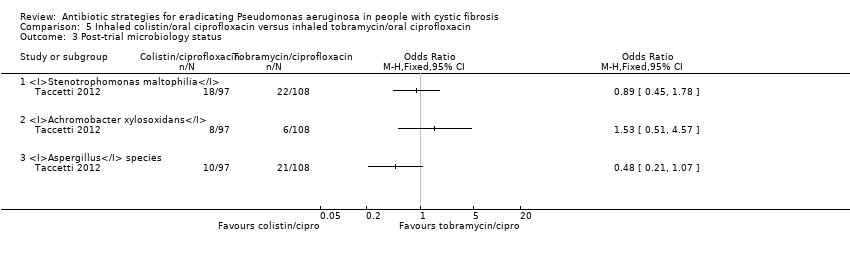
Comparison 5 Inhaled colistin/oral ciprofloxacin versus inhaled tobramycin/oral ciprofloxacin, Outcome 3 Post‐trial microbiology status.

Comparison 5 Inhaled colistin/oral ciprofloxacin versus inhaled tobramycin/oral ciprofloxacin, Outcome 4 Adverse events leading to trial discontinuation.
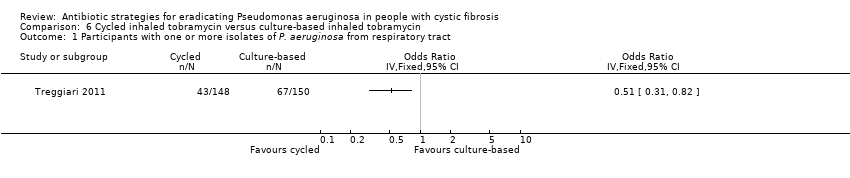
Comparison 6 Cycled inhaled tobramycin versus culture‐based inhaled tobramycin, Outcome 1 Participants with one or more isolates of P. aeruginosa from respiratory tract.

Comparison 6 Cycled inhaled tobramycin versus culture‐based inhaled tobramycin, Outcome 2 Mean 70‐week change in FEV1 % predicted.

Comparison 6 Cycled inhaled tobramycin versus culture‐based inhaled tobramycin, Outcome 3 Mean 70‐week change in weight from baseline.
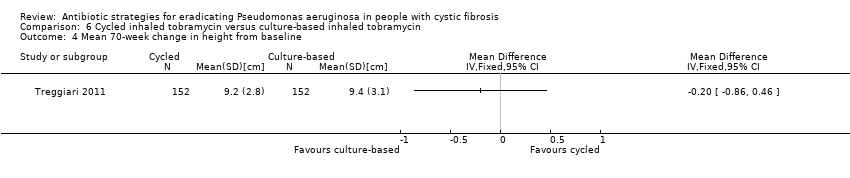
Comparison 6 Cycled inhaled tobramycin versus culture‐based inhaled tobramycin, Outcome 4 Mean 70‐week change in height from baseline.

Comparison 6 Cycled inhaled tobramycin versus culture‐based inhaled tobramycin, Outcome 5 Time to severe pulmonary exacerbation.

Comparison 6 Cycled inhaled tobramycin versus culture‐based inhaled tobramycin, Outcome 6 Participants with one or more severe pulmonary exacerbations.

Comparison 6 Cycled inhaled tobramycin versus culture‐based inhaled tobramycin, Outcome 7 Time to pulmonary exacerbation (any severity).

Comparison 6 Cycled inhaled tobramycin versus culture‐based inhaled tobramycin, Outcome 8 Participants with one or more pulmonary exacerbations (any severity).

Comparison 6 Cycled inhaled tobramycin versus culture‐based inhaled tobramycin, Outcome 9 Participants with new isolates of Stenotrophomonas maltophilia.

Comparison 6 Cycled inhaled tobramycin versus culture‐based inhaled tobramycin, Outcome 10 Participants with one or more serious adverse event.

Comparison 7 Ciprofloxacin versus placebo added to cycled and culture‐based inhaled tobramycin, Outcome 1 Participants with one or more isolates of P. aeruginosa from respiratory tract.
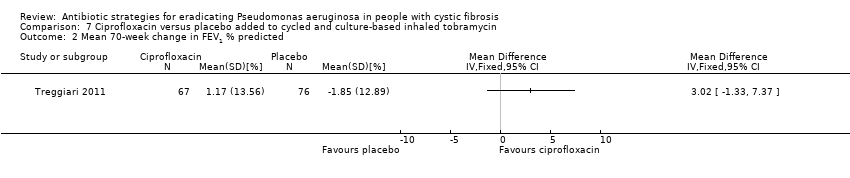
Comparison 7 Ciprofloxacin versus placebo added to cycled and culture‐based inhaled tobramycin, Outcome 2 Mean 70‐week change in FEV1 % predicted.
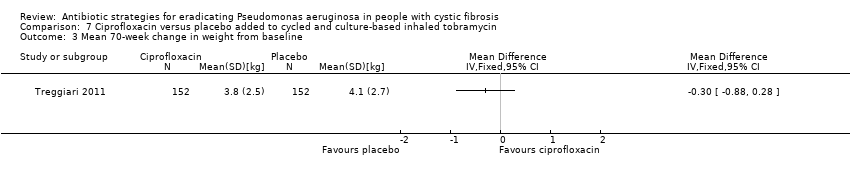
Comparison 7 Ciprofloxacin versus placebo added to cycled and culture‐based inhaled tobramycin, Outcome 3 Mean 70‐week change in weight from baseline.
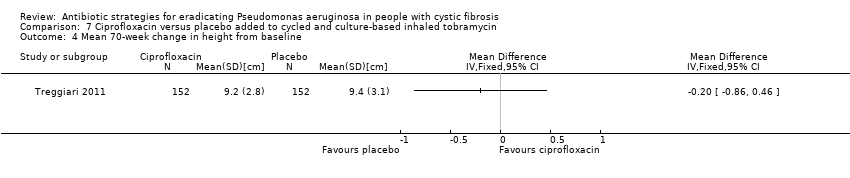
Comparison 7 Ciprofloxacin versus placebo added to cycled and culture‐based inhaled tobramycin, Outcome 4 Mean 70‐week change in height from baseline.

Comparison 7 Ciprofloxacin versus placebo added to cycled and culture‐based inhaled tobramycin, Outcome 5 Time to severe pulmonary exacerbation.

Comparison 7 Ciprofloxacin versus placebo added to cycled and culture‐based inhaled tobramycin, Outcome 6 Participants with one or more severe pulmonary exacerbations.
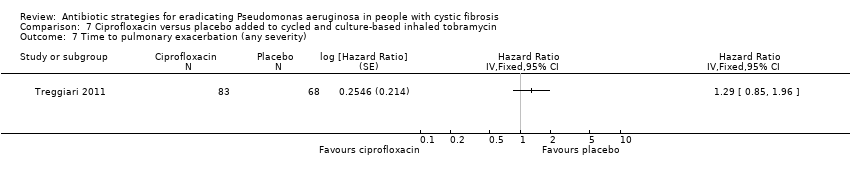
Comparison 7 Ciprofloxacin versus placebo added to cycled and culture‐based inhaled tobramycin, Outcome 7 Time to pulmonary exacerbation (any severity).

Comparison 7 Ciprofloxacin versus placebo added to cycled and culture‐based inhaled tobramycin, Outcome 8 Participants with one of more pulmonary exacerbation (any severity).

Comparison 7 Ciprofloxacin versus placebo added to cycled and culture‐based inhaled tobramycin, Outcome 9 Participants with new isolates of Stenotrophomonas maltophilia.
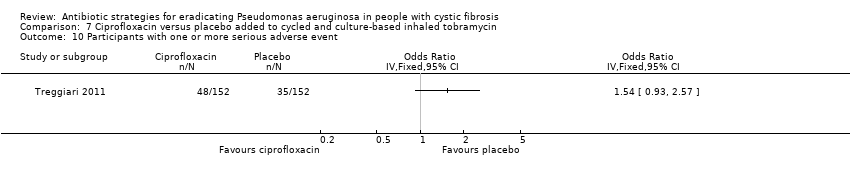
Comparison 7 Ciprofloxacin versus placebo added to cycled and culture‐based inhaled tobramycin, Outcome 10 Participants with one or more serious adverse event.
| Outcome or subgroup title | No. of studies | No. of participants | Statistical method | Effect size |
| 1 Positive respiratory culture for P. aeruginosa (300 mg 2x daily) Show forest plot | 1 | Odds Ratio (M‐H, Fixed, 95% CI) | Totals not selected | |
| 1.1 At 1 month | 1 | Odds Ratio (M‐H, Fixed, 95% CI) | 0.0 [0.0, 0.0] | |
| 1.2 At 2 months | 1 | Odds Ratio (M‐H, Fixed, 95% CI) | 0.0 [0.0, 0.0] | |
| 2 Positive respiratory culture for P. aeruginosa (80 mg 2x daily) Show forest plot | 1 | Odds Ratio (M‐H, Fixed, 95% CI) | Totals not selected | |
| 2.1 At 1 month | 1 | Odds Ratio (M‐H, Fixed, 95% CI) | 0.0 [0.0, 0.0] | |
| 2.2 At 2 months | 1 | Odds Ratio (M‐H, Fixed, 95% CI) | 0.0 [0.0, 0.0] | |
| 2.3 At 3 months | 1 | Odds Ratio (M‐H, Fixed, 95% CI) | 0.0 [0.0, 0.0] | |
| 2.4 At 6 months | 1 | Odds Ratio (M‐H, Fixed, 95% CI) | 0.0 [0.0, 0.0] | |
| 2.5 At 12 months | 1 | Odds Ratio (M‐H, Fixed, 95% CI) | 0.0 [0.0, 0.0] | |
| 3 Positive respiratory culture for P. aeruginosa (combined available case analysis) Show forest plot | 2 | Odds Ratio (M‐H, Fixed, 95% CI) | Subtotals only | |
| 3.1 At 1 month | 2 | 38 | Odds Ratio (M‐H, Fixed, 95% CI) | 0.06 [0.01, 0.33] |
| 3.2 At 2 months | 2 | 38 | Odds Ratio (M‐H, Fixed, 95% CI) | 0.15 [0.03, 0.65] |
| 4 Positive respiratory culture for P. aeruginosa (combined) ‐ best case Show forest plot | 2 | Odds Ratio (M‐H, Fixed, 95% CI) | Subtotals only | |
| 4.1 At 1 month | 2 | 39 | Odds Ratio (M‐H, Fixed, 95% CI) | 0.06 [0.01, 0.30] |
| 4.2 At 2 months | 2 | 39 | Odds Ratio (M‐H, Fixed, 95% CI) | 0.14 [0.03, 0.60] |
| 4.3 At 3 months | 1 | 18 | Odds Ratio (M‐H, Fixed, 95% CI) | 0.14 [0.02, 1.16] |
| 4.4 At 6 months | 1 | 18 | Odds Ratio (M‐H, Fixed, 95% CI) | 0.04 [0.00, 0.48] |
| 4.5 At 12 months | 1 | 18 | Odds Ratio (M‐H, Fixed, 95% CI) | 0.01 [0.00, 0.26] |
| 5 Positive respiratory culture for P. aeruginosa (combined) ‐ worst case Show forest plot | 2 | Odds Ratio (M‐H, Fixed, 95% CI) | Subtotals only | |
| 5.1 At 1 month | 2 | 39 | Odds Ratio (M‐H, Fixed, 95% CI) | 0.08 [0.02, 0.38] |
| 5.2 At 2 months | 2 | 39 | Odds Ratio (M‐H, Fixed, 95% CI) | 0.18 [0.04, 0.73] |
| 5.3 At 3 months | 1 | 18 | Odds Ratio (M‐H, Fixed, 95% CI) | 0.36 [0.05, 2.77] |
| 5.4 At 6 months | 1 | 18 | Odds Ratio (M‐H, Fixed, 95% CI) | 0.16 [0.01, 1.83] |
| 5.5 At 12 months | 1 | 18 | Odds Ratio (M‐H, Fixed, 95% CI) | 0.36 [0.05, 2.77] |
| 6 Change in weight from baseline Show forest plot | 1 | Mean Difference (IV, Fixed, 95% CI) | Totals not selected | |
| 6.1 At 1 month | 1 | Mean Difference (IV, Fixed, 95% CI) | 0.0 [0.0, 0.0] | |
| 6.2 At 2 months | 1 | Mean Difference (IV, Fixed, 95% CI) | 0.0 [0.0, 0.0] | |
| 7 Adverse events Show forest plot | 1 | Odds Ratio (M‐H, Fixed, 95% CI) | Totals not selected | |
| 7.1 Cough | 1 | Odds Ratio (M‐H, Fixed, 95% CI) | 0.0 [0.0, 0.0] | |
| 8 Change in modified Shwachmann score from baseline Show forest plot | 1 | Mean Difference (IV, Fixed, 95% CI) | Totals not selected | |
| 8.1 At 1 month | 1 | Mean Difference (IV, Fixed, 95% CI) | 0.0 [0.0, 0.0] | |
| 8.2 At 2 months | 1 | Mean Difference (IV, Fixed, 95% CI) | 0.0 [0.0, 0.0] | |
| Outcome or subgroup title | No. of studies | No. of participants | Statistical method | Effect size |
| 1 Proportion colonised with P. aeruginosa Show forest plot | 1 | Odds Ratio (M‐H, Fixed, 95% CI) | Totals not selected | |
| 1.1 At 3 months | 1 | Odds Ratio (M‐H, Fixed, 95% CI) | 0.0 [0.0, 0.0] | |
| 1.2 At 6 months | 1 | Odds Ratio (M‐H, Fixed, 95% CI) | 0.0 [0.0, 0.0] | |
| 1.3 At 12 months | 1 | Odds Ratio (M‐H, Fixed, 95% CI) | 0.0 [0.0, 0.0] | |
| 1.4 At 24 months | 1 | Odds Ratio (M‐H, Fixed, 95% CI) | 0.0 [0.0, 0.0] | |
| Outcome or subgroup title | No. of studies | No. of participants | Statistical method | Effect size |
| 1 Positive respiratory culture for P.aeruginosa Show forest plot | 1 | Odds Ratio (M‐H, Fixed, 95% CI) | Totals not selected | |
| 1.1 In first 6 months | 1 | Odds Ratio (M‐H, Fixed, 95% CI) | 0.0 [0.0, 0.0] | |
| 1.2 At 24 months | 1 | Odds Ratio (M‐H, Fixed, 95% CI) | 0.0 [0.0, 0.0] | |
| 2 Adverse events Show forest plot | 1 | Odds Ratio (M‐H, Fixed, 95% CI) | Totals not selected | |
| 2.1 Severe cough | 1 | Odds Ratio (M‐H, Fixed, 95% CI) | 0.0 [0.0, 0.0] | |
| Outcome or subgroup title | No. of studies | No. of participants | Statistical method | Effect size |
| 1 Time to next isolation of P. aeruginosa from BAL, sputum or oropharyngeal cultures Show forest plot | 1 | Hazard Ratio (Fixed, 95% CI) | Totals not selected | |
| 2 Number of respiratory exacerbations Show forest plot | 1 | Odds Ratio (M‐H, Fixed, 95% CI) | Totals not selected | |
| 2.1 Until recurrence of P. aeruginosa | 1 | Odds Ratio (M‐H, Fixed, 95% CI) | 0.0 [0.0, 0.0] | |
| 3 Adverse events (up to 3 months) Show forest plot | 1 | Odds Ratio (M‐H, Fixed, 95% CI) | Totals not selected | |
| 3.1 Cough | 1 | Odds Ratio (M‐H, Fixed, 95% CI) | 0.0 [0.0, 0.0] | |
| 3.2 Productive cough | 1 | Odds Ratio (M‐H, Fixed, 95% CI) | 0.0 [0.0, 0.0] | |
| 3.3 Haemoptysis | 1 | Odds Ratio (M‐H, Fixed, 95% CI) | 0.0 [0.0, 0.0] | |
| 3.4 Rhinitis | 1 | Odds Ratio (M‐H, Fixed, 95% CI) | 0.0 [0.0, 0.0] | |
| 3.5 Sinusitis | 1 | Odds Ratio (M‐H, Fixed, 95% CI) | 0.0 [0.0, 0.0] | |
| 3.6 Nasopharyngitis | 1 | Odds Ratio (M‐H, Fixed, 95% CI) | 0.0 [0.0, 0.0] | |
| 3.7 Tonsilitis | 1 | Odds Ratio (M‐H, Fixed, 95% CI) | 0.0 [0.0, 0.0] | |
| 3.8 Oropharyngeal pain | 1 | Odds Ratio (M‐H, Fixed, 95% CI) | 0.0 [0.0, 0.0] | |
| 3.9 Dysphonia | 1 | Odds Ratio (M‐H, Fixed, 95% CI) | 0.0 [0.0, 0.0] | |
| 3.10 Headache | 1 | Odds Ratio (M‐H, Fixed, 95% CI) | 0.0 [0.0, 0.0] | |
| 3.11 URTI | 1 | Odds Ratio (M‐H, Fixed, 95% CI) | 0.0 [0.0, 0.0] | |
| 3.12 Lung disorder | 1 | Odds Ratio (M‐H, Fixed, 95% CI) | 0.0 [0.0, 0.0] | |
| 3.13 Bronchitis | 1 | Odds Ratio (M‐H, Fixed, 95% CI) | 0.0 [0.0, 0.0] | |
| 3.14 P. aeruginosa infection | 1 | Odds Ratio (M‐H, Fixed, 95% CI) | 0.0 [0.0, 0.0] | |
| 3.15 Influenza | 1 | Odds Ratio (M‐H, Fixed, 95% CI) | 0.0 [0.0, 0.0] | |
| 3.16 Otitis media | 1 | Odds Ratio (M‐H, Fixed, 95% CI) | 0.0 [0.0, 0.0] | |
| 3.17 Deafness | 1 | Odds Ratio (M‐H, Fixed, 95% CI) | 0.0 [0.0, 0.0] | |
| 3.18 Drug level increased | 1 | Odds Ratio (M‐H, Fixed, 95% CI) | 0.0 [0.0, 0.0] | |
| 3.19 Pyrexia | 1 | Odds Ratio (M‐H, Fixed, 95% CI) | 0.0 [0.0, 0.0] | |
| 3.20 Vomiting | 1 | Odds Ratio (M‐H, Fixed, 95% CI) | 0.0 [0.0, 0.0] | |
| 3.21 Varicella | 1 | Odds Ratio (M‐H, Fixed, 95% CI) | 0.0 [0.0, 0.0] | |
| 4 Adverse events (over 3 months) Show forest plot | 1 | Odds Ratio (M‐H, Fixed, 95% CI) | Totals not selected | |
| 4.1 Cough | 1 | Odds Ratio (M‐H, Fixed, 95% CI) | 0.0 [0.0, 0.0] | |
| 4.2 Productive cough | 1 | Odds Ratio (M‐H, Fixed, 95% CI) | 0.0 [0.0, 0.0] | |
| 4.3 Haemoptysis | 1 | Odds Ratio (M‐H, Fixed, 95% CI) | 0.0 [0.0, 0.0] | |
| 4.4 Rhinitis | 1 | Odds Ratio (M‐H, Fixed, 95% CI) | 0.0 [0.0, 0.0] | |
| 4.5 Sinusitis | 1 | Odds Ratio (M‐H, Fixed, 95% CI) | 0.0 [0.0, 0.0] | |
| 4.6 Nasopharyngitis | 1 | Odds Ratio (M‐H, Fixed, 95% CI) | 0.0 [0.0, 0.0] | |
| 4.7 Tonsilitis | 1 | Odds Ratio (M‐H, Fixed, 95% CI) | 0.0 [0.0, 0.0] | |
| 4.8 Oropharyngeal pain | 1 | Odds Ratio (M‐H, Fixed, 95% CI) | 0.0 [0.0, 0.0] | |
| 4.9 Dysphonia | 1 | Odds Ratio (M‐H, Fixed, 95% CI) | 0.0 [0.0, 0.0] | |
| 4.10 Headache | 1 | Odds Ratio (M‐H, Fixed, 95% CI) | 0.0 [0.0, 0.0] | |
| 4.11 URTI | 1 | Odds Ratio (M‐H, Fixed, 95% CI) | 0.0 [0.0, 0.0] | |
| 4.12 Lung disorder | 1 | Odds Ratio (M‐H, Fixed, 95% CI) | 0.0 [0.0, 0.0] | |
| 4.13 Bronchitis | 1 | Odds Ratio (M‐H, Fixed, 95% CI) | 0.0 [0.0, 0.0] | |
| 4.14 P. aeruginosa infection | 1 | Odds Ratio (M‐H, Fixed, 95% CI) | 0.0 [0.0, 0.0] | |
| 4.15 Influenza | 1 | Odds Ratio (M‐H, Fixed, 95% CI) | 0.0 [0.0, 0.0] | |
| 4.16 Otitis media | 1 | Odds Ratio (M‐H, Fixed, 95% CI) | 0.0 [0.0, 0.0] | |
| 4.17 Deafness | 1 | Odds Ratio (M‐H, Fixed, 95% CI) | 0.0 [0.0, 0.0] | |
| 4.18 Drug level increased | 1 | Odds Ratio (M‐H, Fixed, 95% CI) | 0.0 [0.0, 0.0] | |
| 4.19 Pyrexia | 1 | Odds Ratio (M‐H, Fixed, 95% CI) | 0.0 [0.0, 0.0] | |
| 4.20 Vomiting | 1 | Odds Ratio (M‐H, Fixed, 95% CI) | 0.0 [0.0, 0.0] | |
| 4.21 Varicella | 1 | Odds Ratio (M‐H, Fixed, 95% CI) | 0.0 [0.0, 0.0] | |
| Outcome or subgroup title | No. of studies | No. of participants | Statistical method | Effect size |
| 1 Positive respiratory culture for P. aeruginosa Show forest plot | 1 | Odds Ratio (M‐H, Fixed, 95% CI) | Totals not selected | |
| 1.1 In first 6 months | 1 | Odds Ratio (M‐H, Fixed, 95% CI) | 0.0 [0.0, 0.0] | |
| 1.2 At end of follow up (median 16 months) | 1 | Odds Ratio (M‐H, Fixed, 95% CI) | 0.0 [0.0, 0.0] | |
| 2 Relative change in % predicted FEV1 from baseline (to mean 54 days) Show forest plot | 1 | Mean Difference (IV, Fixed, 95% CI) | Totals not selected | |
| 3 Post‐trial microbiology status Show forest plot | 1 | Odds Ratio (M‐H, Fixed, 95% CI) | Totals not selected | |
| 3.1 Stenotrophomonas maltophilia | 1 | Odds Ratio (M‐H, Fixed, 95% CI) | 0.0 [0.0, 0.0] | |
| 3.2 Achromobacter xylosoxidans | 1 | Odds Ratio (M‐H, Fixed, 95% CI) | 0.0 [0.0, 0.0] | |
| 3.3 Aspergillus species | 1 | Odds Ratio (M‐H, Fixed, 95% CI) | 0.0 [0.0, 0.0] | |
| 4 Adverse events leading to trial discontinuation Show forest plot | 1 | Odds Ratio (M‐H, Fixed, 95% CI) | Totals not selected | |
| 4.1 Vomiting | 1 | Odds Ratio (M‐H, Fixed, 95% CI) | 0.0 [0.0, 0.0] | |
| 4.2 Photosensitivity | 1 | Odds Ratio (M‐H, Fixed, 95% CI) | 0.0 [0.0, 0.0] | |
| 4.3 Wheeze | 1 | Odds Ratio (M‐H, Fixed, 95% CI) | 0.0 [0.0, 0.0] | |
| 4.4 Pulmonary exacerbation during early eradication treatment | 1 | Odds Ratio (M‐H, Fixed, 95% CI) | 0.0 [0.0, 0.0] | |
| 4.5 Lack of compliance | 1 | Odds Ratio (M‐H, Fixed, 95% CI) | 0.0 [0.0, 0.0] | |
| Outcome or subgroup title | No. of studies | No. of participants | Statistical method | Effect size |
| 1 Participants with one or more isolates of P. aeruginosa from respiratory tract Show forest plot | 1 | Odds Ratio (IV, Fixed, 95% CI) | Totals not selected | |
| 2 Mean 70‐week change in FEV1 % predicted Show forest plot | 1 | Mean Difference (IV, Fixed, 95% CI) | Totals not selected | |
| 3 Mean 70‐week change in weight from baseline Show forest plot | 1 | Mean Difference (IV, Fixed, 95% CI) | Totals not selected | |
| 4 Mean 70‐week change in height from baseline Show forest plot | 1 | Mean Difference (IV, Fixed, 95% CI) | Totals not selected | |
| 5 Time to severe pulmonary exacerbation Show forest plot | 1 | Hazard Ratio (Fixed, 95% CI) | Totals not selected | |
| 6 Participants with one or more severe pulmonary exacerbations Show forest plot | 1 | Odds Ratio (IV, Fixed, 95% CI) | Totals not selected | |
| 7 Time to pulmonary exacerbation (any severity) Show forest plot | 1 | Hazard Ratio (Fixed, 95% CI) | Totals not selected | |
| 8 Participants with one or more pulmonary exacerbations (any severity) Show forest plot | 1 | Odds Ratio (IV, Fixed, 95% CI) | Totals not selected | |
| 9 Participants with new isolates of Stenotrophomonas maltophilia Show forest plot | 1 | Odds Ratio (IV, Fixed, 95% CI) | Totals not selected | |
| 10 Participants with one or more serious adverse event Show forest plot | 1 | Odds Ratio (IV, Fixed, 95% CI) | Totals not selected | |
| Outcome or subgroup title | No. of studies | No. of participants | Statistical method | Effect size |
| 1 Participants with one or more isolates of P. aeruginosa from respiratory tract Show forest plot | 1 | Odds Ratio (IV, Fixed, 95% CI) | Totals not selected | |
| 2 Mean 70‐week change in FEV1 % predicted Show forest plot | 1 | Mean Difference (IV, Fixed, 95% CI) | Totals not selected | |
| 3 Mean 70‐week change in weight from baseline Show forest plot | 1 | Mean Difference (IV, Fixed, 95% CI) | Totals not selected | |
| 4 Mean 70‐week change in height from baseline Show forest plot | 1 | Mean Difference (IV, Fixed, 95% CI) | Totals not selected | |
| 5 Time to severe pulmonary exacerbation Show forest plot | 1 | Hazard Ratio (Fixed, 95% CI) | Totals not selected | |
| 6 Participants with one or more severe pulmonary exacerbations Show forest plot | 1 | Odds Ratio (IV, Fixed, 95% CI) | Totals not selected | |
| 7 Time to pulmonary exacerbation (any severity) Show forest plot | 1 | Hazard Ratio (Fixed, 95% CI) | Totals not selected | |
| 8 Participants with one of more pulmonary exacerbation (any severity) Show forest plot | 1 | Odds Ratio (IV, Fixed, 95% CI) | Totals not selected | |
| 9 Participants with new isolates of Stenotrophomonas maltophilia Show forest plot | 1 | Odds Ratio (IV, Fixed, 95% CI) | Totals not selected | |
| 10 Participants with one or more serious adverse event Show forest plot | 1 | Odds Ratio (IV, Fixed, 95% CI) | Totals not selected | |