Scolaris Content Display Scolaris Content Display

Risk of bias summary: review authors' judgements about each risk of bias item for each included study.
Figuras y tablas -
Figure 1

Risk of bias summary: review authors' judgements about each risk of bias item for each included study.

Comparison 1 Inhaled tobramycin versus placebo, Outcome 1 Positive respiratory culture for P. aeruginosa (300 mg 2x daily).
Figuras y tablas -
Analysis 1.1

Comparison 1 Inhaled tobramycin versus placebo, Outcome 1 Positive respiratory culture for P. aeruginosa (300 mg 2x daily).

Comparison 1 Inhaled tobramycin versus placebo, Outcome 2 Positive respiratory culture for P. aeruginosa (80 mg 2x daily).
Figuras y tablas -
Analysis 1.2

Comparison 1 Inhaled tobramycin versus placebo, Outcome 2 Positive respiratory culture for P. aeruginosa (80 mg 2x daily).

Comparison 1 Inhaled tobramycin versus placebo, Outcome 3 Positive respiratory culture for P. aeruginosa (combined available case analysis).
Figuras y tablas -
Analysis 1.3

Comparison 1 Inhaled tobramycin versus placebo, Outcome 3 Positive respiratory culture for P. aeruginosa (combined available case analysis).

Comparison 1 Inhaled tobramycin versus placebo, Outcome 4 Positive respiratory culture for P. aeruginosa (combined) ‐ best case.
Figuras y tablas -
Analysis 1.4

Comparison 1 Inhaled tobramycin versus placebo, Outcome 4 Positive respiratory culture for P. aeruginosa (combined) ‐ best case.

Comparison 1 Inhaled tobramycin versus placebo, Outcome 5 Positive respiratory culture for P. aeruginosa (combined) ‐ worst case.
Figuras y tablas -
Analysis 1.5

Comparison 1 Inhaled tobramycin versus placebo, Outcome 5 Positive respiratory culture for P. aeruginosa (combined) ‐ worst case.

Comparison 1 Inhaled tobramycin versus placebo, Outcome 6 Change in weight from baseline.
Figuras y tablas -
Analysis 1.6

Comparison 1 Inhaled tobramycin versus placebo, Outcome 6 Change in weight from baseline.

Comparison 1 Inhaled tobramycin versus placebo, Outcome 7 Adverse events.
Figuras y tablas -
Analysis 1.7

Comparison 1 Inhaled tobramycin versus placebo, Outcome 7 Adverse events.

Comparison 1 Inhaled tobramycin versus placebo, Outcome 8 Change in modified Shwachmann score from baseline.
Figuras y tablas -
Analysis 1.8

Comparison 1 Inhaled tobramycin versus placebo, Outcome 8 Change in modified Shwachmann score from baseline.

Comparison 2 Oral ciprofloxacin and inhaled colistin versus no treatment, Outcome 1 Proportion colonised with P. aeruginosa.
Figuras y tablas -
Analysis 2.1

Comparison 2 Oral ciprofloxacin and inhaled colistin versus no treatment, Outcome 1 Proportion colonised with P. aeruginosa.

Comparison 3 Oral ciprofloxacin and inhaled colistin versus inhaled tobramycin, Outcome 1 Positive respiratory culture for P.aeruginosa.
Figuras y tablas -
Analysis 3.1

Comparison 3 Oral ciprofloxacin and inhaled colistin versus inhaled tobramycin, Outcome 1 Positive respiratory culture for P.aeruginosa.

Comparison 3 Oral ciprofloxacin and inhaled colistin versus inhaled tobramycin, Outcome 2 Adverse events.
Figuras y tablas -
Analysis 3.2

Comparison 3 Oral ciprofloxacin and inhaled colistin versus inhaled tobramycin, Outcome 2 Adverse events.

Comparison 4 Nebulised tobramycin 28 days versus 56 days, Outcome 1 Time to next isolation of P. aeruginosa from BAL, sputum or oropharyngeal cultures.
Figuras y tablas -
Analysis 4.1

Comparison 4 Nebulised tobramycin 28 days versus 56 days, Outcome 1 Time to next isolation of P. aeruginosa from BAL, sputum or oropharyngeal cultures.

Comparison 4 Nebulised tobramycin 28 days versus 56 days, Outcome 2 Number of respiratory exacerbations.
Figuras y tablas -
Analysis 4.2

Comparison 4 Nebulised tobramycin 28 days versus 56 days, Outcome 2 Number of respiratory exacerbations.

Comparison 4 Nebulised tobramycin 28 days versus 56 days, Outcome 3 Adverse events (up to 3 months).
Figuras y tablas -
Analysis 4.3

Comparison 4 Nebulised tobramycin 28 days versus 56 days, Outcome 3 Adverse events (up to 3 months).

Comparison 4 Nebulised tobramycin 28 days versus 56 days, Outcome 4 Adverse events (over 3 months).
Figuras y tablas -
Analysis 4.4

Comparison 4 Nebulised tobramycin 28 days versus 56 days, Outcome 4 Adverse events (over 3 months).

Comparison 5 Inhaled colistin/oral ciprofloxacin versus inhaled tobramycin/oral ciprofloxacin, Outcome 1 Positive respiratory culture for P. aeruginosa.
Figuras y tablas -
Analysis 5.1

Comparison 5 Inhaled colistin/oral ciprofloxacin versus inhaled tobramycin/oral ciprofloxacin, Outcome 1 Positive respiratory culture for P. aeruginosa.

Comparison 5 Inhaled colistin/oral ciprofloxacin versus inhaled tobramycin/oral ciprofloxacin, Outcome 2 Relative change in % predicted FEV1 from baseline (to mean 54 days).
Figuras y tablas -
Analysis 5.2

Comparison 5 Inhaled colistin/oral ciprofloxacin versus inhaled tobramycin/oral ciprofloxacin, Outcome 2 Relative change in % predicted FEV1 from baseline (to mean 54 days).

Comparison 5 Inhaled colistin/oral ciprofloxacin versus inhaled tobramycin/oral ciprofloxacin, Outcome 3 Post‐trial microbiology status.
Figuras y tablas -
Analysis 5.3

Comparison 5 Inhaled colistin/oral ciprofloxacin versus inhaled tobramycin/oral ciprofloxacin, Outcome 3 Post‐trial microbiology status.

Comparison 5 Inhaled colistin/oral ciprofloxacin versus inhaled tobramycin/oral ciprofloxacin, Outcome 4 Adverse events leading to trial discontinuation.
Figuras y tablas -
Analysis 5.4

Comparison 5 Inhaled colistin/oral ciprofloxacin versus inhaled tobramycin/oral ciprofloxacin, Outcome 4 Adverse events leading to trial discontinuation.

Comparison 6 Cycled inhaled tobramycin versus culture‐based inhaled tobramycin, Outcome 1 Participants with one or more isolates of P. aeruginosa from respiratory tract.
Figuras y tablas -
Analysis 6.1

Comparison 6 Cycled inhaled tobramycin versus culture‐based inhaled tobramycin, Outcome 1 Participants with one or more isolates of P. aeruginosa from respiratory tract.

Comparison 6 Cycled inhaled tobramycin versus culture‐based inhaled tobramycin, Outcome 2 Mean 70‐week change in FEV1 % predicted.
Figuras y tablas -
Analysis 6.2

Comparison 6 Cycled inhaled tobramycin versus culture‐based inhaled tobramycin, Outcome 2 Mean 70‐week change in FEV1 % predicted.

Comparison 6 Cycled inhaled tobramycin versus culture‐based inhaled tobramycin, Outcome 3 Mean 70‐week change in weight from baseline.
Figuras y tablas -
Analysis 6.3

Comparison 6 Cycled inhaled tobramycin versus culture‐based inhaled tobramycin, Outcome 3 Mean 70‐week change in weight from baseline.

Comparison 6 Cycled inhaled tobramycin versus culture‐based inhaled tobramycin, Outcome 4 Mean 70‐week change in height from baseline.
Figuras y tablas -
Analysis 6.4

Comparison 6 Cycled inhaled tobramycin versus culture‐based inhaled tobramycin, Outcome 4 Mean 70‐week change in height from baseline.

Comparison 6 Cycled inhaled tobramycin versus culture‐based inhaled tobramycin, Outcome 5 Time to severe pulmonary exacerbation.
Figuras y tablas -
Analysis 6.5

Comparison 6 Cycled inhaled tobramycin versus culture‐based inhaled tobramycin, Outcome 5 Time to severe pulmonary exacerbation.

Comparison 6 Cycled inhaled tobramycin versus culture‐based inhaled tobramycin, Outcome 6 Participants with one or more severe pulmonary exacerbations.
Figuras y tablas -
Analysis 6.6

Comparison 6 Cycled inhaled tobramycin versus culture‐based inhaled tobramycin, Outcome 6 Participants with one or more severe pulmonary exacerbations.

Comparison 6 Cycled inhaled tobramycin versus culture‐based inhaled tobramycin, Outcome 7 Time to pulmonary exacerbation (any severity).
Figuras y tablas -
Analysis 6.7

Comparison 6 Cycled inhaled tobramycin versus culture‐based inhaled tobramycin, Outcome 7 Time to pulmonary exacerbation (any severity).

Comparison 6 Cycled inhaled tobramycin versus culture‐based inhaled tobramycin, Outcome 8 Participants with one or more pulmonary exacerbations (any severity).
Figuras y tablas -
Analysis 6.8

Comparison 6 Cycled inhaled tobramycin versus culture‐based inhaled tobramycin, Outcome 8 Participants with one or more pulmonary exacerbations (any severity).

Comparison 6 Cycled inhaled tobramycin versus culture‐based inhaled tobramycin, Outcome 9 Participants with new isolates of Stenotrophomonas maltophilia.
Figuras y tablas -
Analysis 6.9

Comparison 6 Cycled inhaled tobramycin versus culture‐based inhaled tobramycin, Outcome 9 Participants with new isolates of Stenotrophomonas maltophilia.

Comparison 6 Cycled inhaled tobramycin versus culture‐based inhaled tobramycin, Outcome 10 Participants with one or more serious adverse event.
Figuras y tablas -
Analysis 6.10

Comparison 6 Cycled inhaled tobramycin versus culture‐based inhaled tobramycin, Outcome 10 Participants with one or more serious adverse event.

Comparison 7 Ciprofloxacin versus placebo added to cycled and culture‐based inhaled tobramycin, Outcome 1 Participants with one or more isolates of P. aeruginosa from respiratory tract.
Figuras y tablas -
Analysis 7.1

Comparison 7 Ciprofloxacin versus placebo added to cycled and culture‐based inhaled tobramycin, Outcome 1 Participants with one or more isolates of P. aeruginosa from respiratory tract.

Comparison 7 Ciprofloxacin versus placebo added to cycled and culture‐based inhaled tobramycin, Outcome 2 Mean 70‐week change in FEV1 % predicted.
Figuras y tablas -
Analysis 7.2

Comparison 7 Ciprofloxacin versus placebo added to cycled and culture‐based inhaled tobramycin, Outcome 2 Mean 70‐week change in FEV1 % predicted.

Comparison 7 Ciprofloxacin versus placebo added to cycled and culture‐based inhaled tobramycin, Outcome 3 Mean 70‐week change in weight from baseline.
Figuras y tablas -
Analysis 7.3

Comparison 7 Ciprofloxacin versus placebo added to cycled and culture‐based inhaled tobramycin, Outcome 3 Mean 70‐week change in weight from baseline.

Comparison 7 Ciprofloxacin versus placebo added to cycled and culture‐based inhaled tobramycin, Outcome 4 Mean 70‐week change in height from baseline.
Figuras y tablas -
Analysis 7.4

Comparison 7 Ciprofloxacin versus placebo added to cycled and culture‐based inhaled tobramycin, Outcome 4 Mean 70‐week change in height from baseline.

Comparison 7 Ciprofloxacin versus placebo added to cycled and culture‐based inhaled tobramycin, Outcome 5 Time to severe pulmonary exacerbation.
Figuras y tablas -
Analysis 7.5

Comparison 7 Ciprofloxacin versus placebo added to cycled and culture‐based inhaled tobramycin, Outcome 5 Time to severe pulmonary exacerbation.

Comparison 7 Ciprofloxacin versus placebo added to cycled and culture‐based inhaled tobramycin, Outcome 6 Participants with one or more severe pulmonary exacerbations.
Figuras y tablas -
Analysis 7.6

Comparison 7 Ciprofloxacin versus placebo added to cycled and culture‐based inhaled tobramycin, Outcome 6 Participants with one or more severe pulmonary exacerbations.

Comparison 7 Ciprofloxacin versus placebo added to cycled and culture‐based inhaled tobramycin, Outcome 7 Time to pulmonary exacerbation (any severity).
Figuras y tablas -
Analysis 7.7

Comparison 7 Ciprofloxacin versus placebo added to cycled and culture‐based inhaled tobramycin, Outcome 7 Time to pulmonary exacerbation (any severity).

Comparison 7 Ciprofloxacin versus placebo added to cycled and culture‐based inhaled tobramycin, Outcome 8 Participants with one of more pulmonary exacerbation (any severity).
Figuras y tablas -
Analysis 7.8

Comparison 7 Ciprofloxacin versus placebo added to cycled and culture‐based inhaled tobramycin, Outcome 8 Participants with one of more pulmonary exacerbation (any severity).

Comparison 7 Ciprofloxacin versus placebo added to cycled and culture‐based inhaled tobramycin, Outcome 9 Participants with new isolates of Stenotrophomonas maltophilia.
Figuras y tablas -
Analysis 7.9

Comparison 7 Ciprofloxacin versus placebo added to cycled and culture‐based inhaled tobramycin, Outcome 9 Participants with new isolates of Stenotrophomonas maltophilia.

Comparison 7 Ciprofloxacin versus placebo added to cycled and culture‐based inhaled tobramycin, Outcome 10 Participants with one or more serious adverse event.
Figuras y tablas -
Analysis 7.10

Comparison 7 Ciprofloxacin versus placebo added to cycled and culture‐based inhaled tobramycin, Outcome 10 Participants with one or more serious adverse event.

Comparison 1. Inhaled tobramycin versus placebo

Outcome or subgroup title

No. of studies

No. of participants

Statistical method

Effect size

1 Positive respiratory culture for P. aeruginosa (300 mg 2x daily) Show forest plot

1

Odds Ratio (M‐H, Fixed, 95% CI)

Totals not selected

1.1 At 1 month

1

Odds Ratio (M‐H, Fixed, 95% CI)

0.0 [0.0, 0.0]

1.2 At 2 months

1

Odds Ratio (M‐H, Fixed, 95% CI)

0.0 [0.0, 0.0]

2 Positive respiratory culture for P. aeruginosa (80 mg 2x daily) Show forest plot

1

Odds Ratio (M‐H, Fixed, 95% CI)

Totals not selected

2.1 At 1 month

1

Odds Ratio (M‐H, Fixed, 95% CI)

0.0 [0.0, 0.0]

2.2 At 2 months

1

Odds Ratio (M‐H, Fixed, 95% CI)

0.0 [0.0, 0.0]

2.3 At 3 months

1

Odds Ratio (M‐H, Fixed, 95% CI)

0.0 [0.0, 0.0]

2.4 At 6 months

1

Odds Ratio (M‐H, Fixed, 95% CI)

0.0 [0.0, 0.0]

2.5 At 12 months

1

Odds Ratio (M‐H, Fixed, 95% CI)

0.0 [0.0, 0.0]

3 Positive respiratory culture for P. aeruginosa (combined available case analysis) Show forest plot

2

Odds Ratio (M‐H, Fixed, 95% CI)

Subtotals only

3.1 At 1 month

2

38

Odds Ratio (M‐H, Fixed, 95% CI)

0.06 [0.01, 0.33]

3.2 At 2 months

2

38

Odds Ratio (M‐H, Fixed, 95% CI)

0.15 [0.03, 0.65]

4 Positive respiratory culture for P. aeruginosa (combined) ‐ best case Show forest plot

2

Odds Ratio (M‐H, Fixed, 95% CI)

Subtotals only

4.1 At 1 month

2

39

Odds Ratio (M‐H, Fixed, 95% CI)

0.06 [0.01, 0.30]

4.2 At 2 months

2

39

Odds Ratio (M‐H, Fixed, 95% CI)

0.14 [0.03, 0.60]

4.3 At 3 months

1

18

Odds Ratio (M‐H, Fixed, 95% CI)

0.14 [0.02, 1.16]

4.4 At 6 months

1

18

Odds Ratio (M‐H, Fixed, 95% CI)

0.04 [0.00, 0.48]

4.5 At 12 months

1

18

Odds Ratio (M‐H, Fixed, 95% CI)

0.01 [0.00, 0.26]

5 Positive respiratory culture for P. aeruginosa (combined) ‐ worst case Show forest plot

2

Odds Ratio (M‐H, Fixed, 95% CI)

Subtotals only

5.1 At 1 month

2

39

Odds Ratio (M‐H, Fixed, 95% CI)

0.08 [0.02, 0.38]

5.2 At 2 months

2

39

Odds Ratio (M‐H, Fixed, 95% CI)

0.18 [0.04, 0.73]

5.3 At 3 months

1

18

Odds Ratio (M‐H, Fixed, 95% CI)

0.36 [0.05, 2.77]

5.4 At 6 months

1

18

Odds Ratio (M‐H, Fixed, 95% CI)

0.16 [0.01, 1.83]

5.5 At 12 months

1

18

Odds Ratio (M‐H, Fixed, 95% CI)

0.36 [0.05, 2.77]

6 Change in weight from baseline Show forest plot

1

Mean Difference (IV, Fixed, 95% CI)

Totals not selected

6.1 At 1 month

1

Mean Difference (IV, Fixed, 95% CI)

0.0 [0.0, 0.0]

6.2 At 2 months

1

Mean Difference (IV, Fixed, 95% CI)

0.0 [0.0, 0.0]

7 Adverse events Show forest plot

1

Odds Ratio (M‐H, Fixed, 95% CI)

Totals not selected

7.1 Cough

1

Odds Ratio (M‐H, Fixed, 95% CI)

0.0 [0.0, 0.0]

8 Change in modified Shwachmann score from baseline Show forest plot

1

Mean Difference (IV, Fixed, 95% CI)

Totals not selected

8.1 At 1 month

1

Mean Difference (IV, Fixed, 95% CI)

0.0 [0.0, 0.0]

8.2 At 2 months

1

Mean Difference (IV, Fixed, 95% CI)

0.0 [0.0, 0.0]

Figuras y tablas -
Comparison 1. Inhaled tobramycin versus placebo
Comparison 2. Oral ciprofloxacin and inhaled colistin versus no treatment

Outcome or subgroup title

No. of studies

No. of participants

Statistical method

Effect size

1 Proportion colonised with P. aeruginosa Show forest plot

1

Odds Ratio (M‐H, Fixed, 95% CI)

Totals not selected

1.1 At 3 months

1

Odds Ratio (M‐H, Fixed, 95% CI)

0.0 [0.0, 0.0]

1.2 At 6 months

1

Odds Ratio (M‐H, Fixed, 95% CI)

0.0 [0.0, 0.0]

1.3 At 12 months

1

Odds Ratio (M‐H, Fixed, 95% CI)

0.0 [0.0, 0.0]

1.4 At 24 months

1

Odds Ratio (M‐H, Fixed, 95% CI)

0.0 [0.0, 0.0]

Figuras y tablas -
Comparison 2. Oral ciprofloxacin and inhaled colistin versus no treatment
Comparison 3. Oral ciprofloxacin and inhaled colistin versus inhaled tobramycin

Outcome or subgroup title

No. of studies

No. of participants

Statistical method

Effect size

1 Positive respiratory culture for P.aeruginosa Show forest plot

1

Odds Ratio (M‐H, Fixed, 95% CI)

Totals not selected

1.1 In first 6 months

1

Odds Ratio (M‐H, Fixed, 95% CI)

0.0 [0.0, 0.0]

1.2 At 24 months

1

Odds Ratio (M‐H, Fixed, 95% CI)

0.0 [0.0, 0.0]

2 Adverse events Show forest plot

1

Odds Ratio (M‐H, Fixed, 95% CI)

Totals not selected

2.1 Severe cough

1

Odds Ratio (M‐H, Fixed, 95% CI)

0.0 [0.0, 0.0]

Figuras y tablas -
Comparison 3. Oral ciprofloxacin and inhaled colistin versus inhaled tobramycin
Comparison 4. Nebulised tobramycin 28 days versus 56 days

Outcome or subgroup title

No. of studies

No. of participants

Statistical method

Effect size

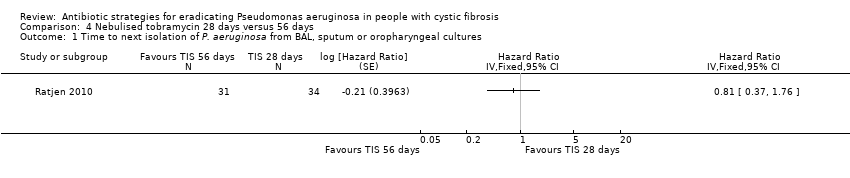
1 Time to next isolation of P. aeruginosa from BAL, sputum or oropharyngeal cultures Show forest plot

1

Hazard Ratio (Fixed, 95% CI)

Totals not selected

2 Number of respiratory exacerbations Show forest plot

1

Odds Ratio (M‐H, Fixed, 95% CI)

Totals not selected

2.1 Until recurrence of P. aeruginosa

1

Odds Ratio (M‐H, Fixed, 95% CI)

0.0 [0.0, 0.0]

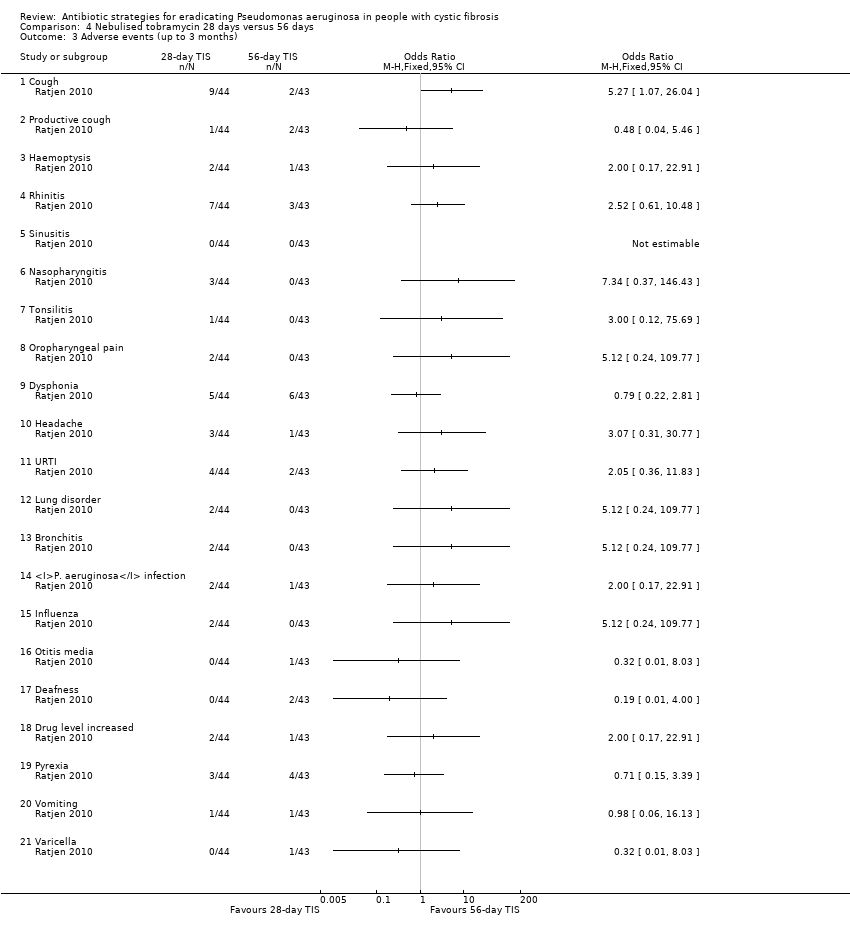
3 Adverse events (up to 3 months) Show forest plot

1

Odds Ratio (M‐H, Fixed, 95% CI)

Totals not selected

3.1 Cough

1

Odds Ratio (M‐H, Fixed, 95% CI)

0.0 [0.0, 0.0]

3.2 Productive cough

1

Odds Ratio (M‐H, Fixed, 95% CI)

0.0 [0.0, 0.0]

3.3 Haemoptysis

1

Odds Ratio (M‐H, Fixed, 95% CI)

0.0 [0.0, 0.0]

3.4 Rhinitis

1

Odds Ratio (M‐H, Fixed, 95% CI)

0.0 [0.0, 0.0]

3.5 Sinusitis

1

Odds Ratio (M‐H, Fixed, 95% CI)

0.0 [0.0, 0.0]

3.6 Nasopharyngitis

1

Odds Ratio (M‐H, Fixed, 95% CI)

0.0 [0.0, 0.0]

3.7 Tonsilitis

1

Odds Ratio (M‐H, Fixed, 95% CI)

0.0 [0.0, 0.0]

3.8 Oropharyngeal pain

1

Odds Ratio (M‐H, Fixed, 95% CI)

0.0 [0.0, 0.0]

3.9 Dysphonia

1

Odds Ratio (M‐H, Fixed, 95% CI)

0.0 [0.0, 0.0]

3.10 Headache

1

Odds Ratio (M‐H, Fixed, 95% CI)

0.0 [0.0, 0.0]

3.11 URTI

1

Odds Ratio (M‐H, Fixed, 95% CI)

0.0 [0.0, 0.0]

3.12 Lung disorder

1

Odds Ratio (M‐H, Fixed, 95% CI)

0.0 [0.0, 0.0]

3.13 Bronchitis

1

Odds Ratio (M‐H, Fixed, 95% CI)

0.0 [0.0, 0.0]

3.14 P. aeruginosa infection

1

Odds Ratio (M‐H, Fixed, 95% CI)

0.0 [0.0, 0.0]

3.15 Influenza

1

Odds Ratio (M‐H, Fixed, 95% CI)

0.0 [0.0, 0.0]

3.16 Otitis media

1

Odds Ratio (M‐H, Fixed, 95% CI)

0.0 [0.0, 0.0]

3.17 Deafness

1

Odds Ratio (M‐H, Fixed, 95% CI)

0.0 [0.0, 0.0]

3.18 Drug level increased

1

Odds Ratio (M‐H, Fixed, 95% CI)

0.0 [0.0, 0.0]

3.19 Pyrexia

1

Odds Ratio (M‐H, Fixed, 95% CI)

0.0 [0.0, 0.0]

3.20 Vomiting

1

Odds Ratio (M‐H, Fixed, 95% CI)

0.0 [0.0, 0.0]

3.21 Varicella

1

Odds Ratio (M‐H, Fixed, 95% CI)

0.0 [0.0, 0.0]

4 Adverse events (over 3 months) Show forest plot

1

Odds Ratio (M‐H, Fixed, 95% CI)

Totals not selected

4.1 Cough

1

Odds Ratio (M‐H, Fixed, 95% CI)

0.0 [0.0, 0.0]

4.2 Productive cough

1

Odds Ratio (M‐H, Fixed, 95% CI)

0.0 [0.0, 0.0]

4.3 Haemoptysis

1

Odds Ratio (M‐H, Fixed, 95% CI)

0.0 [0.0, 0.0]

4.4 Rhinitis

1

Odds Ratio (M‐H, Fixed, 95% CI)

0.0 [0.0, 0.0]

4.5 Sinusitis

1

Odds Ratio (M‐H, Fixed, 95% CI)

0.0 [0.0, 0.0]

4.6 Nasopharyngitis

1

Odds Ratio (M‐H, Fixed, 95% CI)

0.0 [0.0, 0.0]

4.7 Tonsilitis

1

Odds Ratio (M‐H, Fixed, 95% CI)

0.0 [0.0, 0.0]

4.8 Oropharyngeal pain

1

Odds Ratio (M‐H, Fixed, 95% CI)

0.0 [0.0, 0.0]

4.9 Dysphonia

1

Odds Ratio (M‐H, Fixed, 95% CI)

0.0 [0.0, 0.0]

4.10 Headache

1

Odds Ratio (M‐H, Fixed, 95% CI)

0.0 [0.0, 0.0]

4.11 URTI

1

Odds Ratio (M‐H, Fixed, 95% CI)

0.0 [0.0, 0.0]

4.12 Lung disorder

1

Odds Ratio (M‐H, Fixed, 95% CI)

0.0 [0.0, 0.0]

4.13 Bronchitis

1

Odds Ratio (M‐H, Fixed, 95% CI)

0.0 [0.0, 0.0]

4.14 P. aeruginosa infection

1

Odds Ratio (M‐H, Fixed, 95% CI)

0.0 [0.0, 0.0]

4.15 Influenza

1

Odds Ratio (M‐H, Fixed, 95% CI)

0.0 [0.0, 0.0]

4.16 Otitis media

1

Odds Ratio (M‐H, Fixed, 95% CI)

0.0 [0.0, 0.0]

4.17 Deafness

1

Odds Ratio (M‐H, Fixed, 95% CI)

0.0 [0.0, 0.0]

4.18 Drug level increased

1

Odds Ratio (M‐H, Fixed, 95% CI)

0.0 [0.0, 0.0]

4.19 Pyrexia

1

Odds Ratio (M‐H, Fixed, 95% CI)

0.0 [0.0, 0.0]

4.20 Vomiting

1

Odds Ratio (M‐H, Fixed, 95% CI)

0.0 [0.0, 0.0]

4.21 Varicella

1

Odds Ratio (M‐H, Fixed, 95% CI)

0.0 [0.0, 0.0]

Figuras y tablas -
Comparison 4. Nebulised tobramycin 28 days versus 56 days
Comparison 5. Inhaled colistin/oral ciprofloxacin versus inhaled tobramycin/oral ciprofloxacin

Outcome or subgroup title

No. of studies

No. of participants

Statistical method

Effect size

1 Positive respiratory culture for P. aeruginosa Show forest plot

1

Odds Ratio (M‐H, Fixed, 95% CI)

Totals not selected

1.1 In first 6 months

1

Odds Ratio (M‐H, Fixed, 95% CI)

0.0 [0.0, 0.0]

1.2 At end of follow up (median 16 months)

1

Odds Ratio (M‐H, Fixed, 95% CI)

0.0 [0.0, 0.0]

2 Relative change in % predicted FEV1 from baseline (to mean 54 days) Show forest plot

1

Mean Difference (IV, Fixed, 95% CI)

Totals not selected

3 Post‐trial microbiology status Show forest plot

1

Odds Ratio (M‐H, Fixed, 95% CI)

Totals not selected

3.1 Stenotrophomonas maltophilia

1

Odds Ratio (M‐H, Fixed, 95% CI)

0.0 [0.0, 0.0]

3.2 Achromobacter xylosoxidans

1

Odds Ratio (M‐H, Fixed, 95% CI)

0.0 [0.0, 0.0]

3.3 Aspergillus species

1

Odds Ratio (M‐H, Fixed, 95% CI)

0.0 [0.0, 0.0]

4 Adverse events leading to trial discontinuation Show forest plot

1

Odds Ratio (M‐H, Fixed, 95% CI)

Totals not selected

4.1 Vomiting

1

Odds Ratio (M‐H, Fixed, 95% CI)

0.0 [0.0, 0.0]

4.2 Photosensitivity

1

Odds Ratio (M‐H, Fixed, 95% CI)

0.0 [0.0, 0.0]

4.3 Wheeze

1

Odds Ratio (M‐H, Fixed, 95% CI)

0.0 [0.0, 0.0]

4.4 Pulmonary exacerbation during early eradication treatment

1

Odds Ratio (M‐H, Fixed, 95% CI)

0.0 [0.0, 0.0]

4.5 Lack of compliance

1

Odds Ratio (M‐H, Fixed, 95% CI)

0.0 [0.0, 0.0]

Figuras y tablas -
Comparison 5. Inhaled colistin/oral ciprofloxacin versus inhaled tobramycin/oral ciprofloxacin
Comparison 6. Cycled inhaled tobramycin versus culture‐based inhaled tobramycin

Outcome or subgroup title

No. of studies

No. of participants

Statistical method

Effect size

1 Participants with one or more isolates of P. aeruginosa from respiratory tract Show forest plot

1

Odds Ratio (IV, Fixed, 95% CI)

Totals not selected

2 Mean 70‐week change in FEV1 % predicted Show forest plot

1

Mean Difference (IV, Fixed, 95% CI)

Totals not selected

3 Mean 70‐week change in weight from baseline Show forest plot

1

Mean Difference (IV, Fixed, 95% CI)

Totals not selected

4 Mean 70‐week change in height from baseline Show forest plot

1

Mean Difference (IV, Fixed, 95% CI)

Totals not selected

5 Time to severe pulmonary exacerbation Show forest plot

1

Hazard Ratio (Fixed, 95% CI)

Totals not selected

6 Participants with one or more severe pulmonary exacerbations Show forest plot

1

Odds Ratio (IV, Fixed, 95% CI)

Totals not selected

7 Time to pulmonary exacerbation (any severity) Show forest plot

1

Hazard Ratio (Fixed, 95% CI)

Totals not selected

8 Participants with one or more pulmonary exacerbations (any severity) Show forest plot

1

Odds Ratio (IV, Fixed, 95% CI)

Totals not selected

9 Participants with new isolates of Stenotrophomonas maltophilia Show forest plot

1

Odds Ratio (IV, Fixed, 95% CI)

Totals not selected

10 Participants with one or more serious adverse event Show forest plot

1

Odds Ratio (IV, Fixed, 95% CI)

Totals not selected

Figuras y tablas -
Comparison 6. Cycled inhaled tobramycin versus culture‐based inhaled tobramycin
Comparison 7. Ciprofloxacin versus placebo added to cycled and culture‐based inhaled tobramycin

Outcome or subgroup title

No. of studies

No. of participants

Statistical method

Effect size

1 Participants with one or more isolates of P. aeruginosa from respiratory tract Show forest plot

1

Odds Ratio (IV, Fixed, 95% CI)

Totals not selected

2 Mean 70‐week change in FEV1 % predicted Show forest plot

1

Mean Difference (IV, Fixed, 95% CI)

Totals not selected

3 Mean 70‐week change in weight from baseline Show forest plot

1

Mean Difference (IV, Fixed, 95% CI)

Totals not selected

4 Mean 70‐week change in height from baseline Show forest plot

1

Mean Difference (IV, Fixed, 95% CI)

Totals not selected

5 Time to severe pulmonary exacerbation Show forest plot

1

Hazard Ratio (Fixed, 95% CI)

Totals not selected

6 Participants with one or more severe pulmonary exacerbations Show forest plot

1

Odds Ratio (IV, Fixed, 95% CI)

Totals not selected

7 Time to pulmonary exacerbation (any severity) Show forest plot

1

Hazard Ratio (Fixed, 95% CI)

Totals not selected

8 Participants with one of more pulmonary exacerbation (any severity) Show forest plot

1

Odds Ratio (IV, Fixed, 95% CI)

Totals not selected

9 Participants with new isolates of Stenotrophomonas maltophilia Show forest plot

1

Odds Ratio (IV, Fixed, 95% CI)

Totals not selected

10 Participants with one or more serious adverse event Show forest plot

1

Odds Ratio (IV, Fixed, 95% CI)

Totals not selected

Figuras y tablas -
Comparison 7. Ciprofloxacin versus placebo added to cycled and culture‐based inhaled tobramycin