Fluoxetina versus otros tipos de farmacoterapia para la depresión
Resumen
Antecedentes
La depresión es frecuente en la atención primaria y está asociada a una marcada morbilidad personal, social y económica, lo que crea una importante demanda para los proveedores de servicios. El antidepresivo fluoxetina ha sido estudiado en muchos ensayos controlados aleatorizados (ECA) en comparación con otros antidepresivos convencionales y no convencionales. Sin embargo, estos estudios han producido resultados contradictorios. En otras revisiones sistemáticas se ha considerado que los inhibidores selectivos de la recaptación de serotonina (ISRS) constituyen un grupo que limita la aplicabilidad de los resultados de la fluoxetina sola. Por lo tanto, esta revisión tiene por objeto proporcionar información específica y clínicamente útil con respecto a los efectos de la fluoxetina para la depresión en comparación con los tricíclicos (ATC), los ISRS, los inhibidores de la recaptación de serotonina‐noradrenalina (IRSN), los inhibidores de la monoaminoxidasa (IMAO) y los agentes más recientes, y otros agentes convencionales y no convencionales.
Objetivos
Evaluar los efectos de la fluoxetina en comparación con todos los demás agentes antidepresivos para la depresión en personas adultas con trastorno depresivo mayor unipolar.
Métodos de búsqueda
Se realizaron búsquedas en el Registro de Ensayos Controlados del Grupo de Revisión de la Colaboración Cochrane de Depresión, Ansiedad y Neurosis (Cochrane Collaboration Depression, Anxiety and Neurosis Review Group) (CCDANCTR) hasta el 11 de mayo de 2012. Este registro incluye los ECA pertinentes del Registro Cochrane Central de Ensayos Controlados (Cochrane Central Register of Controlled Trials, CENTRAL) (todos los años), MEDLINE (1950 hasta la fecha), EMBASE (1974 hasta la fecha) y PsycINFO (1967 hasta la fecha). No se aplicaron restricciones de idioma. Se realizaron búsquedas manuales en las listas de referencias de los artículos pertinentes y en revisiones sistemáticas anteriores. Se estableció contactó con la empresa farmacéutica que comercializa la fluoxetina y con expertos en este campo para obtener datos complementarios.
Criterios de selección
Se incluyeron todos los ECA que comparaban la fluoxetina con cualquier otro DA (incluidos los agentes no convencionales como el hipérico) para pacientes con trastorno depresivo mayor unipolar (independientemente de los criterios de diagnóstico utilizados). Para los ensayos que tenían un diseño cruzado, sólo se consideraron los resultados del primer período de aleatorización.
Obtención y análisis de los datos
Dos autores de la revisión extrajeron los datos de forma independiente mediante un formulario estándar. Las respuestas al tratamiento se calcularon sobre la base de la intención de tratamiento: los abandonos se incluyeron siempre en este análisis. Cuando los datos sobre los abandonos se contabilizaban y se incluían en la evaluación de eficacia, se analizaron según los estudios primarios; cuando los abandonos se excluían de cualquier evaluación en los estudios primarios, se consideraron como fracasos del tratamiento. Las puntuaciones de los resultados continuos se analizaron incluyendo a los pacientes con una evaluación final o con la última observación realizada. Los datos de tolerancia se analizaron calculando la proporción de pacientes que no pudieron completar el estudio por cualquier causa y debido a efectos secundarios o ineficacia. Para los datos dicotómicos, se calcularon los odds ratios (OR) con intervalos de confianza (IC) del 95% mediante el modelo de efectos aleatorios. Los datos continuos se analizaron mediante las diferencias de medias estandarizadas (DME) con IC del 95%.
Resultados principales
En el análisis se incluyeron 171 estudios (24.868 participantes). Los estudios incluidos se realizaron entre 1984 y 2012. Los estudios tenían características homogéneas en cuanto a diseño, intervención y medidas de resultado. La evaluación de la calidad con la herramienta de riesgo de sesgo reveló que la gran mayoría de ellas no informaba de los detalles metodológicos, como el método de generación de secuencias aleatorias, la ocultación de la asignación y el cegamiento. Además, la mayoría de los estudios incluidos fueron patrocinados por empresas farmacéuticas, por lo que al interpretar los resultados debe tenerse en cuenta la posibilidad de una sobreestimación del efecto del tratamiento debido al sesgo de patrocinio. La fluoxetina fue tan efectiva como los ATC cuando se la considera como un grupo tanto en un resultado dicotómico (reducción de al menos el 50% en la Escala de Depresión de Hamilton) (OR 0,97, IC del 95%: 0,77 a 1,22, 24 ECA, 2124 participantes) como en un resultado continuo (puntuaciones medias al final del ensayo o puntuación de cambio en las medidas de depresión) (DME 0,03, IC del 95%: ‐0,07 a 0,14, 50 ECA, 3393 participantes). En un resultado dicotómico, la fluoxetina fue menos efectiva que la dotiepina o la dosulepina (OR 2,13; IC del 95%: 1,08 a 4,20; número necesario a tratar (NNT) = 6; IC del 95%: 3 a 50; 2 ECA; 144 participantes), la sertralina (OR 1,37; IC del 95%: 1,08 a 1.74; NNT = 13, IC del 95%: 7 a 58, 6 ECA, 1188 participantes), mirtazapina (OR 1,46, IC del 95%: 1,04 a 2,04; NNT = 12, IC del 95%: 6 a 134, 4 ECA, 600 participantes) y venlafaxina (OR 1,29, IC del 95%: 1,10 a 1,51; NNT = 11, IC del 95%: 8 a 16, 12 ECA, 3387 participantes). En un resultado continuo, la fluoxetina fue más efectiva que el ABT‐200 (DME ‐1,85; IC del 95%: ‐2,25 a ‐1,45; un ECA, 141 participantes) y el milnaciprán (DME ‐0,36; IC del 95%: ‐0,63 a ‐0,08; dos ECA, 213 participantes); por el contrario, fue menos efectiva que la venlafaxina (DME 0,10; IC del 95%: 0 a 0,19; 13 ECA, 3097 participantes). La fluoxetina fue mejor tolerada que los ATC considerados como grupo (OR total de abandonos 0,79; IC del 95%: 0,65 a 0,96; NNT = 20; IC del 95%: 13 a 48; 49 ECA; 4194 participantes) y fue mejor tolerada en comparación con los EA individuales, en particular la amitriptilina (OR total de abandonos 0,62; IC del 95%: 0,46 a 0.85; NNT = 13, IC del 95% 8 a 39, 18 ECA 1089 participantes), y entre los EA más nuevos ABT‐200 (abandono total OR 0,18, IC del 95% 0,08 a 0,39; NNT = 3, IC del 95% 2 a 5, 1 ECA, 144 participantes), pramipexol (abandono total OR 0.12, IC del 95%: 0,03 a 0,42; NNT = 3, IC del 95%: 2 a 5, 1 ECA, 105 participantes), y reboxetina (abandono total OR 0,60, IC del 95%: 0,44 a 0,82, NNT = 9, IC del 95%: 6 a 24, 4 ECA, 764 participantes).
Conclusiones de los autores
El presente estudio detectó diferencias en términos de eficacia y tolerabilidad entre la fluoxetina y ciertos EA, pero el significado clínico de estas diferencias es incierto. Además, la evaluación de la calidad con el instrumento del riesgo de sesgo mostró que la gran mayoría de los estudios incluidos no informaban de los detalles de los procedimientos metodológicos. Por consiguiente, no pueden extraerse conclusiones definitivas de los resultados de los estudios. El mejor perfil de eficacia de la sertralina y la venlafaxina (y posiblemente de otras EA) con respecto a la fluoxetina puede ser clínicamente significativo, como ya se ha sugerido en otras revisiones sistemáticas. Además de los datos de eficacia, las decisiones de tratamiento también deben basarse en consideraciones de toxicidad del fármaco, aceptabilidad del paciente y coste.
Resumen en términos sencillos
La fluoxetina comparada con otros antidepresivos para la depresión en adultos
La depresión es una enfermedad mental grave que se caracteriza por la persistencia de un estado de ánimo bajo y la pérdida de todo interés y placer, acompañada generalmente de una serie de síntomas como cambios en el apetito, alteraciones del sueño y falta de concentración. Las opciones de tratamiento predominantes para la depresión son los medicamentos y las terapias psicológicas, pero los medicamentos antidepresivos son el tratamiento más común para la depresión de moderada a grave. La fluoxetina, uno de los primeros antidepresivos de nueva generación, es un tratamiento farmacológico muy popular para la depresión. Sin embargo, los resultados de los estudios que comparan la fluoxetina con otros antidepresivos son controvertidos. En esta revisión sistemática, se comparó la eficacia y la tolerabilidad de la fluoxetina con otros antidepresivos para el tratamiento de la depresión aguda.
En mayo de 2012 se buscó, de manera amplia, todos los estudios útiles (ensayos controlados aleatorizados o ECA) que se pudo encontrar y que comparaban la fluoxetina con cualquier otro antidepresivo para tratar a los pacientes con depresión. Se incluyeron ciento setenta y un ECA, con 24.868 personas en los análisis. Combinando los resultados de todos los ensayos, la fluoxetina fue igualmente eficaz, pero mejor tolerada, que los antidepresivos de la generación anterior (tricíclicos). En comparación con otros antidepresivos de nueva generación, se encontraron importantes diferencias de eficacia y de tolerabilidad entre la fluoxetina y algunos de los antidepresivos; por ejemplo, la fluoxetina era menos eficaz que la sertralina y la mirtazapina, pero mejor tolerada que la reboxetina. Estas diferencias podrían tener un impacto clínico en la práctica diaria. Sin embargo, al interpretar estas diferencias es importante tener en cuenta que los estudios fueron de corta duración (ocho semanas o menos) y que el tamaño medio de cada ensayo fue pequeño (cada uno incluyó alrededor de 100 personas). Además, la mayoría de los estudios incluidos fueron patrocinados por las empresas farmacéuticas, lo que podría haber dado lugar a una sobreestimación del efecto del tratamiento. Por consiguiente, es difícil sacar conclusiones claras y clínicamente significativas. Se necesita información más fiable sobre los respectivos perfiles de seguridad de los antidepresivos.
Authors' conclusions
Summary of findings
| Fluoxetine compared to TCAs | ||||||
| Patient or population: patients with depression | ||||||
| Outcomes | Illustrative comparative risks* (95% CI) | Relative effect | No of Participants | Quality of the evidence | Comments | |
| Assumed risk | Corresponding risk | |||||
| TCAs | Fluoxetine | |||||
| Failure to respond (reduction ≥ 50% on HDRS) | 471 per 1000 | 463 per 1000 | OR 0.97 | 2124 | ⊕⊕⊕⊝ | |
| Endpoint score (HDRS or MADRS) | The mean endpoint score in the intervention groups was | 3393 | ⊕⊕⊕⊝ | This effect approaches zero | ||
| Failure to complete ‐ total ‐ | 335 per 1000 | 284 per 1000 | OR 0.79 | 4194 | ⊕⊕⊕⊝ | |
| Failure to complete ‐ side effects ‐ | 193 per 1000 | 116 per 1000 | OR 0.55 | 3647 | ⊕⊕⊕⊝ | |
| Failure to complete ‐ inefficacy ‐ | 68 per 1000 | 87 per 1000 | OR 1.29 | 2911 | ⊕⊕⊕⊝ | |
| *The basis for the assumed risk (e.g. the median control group risk across studies) is provided in footnotes. The corresponding risk (and its 95% confidence interval) is based on the assumed risk in the comparison group and the relative effect of the intervention (and its 95% CI). | ||||||
| GRADE Working Group grades of evidence | ||||||
| 1 Limitations in study design: no details on randomisation procedures and allocation concealment. Blinding stated but not tested. | ||||||
| Fluoxetine compared to ABT 200 | ||||||
| Patient or population: patients with depression | ||||||
| Outcomes | Illustrative comparative risks* (95% CI) | Relative effect | No of Participants | Quality of the evidence | Comments | |
| Assumed risk | Corresponding risk | |||||
| ABT 200 | Fluoxetine | |||||
| Failure to respond (reduction ≥ 50% on HDRS) | 0 per 1000 | Not estimable | 0 (0) | |||
| Endpoint score (HDRS or MADRS) | The mean endpoint score in the intervention groups was | 141 | ⊕⊕⊝⊝ | This corresponds to a large effect according | ||
| Failure to complete ‐ total ‐ | 528 per 1000 | 167 per 1000 | OR 0.18 | 144 | ⊕⊕⊝⊝ | |
| Failure to complete ‐ inefficacy ‐ | 56 per 1000 | 14 per 1000 | OR 0.24 | 144 | ⊕⊕⊝⊝ | |
| Failure to complete ‐ side effects ‐ | 361 per 1000 | 43 per 1000 | OR 0.08 | 144 | ⊕⊕⊝⊝ | |
| *The basis for the assumed risk (e.g. the median control group risk across studies) is provided in footnotes. The corresponding risk (and its 95% confidence interval) is based on the assumed risk in the comparison group and the relative effect of the intervention (and its 95% CI). | ||||||
| GRADE Working Group grades of evidence | ||||||
| 1 Limitations in study design: no details on randomisation procedures and allocation concealment. Blinding stated but not tested. Only one study included in the analysis. | ||||||
| Fluoxetine compared to agomelatine | ||||||
| Patient or population: patients with depression | ||||||
| Outcomes | Illustrative comparative risks* (95% CI) | Relative effect | No of Participants | Quality of the evidence | Comments | |
| Assumed risk | Corresponding risk | |||||
| Agomelatine | Fluoxetine | |||||
| Failure to respond (reduction ≥ 50% on HDRS) | 282 per 1000 | 361 per 1000 | OR 1.44 | 515 | ⊕⊕⊝⊝ | |
| Endpoint score (HDRS or MADRS) | The mean endpoint score in the intervention groups was | 1213 | ⊕⊕⊕⊝ | This effect approaches zero | ||
| Failure to complete ‐ total ‐ | 135 per 1000 | 170 per 1000 | OR 1.31 | 785 | ⊕⊕⊕⊝ | |
| Failure to complete ‐ inefficacy ‐ | 55 per 1000 | 59 per 1000 | OR 1.08 | 785 | ⊕⊕⊕⊝ | |
| Failure to complete ‐ side effects ‐ | 34 per 1000 | 50 per 1000 | OR 1.51 | 785 | ⊕⊕⊕⊝ | |
| *The basis for the assumed risk (e.g. the median control group risk across studies) is provided in footnotes. The corresponding risk (and its 95% confidence interval) is based on the assumed risk in the comparison group and the relative effect of the intervention (and its 95% CI). | ||||||
| GRADE Working Group grades of evidence | ||||||
| 1 Limitations in studies designs: no details on randomisation procedures and allocation concealment. Blinding stated but not tested. 2 Only one study included in this analysis. | ||||||
| Fluoxetine compared to amineptine | ||||||
| Patient or population: patients with depression | ||||||
| Outcomes | Illustrative comparative risks* (95% CI) | Relative effect | No of Participants | Quality of the evidence | Comments | |
| Assumed risk | Corresponding risk | |||||
| Amineptine | Fluoxetine | |||||
| Failure to respond (reduction ≥ 50% on HDRS) | 719 per 1000 | 486 per 1000 | OR 0.37 | 63 | ⊕⊕⊕⊝ | |
| Endpoint score (HDRS or MADRS) | The mean endpoint score in the intervention groups was | 0 (0) | No data available on this outcome | |||
| Failure to complete ‐ total ‐ | 210 per 1000 | 140 per 1000 | OR 0.61 | 232 | ⊕⊕⊕⊝ | |
| Failure to complete ‐ inefficacy ‐ | 94 per 1000 | 97 per 1000 | OR 1.04 | 63 | ⊕⊕⊕⊝ | |
| Failure to complete ‐ side effects ‐ (Copy) | 84 per 1000 | 46 per 1000 | OR 0.52 | 232 | ⊕⊕⊕⊝ | |
| *The basis for the assumed risk (e.g. the median control group risk across studies) is provided in footnotes. The corresponding risk (and its 95% confidence interval) is based on the assumed risk in the comparison group and the relative effect of the intervention (and its 95% CI). | ||||||
| GRADE Working Group grades of evidence | ||||||
| 1 Limitations in studies designs: no details on randomisation procedures and allocation concealment. Blinding stated but not tested. | ||||||
| Fluoxetine compared to amisulpride | ||||||
| Patient or population: patients with depression | ||||||
| Outcomes | Illustrative comparative risks* (95% CI) | Relative effect | No of Participants | Quality of the evidence | Comments | |
| Assumed risk | Corresponding risk | |||||
| Amisulpride | Fluoxetine | |||||
| Failure to respond (reduction ≥ 50% on HDRS) | 0 per 1000 | Not estimable | 0 (0) | |||
| Endpoint score (HDRS or MADRS) | The mean endpoint score in the intervention groups was | 268 | ⊕⊕⊝⊝ | This corresponds to a very small effect according | ||
| Failure to complete ‐ total ‐ | 225 per 1000 | 288 per 1000 | OR 1.39 | 281 | ⊕⊕⊝⊝ | |
| Failure to complete ‐ inefficacy ‐ | 56 per 1000 | 65 per 1000 | OR 1.16 | 281 | ⊕⊕⊝⊝ | |
| Failure to complete ‐ side effects ‐ | 92 per 1000 | 72 per 1000 | OR 0.77 | 281 | ⊕⊕⊝⊝ | |
| *The basis for the assumed risk (e.g. the median control group risk across studies) is provided in footnotes. The corresponding risk (and its 95% confidence interval) is based on the assumed risk in the comparison group and the relative effect of the intervention (and its 95% CI). | ||||||
| GRADE Working Group grades of evidence | ||||||
| 1 Limitations in studies designs: no details on randomisation procedures and allocation concealment. Blinding stated but not tested. Only one study included in the analysis. | ||||||
| Fluoxetine compared to bupropion | ||||||
| Patient or population: patients with depression | ||||||
| Outcomes | Illustrative comparative risks* (95% CI) | Relative effect | No of Participants | Quality of the evidence | Comments | |
| Assumed risk | Corresponding risk | |||||
| Bupropion | Fluoxetine | |||||
| Failure to respond (reduction ≥ 50% on HDRS) | 493 per 1000 | 447 per 1000 | OR 0.83 | 436 | ⊕⊕⊕⊝ | |
| Endpoint score (HDRS or MADRS) | The mean endpoint score in the intervention groups was | 0 (0) | No data available on this outcome | |||
| Failure to complete ‐ total ‐ | 356 per 1000 | 356 per 1000 | OR 1.00 | 436 | ⊕⊕⊕⊝ | |
| Failure to complete ‐ inefficacy ‐ | 23 per 1000 | 0 per 1000 | OR 1.16 | 436 | ⊕⊕⊕⊝ | |
| Failure to complete ‐ side effects ‐ | 59 per 1000 | 60 per 1000 | OR 1.01 | 436 | ⊕⊕⊕⊝ | |
| *The basis for the assumed risk (e.g. the median control group risk across studies) is provided in footnotes. The corresponding risk (and its 95% confidence interval) is based on the assumed risk in the comparison group and the relative effect of the intervention (and its 95% CI). | ||||||
| GRADE Working Group grades of evidence | ||||||
| 1 Limitations in studies designs: no details on randomisation procedures and allocation concealment. Blinding stated but not tested. | ||||||
| Fluoxetine compared to citalopram | ||||||
| Patient or population: patients with depression | ||||||
| Outcomes | Illustrative comparative risks* (95% CI) | Relative effect | No of Participants | Quality of the evidence | Comments | |
| Assumed risk | Corresponding risk | |||||
| Citalopram | Fluoxetine | |||||
| Failure to respond (reduction ≥ 50% on HDRS) | 379 per 1000 | 268 per 1000 | OR 0.60 | 59 | ⊕⊝⊝⊝ | |
| Endpoint score (HDRS or MADRS) | The mean endpoint score in the intervention groups was | 661 | ⊕⊕⊕⊝ | This effect approaches zero | ||
| Failure to complete ‐ total ‐ | 211 per 1000 | 189 per 1000 | OR 0.87 | 732 | ⊕⊕⊕⊝ | |
| Failure to complete ‐ inefficacy ‐ | 75 per 1000 | 66 per 1000 | OR 0.87 | 732 | ⊕⊕⊕⊝ | |
| Failure to complete ‐ side effects ‐ | 75 per 1000 | 49 per 1000 | OR 0.64 | 732 | ⊕⊕⊕⊝ | |
| *The basis for the assumed risk (e.g. the median control group risk across studies) is provided in footnotes. The corresponding risk (and its 95% confidence interval) is based on the assumed risk in the comparison group and the relative effect of the intervention (and its 95% CI). | ||||||
| GRADE Working Group grades of evidence | ||||||
| 1 Limitations in studies designs: no details on randomisation procedures and allocation concealment. Blinding stated but not tested. 2 Only one study included in the analysis and less than 100 patients. | ||||||
| Fluoxetine compared to Crocus sativus | ||||||
| Patient or population: patients with depression | ||||||
| Outcomes | Illustrative comparative risks* (95% CI) | Relative effect | No of Participants | Quality of the evidence | Comments | |
| Assumed risk | Corresponding risk | |||||
| Crocus sativus | Fluoxetine | |||||
| Failure to respond (reduction ≥ 50% on HDRS) | 250 per 1000 | 150 per 1000 | OR 0.53 | 40 | ⊕⊝⊝⊝ | |
| Endpoint score (HDRS or MADRS) | The mean endpoint score in the intervention groups was | 0 (0) | No data available on this outcome | |||
| Failure to complete ‐ total ‐ | 50 per 1000 | 50 per 1000 | OR 1.00 | 40 | ⊕⊝⊝⊝ | |
| Failure to complete ‐ inefficacy ‐ | 0 per 1000 | Not estimable | 0 (0) | |||
| Failure to complete ‐ side effects ‐ | 0 per 1000 | Not estimable | 0 (0) | |||
| *The basis for the assumed risk (e.g. the median control group risk across studies) is provided in footnotes. The corresponding risk (and its 95% confidence interval) is based on the assumed risk in the comparison group and the relative effect of the intervention (and its 95% CI). | ||||||
| GRADE Working Group grades of evidence | ||||||
| 1 Limitations in studies designs: no details on randomisation procedures and allocation concealment. Blinding stated but not tested. Only one study included in the analysis and less than 50 patients. | ||||||
| Fluoxetine compared to for duloxetine | ||||||
| Patient or population: patients with depression | ||||||
| Outcomes | Illustrative comparative risks* (95% CI) | Relative effect | No of Participants | Quality of the evidence | Comments | |
| Assumed risk | Corresponding risk | |||||
| Fluoxetine | ||||||
| Failure to respond (reduction ≥ 50% on HDRS) | 400 per 1000 | 485 per 1000 | OR 1.41 | 103 | ⊕⊕⊝⊝ | |
| Endpoint score (HDRS or MADRS) | The mean endpoint score in the intervention groups was | 0 (0) | No data available on this outcome | |||
| Failure to complete ‐ total ‐ | 281 per 1000 | 260 per 1000 | OR 0.90 | 532 | ⊕⊕⊕⊝ | |
| Failure to complete ‐ inefficacy ‐ | 15 per 1000 | 47 per 1000 | OR 3.33 | 432 | ⊕⊕⊕⊝ | |
| Failure to complete ‐ side effects ‐ | 66 per 1000 | 19 per 1000 | OR 0.28 | 532 | ⊕⊕⊕⊝ | |
| *The basis for the assumed risk (e.g. the median control group risk across studies) is provided in footnotes. The corresponding risk (and its 95% confidence interval) is based on the assumed risk in the comparison group and the relative effect of the intervention (and its 95% CI). | ||||||
| GRADE Working Group grades of evidence | ||||||
| 1 Limitations in studies designs: no details on randomisation procedures and allocation concealment. Blinding stated but not tested. 2 Only one study included in the analysis. | ||||||
| Fluoxetine compared to escitalopram | ||||||
| Patient or population: patients with depression | ||||||
| Outcomes | Illustrative comparative risks* (95% CI) | Relative effect | No of Participants | Quality of the evidence | Comments | |
| Assumed risk | Corresponding risk | |||||
| Escitalopram | Fluoxetine | |||||
| Failure to respond (reduction ≥ 50% on HDRS) | 236 per 1000 | 239 per 1000 | OR 1.02 | 240 | ⊕⊕⊝⊝ | |
| Endpoint score (HDRS or MADRS) | The mean endpoint score in the intervention groups was | 231 | ⊕⊕⊝⊝ | This effect approaches zero | ||
| Failure to complete ‐ total ‐ | 148 per 1000 | 210 per 1000 | OR 1.53 | 578 | ⊕⊕⊕⊝ | |
| Failure to complete ‐ inefficacy ‐ | 13 per 1000 | 23 per 1000 | OR 1.74 | 578 | ⊕⊕⊕⊝ | |
| Failure to complete ‐ side effects ‐ | 77 per 1000 | 89 per 1000 | OR 1.17 | 578 | ⊕⊕⊕⊝ | |
| *The basis for the assumed risk (e.g. the median control group risk across studies) is provided in footnotes. The corresponding risk (and its 95% confidence interval) is based on the assumed risk in the comparison group and the relative effect of the intervention (and its 95% CI). | ||||||
| GRADE Working Group grades of evidence | ||||||
| 1 Limitations in studies designs: no details on randomisation procedures and allocation concealment. Blinding stated but not tested. 2 Only one study included in the analysis. | ||||||
| Fluoxetine compared to fluvoxamine | ||||||
| Patient or population: patients with depression | ||||||
| Outcomes | Illustrative comparative risks* (95% CI) | Relative effect | No of Participants | Quality of the evidence | Comments | |
| Assumed risk | Corresponding risk | |||||
| Fluvoxamine | Fluoxetine | |||||
| Failure to respond (reduction ≥ 50% on HDRS) | 605 per 1000 | 592 per 1000 | OR 0.95 | 177 | ⊕⊕⊝⊝ | |
| Endpoint score (HDRS or MADRS) | The mean endpoint score in the intervention groups was | 0 (0) | No data available on this outcome | |||
| Failure to complete ‐ total ‐ | 170 per 1000 | 936 per 1000 | OR 071 | 284 | ⊕⊕⊕⊝ | |
| Failure to complete ‐ inefficacy ‐ | 0 per 1000 | Not estimable | 0 (0) | |||
| Failure to complete ‐ side effects ‐ | 39 per 1000 | 41 per 1000 | OR 1.04 | 100 | ⊕⊕⊝⊝ | |
| *The basis for the assumed risk (e.g. the median control group risk across studies) is provided in footnotes. The corresponding risk (and its 95% confidence interval) is based on the assumed risk in the comparison group and the relative effect of the intervention (and its 95% CI). | ||||||
| GRADE Working Group grades of evidence | ||||||
| 1 Limitations in studies designs: no details on randomisation procedures and allocation concealment. Blinding stated but not tested. 2 Only one study included in the analysis. | ||||||
| Fluoxetine compared to hypericum | ||||||
| Patient or population: patients with depression | ||||||
| Outcomes | Illustrative comparative risks* (95% CI) | Relative effect | No of Participants | Quality of the evidence | Comments | |
| Assumed risk | Corresponding risk | |||||
| Hypericum | Fluoxetine | |||||
| Failure to respond (reduction ≥ 50% on HDRS) | 490 per 1000 | 485 per 1000 | OR 0.98 | 717 | ⊕⊕⊕⊝ | |
| Endpoint score (HDRS or MADRS) | The mean endpoint score in the intervention groups was | 648 | ⊕⊕⊕⊝ | This corresponds to a very small effect according | ||
| Failure to complete ‐ total ‐ | 129 per 1000 | 133 per 1000 | OR 1.04 | 679 | ⊕⊕⊕⊝ | |
| Failure to complete ‐ inefficacy ‐ | OR 4.70 | 401 | ⊕⊕⊕⊝ | |||
| Failure to complete ‐ side effects ‐ | 35 per 1000 | 42 per 1000 | OR 1.21 | 679 | ⊕⊕⊕⊝ | |
| *The basis for the assumed risk (e.g. the median control group risk across studies) is provided in footnotes. The corresponding risk (and its 95% confidence interval) is based on the assumed risk in the comparison group and the relative effect of the intervention (and its 95% CI). | ||||||
| GRADE Working Group grades of evidence | ||||||
| 1 Limitations in studies designs: no details on randomisation procedures and allocation concealment. Blinding stated but not tested. | ||||||
| Fluoxetine compared to maprotiline | ||||||
| Patient or population: patients with depression | ||||||
| Outcomes | Illustrative comparative risks* (95% CI) | Relative effect | No of Participants | Quality of the evidence | Comments | |
| Assumed risk | Corresponding risk | |||||
| Maprotiline | Fluoxetine | |||||
| Failure to respond (reduction ≥ 50% on HDRS) | 398 per 1000 | 563 per 1000 | OR 1.95 | 163 | ⊕⊕⊕⊝ | |
| Endpoint score (HDRS or MADRS) | The mean endpoint score in the intervention groups was | 433 | ⊕⊕⊕⊝ | This effect approaches zero | ||
| Failure to complete ‐ total ‐ | 92 per 1000 | 151 per 1000 | OR 1.75 | 351 | ⊕⊕⊕⊝ | |
| Failure to complete ‐ side effects ‐ | 67 per 1000 | 36 per 1000 | OR 0.53 | 209 | ⊕⊕⊕⊝ | |
| Failure to complete ‐ inefficacy ‐ | 19 per 1000 | 47 per 1000 | OR 2.54 | 209 | ⊕⊕⊕⊝ | |
| *The basis for the assumed risk (e.g. the median control group risk across studies) is provided in footnotes. The corresponding risk (and its 95% confidence interval) is based on the assumed risk in the comparison group and the relative effect of the intervention (and its 95% CI). | ||||||
| GRADE Working Group grades of evidence | ||||||
| 1 Limitations in studies designs: no details on randomisation procedures and allocation concealment. Blinding stated but not tested. | ||||||
| Fluoxetine compared to mianserin | ||||||
| Patient or population: patients with depression | ||||||
| Outcomes | Illustrative comparative risks* (95% CI) | Relative effect | No of Participants | Quality of the evidence | Comments | |
| Assumed risk | Corresponding risk | |||||
| Mianserin | Fluoxetine | |||||
| Failure to respond (reduction ≥ 50% on HDRS) | 593 per 1000 | 538 per 1000 | OR 0.80 | 53 | ⊕⊝⊝⊝ | |
| Endpoint score (HDRS or MADRS) | The mean endpoint score in the intervention groups was | 128 | ⊕⊕⊕⊝ | This corresponds to a small effect according | ||
| Failure to complete ‐ total ‐ | 362 per 1000 | 263 per 1000 | OR 0.63 | 93 | ⊕⊕⊕⊝ | |
| Failure to complete ‐ inefficacy ‐ | 74 per 1000 | 154 per 1000 | OR 2.27 | 53 | ⊕⊝⊝⊝ | |
| Failure to complete ‐ side effects ‐ | 148 per 1000 | 154 per 1000 | OR 1.05 | 53 | ⊕⊝⊝⊝ | |
| *The basis for the assumed risk (e.g. the median control group risk across studies) is provided in footnotes. The corresponding risk (and its 95% confidence interval) is based on the assumed risk in the comparison group and the relative effect of the intervention (and its 95% CI). | ||||||
| GRADE Working Group grades of evidence | ||||||
| 1 Limitations in studies designs: no details on randomisation procedures and allocation concealment. Blinding stated but not tested. 2 Only one study included in the analysis and less than 100 patients. | ||||||
| Fluoxetine compared to milnacipran | ||||||
| Patient or population: patients with depression | ||||||
| Outcomes | Illustrative comparative risks* (95% CI) | Relative effect | No of Participants | Quality of the evidence | Comments | |
| Assumed risk | Corresponding risk | |||||
| Milnacipran | Fluoxetine | |||||
| Failure to respond (reduction ≥ 50% on HDRS) | 473 per 1000 | 518 per 1000 | OR 1.20 | 370 | ⊕⊕⊕⊝ | |
| Endpoint score (HDRS or MADRS) | The mean endpoint score in the intervention groups was | 213 | ⊕⊕⊕⊝ | This corresponds to a small effect according | ||
| Failure to complete ‐ total ‐ | 411 per 1000 | 406 per 1000 | OR 0.98 | 560 | ⊕⊕⊕⊝ | |
| Failure to complete ‐ inefficacy ‐ | 137 per 1000 | 165 per 1000 | OR 1.25 | 560 | ⊕⊕⊕⊝ | |
| Failure to complete ‐ side effects ‐ | 71 per 1000 | 103 per 1000 | OR 1.50 | 560 | ⊕⊕⊕⊝ | |
| *The basis for the assumed risk (e.g. the median control group risk across studies) is provided in footnotes. The corresponding risk (and its 95% confidence interval) is based on the assumed risk in the comparison group and the relative effect of the intervention (and its 95% CI). | ||||||
| GRADE Working Group grades of evidence | ||||||
| 1 Limitations in studies designs: no details on randomisation procedures and allocation concealment. Blinding stated but not tested. | ||||||
| Fluoxetine compared to mirtazapine | ||||||
| Patient or population: patients with depression | ||||||
| Outcomes | Illustrative comparative risks* (95% CI) | Relative effect | No of Participants | Quality of the evidence | Comments | |
| Assumed risk | Corresponding risk | |||||
| Mirtazapine | Fluoxetine | |||||
| Failure to respond (reduction ≥ 50% on HDRS) | 354 per 1000 | 444 per 1000 | OR 1.46 | 600 | ⊕⊕⊕⊝ | |
| Endpoint score (HDRS or MADRS) | The mean endpoint score in the intervention groups was | 31 | ⊕⊝⊝⊝ | This corresponds to a medium effect according | ||
| Failure to complete ‐ total ‐ | 327 per 1000 | 304 per 1000 | OR 0.90 | 301 | ⊕⊕⊕⊝ | |
| Failure to complete ‐ inefficacy ‐ | 44 per 1000 | 62 per 1000 | OR 1.45 | 600 | ⊕⊕⊕⊝ | |
| Failure to complete ‐ side effects ‐ | 98 per 1000 | 93 per 1000 | OR 0.95 | 600 | ⊕⊕⊕⊝ | |
| *The basis for the assumed risk (e.g. the median control group risk across studies) is provided in footnotes. The corresponding risk (and its 95% confidence interval) is based on the assumed risk in the comparison group and the relative effect of the intervention (and its 95% CI). | ||||||
| GRADE Working Group grades of evidence | ||||||
| 1 Limitations in studies designs: no details on randomisation procedures and allocation concealment. Blinding stated but not tested. 2 Only one study included in the analysis and less than 100 patients. | ||||||
| Fluoxetine compared to moclobemide | ||||||
| Patient or population: patients with depression | ||||||
| Outcomes | Illustrative comparative risks* (95% CI) | Relative effect | No of Participants | Quality of the evidence | Comments | |
| Assumed risk | Corresponding risk | |||||
| Moclobemide | Fluoxetine | |||||
| Failure to respond (reduction ≥ 50% on HDRS) | 436 per 1000 | 496 per 1000 | OR 1.27 | 721 | ⊕⊕⊕⊝ | |
| Endpoint score (HDRS or MADRS) | The mean endpoint score in the intervention groups was | 540 | ⊕⊕⊕⊝ | This corresponds to a very small effect according | ||
| Failure to complete ‐ total ‐ | 207 per 1000 | 209 per 1000 | OR 1.01 | 721 | ⊕⊕⊕⊝ | |
| Failure to complete ‐ inefficacy ‐ | 62 per 1000 | 44 per 1000 | OR 0.70 | 679 | ⊕⊕⊕⊝ | |
| Failure to complete ‐ side effects ‐ | 86 per 1000 | 91 per 1000 | OR 1.07 | 721 | ⊕⊕⊕⊝ | |
| *The basis for the assumed risk (e.g. the median control group risk across studies) is provided in footnotes. The corresponding risk (and its 95% confidence interval) is based on the assumed risk in the comparison group and the relative effect of the intervention (and its 95% CI). | ||||||
| GRADE Working Group grades of evidence | ||||||
| 1 Limitations in studies designs: no details on randomisation procedures and allocation concealment. Blinding stated but not tested. | ||||||
| Fluoxetine compared to nefazodone | ||||||
| Patient or population: patients with depression | ||||||
| Outcomes | Illustrative comparative risks* (95% CI) | Relative effect | No of Participants | Quality of the evidence | Comments | |
| Assumed risk | Corresponding risk | |||||
| Nefazodone | Fluoxetine | |||||
| Failure to respond (reduction ≥ 50% on HDRS) | 0 per 1000 | Not estimable | 0 (0) | |||
| Endpoint score (HDRS or MADRS) | The mean endpoint score in the intervention groups was | 271 | ⊕⊕⊕⊝ | This effects approaches zero | ||
| Failure to complete ‐ total ‐ | 220 per 1000 | 132 per 1000 | OR 0.54 | 161 | ⊕⊕⊕⊝ | |
| Failure to complete ‐ inefficacy ‐ | 24 per 1000 | 17 per 1000 | OR 0.71 | 161 | ⊕⊕⊕⊝ | |
| Failure to complete ‐ side effects ‐ | 96 per 1000 | 75 per 1000 | OR 0.76 | 286 | ⊕⊕⊕⊝ | |
| *The basis for the assumed risk (e.g. the median control group risk across studies) is provided in footnotes. The corresponding risk (and its 95% confidence interval) is based on the assumed risk in the comparison group and the relative effect of the intervention (and its 95% CI). | ||||||
| GRADE Working Group grades of evidence | ||||||
| 1 Limitations in studies designs: no details on randomisation procedures and allocation concealment. Blinding stated but not tested. | ||||||
| Fluoxetine compared to paroxetine | ||||||
| Patient or population: patients with depression | ||||||
| Outcomes | Illustrative comparative risks* (95% CI) | Relative effect | No of Participants | Quality of the evidence | Comments | |
| Assumed risk | Corresponding risk | |||||
| Paroxetine | Fluoxetine | |||||
| Failure to respond (reduction ≥ 50% on HDRS) | 426 per 1000 | 477 per 1000 | OR 1.23 | 1574 | ⊕⊕⊕⊝ | |
| Endpoint score (HDRS or MADRS) | The mean endpoint score in the intervention groups was | 2061 | ⊕⊕⊕⊝ | This effect approaches zero | ||
| Failure to complete ‐ total ‐ | 317 per 1000 | 313 per 1000 | OR 0.98 | 1848 | ⊕⊕⊕⊝ | |
| Failure to complete ‐ inefficacy ‐ | 52 per 1000 | 39 per 1000 | OR 0.75 | 1005 | ⊕⊕⊕⊝ | |
| Failure to complete ‐ side effects ‐ | 133 per 1000 | 115 per 1000 | OR 0.85 | 1509 | ⊕⊕⊕⊝ | |
| *The basis for the assumed risk (e.g. the median control group risk across studies) is provided in footnotes. The corresponding risk (and its 95% confidence interval) is based on the assumed risk in the comparison group and the relative effect of the intervention (and its 95% CI). | ||||||
| GRADE Working Group grades of evidence | ||||||
| 1 Limitations in studies designs: no details on randomisation procedures and allocation concealment. Blinding stated but not tested. | ||||||
| Fluoxetine compared to phenelzine | ||||||
| Patient or population: patients with depression | ||||||
| Outcomes | Illustrative comparative risks* (95% CI) | Relative effect | No of Participants | Quality of the evidence | Comments | |
| Assumed risk | Corresponding risk | |||||
| Phenelzine | Fluoxetine | |||||
| Failure to respond (reduction ≥ 50% on HDRS) | 150 per 1000 | 200 per 1000 | OR 1.42 | 40 | ⊕⊝⊝⊝ | |
| Endpoint score (HDRS or MADRS) | The mean endpoint score in the intervention groups was | 40 | ⊕⊝⊝⊝ | This effect approaches zero | ||
| Failure to complete ‐ total ‐ | 100 per 1000 | 20 per 1000 | OR 0.18 | 40 | ⊕⊝⊝⊝ | |
| Failure to complete ‐ inefficacy ‐ | 0 per 1000 | Not estimable | 0 (0) | |||
| Failure to complete ‐ side effects ‐ | 50 per 1000 | 17 per 1000 | OR 0.32 | 40 | ⊕⊝⊝⊝ | |
| *The basis for the assumed risk (e.g. the median control group risk across studies) is provided in footnotes. The corresponding risk (and its 95% confidence interval) is based on the assumed risk in the comparison group and the relative effect of the intervention (and its 95% CI). | ||||||
| GRADE Working Group grades of evidence | ||||||
| 1 Limitations in studies designs: no details on randomisation procedures and allocation concealment. Blinding stated but not tested. Only one study included in the analysis and less than 50 patients. | ||||||
| Fluoxetine compared to pramipexole | ||||||
| Patient or population: patients with depression | ||||||
| Outcomes | Illustrative comparative risks* (95% CI) | Relative effect | No of Participants | Quality of the evidence | Comments | |
| Assumed risk | Corresponding risk | |||||
| Pramipexole | Fluoxetine | |||||
| Failure to respond (reduction ≥ 50% on HDRS) | 657 per 1000 | 513 per 1000 | OR 0.55 | 105 | ⊕⊕⊝⊝ | |
| Endpoint score (HDRS or MADRS) | The mean endpoint score in the intervention groups was | 0 (0) | No data available on this outcome | |||
| Failure to complete ‐ total ‐ | 443 per 1000 | 87 per 1000 | OR 0.12 | 105 | ⊕⊕⊝⊝ | |
| Failure to complete ‐ inefficacy ‐ | 57 per 1000 | 29 per 1000 | OR 0.49 | 105 | ⊕⊕⊝⊝ | |
| Failure to complete ‐ side effects ‐ | 314 per 1000 | 27 per 1000 | OR 0.06 | 105 | ⊕⊕⊝⊝ | |
| *The basis for the assumed risk (e.g. the median control group risk across studies) is provided in footnotes. The corresponding risk (and its 95% confidence interval) is based on the assumed risk in the comparison group and the relative effect of the intervention (and its 95% CI). | ||||||
| GRADE Working Group grades of evidence | ||||||
| 1 Limitations in studies designs: no details on randomisation procedures and allocation concealment. Blinding stated but not tested. Only one study included in the analysis. | ||||||
| Fluoxetine compared to reboxetine | ||||||
| Patient or population: patients with depression | ||||||
| Outcomes | Illustrative comparative risks* (95% CI) | Relative effect | No of Participants | Quality of the evidence | Comments | |
| Assumed risk | Corresponding risk | |||||
| Reboxetine | Fluoxetine | |||||
| Failure to respond (reduction ≥ 50% on HDRS) | 566 per 1000 | 501 per 1000 | OR 0.77 | 721 | ⊕⊕⊕⊝ | |
| Endpoint score (HDRS or MADRS) | The mean endpoint score in the intervention groups was | 205 | ⊕⊕⊕⊝ | This effect approaches zero | ||
| Failure to complete ‐ total ‐ | 361 per 1000 | 253 per 1000 | OR 0.60 | 764 | ⊕⊕⊕⊝ | |
| Failure to complete ‐ inefficacy ‐ | 88 per 1000 | 82 per 1000 | OR 0.92 | 464 | ⊕⊕⊕⊝ | |
| Failure to complete ‐ side effects ‐ | 129 per 1000 | 57 per 1000 | OR 0.41 | 211 | ⊕⊕⊕⊝ | |
| *The basis for the assumed risk (e.g. the median control group risk across studies) is provided in footnotes. The corresponding risk (and its 95% confidence interval) is based on the assumed risk in the comparison group and the relative effect of the intervention (and its 95% CI). | ||||||
| GRADE Working Group grades of evidence | ||||||
| 1 Limitations in studies designs: no details on randomisation procedures and allocation concealment. Blinding stated but not tested. | ||||||
| Fluoxetine compared to sertraline | ||||||
| Patient or population: patients with depression | ||||||
| Outcomes | Illustrative comparative risks* (95% CI) | Relative effect | No of Participants | Quality of the evidence | Comments | |
| Assumed risk | Corresponding risk | |||||
| Sertraline | Fluoxetine | |||||
| Failure to respond (reduction ≥ 50% on HDRS) | 416 per 1000 | 494 per 1000 | OR 1.37 | 1188 (6 studies) | ⊕⊕⊕⊝ | |
| Endpoint score (HDRS or MADRS) | The mean endpoint score in the intervention groups was | 1160 | ⊕⊕⊕⊝ | This corresponds to a very small effect according | ||
| Failure to complete ‐ total ‐ | 229 per 1000 | 258 per 1000 | OR 1.17 | 1591 | ⊕⊕⊕⊝ | |
| Failure to complete ‐ inefficacy ‐ | 70 per 1000 | 76 per 1000 | OR 1.09 | 1056 | ⊕⊕⊕⊝ | |
| Failure to complete ‐ side effects ‐ | 110 per 1000 | 134 per 1000 | OR 1.25 | 1591 | ⊕⊕⊕⊝ | |
| *The basis for the assumed risk (e.g. the median control group risk across studies) is provided in footnotes. The corresponding risk (and its 95% confidence interval) is based on the assumed risk in the comparison group and the relative effect of the intervention (and its 95% CI). | ||||||
| GRADE Working Group grades of evidence | ||||||
| 1 Limitations in studies designs: no details on randomisation procedures and allocation concealment. Blinding stated but not tested. | ||||||
| Fluoxetine compared to tianeptine | ||||||
| Patient or population: patients with depression | ||||||
| Outcomes | Illustrative comparative risks* (95% CI) | Relative effect | No of Participants | Quality of the evidence | Comments | |
| Assumed risk | Corresponding risk | |||||
| Tianeptine | Fluoxetine | |||||
| Failure to respond (reduction ≥ 50% on HDRS) | 534 per 1000 | 562 per 1000 | OR 1.12 | 387 | ⊕⊕⊕⊝ | |
| Endpoint score (HDRS or MADRS) | The mean endpoint score in the intervention groups was | 730 | ⊕⊕⊕⊝ | This corresponds to a very small effect according | ||
| Failure to complete ‐ total ‐ | 225 per 1000 | 218 per 1000 | OR 0.96 | 830 | ⊕⊕⊕⊝ | |
| Failure to complete ‐ inefficacy ‐ | 47 per 1000 | 39 per 1000 | OR 0.82 | 830 | ⊕⊕⊕⊝ | |
| Failure to complete ‐ side effects ‐ | 91 per 1000 | 101 per 1000 | OR 1.13 | 830 | ⊕⊕⊕⊝ | |
| *The basis for the assumed risk (e.g. the median control group risk across studies) is provided in footnotes. The corresponding risk (and its 95% confidence interval) is based on the assumed risk in the comparison group and the relative effect of the intervention (and its 95% CI). | ||||||
| GRADE Working Group grades of evidence | ||||||
| 1 Limitations in studies designs: no details on randomisation procedures and allocation concealment. Blinding stated but not tested. | ||||||
| Fluoxetine compared to trazodone | ||||||
| Patient or population: patients with depression | ||||||
| Outcomes | Illustrative comparative risks* (95% CI) | Relative effect | No of Participants | Quality of the evidence | Comments | |
| Assumed risk | Corresponding risk | |||||
| Trazodone | Fluoxetine | |||||
| Failure to respond (reduction ≥ 50% on HDRS) | 642 per 1000 | 467 per 1000 | OR 0.49 | 110 | ⊕⊕⊕⊝ | |
| Endpoint score (HDRS or MADRS) | The mean endpoint score in the intervention groups was | 203 | ⊕⊕⊕⊝ | This corresponds to a small effect according | ||
| Failure to complete ‐ total ‐ | 250 per 1000 | 145 per 1000 | OR 0.51 | 230 | ⊕⊕⊕⊝ | |
| Failure to complete ‐ inefficacy ‐ | 147 per 1000 | 38 per 1000 | OR 0.23 | 70 | ⊕⊕⊕⊝ | |
| Failure to complete ‐ side effects ‐ | 151 per 1000 | 105 per 1000 | OR 0.66 | 110 | ⊕⊕⊕⊝ | |
| *The basis for the assumed risk (e.g. the median control group risk across studies) is provided in footnotes. The corresponding risk (and its 95% confidence interval) is based on the assumed risk in the comparison group and the relative effect of the intervention (and its 95% CI). | ||||||
| GRADE Working Group grades of evidence | ||||||
| 1 Limitations in studies designs: no details on randomisation procedures and allocation concealment. Blinding stated but not tested. | ||||||
| Fluoxetine compared to venlafaxine | ||||||
| Patient or population: patients with depression | ||||||
| Outcomes | Illustrative comparative risks* (95% CI) | Relative effect | No of Participants | Quality of the evidence | Comments | |
| Assumed risk | Corresponding risk | |||||
| Venlafaxine | Fluoxetine | |||||
| Failure to respond (reduction ≥ 50% on HDRS) | 341 per 1000 | 400 per 1000 | OR 1.29 | 3387 | ⊕⊕⊕⊝ | |
| Endpoint score (HDRS or MADRS) | The mean endpoint score in the intervention groups was | 3097 | ⊕⊕⊕⊝ | This corresponds to a very small effect according | ||
| Failure to complete ‐ total ‐ | 256 per 1000 | 234 per 1000 | OR 0.89 | 2683 | ⊕⊕⊕⊝ | |
| Failure to complete ‐ inefficacy ‐ | 43 per 1000 | 56 per 1000 | OR 1.31 | 2640 | ⊕⊕⊕⊝ | |
| Failure to complete ‐ side effects ‐ | 116 per 1000 | 87 per 1000 | OR 0.72 | 2640 | ⊕⊕⊕⊝ | |
| *The basis for the assumed risk (e.g. the median control group risk across studies) is provided in footnotes. The corresponding risk (and its 95% confidence interval) is based on the assumed risk in the comparison group and the relative effect of the intervention (and its 95% CI). | ||||||
| GRADE Working Group grades of evidence | ||||||
| 1 Limitations in studies designs: no details on randomisation procedures and allocation concealment. Blinding stated but not tested. | ||||||
Background
Description of the condition
Major depression is generally diagnosed when a persistent and unreactive low mood or loss of interest and pleasure, or both, are accompanied by a range of symptoms including appetite loss, insomnia, fatigue, loss of energy, poor concentration, psychomotor symptoms, inappropriate guilt and morbid thoughts of death (APA 1994). It was the third leading cause of burden among all diseases in the year 2004 and it is expected to be the greatest cause in 2030 (WHO 2006). This condition is associated with marked personal, social and economic morbidity, loss of functioning and productivity, and creates significant demands on service providers in terms of workload (APA 2000; NICE 2010). Although pharmacological and psychological interventions are both effective for major depression, in primary and secondary care settings antidepressant (AD) drugs remain the mainstay of treatment in moderate to severe major depression (APA 2006; NICE 2010). Amongst ADs many different agents are available, including tricyclics (TCAs); monoamine oxidase inhibitors (MAOIs); selective serotonin reuptake inhibitors (SSRIs); serotonin‐noradrenaline reuptake inhibitors (SNRIs) such as venlafaxine, duloxetine and milnacipran; and other agents (mirtazapine, reboxetine, bupropion). Over the last 20 years prescribing ADs has dramatically risen in Western countries, mainly because of the increasing number of prescriptions for SSRIs, which have progressively become the most commonly prescribed ADs (Ciuna 2004). The selective action of SSRIs is purported to be the rationale for potential advantages over other existing therapies. Rather than a breakthrough in pharmacology, the development of SSRIs may be seen as a process of refining the action of existing and commonly used alternatives and this process may be clinically important (Freemantle 2000). SSRIs are generally more acceptable than TCAs, and there is evidence of similar efficacy (NICE 2010). However, head‐to‐head comparisons have provided contrasting findings (Cipriani 2006a).
Description of the intervention
Fluoxetine hydrochloride (3‐(p‐trifluoromethylphenoxy)‐N‐methyl‐3‐phenylpropylamine HCl; Lilly (LY) 110140) was first described in a scientific journal in 1974 as a selective serotonin (5‐hydroxytryptamine or 5‐HT)‐uptake inhibitor (Wong 2005). It was marketed as an AD in December 1987 and went off patent in August 2001. From its marketing fluoxetine quickly became the most prescribed AD in the United States (Marshall 2009) and, despite the availability of newer agents, it remains extremely popular in the pharmacological treatment of major depression and in the treatment of several anxiety disorders.
How the intervention might work
Fluoxetine’s presumed mechanism of action is through inhibiting the reuptake of serotonin. It is not clear, however, if reuptake inhibition correlates with clinical effect, either between patients or over time.
The bioavailability of fluoxetine is relatively high, and peak plasma concentrations are reached in six to eight hours. It is highly bound to plasma proteins, mostly albumin. Fluoxetine is metabolised in the liver by isoenzymes of the cytochrome P450 system, including CYP2D6. Only one metabolite of fluoxetine, norfluoxetine (N‐demethylated fluoxetine), is biologically active. The extremely slow elimination of fluoxetine and its active metabolite norfluoxetine from the body distinguishes it from other ADs. With time, fluoxetine and norfluoxetine inhibit their own metabolism so the fluoxetine elimination half‐life changes from one to three days after a single dose to four to six days after long‐term use.
Why it is important to do this review
In 2000 Geddes and colleagues (Geddes 2000) completed a Cochrane systematic review comparing the group of SSRIs with all other ADs and concluded that there were no large differences between the AD drug classes; however it was suggested that differences may emerge when single, head‐to‐head drug comparisons were considered. Starting from this consideration, and with the aim to shed light on the field of AD trials and treatment of major depression, a group of researchers agreed to join forces under the rubric of the Meta‐Analyses of New Generation Antidepressants Study Group (MANGA Study Group) to systematically review all available evidence for each specific newer AD. We have up to now completed individual reviews on sertraline (Cipriani 2009a), escitalopram (Cipriani 2009b), milnacipran (Nagakawa 2009), fluvoxamine (Omori 2010), mirtazapine (Watanabe 2011), duloxetine (Cipriani 2012a) and citalopram (Cipriani 2012b), and a number of other reviews are now underway. A systematic review comparing fluoxetine with TCAs, heterocyclics, MAOIs, SSRIs, SNRIs and other antidepressants was first published in 2005 (Cipriani 2005) but since then new randomised evidence has been produced. We therefore sought to update that review with the aim of providing the ‘best available’ and most up‐to‐date evidence on the efficacy and acceptability of fluoxetine in individuals with unipolar major depression.
Objectives
To assess the effects of fluoxetine in comparison with all other antidepressive agents for depression in adult individuals with unipolar major depressive disorder. Specifically:
-
To determine the efficacy of fluoxetine in comparison with other ADs in alleviating the acute symptoms of unipolar major depressive disorder in adults; and
-
Review the acceptability of treatment with fluoxetine in comparison with other ADs.
Methods
Criteria for considering studies for this review
Types of studies
Randomised controlled trials (RCTs) comparing fluoxetine with all other active ADs as monotherapy in the acute phase treatment of unipolar depression were included. We included RCTs with a cross‐over design but only used the results from the first randomisation period.
We excluded quasi‐randomised trials, such as those allocating participants by using alternate days of the week.
Types of participants
The review included participants 18 years or older, of both sexes, with a primary diagnosis of unipolar major depression according to standardised criteria, DSM‐III, DSM‐III‐R, DSM‐IV (APA 2000), ICD‐10 (WHO 1992), Feighner criteria (Feighner 1972) or Research Diagnostic Criteria (Spitzer 1972). Studies using ICD‐9 were excluded as it only lists disease names and does not have diagnostic criteria.
We included participants with the following subtypes of depression: chronic, with catatonic features, with melancholic features, with atypical features, with postpartum onset, and with a seasonal pattern. We included studies in which up to 20% of participants presented with depressive episodes in bipolar affective disorder. We also included participants with a concurrent secondary diagnosis of another psychiatric disorder.
We excluded participants with a concurrent primary diagnosis of Axis I or II disorders and participants with a serious concomitant medical illness.
Types of interventions
We examined fluoxetine in comparison with conventional pharmacological treatments for acute depression. We also examined fluoxetine in comparison with non‐conventional ADs (hypericum or other non‐conventional ADs). We excluded trials in which fluoxetine was compared to another type of psychopharmacological agent (that is anxiolytics, anticonvulsants, antipsychotics or mood‐stabilisers) and trials in which fluoxetine was used as an augmentation strategy.
Experimental intervention
Fluoxetine (as monotherapy). No restrictions on dose, frequency, intensity and duration were applied.
Comparator interventions
Conventional antidepressive agents:
-
tricyclics (TCAs);
-
heterocyclics;
-
SSRIs;
-
SNRIs;
-
MAOIs or newer ADs; and
-
other conventional psychotropic drugs.
Non‐conventional antidepressive agents:
-
hypericum; and
-
other non‐conventional antidepressive agents (e.g. Crocus sativus).
No restrictions on dose, frequency, intensity and duration were applied.
Types of outcome measures
Primary outcomes
Efficacy
Efficacy was evaluated using the following outcome measures.
(1) Dichotomous outcome
Number of participants who responded to treatment at the end of the trial by showing a reduction of at least 50% on the Hamilton Depression Scale (HDRS) (Hamilton 1960) out of the total number of randomised participants (intention‐to‐treat analysis).
(2) Continuous outcome
Group mean scores at the end of the trial or change scores on HDRS, or Montgomery‐Asberg Depression Scale (MADRS) (Montgomery 1979), or any other depression scale. If both endpoint and change scores were available, we considered endpoint scores.
Secondary outcomes
Acceptability
(3) Failure to complete due to any reason
Number of participants who dropped out during the trial as a proportion of the total number of randomised participants.
(4) Failure to complete due to inefficacy
Number of participants who dropped out during the trial due to inefficacy as a proportion of the total number of randomised participants.
(5) Failure to complete due to side effects
Number of participants who dropped out during the trial due to side effects as a proportion of the total number of randomised participants.
Search methods for identification of studies
CCDAN's Specialized Register (CCDANCTR)
The Cochrane Depression, Anxiety and Neurosis Group (CCDAN) maintains two clinical trials registers at their editorial base in Bristol, UK, a references register and a studies based register. The CCDANCTR‐References Register contains over 31,500 reports of randomised controlled trials in depression, anxiety and neurosis. Approximately 65% of these references have been tagged to individual, coded trials. The coded trials are held in the CCDANCTR‐Studies Register and records are linked between the two registers through the use of unique Study ID tags. Coding of trials is based on the EU‐Psi coding manual. Please contact the CCDAN Trials Search Coordinator for further details. Reports of trials for inclusion in the Group's registers are collated from routine (weekly), generic searches of MEDLINE (1950‐), EMBASE (1974‐) and PsycINFO (1967‐); quarterly searches of the Cochrane Central Register of Controlled Trials (CENTRAL) and review specific searches of additional databases. Reports of trials are also sourced from international trials registers c/o the World Health Organization’s trials portal (ICTRP), ClinicalTrials.gov, drug companies, the hand‐searching of key journals, conference proceedings and other (non‐Cochrane) systematic reviews and meta‐analyses.
Details of CCDAN's generic search strategies can be found on the Group's website.
Electronic searches
The CCDANCTR‐Studies Register was searched by the Trials Search Co‐ordinator (TSC) using the following search strategy:
Diagnosis = Depress* or Dysthymi* or "Adjustment Disorder*" or "Mood Disorder*" or "Affective Disorder*" or "Affective Symptoms"
and
Intervention = Fluoxetine
The CCDANCTR‐References Register was searched using similar terms to identify additional untagged/uncoded references:
Keyword = Depress* or Dysthymi* or "Adjustment Disorder*" or "Mood Disorder*" or "Affective Disorder" or "Affective Symptoms"
and
Free‐Text = (Fluoxetin* or Prozac)
Searches were conducted to 11 May 2012. No language restrictions were applied.
Other trial registers
The CCDAN TSC also searched Clinicalstudyresults.org to December 2011 (before this website was phased out) together with ClinicalTrials.gov and the WHO ICTRP to 16 July 2012 for additional published, unpublished or ongoing studies.
We searched trial databases of the following drug‐approving agencies: the Food and Drug Administration (FDA) in the USA, the Medicines and Healthcare products Regulatory Agency (MHRA) in the UK, the European Medicines Agency (EMA) in the EU, the Pharmaceuticals and Medical Devices Agency (PMDA) in Japan and the Therapeutic Goods Administration (TGA) in Australia. We also searched ongoing trial registers: ClinicalTrials.gov in the USA, Controlled‐Trials.com (ISRCTN) in the UK, the Nederland's Trial Register, the European Union Drug Regulating Authorities Clinical Trials register (EudraCT), UMIN‐CTR in Japan and the Australian New Zealand Clinical Trials Registry (ACTRN). These searches were undertaken in November 2010.
Searching other resources
Handsearches
Appropriate journals and conference proceedings relating to fluoxetine treatment for depression have already been handsearched and incorporated into the CCDANCTR databases.
Personal communication
Pharmaceutical companies and experts in this field were asked if they knew of any study that met the inclusion criteria of this review.
Reference checking
Reference lists of the included studies, previous systematic reviews and major textbooks of affective disorder that were written in English were checked for published reports and citations of unpublished research (Trespidi 2011).
Data collection and analysis
Selection of studies
Two independent review authors (LRM, MP) checked to ensure that studies relating to fluoxetine generated by the search of the CCDANCTR‐References Register and the other complementary searches met the rough inclusion criteria, firstly based on the titles and abstracts. All studies that were rated as possible candidates by either of the two review authors were added to a preliminary list, and the full text articles were then retrieved. LRM, CG, MP and AC assessed the full text articles to see if they met the strict inclusion criteria. If the raters disagreed, the final rating was made by consensus with the involvement of another member of the review group (CB). Considerable care was taken to group multiple publications to the main study to which they related.
Data extraction and management
Two review authors, working independently and in duplicate (LRM and MP), extracted data from the included studies. Again, any disagreement was discussed with other authors, and decisions were documented. If necessary, we contacted authors of studies for clarification. We extracted the following data from the included studies:
(i) participant characteristics (age, depression diagnosis, comorbidity, depression severity, antidepressant treatment history for the index episode, study setting);
(ii) intervention details (intended dosage range, mean daily dosage actually prescribed, sponsorship); and
(iii) outcome measures of interest.
The results were compared with those in the completed reviews of individual antidepressants in The Cochrane Library.
We considered the following comparisons:
-
fluoxetine versus TCAs;
-
fluoxetine versus the heterocyclics maprotiline, mianserin;
-
fluoxetine versus the SSRIs citalopram, escitalopram, fluvoxamine, paroxetine, sertraline;
-
fluoxetine versus the SNRIs duloxetine, milnacipran, venlafaxine;
-
fluoxetine versus the MAOIs or newer ADs agomelatine, mirtazapine, moclobemide, phenelzine, reboxetine;
-
fluoxetine versus other conventional psychotropic drugs amineptine, bupropion, pramipexole, tianeptine, trazodone; and
-
fluoxetine versus the other non‐conventional AD agents Crocus sativus, hypericum.
In the analysis TCAs were pooled as data have shown that drugs belonging to the TCA group are similar in terms of efficacy and tolerability, while drugs belonging to the other classes have rather different efficacy and tolerability profiles (Cipriani 2011).
Assessment of risk of bias in included studies
Two independent review authors independently assessed trial quality in accordance with the Cochrane Handbook for Systematic Reviews of Interventions (Higgins 2011). This set of criteria is based on evidence of associations between effect overestimation and a high risk of bias in an article, such as sequence generation, allocation concealment, blinding (of participants and personnel, outcome assessment), incomplete outcome data, selective reporting and other source of bias. The categories are defined as:
-
low risk of bias;
-
high risk of bias; and
-
unclear risk of bias.
If the raters disagreed, the final rating was made by consensus with the involvement of another member of the review group.
Non‐congruence in quality assessment was reported as percentage disagreement. The ratings were also compared with those in the completed reviews of individual antidepressants in The Cochrane Library. If there were any discrepancies, they were fed back to the authors of the completed reviews.
Measures of treatment effect
All comparisons were performed between fluoxetine and comparator ADs as individual ADs. Additionally, fluoxetine was compared with TCAs considered as a class.
Skewed data and non‐quantitative data were presented descriptively. An outcome was considered skewed when the mean was smaller than twice the SD. In terms of change score, data were difficult to depict as skewed or not as the possibility existed for negative values; therefore, we entered all of the results of the outcome into the meta‐analysis.
Dichotomous data
For dichotomous, or event‐like, data, odds ratios (ORs) were calculated with their 95% confidence intervals (CI). For statistically significant results, we calculated the number needed to treat to provide benefit (NNT).
Continuous data
For continuous data we calculated the standardised mean differences (SMD) with 95% CI.
Unit of analysis issues
Cross‐over trials
A major concern of cross‐over trials is the carry‐over effect. It occurs if an effect (for example pharmacological, physiological or psychological) of the treatment in the first phase is carried over to the second phase. As a consequence, on entry to the second phase the participants can differ systematically from their initial state, even with a wash‐out phase. For the same reason, cross‐over trials are not appropriate if the condition of interest is unstable (Elbourne 2002). As both effects are very likely in major depression, we only used data from the first phase of the cross‐over studies.
Cluster‐randomised trials
Studies increasingly employ 'cluster randomisation’ (such as randomisation by clinician or practice) but analysis and pooling of clustered data pose problems (Barbui 2011b). They are commonly analysed as if the randomisation was performed on the individuals rather than the clusters. In this case, approximately correct analyses were performed by dividing the binary data (the number of participants and the number experiencing the event) as presented in a report by a 'design effect’ (Higgins 2011). This is calculated using the mean number of participants per cluster (m) and the intra‐class correlation coefficient (ICC): design effect = 1 + (m‐1) *ICC (Higgins 2011). If the ICC was not reported it was assumed to be 0.1. For continuous data only the sample size was reduced; means and standard deviations remained unchanged.
Studies with multiple treatment groups
Studies that compared more than two intervention groups were included in the meta‐analysis by combining all relevant experimental intervention groups of the study into a single group, and all relevant control intervention groups into a single control group, as recommended in section 16.5 of the Cochrane Handbook for Systematic Reviews of Interventions (Higgins 2011).
Dealing with missing data
Dichotomous data
Responders and remitters to treatment were calculated on a strict intention‐to‐treat (ITT) basis: dropouts were included in this analysis. Where participants had been excluded from the trial before the endpoint, we assumed that they experienced a negative outcome by the end of the trial (for example failure to respond to treatment). We examined the validity of this decision in the sensitivity analyses by applying worst‐ and best‐case scenarios.
When dichotomous outcomes were not reported but the baseline mean, endpoint mean and their SDs of the HRSD (or other depression scale) were provided, we converted continuous outcome data expressed as mean and SD into the number of responding and remitted patients, according to the validated imputation method (Furukawa 2006). We examined the validity of this imputation in the sensitivity analyses (Altman 1996; Furukawa 2006).
Continuous data
We applied the loose ITT analyses for continuous variables whereby all the patients with at least one post‐baseline measurement were represented by their last observations carried forward (LOCF), with due consideration of the potential bias and uncertainty introduced. Data from trials not using a LOCF approach were extracted and analysed as reported by the authors. Where SDs were not reported, authors were asked to supply the data. When only the standard error (SE) or t‐statistics or P values were reported, SDs were calculated according to Altman (Altman 1996). In the absence of data from the authors, we substituted SDs by those reported in other studies in the review (Furukawa 2006).
Assessment of heterogeneity
Heterogeneity between studies was investigated by visual inspection of the forest plots and using the I2 statistic (Higgins 2003). According to the Cochrane Handbook for Systematic Reviews of Interventions (Higgins 2011), the following thresholds for the interpretation of I2 were used: 0% to 40%, might not be important; 30% to 60%, may represent moderate heterogeneity; 50% to 90%, may represent substantial heterogeneity; 75% to 100%, considerable heterogeneity. Moreover, we considered the sample size, and the magnitude and the direction of the treatment effects.
Assessment of reporting biases
Data from included studies were entered into a funnel plot (trial effect against trial variance) to investigate small‐study effects (Sterne 2000). We used the tests for funnel plot asymmetry only when there were at least 10 studies included in the meta‐analysis, and results were interpreted cautiously, with visual inspection of the funnel plots. We followed the Cochrane Handbook for Systematic Reviews of Interventions methodology (Higgins 2011). When evidence of small‐study effects was identified, possible reasons for funnel plot asymmetry, including publication bias, were investigated.
Data synthesis
The primary analysis used a random‐effects model (odds ratio (OR)), which had the highest generalisability in our empirical examination of summary effect measures for meta‐analyses (Furukawa 2002). The robustness of this summary measure was routinely examined by checking the fixed‐effect model OR and the random‐effects model risk ratio (RR). Material differences between the models were reported. A P value of less than 0.05 and a 95% confidence interval (CI) not including 1 (for the dichotomous outcomes) were considered statistically significant.
Fixed‐effect model analyses were performed routinely for the continuous outcomes as well, to investigate the effect of the choice of method on the estimates. Material differences between the models were reported.
Subgroup analysis and investigation of heterogeneity
We undertook a subgroup analysis for the duration of follow up. We considered the following categories: (1) less than 6 weeks, (2) 6 to 16 weeks, and (3) more than 16 weeks. Moreover, with the exception of the TCA group, stratification by each control agent was performed to ascertain whether there were treatment differences between fluoxetine and AD drugs belonging to the same pharmacological class.
Sensitivity analysis
Sensitivity analyses (worst‐case scenario; best‐case scenario; excluding ORs imputed based on continuous data; fixed‐effect rather than random‐effects models; RR rather than OR; excluding trials using LOCF; excluding trials with substituted SD) were not performed in this version of the review. However, we will conduct these analyses in the next update. If cluster‐randomised or cross‐over trials are included in the next update, we will undertake a sensitivy analysis excluding studies with these study designs.
Results
Description of studies
See: Characteristics of included studies; Characteristics of excluded studies; Characteristics of studies awaiting classification
Results of the search
The original searches yielded 883 studies; after reading the abstracts, 364 papers were considered potentially relevant for this review. Of these, 219 were excluded because they were not randomised trials or for other reasons. The remaining 145 were retrieved for more detailed evaluation and 132 RCTs meeting the inclusion criteria were included in the 2005 version (see Figure 1).

Study flow diagram, 2005 version.
In July 2012 a new search was conducted to update the review. This new search yielded 524 new records of RCTs published between 2005 and 2012, 12 unpublished RCTs, 10 RCTs defined as 'awaiting assessment' in the previous 2005 version, and five studies still ongoing at the time of inclusion. Of these, 536 were considered potentially relevant for this review. After reading the abstracts, 99 references were considered eligible for possible inclusion and the corresponding full papers were retrieved for a detailed evaluation; 55 trials were excluded or are awaiting assessment for wrong study design (not RCT) or other reasons and five are still ongoing. We included a total of 39 RCTs in the qualitative synthesis and 33 RCTs in the quantitative synthesis (meta‐analysis) (see Figure 2).

Study flow diagram, 2012 version.
Included studies
See: Characteristics of included studies
Overall, a total of 171 studies were included in the present systematic review (24,868 participants). Attempts to contact authors for additional information were unsuccessful in 22 cases and successful in two cases with additional data provided by the authors.
Design
The great majority of included studies were reported to be double‐blind (161 out of 171 RCTs, that is 95%). The participants were followed up for six weeks (range four to 24 weeks) in a majority of the trials (80 trials).
Sample sizes
The mean number of participants per study was 135.2, with a minimum sample size of 16 (O'Keane 1992) and a maximum of 1096 (Keller 2007).
Setting
A total of 105 trials enrolled only outpatients, 14 trials enrolled only inpatients, and both inpatients and outpatients were enrolled in the remaining trials. Forty‐one per cent of the included studies were undertaken in Europe, 20% in USA, 5% in Canada and in Central or South America, 4% of the trials were conducted in Iran and for the remaining 12% the geographic area was unclear. Three per cent of the included studies were multicentric international trials: 2% were conducted in Africa (South Africa and Zimbabwe); 2% in China, Australia and New Zealand; less than 1% in Israel and Turkey.
Participants
The majority of included trials (163 RCTs) enrolled patients with a diagnosis of major depression based on DSM‐III (34 studies), DSM‐III‐R (64 studies), DSM‐IV or ICD 10 criteria (67 studies). Seventy‐eight trials excluded patients over 65 years, while 14 trials included only elderly patients. We also included a minority of studies in which up to 20% of patients presented with depressive episodes in bipolar disorder.
Intervention and comparators
In 74 studies fluoxetine was compared with TCAs (22 studies versus amitriptyline, 15 versus imipramine, 6 versus dothiepin or dosulepin, 5 versus maprotiline, 5 versus clomipramine, 6 versus nortriptyline, 4 versus desipramine, 4 versus doxepine, 3 versus mianserin, 2 versus trimipramine, 1 versus lofepramine, 1 versus nimofensine). Thirty RCTs compared fluoxetine with other SSRIs (13 versus paroxetine, 12 versus sertraline, 3 versus citalopram, 2 versus escitalopram), 20 versus SNRIs (15 versus venlafaxine, 3 versus milnacipran, 2 versus duloxetine), and 20 studies with MAOIs or newer agents (7 versus moclobemide, 4 versus reboxetine, 5 versus mirtazapine, 3 versus agomelatine, 1 versus phenelzine). Moreover, in 19 studies fluoxetine was compared with other conventional agents (4 versus trazodone, 4 versus nefazodone, 4 versus tianeptine, 2 versus amineptine, 2 versus bupropion, 1 versus pramipexole, 1 versus amisulpride, 1 versus ABT‐200). Finally, eight studies compared fluoxetine with non‐conventional agents (6 versus hypericum and 2 versus Crocus sativus). A fixed dose regimen for fluoxetine was employed in 72 studies.
Outcomes
At the end of the reviewing process, 165 RCTs were included in the meta‐analysis. For efficacy outcomes, 121 RCTs provided continuous data and 91 dichotomous data. For acceptability outcomes, 139 RCTs provided data on total dropouts, 104 on dropouts due to inefficacy and 125 on dropouts due to side effects. In the majority of trials (130 out of 143, 90%) the 17‐ or 21‐ item HDRS was used for reporting outcomes.
Overall, 13,619 patients were included in the efficacy analysis dichotomous outcome (6441 participants randomised to fluoxetine and 7178 randomised to another antidepressant) and 15,870 were included in the efficacy analysis continuous outcome (7625 participants randomised to fluoxetine and 8245 randomised to another antidepressant). A total of 18,756 patients were included in the acceptability analysis (9009 partIcipants randomised to fluoxetine and 9747 randomised to another antidepressant).
Excluded studies
See: Characteristics of excluded studies; Characteristics of studies awaiting classification
Forty‐four articles that were initially selected did not meet our inclusion criteria and were excluded because of one of the following reasons: wrong design (24 articles), review or pooled analysis (two articles), wrong comparison (nine articles), wrong intervention (one article) and wrong diagnosis or population (eight articles). A total of 34 records were classified as 'awaiting classification'. Of these, 28 were study reports written in Chinese.
Risk of bias in included studies
See: Included studies; Figure 3; Figure 4
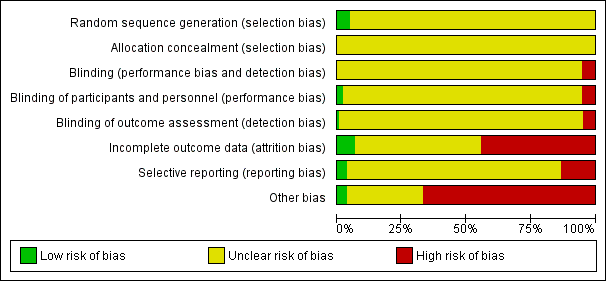
Risk of bias graph: review authors' judgements about each risk of bias item presented as percentages across all included studies.

Risk of bias summary: review authors' judgements about each risk of bias item for each included study.
Our judgement about the overall risk of bias in the individual studies is illustrated in Figure 3 and Figure 4. The methodological quality of many included studies was judged as poor, although judging articles from some time ago by today’s standard might be problematic (Begg 1996). Moreover, many articles failed to report methodologically relevant information on study procedure (in these cases the judgement was defined as 'unclear') and the overall reporting of studies was not good. This type of reporting has been associated with an overestimate of the estimate of effect (Schulz 1995) and it should be considered when interpreting the results. However, in general it is not possible to predict the direction or magnitude of bias associated with a lack of adequate sequence generation or adequate allocation concealment (Odgaard‐Jensen 2011).
Allocation
Random sequence generation
The majority of studies (161) did not report the methods of generating random sequence, while eight studies (Akhondzadeh Basti 2007; Alves 1999; Byerley 1988; Harrer 1999; Hosak 2000; Noorbala 2005; Rudolph 1999; Sheehan 2009) specified this information and they were classified as 'low risk'.
Allocation concealment
All trials failed to report details on allocation concealment and were classified as 'unclear risk'.
Blinding
One hundred and sixty‐three trials were undertaken on a double‐blind basis, four trials employed a single‐blind design and five an open design. None of the double‐blind trials specified if blindness was maintained during the study. Nine studies were classified as 'high risk' of performance and detection bias while the remaining 163 were classified as 'unclear'. For the item on blinding of participants and personnel (performance bias), three RCTs were classified as 'low risk' of bias, nine RCTs as 'high risk' of bias and the remaining 160 as 'unclear'.
Incomplete outcome data
Only 11 trials (Alby 1993; Bennie 1995; Berlanga 1997; Chouinard 1999; Corrigan 2000; Dierick 1996; Fava 2005; Guelfi 1999; O'Keane 1992; Sheehan 2009; Suleman 1997) were rated as adequate in terms of addressing incomplete outcome data, while the majority (83 studies) were classified as 'unclear risk' and 77 as 'high risk'.
Selective reporting
The study protocol was not available for almost all studies so it was difficult to make a judgement on the possibility of outcome reporting bias. However, in six studies (Chouinard 1999; Fava 2005; Guelfi 1999; Hale 2010; O'Keane 1992; Wehmeier 2005) results were consistent with what was stated in the study protocols. Twenty‐three studies were classified as 'high risk' of bias, five studies as 'low risk' of bias and the remaining 144 were classified as 'unclear'.
Other potential sources of bias
Most of the included studies (115 RCTs) were funded by pharmaceutical industry (and classified as 'high risk' of bias) and five studies were independent of industry (and classified as 'low risk' of bias). The remaining studies did not specify the source of funding and were defined as 'unclear'.
Effects of interventions
See: Summary of findings for the main comparison Fluoxetine compared to TCAs; Summary of findings 2 Fluoxetine compared to ABT‐200; Summary of findings 3 Fluoxetine compared to agomelatine; Summary of findings 4 Fluoxetine compared to amineptine; Summary of findings 5 Fluoxetine compared to amisulpride; Summary of findings 6 Fluoxetine compared to bupropion; Summary of findings 7 Fluoxetine compared to citalopram; Summary of findings 8 Fluoxetine compared to Crocus sativus; Summary of findings 9 Fluoxetine compared to duloxetine; Summary of findings 10 Fluoxetine compared to escitalopram; Summary of findings 11 Fluoxetine compared to fluvoxamine; Summary of findings 12 Fluoxetine compared to hypericum; Summary of findings 13 Fluoxetine compared to maprotiline; Summary of findings 14 Fluoxetine compared to mianserin; Summary of findings 15 Fluoxetine compared to milnacipran; Summary of findings 16 Fluoxetine compared to mirtazapine; Summary of findings 17 Fluoxetine compared to moclobemide; Summary of findings 18 Fluoxetine compared to nefazodone; Summary of findings 19 Fluoxetine compared to paroxetine; Summary of findings 20 Fluoxetine compared to phenelzine; Summary of findings 21 Fluoxetine compared to pramipexole; Summary of findings 22 Fluoxetine compared to reboxetine; Summary of findings 23 Fluoxetine compared to sertraline; Summary of findings 24 Fluoxetine compared to tianeptine; Summary of findings 25 Fluoxetine compared to trazodone; Summary of findings 26 Fluoxetine compared to venlafaxine
Comparison 1: fluoxetine versus TCAs
Primary outcome: efficacy
1.1 Dichotomous outcome
Twenty‐four studies contributed to this comparison including 2124 participants.
We found no difference in terms of efficacy between fluoxetine and TCAs as a class (OR 0.97, 95% CI 0.77 to 1.22, 24 RCTs, 2124 participants). In head‐to‐head comparisons, only dothiepin/dosulepin was found to be more effective than fluoxetine (OR 2.13, 95% CI 1.08 to 4.20; NNT = 6, 95% CI 3 to 50, 2 RCTs, 144 participants).
1.2 Continuous outcome
Fifty studies contributed to this comparison including 3393 participants.
On this outcome (measured with HDRS or MADRS), we found no differences between fluoxetine and TCAs as a class (SMD 0.03, 95% CI ‐0.07 to 0.14, 50 RCTs, 3393 participants) and between fluoxetine and individual TCAs.
Secondary outcome: acceptability
1.3 Failure to complete due to any cause
Forty‐nine studies contributed to this comparison including 4194 participants.
In terms of participants who dropped out for any cause, fluoxetine was better tolerated than TCAs (OR 0.79, 95% CI 0.65 to 0.96; NNT = 20, 95% CI 13 to 48, 49 RCTs, 4194 participants), in particular amitriptyline (OR 0.62, 95% CI 0.46 to 0.85; NNT = 13, 95% CI 8 to 39, 18 RCTs, 1089 participants).
1.4 Failure to complete due to inefficacy
Thirty‐three studies contributed to this comparison including 2911 participants.
We found no differences in terms of dropouts due to inefficacy (OR 1.29, 95% CI 0.96 to 1.72, 33 RCTs, 2911 participants).
1.5 Failure to complete due to side effects
Forty studies contributed to this comparison including 3647 participants.
The analysis of dropouts due to side effects revealed that amitriptyline (OR 0.41, 95% CI 0.23 to 0.71; NNT = 12, 95% CI 8 to 22, 16 RCTs, 1038 participants), clomipramine (OR 0.30, 95% CI 0.12 to 0.79; NNT = 11 , 95% CI 6 to 46, 2 RCTs, 163 participants), imipramine (OR 0.47, 95% CI 0.26 to 0.86; NNT= 8, 95% CI 6 to 12, 10 RCTs, 1093 participants) and overall TCAs (OR 0.55, 95% CI 0.40 to 0.75; NNT = 14, 95% CI 10 to 20, 40 RCTs, 3647 participants) were less well tolerated than fluoxetine.
Comparison 2: fluoxetine versus heterocyclics
Primary outcome: efficacy
2.1 Dichotomous outcome
Three studies contributed to this comparison including 216 participants.
In terms of dichotomous outcomes, we found no differences between fluoxetine and individual heterocyclics.
2.2 Continuous outcome
Eight studies contributed to this comparison including 561 participants.
In terms of continuous outcomes, we found no differences between fluoxetine and individual heterocyclics.
Secondary: acceptability
2.3 Failure to complete due to any cause
Six studies contributed to this comparison including 444 participants.
In terms of patients who dropped out during the trial for any reason, we found no differences between fluoxetine and individual heterocyclics.
2.4 Failure to complete due to inefficacy
Four studies contributed to this comparison including 262 participants overall.
We found no differences in terms of dropouts due to inefficacy.
2.5 Failure to complete due to side effects
Four studies contributed to this comparison including 262 participants overall.
Similarly, we found no differences in terms of dropouts due to side effects.
Comparison 3: fluoxetine versus other SSRIs
Primary outcome: efficacy
3.1 Dichotomous outcome
Eighteen studies contributed to this comparison including 3238 participants overall.
There was a difference in terms of efficacy in favour of sertraline over fluoxetine (OR 1.37, 95% CI 1.08 to 1.74; NNT = 13, 95% CI 7 to 58, 6 RCTs, 1188 participants).
3.2 Continuous outcome
Twenty‐two studies contributed to this comparison including 4113 participants overall.
In terms of continuous outcomes (measured with HDRS or MADRS), there were inconclusive results.
Secondary outcome: acceptability
3.3 Failure to complete due to any cause
Twenty‐six studies contributed to this comparison including 5033 participants.
In terms of patients who dropped out for any reason, we found a trend in favour of escitalopram over fluoxetine (OR 1.53, 95%, CI 1 to 2.37, 2 RCTs, 578 participants).
3.4 Failure to complete due to inefficacy
Fourteen studies contributed to this comparison including 3371 participants.
No difference was found between fluoxetine and other SSRIs in terms of discontinuation due to inefficacy.
3.5 Failure to complete due to side effects
Twenty‐four studies contributed to this comparison including 4510 participants.
No difference was found between fluoxetine and other SSRIs in terms of discontinuation due to side effects.
Comparison 4: fluoxetine versus SNRIs
Primary outcome: efficacy
4.1 Dichotomous outcome
Fifteen studies contributed to this comparison including 3860 participants.
There was a difference in terms of efficacy in favour of venlafaxine over fluoxetine (OR 1.29, 95%, CI 1.10 to 1.51; NNT =11, 95% CI 8 to 16, 12 RCTs, 3387 participants). No difference was found between fluoxetine and other SNRIs (milnacipran and duloxetine).
4.2 Continuous outcome
Fifteen studies contributed to this comparison including 3310 participants.
There was a difference in terms of efficacy in favour of fluoxetine over milnacipran (measured with HDRS or Montgomery and Asberg Scale for Depression (MADRS)) (SMD ‐0.36, 95% CI ‐0.63 to ‐0.08, 2 RCTs, 213 participants) and a small difference in favour of venlafaxine over fluoxetine (SMD 0.10 95%, CI 0.00 to 0.19,13 RCTs, 3097 participants).
Secondary outcome: Acceptability
4.3 Failure to complete due to any cause
Nineteen studies contributed to this comparison including 3775 participants.
There was no evidence that fluoxetine was associated with a smaller or higher rate of dropout for any reason than the SNRIs.
4.4 Failure to complete due to inefficacy
Eighteen studies contributed to this comparison including 3632 participants.
There was no evidence that fluoxetine was associated with a smaller or higher rate of dropout for inefficacy than the SNRIs.
4.5 Failure to complete due to side effects
Eighteen studies contributed to this comparison including 3732 participants.
The analysis of dropouts due to side effects revealed that fluoxetine had an advantage over venlafaxine (OR 0.72, 95% CI 0.56‐0.94; NNT = 36, 95% CI 20 to 202, 13 RCTs, 2640 participants).
Comparison 5: fluoxetine versus MAOIs or newer ADs
Primary outcome: efficacy
5.1 Dichotomous outcome
Sixteen studies contributed to this comparison including 2567 participants.
There was a difference in terms of efficacy in favour of mirtazapine over fluoxetine (OR 1.46, 95% CI 1.04 to 2.04; NNT = 12, 95% CI 6 to 134, 4 RCTs, 600 participants). No differences were found between fluoxetine and other newer ADs or MAOIs.
5.2 Continuous outcome
Thirteen studies contributed to this comparison including 2029 participants.
We found no differences in terms of efficacy between fluoxetine and MAOIs or newer ADs (measured with HDRS or MADRS).
Secondary outcome: acceptability
5.3 Failure to complete due to any reason
Seventeen studies contributed to this comparison including 2611 participants.
In terms of participants who dropped out during the trial for any reason, fluoxetine performed better in comparison with reboxetine only (OR 0.60, 95%, CI 0.44 to 0.82; NNT = 9, 95% CI 6 to 24, 4 RCTs, 764 participants).
5.4 Failure to complete due to inefficacy
Sixteen studies contributed to this comparison including 2568 participants.
No differences were found between fluoxetine and MAOIs or newer ADs in terms of dropout due to inefficacy.
5.5 Failure to complete due to side effects
Sixteen studies contributed to this comparison including 2157 participants.
No differences were found between fluoxetine and MAOIs or newer ADs in terms of dropout due to side effects. However, we found a trend in favour of fluoxetine over reboxetine (OR 0.41, 95% CI 0.15 to 1.09, 2 RCTs, 211 participants).
Comparison 6: fluoxetine versus other conventional psychotropic drugs
Primary outcome: efficacy
6.1 Dichotomous outcome
Eight studies contributed to this comparison including 1101 participants.
No differences between fluoxetine and any other conventional AD (amineptine, bupropion, pramipezole, tianeptine, trazodone) were found in terms of dichotomous outcome measures.
6.2 Continuous outcome
Thirteen studies contributed to this comparison including 1613 participants.
We found an advantage of fluoxetine over ABT‐200 (SMD ‐1.85, 95% CI ‐2.25 to ‐1.45, 1 RCT, 141 participants) (measured with HDRS or MADRS). No differences in continuous outcome measures were found between fluoxetine and other conventional ADs.
Secondary outcome: acceptability
6.3 Failure to complete due to any cause
Seventeen studies contributed to this comparison including 2419 participants.
In terms of participants who dropped out for any reason, fluoxetine was better tolerated than ABT‐200 (OR 0.18, 95% CI 0.08 to 0.39; NNT = 3, 95% CI 2 to 5, 1 RCT, 144 participants) and pramipexole (OR 0.12, 95% CI 0.03 to 0.42; NNT = 3, 95% CI 2 to 5, 1 RCT, 105 participants).
6.4 Failure to complete due to inefficacy
Fourteen studies contributed to this comparison including 2090 participants.
In terms of dropout due to inefficacy, we found no difference between fluoxetine and other conventional psychotropic drugs. However, due to the large confidence intervals, these results are inconclusive.
6.5 Failure to complete due to side effects
Seventeen studies contributed to this comparison including 2424 participants.
In terms of dropout due to side effects fluoxetine was better tolerated than ABT‐200 (OR 0.08, 95% CI 0.02 to 0.27; NNT = 3, 95% CI 2 to 5, 1 RCT, 144 participants) and pramipexole (OR 0.06, 95% CI 0.01 to 0.50, NNT = 4, 95% CI 2 to 6, 1 RCT, 105 participants).
Comparison 7. fluoxetine versus other non‐conventional AD agents
Primary outcome: efficacy
8.1 Dichotomous outcome
Seven studies contributed to this comparison including 757 participants overall.
No difference between fluoxetine and other non‐conventional agents was found.
8.2 Continuous outcome
Five studies contributed to this outcome including 648 participants overall.
No difference was found on this outcome.
Secondary outcome: acceptability
8.3 Failure to complete due to any cause
Six studies contributed to this comparison including 719 participants overall.
In terms of patients who dropped out for any reason no differences were found between fluoxetine and other non‐conventional ADs.
8.4 Failure to complete due to inefficacy
Two studies contributed to this comparison including 401 participants overall.
No difference was found on this outcome.
8.5 Failure to complete due to inefficacy
Five studies contributed to this comparison including 679 participants overall.
No difference was found on this outcome.
Subgroup analysis
The great majority of included studies had a follow‐up period of between six and 16 weeks.
The subgroup analysis revealed a difference in favour of fluoxetine over nortriptyline, continuous outcome, follow‐up > 16 weeks (SMD ‐0.86, 95% CI ‐1.27 to ‐0.44, 1 RCT, 97 participants), and a difference between fluoxetine and TCAs as a class, follow‐up six to 16 weeks, dichotomous outcome (failure to complete ‐ inefficacy) (OR 1.38, 95% CI 1.02 to 1.87, 28 RCTs, 1053 participants).
For the other comparisons we found no material difference between fluoxetine and other antidepressants both in terms of efficacy and acceptability.
Moreover, with the exception of the TCA group, stratification by each control agent was performed to ascertain whether there were treatment differences between fluoxetine and AD drugs belonging to the same pharmacological class (see results on efficacy and acceptability).
As reported in the methods, sensitivity analyses were not performed in this version of the review. However, we will conduct these analyses in the next update.
Assessment of heterogeneity
For the primary outcomes, I2 indicative of moderate heterogeneity was observed in the comparison between fluoxetine and TCA as a class, (I2 = 55%) and between fluoxetine and imipramine, continuous outcome analyses (I2 = 54%). Substantial heterogeneity was found in the comparison between fluoxetine and the following AD drugs: mianserin (I2 = 78%), paroxetine (I2 = 86%), agomelatine (I2 = 67%) and trazodone (I2 = 62%), desipramine, dothiepin or dosulepin (I2 = 67%), nortryptiline (I2 = 87%), and tianeptine (I2 = 63%). For dichotomous outcomes, moderate heterogeneity was observed in the comparison between fluoxetine and trazodone (I2 = 58%), while substantial heterogeneity was found in the comparison between fluoxetine versus hypericum (I2 = 68%) and versus imipramine (I2 = 68%).
Assessment of publication bias
Visual inspection of funnel plots did not reveal substantial asymmetry in any of the comparisons between fluoxetine and other conventional and unconventional ADs.
Discussion
Summary of main results
This systematic review detected differences between fluoxetine and some comparator ADs. On a dichotomous outcome, fluoxetine was less effective than dothiepin/dosulepin, sertraline, mirtazapine and venlafaxine. On a continuous outcome, fluoxetine was more effective than ABT‐200 and milnacipran, and less effective than sertraline and venlafaxine, although these findings were of borderline statistical significance. However, it is uncertain how these differences translate into clinically meaningful measures. Despite the large number of comparative trials included in this systematic review, the total number of randomised patients was under 25,000. Studies were short, usually eight weeks or less, and the mean size of each trial was around 135 participants, indicating that they were generally underpowered for demonstrating clinically meaningful differences.
In terms of acceptability fluoxetine was better tolerated than TCA, reboxetine, ABT‐200 and pramipexole (dropout due to any reasons). By contrast, escitalopram was better tolerated than fluoxetine, although the result was of borderline statistical significance. Moreover, considering dropout due to side effects, fluoxetine was better tolerated than amitriptyline, clomipramine, imipramine, ABT‐200 and pramipexole. Fluoxetine was also better tolerated than venlafaxine (dropout due to side effects).
Overall completeness and applicability of evidence
Our review currently includes 171 randomised trials with 24,868 participants in total. All studies in the review involved participants with a formal diagnosis of depression on a standardised and validated scale according to DSM‐III or DSM‐IV criteria, and therefore there was considerable homogeneity in the study populations. However, studies were short in duration, for some comparisons the confidence intervals were large, and some analyses were unpowered to demonstrate clinically meaningful differences between treatments. Therefore, interpretation of treatment effects, either where there is a statistically different effect or no statistically different effect, should be made with caution There was also considerable variation in the type of control medication used in the trials. The majority used TCAs, SSRIs and SNRIs, with a minority of trials using other non‐conventional ADs. Most trials provided useful data that were included in the analyses, but in some cases trials provided only efficacy or tolerability data thus limiting the overall completeness of evidence.
Although it has long been argued that placebo controlled trials are required to adequately demonstrate the efficacy of novel AD drugs (Cipriani 2009a), in the present review we focused only on the comparison between fluoxetine and other active treatments. The background logic that guided the development of the present review was based on the need to provide real‐world evidence for patients in need of pharmacological treatment. We therefore made the choice of including only studies that compared fluoxetine with another active treatment, as we reasoned that clinicians need to know how fluoxetine, a reference AD agent, compares with a selection of possible comparator ADs.
Retrieved randomised evidence compared fluoxetine with a selection of possible comparator ADs but only few studies per comparison were found. This inevitably limited the applicability of the evidence pertaining to each pair wise comparison as often confidence intervals were quite wide around treatment estimates.
Although the search was thorough, it is still possible that some unpublished studies have not been identified. It is very difficult to make a fair judgement on this issue as the small number of trials identified per comparison might have hindered the detection of publication bias. However, although we did our very best to retrieve as much data as possible, through asking pharmaceutical companies and study authors to supply all available information, we can conservatively assume that some trial data are still lacking, most of which are likely to be studies with negative findings. We are also aware that other RCTs comparing fluoxetine with other AD drugs may be currently ongoing, and we aim to include these, as well as other unpublished data, in future updates of this review.
Quality of the evidence
The quality of evidence is a crucial issue in translating the results of research into clinical practice. Using high‐quality research evidence is relevant to speedy translation of research in a way that really responds to clinically relevant questions. In the present review only randomised trials were included and the studies were all very similar in design and conduct. However, trial quality is not easy to assess. We note that the majority of included studies failed to report key methodological issues, for example information about randomisation and allocation concealment. Additionally, the reporting of outcome data was often unclear or incomplete and the figures used in the analyses were not immediately understandable. Clearly it is possible that the paucity of information about randomisation and allocation concealment may represent a problem of reporting and not a real defect in study design. However, sometimes discrepancies between published reports and unpublished data posted on drug companies' websites were highlighted, thus confirming that the average quality of clinical trials in the field of ADs is generally low, and that this may represent a potential serious risk of bias (Horder 2011).
Potential biases in the review process
The first limitation is that we made multiple comparisons. By making multiple comparisons we might have committed a type 1 error, that is, identifying and reporting a spurious association. As stated in the review protocol, we did not carry out a Bonferroni correction. As many statistical tests have been used in the review, the findings from this review are better thought of as hypothesis forming rather than hypothesis testing and it would be very reassuring to see the conclusions replicated in future trials and systematic reviews.
Another limitation is that for many of the comparisons, more trials were found presenting data on dropouts than on efficacy. This is because not all gave a 50% reduction in HDRS as their main outcome and therefore a lot of the data from our primary outcome was lost, which could have led to bias. Although this is a well‐known limitation of secondary analyses of data extracted from RCTs, we attempted to control this potential source of bias by extracting continuous efficacy data according to each study’s definition of efficacy. This secondary analysis included many more participants than the primary analysis and the results did not differ substantially from the analysis of the primary outcomes. It is likely, therefore, that the overall comparison was not hampered by the exclusion of these trials.
Another compelling issue is that most of the included studies were sponsored by the drug industry, and data has shown that drug industry studies are more than four times more likely to demonstrate positive effects of the sponsors' drugs in comparison with independent studies (Lexchin 2003). For fluoxetine, it has been shown that the outcome of fluoxetine RCTs varies according to whether this drug was used as a new compound or a reference one, suggesting the presence of bias. This bias may work in favour of fluoxetine in trials where it was the experimental drug and in favour of comparators in trials where fluoxetine was the reference agent (Barbui 2004). A possible explanation for this finding is publication bias. Publication bias might have systematically excluded from publication RCTs failing to show a robust effect of the experimental agents in comparison with reference ones. Alternatively, the common belief that newer medicines are better than old ones, and pharmaceutical marketing pressures to show a positive effect of newer drugs, might have favoured fluoxetine when it was the experimental agent and comparators when fluoxetine was the reference drug.
In this review we decided to focus on treatment response because it is one of the main goals for the treatment of major depressive disorder. The term 'treatment response' describes a state of improvement in the patient’s condition of sufficient quality to result in the treating physician’s impression of at least a moderate degree of global improvement, conventionally defined as a reduction of at least 50% in depressive symptomatology. However, from a clinical point of view, the ultimate goal of the acute treatment phase of major depressive disorder may well be to achieve remission. Full remission from depression correlates with better longer‐term functional recovery, lower risk of relapse and higher level of patients satisfaction than a partial response (without remission). Thus, one important limitation of the present review is that remission was not included as an outcome measure.
Another study limitation is that studies with different duration were lumped together, and this may limit the external validity of study findings. However, the subgroup analysis failed to show material differences, thus suggesting the robustness of the main findings.
From a clinical point of view the analysis of the safety profile of antidepressants remains of crucial importance. In this review, although we included total dropouts as a measure of treatment acceptability. and dropouts due to side effects as a measure of tolerability, individual side effects were not extracted. We acknowledge this limitation and we aim to include data on individual side effects in future updates of this systematic review.
Agreements and disagreements with other studies or reviews
Even though there is a heated debate in the scientific literature (Gartlehner 2010; Gartlehner 2011), there is now robust evidence that there are statistically and clinically significant differences among antidepressants (Cipriani 2009a). Results from this review are consistent with this interpretation and might contribute to the development of an evidence‐based hierarchy of antidepressants to be used by clinicians (both specialists and general practitioners) (Barbui 2011a). Even though fluoxetine was not among the best treatments in terms of efficacy, it remains an important option for physicians when an AD is to be prescribed for moderate to severe major depression.
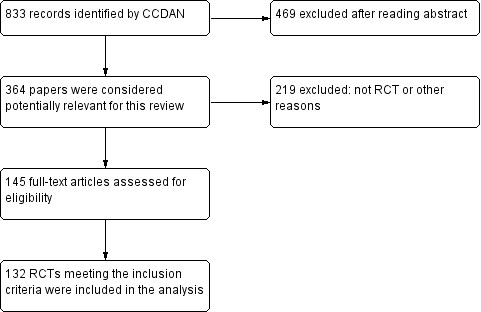
Study flow diagram, 2005 version.

Study flow diagram, 2012 version.

Risk of bias graph: review authors' judgements about each risk of bias item presented as percentages across all included studies.

Risk of bias summary: review authors' judgements about each risk of bias item for each included study.

Comparison 1 Fluoxetine versus TCAs, Outcome 1 Failure to respond ‐ HDRS (‐50%).

Comparison 1 Fluoxetine versus TCAs, Outcome 2 End‐point score on rating scale.

Comparison 1 Fluoxetine versus TCAs, Outcome 3 Failure to complete ‐ Total.
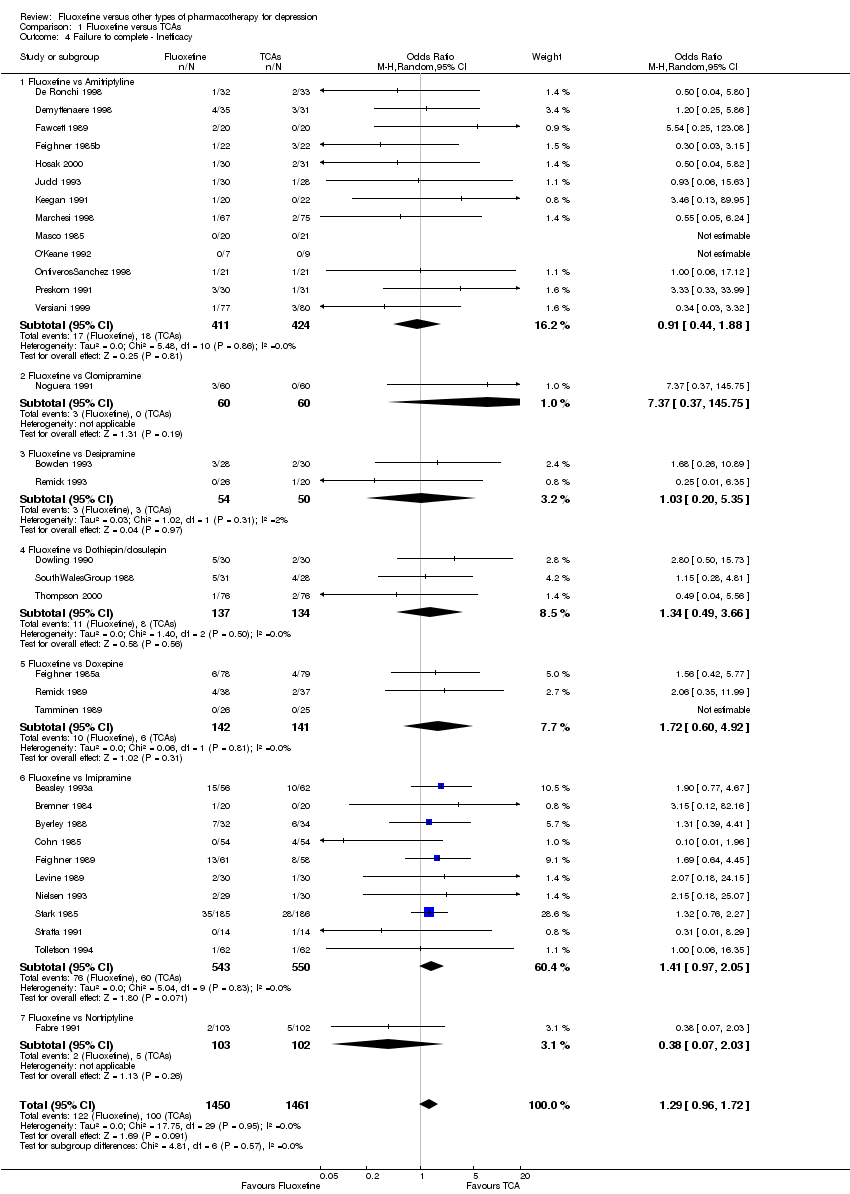
Comparison 1 Fluoxetine versus TCAs, Outcome 4 Failure to complete ‐ Inefficacy.

Comparison 1 Fluoxetine versus TCAs, Outcome 5 Failure to complete ‐ Side Effects.
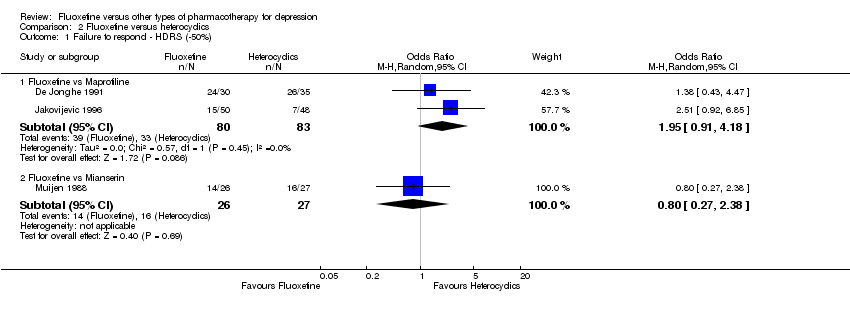
Comparison 2 Fluoxetine versus heterocyclics, Outcome 1 Failure to respond ‐ HDRS (‐50%).

Comparison 2 Fluoxetine versus heterocyclics, Outcome 2 End‐point score on rating scale.

Comparison 2 Fluoxetine versus heterocyclics, Outcome 3 Failure to complete ‐ Total.

Comparison 2 Fluoxetine versus heterocyclics, Outcome 4 Failure to complete ‐ Inefficacy.

Comparison 2 Fluoxetine versus heterocyclics, Outcome 5 Failure to complete ‐ Side Effects.

Comparison 3 Fluoxetine versus other SSRIs, Outcome 1 Failure to respond ‐ HDRS (‐50%).

Comparison 3 Fluoxetine versus other SSRIs, Outcome 2 End‐point score on rating scales.
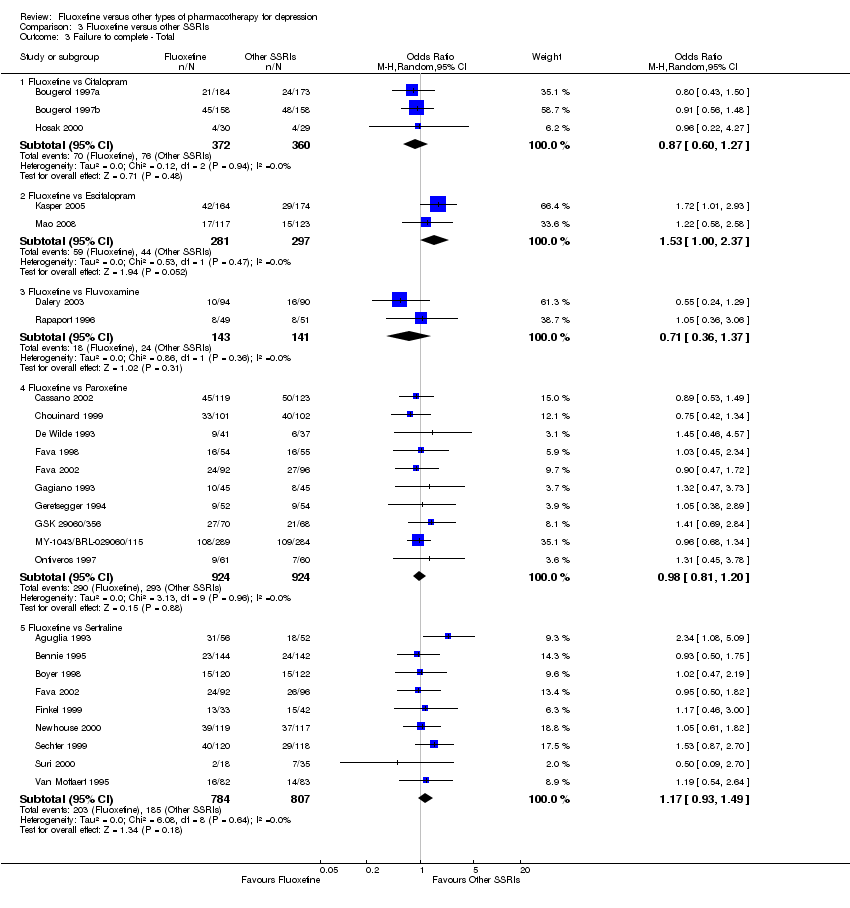
Comparison 3 Fluoxetine versus other SSRIs, Outcome 3 Failure to complete ‐ Total.

Comparison 3 Fluoxetine versus other SSRIs, Outcome 4 Failure to complete ‐ Inefficacy.
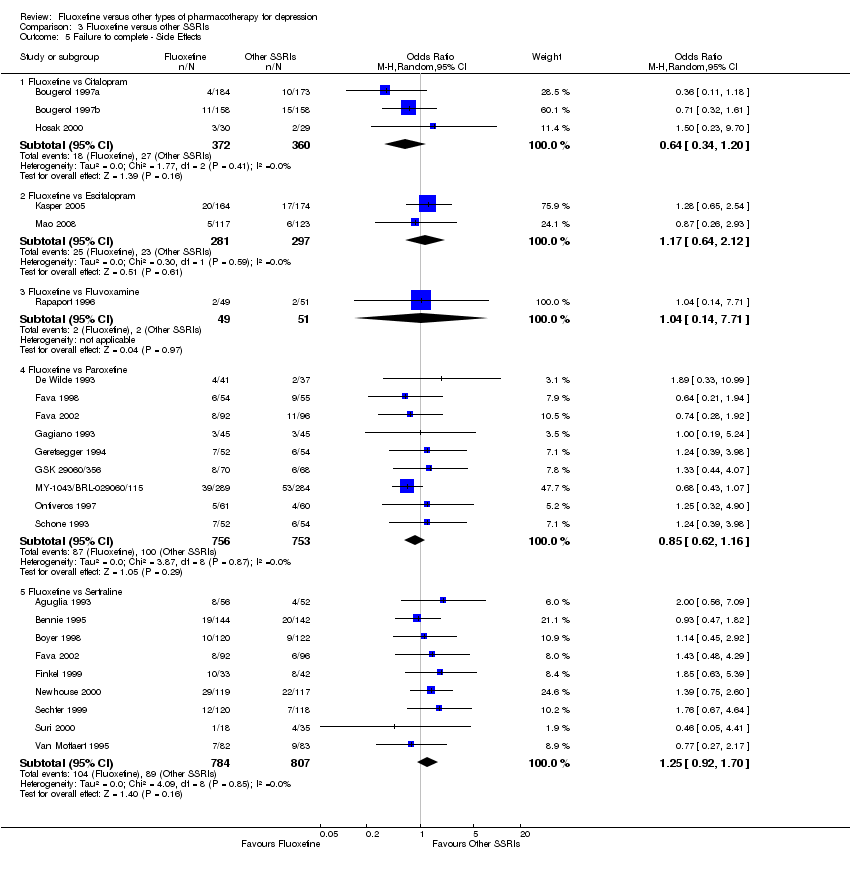
Comparison 3 Fluoxetine versus other SSRIs, Outcome 5 Failure to complete ‐ Side Effects.
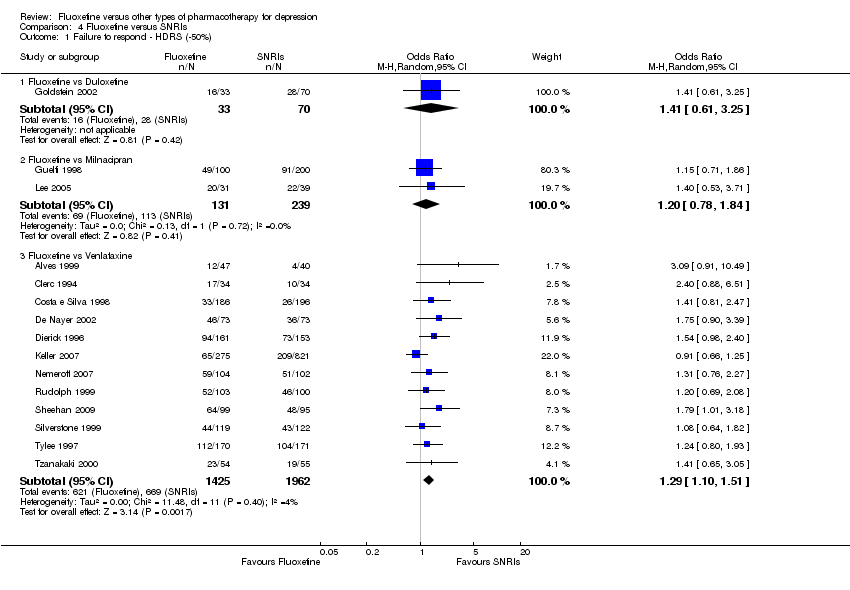
Comparison 4 Fluoxetine versus SNRIs, Outcome 1 Failure to respond ‐ HDRS (‐50%).
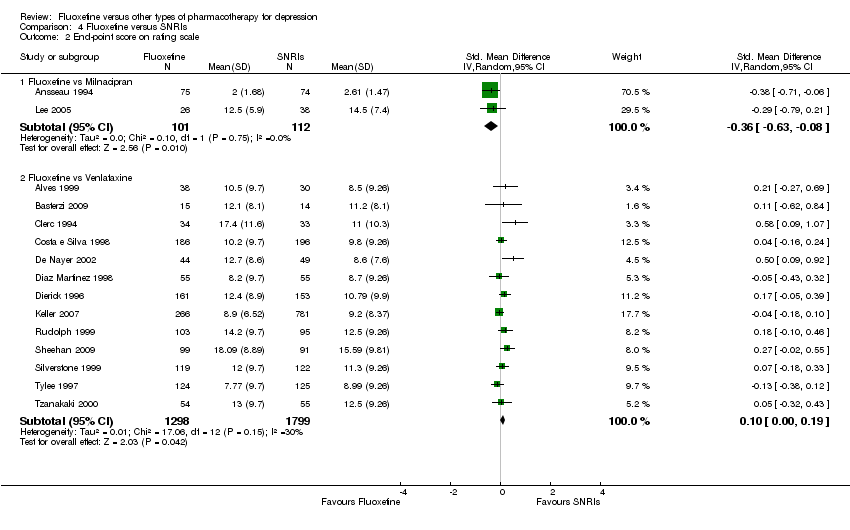
Comparison 4 Fluoxetine versus SNRIs, Outcome 2 End‐point score on rating scale.

Comparison 4 Fluoxetine versus SNRIs, Outcome 3 Failure to complete ‐ Total.
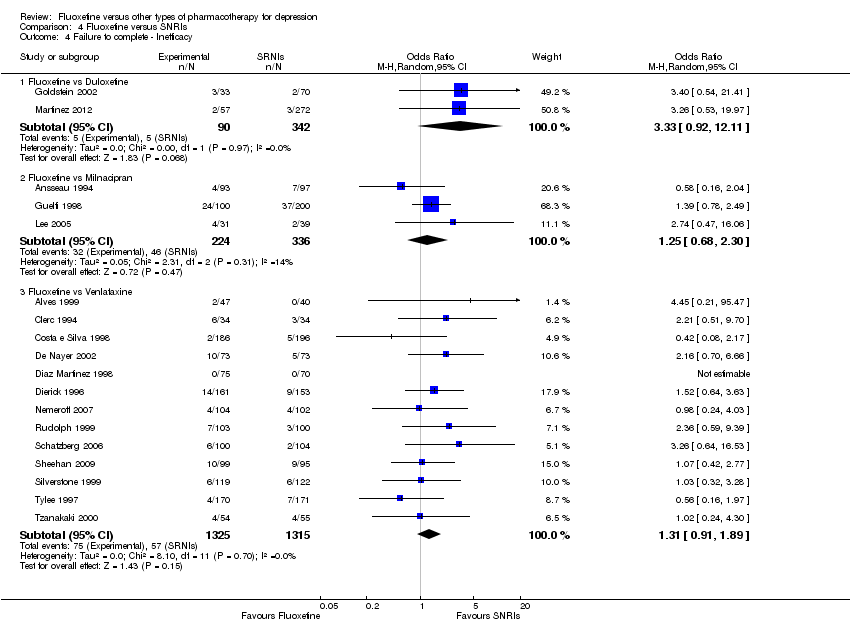
Comparison 4 Fluoxetine versus SNRIs, Outcome 4 Failure to complete ‐ Inefficacy.

Comparison 4 Fluoxetine versus SNRIs, Outcome 5 Failure to complete ‐ Side Effects.

Comparison 5 Fluoxetine versus MAOIs or newer ADs, Outcome 1 Failure to respond ‐ HDRS (‐50%).

Comparison 5 Fluoxetine versus MAOIs or newer ADs, Outcome 2 End‐point score on rating scales.

Comparison 5 Fluoxetine versus MAOIs or newer ADs, Outcome 3 Failure to complete ‐ Total.
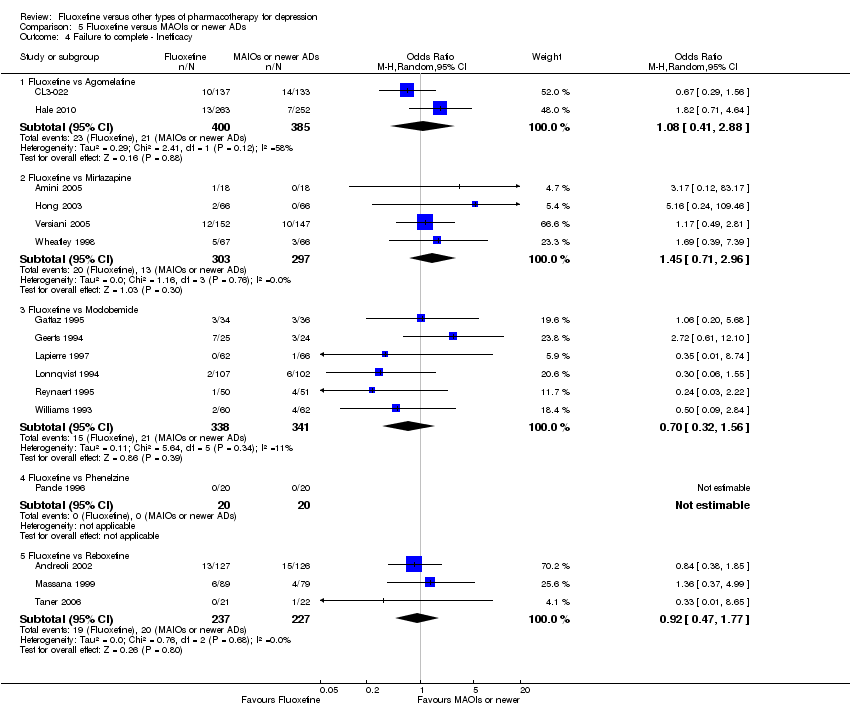
Comparison 5 Fluoxetine versus MAOIs or newer ADs, Outcome 4 Failure to complete ‐ Inefficacy.
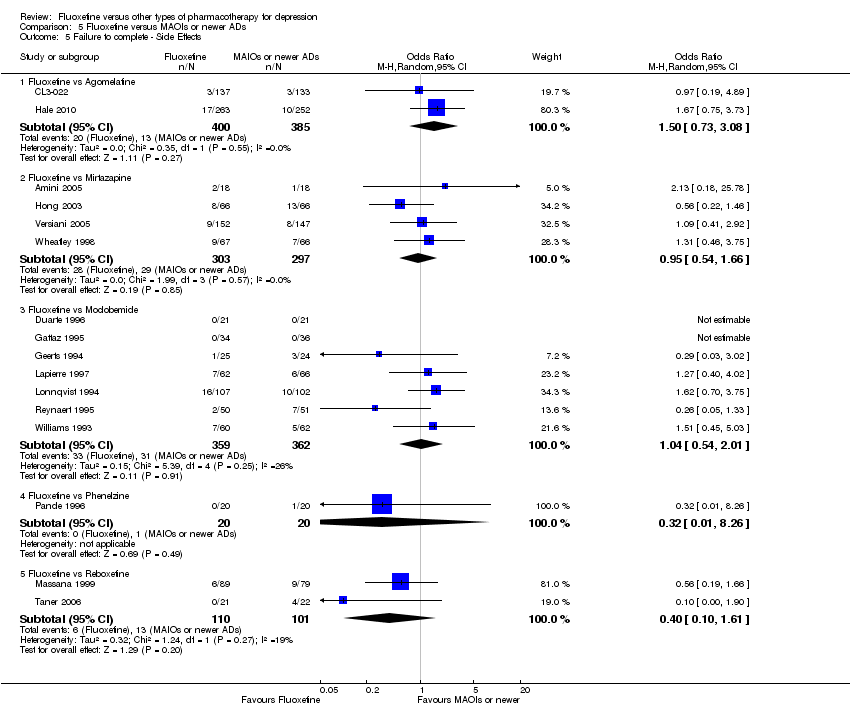
Comparison 5 Fluoxetine versus MAOIs or newer ADs, Outcome 5 Failure to complete ‐ Side Effects.
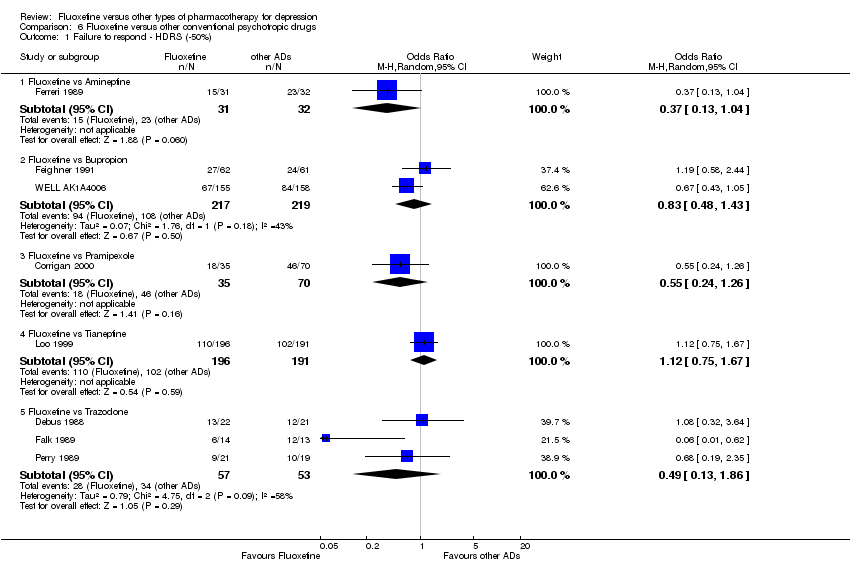
Comparison 6 Fluoxetine versus other conventional psychotropic drugs, Outcome 1 Failure to respond ‐ HDRS (‐50%).
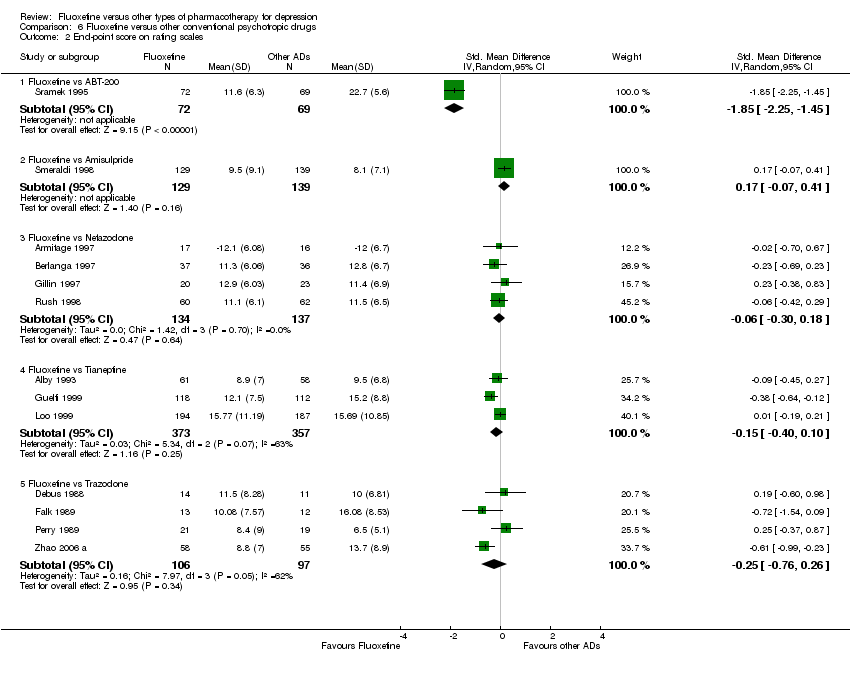
Comparison 6 Fluoxetine versus other conventional psychotropic drugs, Outcome 2 End‐point score on rating scales.

Comparison 6 Fluoxetine versus other conventional psychotropic drugs, Outcome 3 Failure to complete ‐ Total.

Comparison 6 Fluoxetine versus other conventional psychotropic drugs, Outcome 4 Failure to complete ‐ Inefficacy.
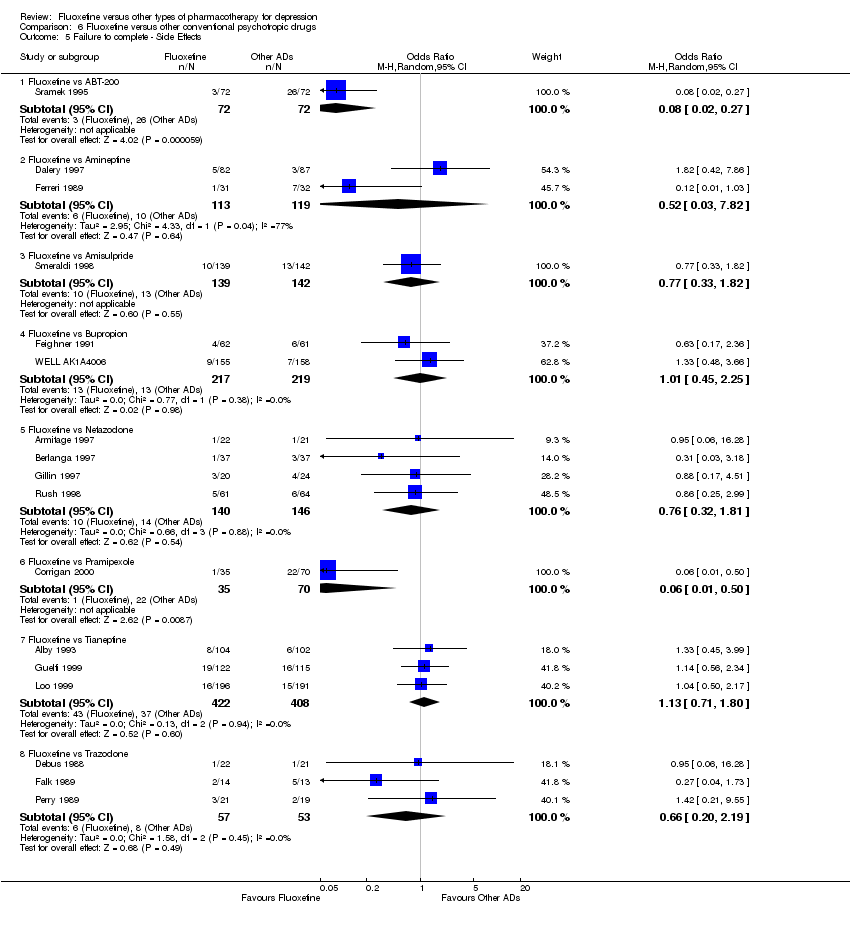
Comparison 6 Fluoxetine versus other conventional psychotropic drugs, Outcome 5 Failure to complete ‐ Side Effects.

Comparison 7 Fluoxetine versus other non‐conventional AD agents, Outcome 1 Failure to respond ‐ HDRS (‐50%).

Comparison 7 Fluoxetine versus other non‐conventional AD agents, Outcome 2 End‐point score on rating scales.

Comparison 7 Fluoxetine versus other non‐conventional AD agents, Outcome 3 Failure to complete ‐ Total.
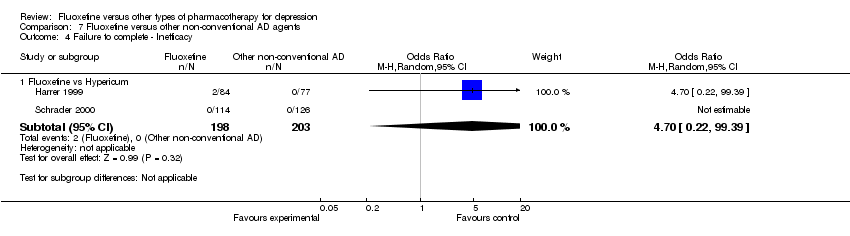
Comparison 7 Fluoxetine versus other non‐conventional AD agents, Outcome 4 Failure to complete ‐ Inefficacy.
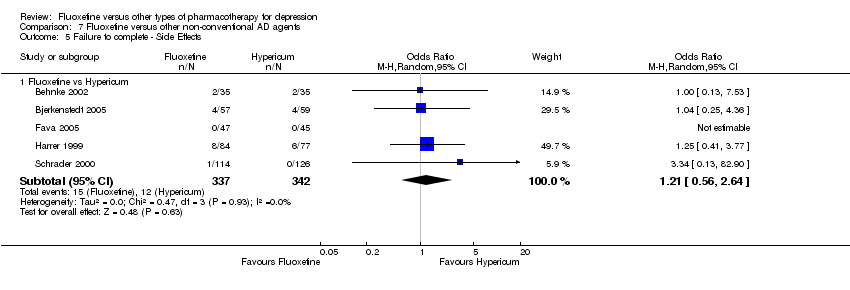
Comparison 7 Fluoxetine versus other non‐conventional AD agents, Outcome 5 Failure to complete ‐ Side Effects.

Comparison 8 Subgroup analysis for fluoxetine versus TCAs: failure to respond, Outcome 1 follow‐up <6 weeks.

Comparison 8 Subgroup analysis for fluoxetine versus TCAs: failure to respond, Outcome 2 follow‐up 6‐16 weeks.

Comparison 9 Subgroup analysis for fluoxetine versus TCAs: endpoint score, Outcome 1 follow‐up <6 weeks.

Comparison 9 Subgroup analysis for fluoxetine versus TCAs: endpoint score, Outcome 2 follow‐up 6‐16 weeks.

Comparison 9 Subgroup analysis for fluoxetine versus TCAs: endpoint score, Outcome 3 follow‐up >16 weeks.
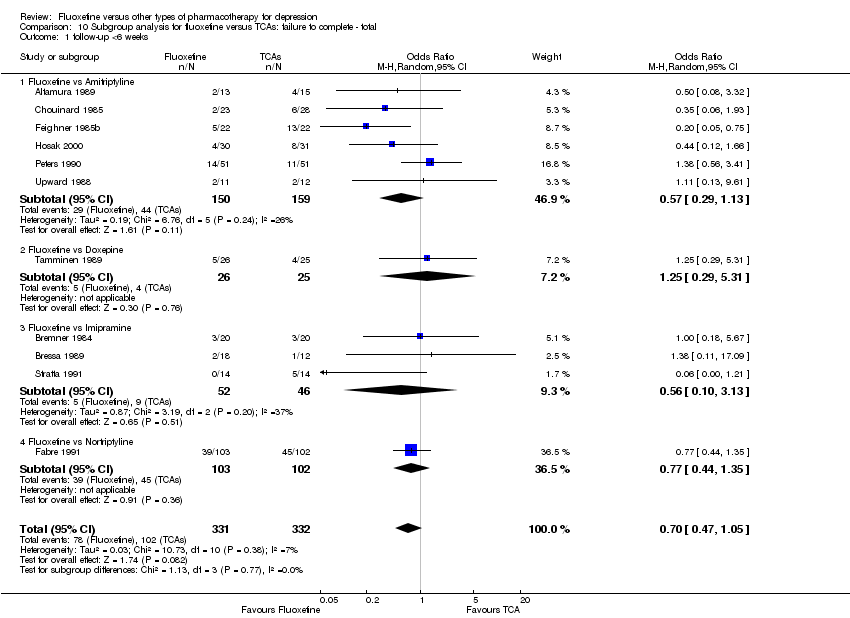
Comparison 10 Subgroup analysis for fluoxetine versus TCAs: failure to complete ‐ total, Outcome 1 follow‐up <6 weeks.

Comparison 10 Subgroup analysis for fluoxetine versus TCAs: failure to complete ‐ total, Outcome 2 follow‐up 6‐16 weeks.

Comparison 11 Subgroup analysis for fluoxetine versus TCAs: failure to complete ‐ inefficacy, Outcome 1 follow‐up <6 weeks.
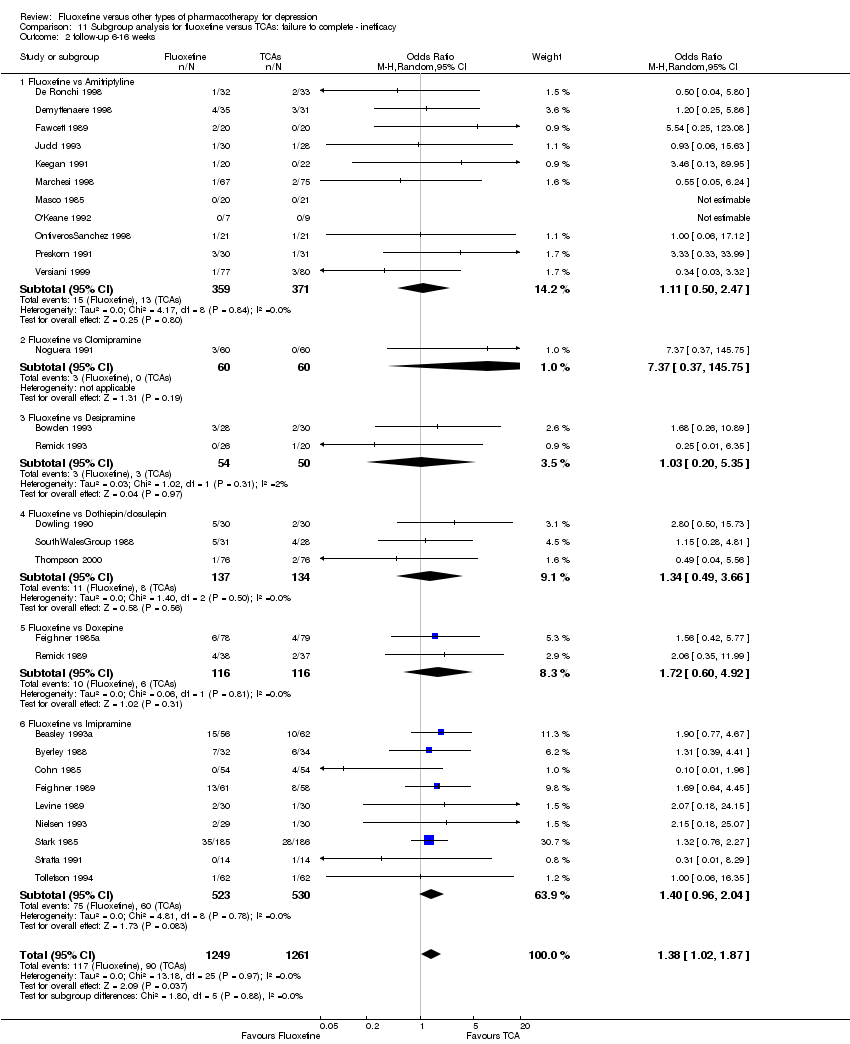
Comparison 11 Subgroup analysis for fluoxetine versus TCAs: failure to complete ‐ inefficacy, Outcome 2 follow‐up 6‐16 weeks.

Comparison 12 Subgroup analysis for fluoxetine versus TCAs: failure to complete ‐ side effects, Outcome 1 follow‐up <6 weeks.

Comparison 12 Subgroup analysis for fluoxetine versus TCAs: failure to complete ‐ side effects, Outcome 2 follow‐up 6‐16 weeks.

Comparison 13 Subgroup analysis for fluoxetine versus heterocyclics: endpoint score, Outcome 1 follow‐up <6 weeks.

Comparison 13 Subgroup analysis for fluoxetine versus heterocyclics: endpoint score, Outcome 2 follow‐up 6‐16 weeks.
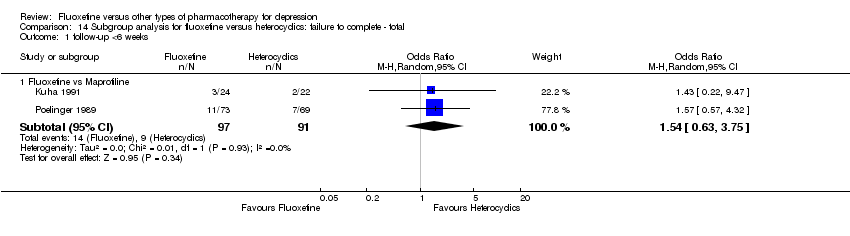
Comparison 14 Subgroup analysis for fluoxetine versus heterocyclics: failure to complete ‐ total, Outcome 1 follow‐up <6 weeks.
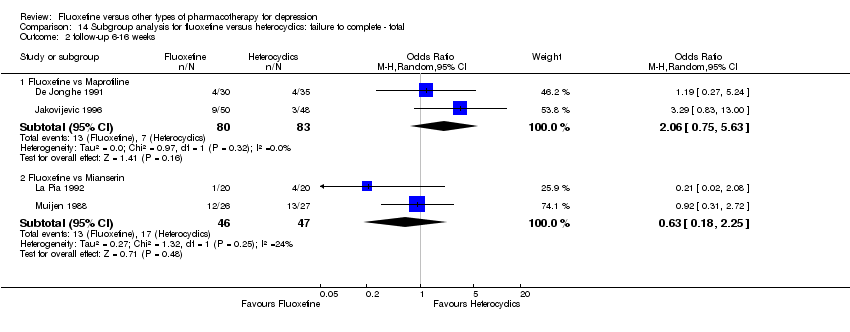
Comparison 14 Subgroup analysis for fluoxetine versus heterocyclics: failure to complete ‐ total, Outcome 2 follow‐up 6‐16 weeks.
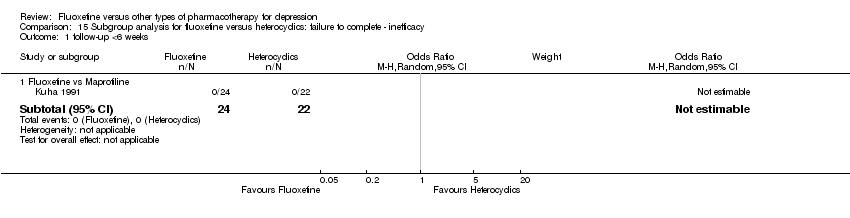
Comparison 15 Subgroup analysis for fluoxetine versus heterocyclics: failure to complete ‐ inefficacy, Outcome 1 follow‐up <6 weeks.

Comparison 15 Subgroup analysis for fluoxetine versus heterocyclics: failure to complete ‐ inefficacy, Outcome 2 follow‐up 6‐16 weeks.

Comparison 16 Subgroup analysis for fluoxetine versus heterocyclics: failure to complete ‐ side effects, Outcome 1 follow‐up <6 weeks.
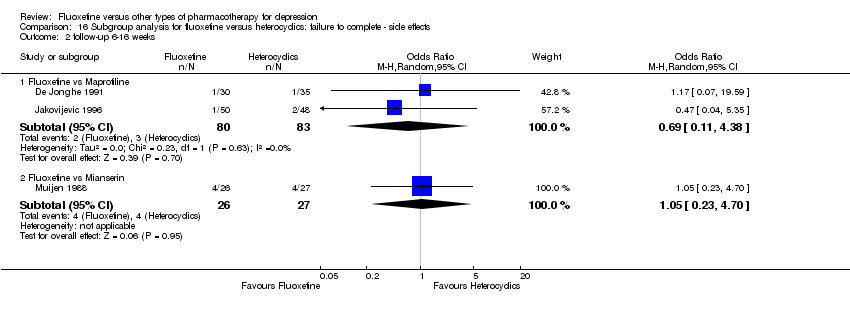
Comparison 16 Subgroup analysis for fluoxetine versus heterocyclics: failure to complete ‐ side effects, Outcome 2 follow‐up 6‐16 weeks.
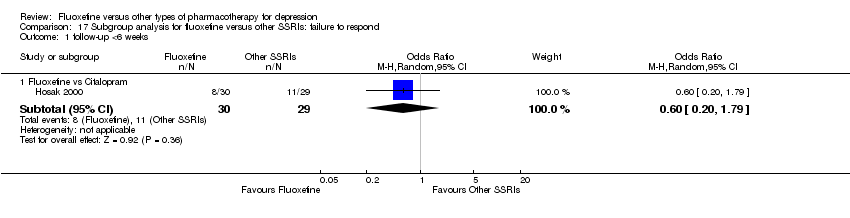
Comparison 17 Subgroup analysis for fluoxetine versus other SSRIs: failure to respond, Outcome 1 follow‐up <6 weeks.

Comparison 17 Subgroup analysis for fluoxetine versus other SSRIs: failure to respond, Outcome 2 follow‐up 6‐16 weeks.
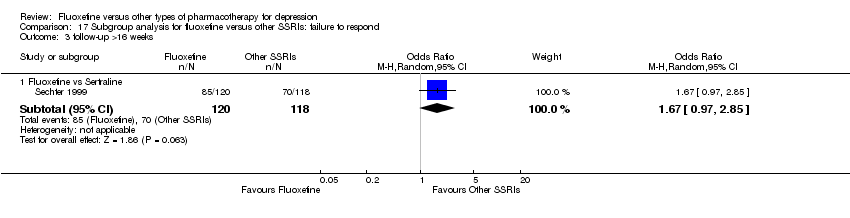
Comparison 17 Subgroup analysis for fluoxetine versus other SSRIs: failure to respond, Outcome 3 follow‐up >16 weeks.

Comparison 18 Subgroup analysis for fluoxetine versus other SSRIs: endpoint score, Outcome 1 follow‐up <6 weeks.

Comparison 18 Subgroup analysis for fluoxetine versus other SSRIs: endpoint score, Outcome 2 follow‐up >16 weeks.

Comparison 18 Subgroup analysis for fluoxetine versus other SSRIs: endpoint score, Outcome 3 follow‐up 6‐16 weeks.

Comparison 19 Subgroup analysis for fluoxetine versus other SSRIs: failure to complete ‐ total, Outcome 1 follow‐up <6 weeks.
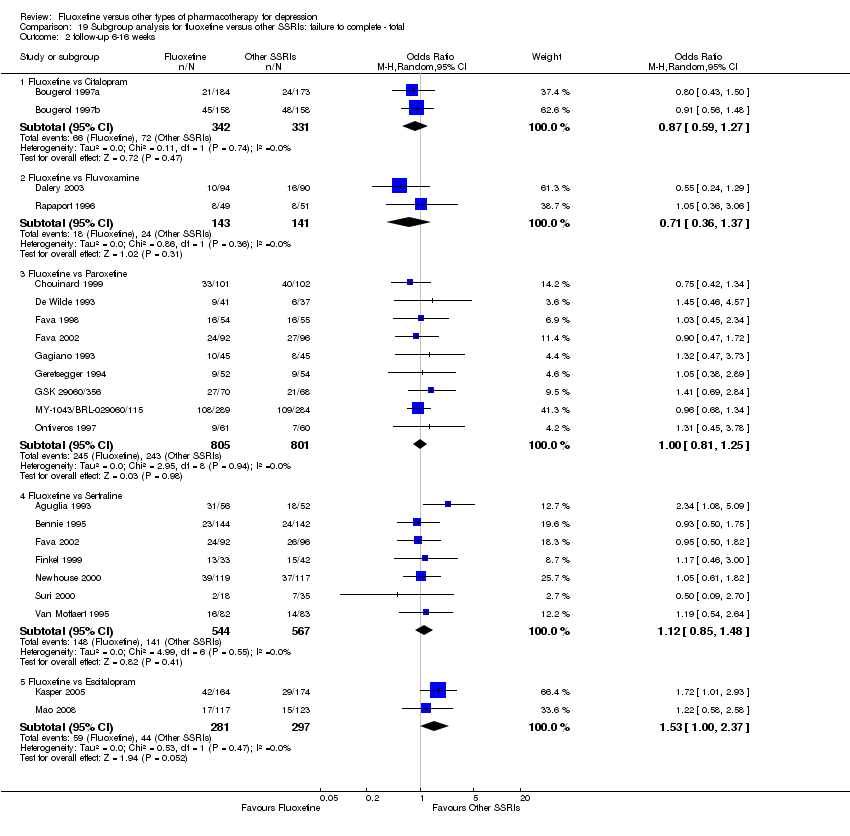
Comparison 19 Subgroup analysis for fluoxetine versus other SSRIs: failure to complete ‐ total, Outcome 2 follow‐up 6‐16 weeks.
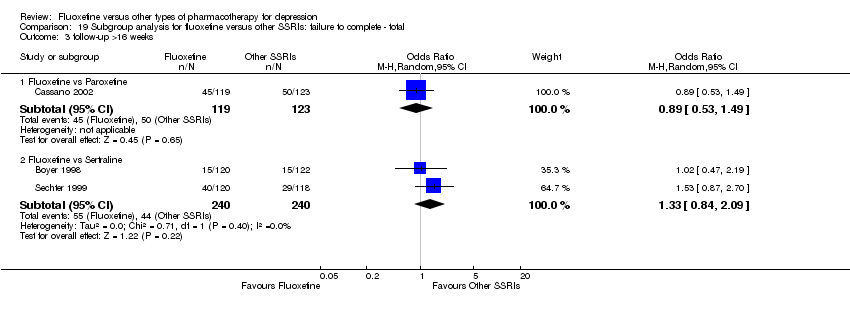
Comparison 19 Subgroup analysis for fluoxetine versus other SSRIs: failure to complete ‐ total, Outcome 3 follow‐up >16 weeks.

Comparison 20 Subgroup analysis for fluoxetine versus other SSRIs: failure to complete ‐ inefficacy, Outcome 1 follow‐up <6 weeks.
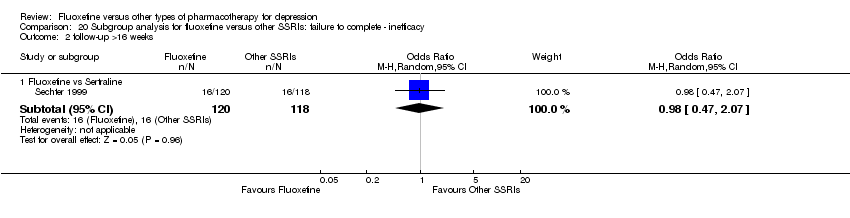
Comparison 20 Subgroup analysis for fluoxetine versus other SSRIs: failure to complete ‐ inefficacy, Outcome 2 follow‐up >16 weeks.

Comparison 20 Subgroup analysis for fluoxetine versus other SSRIs: failure to complete ‐ inefficacy, Outcome 3 follow‐up 6‐16 weeks.
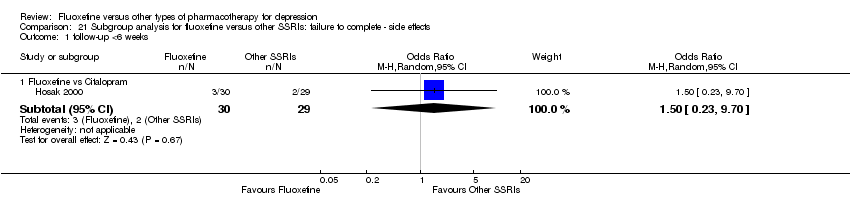
Comparison 21 Subgroup analysis for fluoxetine versus other SSRIs: failure to complete ‐ side effects, Outcome 1 follow‐up <6 weeks.

Comparison 21 Subgroup analysis for fluoxetine versus other SSRIs: failure to complete ‐ side effects, Outcome 2 follow‐up 6‐16 weeks.
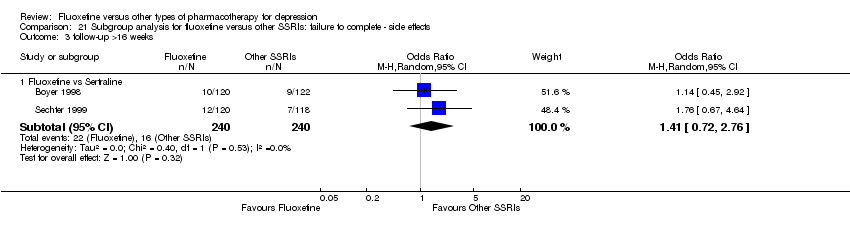
Comparison 21 Subgroup analysis for fluoxetine versus other SSRIs: failure to complete ‐ side effects, Outcome 3 follow‐up >16 weeks.
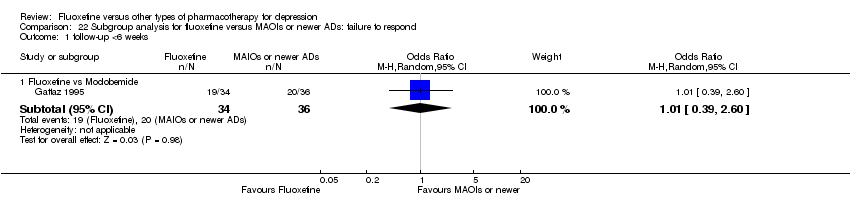
Comparison 22 Subgroup analysis for fluoxetine versus MAOIs or newer ADs: failure to respond, Outcome 1 follow‐up <6 weeks.

Comparison 22 Subgroup analysis for fluoxetine versus MAOIs or newer ADs: failure to respond, Outcome 2 follow‐up 6‐16 weeks.
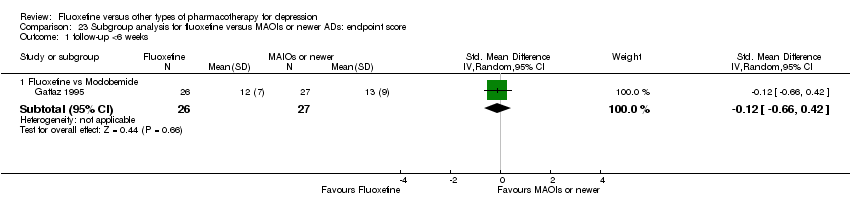
Comparison 23 Subgroup analysis for fluoxetine versus MAOIs or newer ADs: endpoint score, Outcome 1 follow‐up <6 weeks.
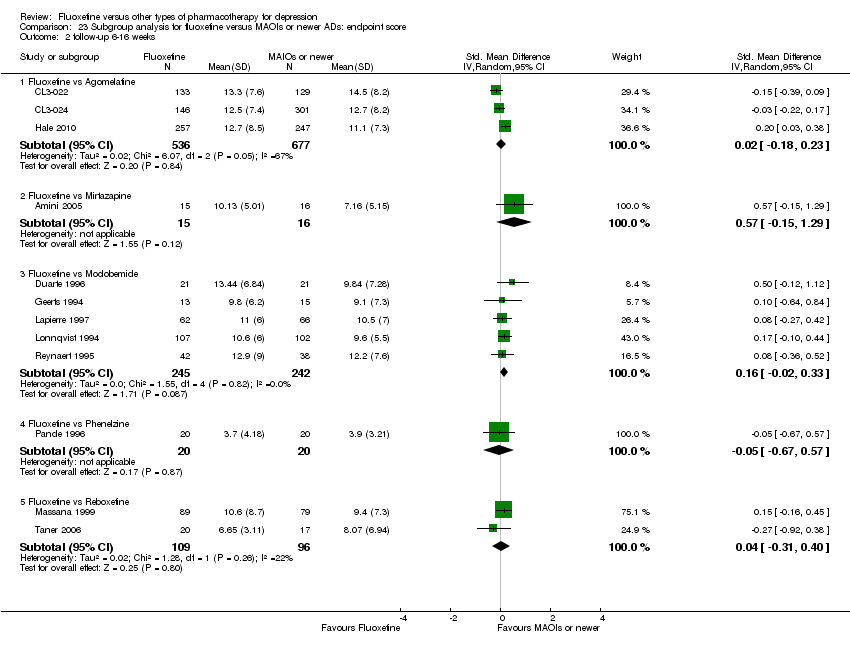
Comparison 23 Subgroup analysis for fluoxetine versus MAOIs or newer ADs: endpoint score, Outcome 2 follow‐up 6‐16 weeks.
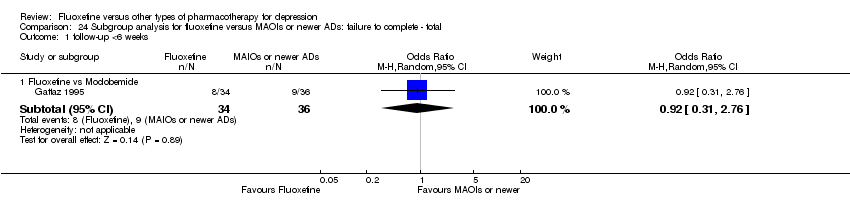
Comparison 24 Subgroup analysis for fluoxetine versus MAOIs or newer ADs: failure to complete ‐ total, Outcome 1 follow‐up <6 weeks.

Comparison 24 Subgroup analysis for fluoxetine versus MAOIs or newer ADs: failure to complete ‐ total, Outcome 2 follow‐up 6‐16 weeks.
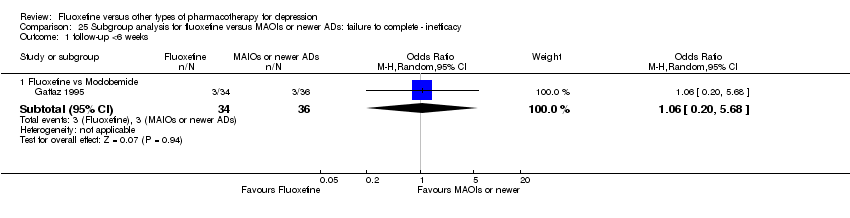
Comparison 25 Subgroup analysis for fluoxetine versus MAOIs or newer ADs: failure to complete ‐ inefficacy, Outcome 1 follow‐up <6 weeks.

Comparison 25 Subgroup analysis for fluoxetine versus MAOIs or newer ADs: failure to complete ‐ inefficacy, Outcome 2 follow‐up 6‐16 weeks.
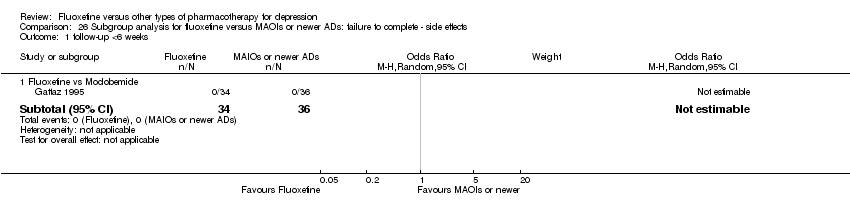
Comparison 26 Subgroup analysis for fluoxetine versus MAOIs or newer ADs: failure to complete ‐ side effects, Outcome 1 follow‐up <6 weeks.
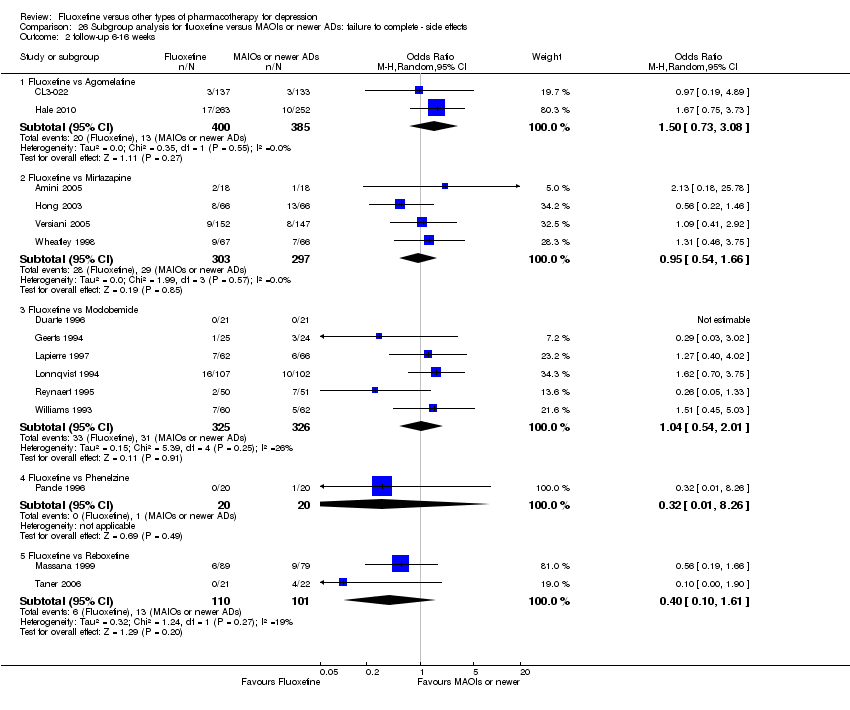
Comparison 26 Subgroup analysis for fluoxetine versus MAOIs or newer ADs: failure to complete ‐ side effects, Outcome 2 follow‐up 6‐16 weeks.
| Fluoxetine compared to TCAs | ||||||
| Patient or population: patients with depression | ||||||
| Outcomes | Illustrative comparative risks* (95% CI) | Relative effect | No of Participants | Quality of the evidence | Comments | |
| Assumed risk | Corresponding risk | |||||
| TCAs | Fluoxetine | |||||
| Failure to respond (reduction ≥ 50% on HDRS) | 471 per 1000 | 463 per 1000 | OR 0.97 | 2124 | ⊕⊕⊕⊝ | |
| Endpoint score (HDRS or MADRS) | The mean endpoint score in the intervention groups was | 3393 | ⊕⊕⊕⊝ | This effect approaches zero | ||
| Failure to complete ‐ total ‐ | 335 per 1000 | 284 per 1000 | OR 0.79 | 4194 | ⊕⊕⊕⊝ | |
| Failure to complete ‐ side effects ‐ | 193 per 1000 | 116 per 1000 | OR 0.55 | 3647 | ⊕⊕⊕⊝ | |
| Failure to complete ‐ inefficacy ‐ | 68 per 1000 | 87 per 1000 | OR 1.29 | 2911 | ⊕⊕⊕⊝ | |
| *The basis for the assumed risk (e.g. the median control group risk across studies) is provided in footnotes. The corresponding risk (and its 95% confidence interval) is based on the assumed risk in the comparison group and the relative effect of the intervention (and its 95% CI). | ||||||
| GRADE Working Group grades of evidence | ||||||
| 1 Limitations in study design: no details on randomisation procedures and allocation concealment. Blinding stated but not tested. | ||||||
| Fluoxetine compared to ABT 200 | ||||||
| Patient or population: patients with depression | ||||||
| Outcomes | Illustrative comparative risks* (95% CI) | Relative effect | No of Participants | Quality of the evidence | Comments | |
| Assumed risk | Corresponding risk | |||||
| ABT 200 | Fluoxetine | |||||
| Failure to respond (reduction ≥ 50% on HDRS) | 0 per 1000 | Not estimable | 0 (0) | |||
| Endpoint score (HDRS or MADRS) | The mean endpoint score in the intervention groups was | 141 | ⊕⊕⊝⊝ | This corresponds to a large effect according | ||
| Failure to complete ‐ total ‐ | 528 per 1000 | 167 per 1000 | OR 0.18 | 144 | ⊕⊕⊝⊝ | |
| Failure to complete ‐ inefficacy ‐ | 56 per 1000 | 14 per 1000 | OR 0.24 | 144 | ⊕⊕⊝⊝ | |
| Failure to complete ‐ side effects ‐ | 361 per 1000 | 43 per 1000 | OR 0.08 | 144 | ⊕⊕⊝⊝ | |
| *The basis for the assumed risk (e.g. the median control group risk across studies) is provided in footnotes. The corresponding risk (and its 95% confidence interval) is based on the assumed risk in the comparison group and the relative effect of the intervention (and its 95% CI). | ||||||
| GRADE Working Group grades of evidence | ||||||
| 1 Limitations in study design: no details on randomisation procedures and allocation concealment. Blinding stated but not tested. Only one study included in the analysis. | ||||||
| Fluoxetine compared to agomelatine | ||||||
| Patient or population: patients with depression | ||||||
| Outcomes | Illustrative comparative risks* (95% CI) | Relative effect | No of Participants | Quality of the evidence | Comments | |
| Assumed risk | Corresponding risk | |||||
| Agomelatine | Fluoxetine | |||||
| Failure to respond (reduction ≥ 50% on HDRS) | 282 per 1000 | 361 per 1000 | OR 1.44 | 515 | ⊕⊕⊝⊝ | |
| Endpoint score (HDRS or MADRS) | The mean endpoint score in the intervention groups was | 1213 | ⊕⊕⊕⊝ | This effect approaches zero | ||
| Failure to complete ‐ total ‐ | 135 per 1000 | 170 per 1000 | OR 1.31 | 785 | ⊕⊕⊕⊝ | |
| Failure to complete ‐ inefficacy ‐ | 55 per 1000 | 59 per 1000 | OR 1.08 | 785 | ⊕⊕⊕⊝ | |
| Failure to complete ‐ side effects ‐ | 34 per 1000 | 50 per 1000 | OR 1.51 | 785 | ⊕⊕⊕⊝ | |
| *The basis for the assumed risk (e.g. the median control group risk across studies) is provided in footnotes. The corresponding risk (and its 95% confidence interval) is based on the assumed risk in the comparison group and the relative effect of the intervention (and its 95% CI). | ||||||
| GRADE Working Group grades of evidence | ||||||
| 1 Limitations in studies designs: no details on randomisation procedures and allocation concealment. Blinding stated but not tested. 2 Only one study included in this analysis. | ||||||
| Fluoxetine compared to amineptine | ||||||
| Patient or population: patients with depression | ||||||
| Outcomes | Illustrative comparative risks* (95% CI) | Relative effect | No of Participants | Quality of the evidence | Comments | |
| Assumed risk | Corresponding risk | |||||
| Amineptine | Fluoxetine | |||||
| Failure to respond (reduction ≥ 50% on HDRS) | 719 per 1000 | 486 per 1000 | OR 0.37 | 63 | ⊕⊕⊕⊝ | |
| Endpoint score (HDRS or MADRS) | The mean endpoint score in the intervention groups was | 0 (0) | No data available on this outcome | |||
| Failure to complete ‐ total ‐ | 210 per 1000 | 140 per 1000 | OR 0.61 | 232 | ⊕⊕⊕⊝ | |
| Failure to complete ‐ inefficacy ‐ | 94 per 1000 | 97 per 1000 | OR 1.04 | 63 | ⊕⊕⊕⊝ | |
| Failure to complete ‐ side effects ‐ (Copy) | 84 per 1000 | 46 per 1000 | OR 0.52 | 232 | ⊕⊕⊕⊝ | |
| *The basis for the assumed risk (e.g. the median control group risk across studies) is provided in footnotes. The corresponding risk (and its 95% confidence interval) is based on the assumed risk in the comparison group and the relative effect of the intervention (and its 95% CI). | ||||||
| GRADE Working Group grades of evidence | ||||||
| 1 Limitations in studies designs: no details on randomisation procedures and allocation concealment. Blinding stated but not tested. | ||||||
| Fluoxetine compared to amisulpride | ||||||
| Patient or population: patients with depression | ||||||
| Outcomes | Illustrative comparative risks* (95% CI) | Relative effect | No of Participants | Quality of the evidence | Comments | |
| Assumed risk | Corresponding risk | |||||
| Amisulpride | Fluoxetine | |||||
| Failure to respond (reduction ≥ 50% on HDRS) | 0 per 1000 | Not estimable | 0 (0) | |||
| Endpoint score (HDRS or MADRS) | The mean endpoint score in the intervention groups was | 268 | ⊕⊕⊝⊝ | This corresponds to a very small effect according | ||
| Failure to complete ‐ total ‐ | 225 per 1000 | 288 per 1000 | OR 1.39 | 281 | ⊕⊕⊝⊝ | |
| Failure to complete ‐ inefficacy ‐ | 56 per 1000 | 65 per 1000 | OR 1.16 | 281 | ⊕⊕⊝⊝ | |
| Failure to complete ‐ side effects ‐ | 92 per 1000 | 72 per 1000 | OR 0.77 | 281 | ⊕⊕⊝⊝ | |
| *The basis for the assumed risk (e.g. the median control group risk across studies) is provided in footnotes. The corresponding risk (and its 95% confidence interval) is based on the assumed risk in the comparison group and the relative effect of the intervention (and its 95% CI). | ||||||
| GRADE Working Group grades of evidence | ||||||
| 1 Limitations in studies designs: no details on randomisation procedures and allocation concealment. Blinding stated but not tested. Only one study included in the analysis. | ||||||
| Fluoxetine compared to bupropion | ||||||
| Patient or population: patients with depression | ||||||
| Outcomes | Illustrative comparative risks* (95% CI) | Relative effect | No of Participants | Quality of the evidence | Comments | |
| Assumed risk | Corresponding risk | |||||
| Bupropion | Fluoxetine | |||||
| Failure to respond (reduction ≥ 50% on HDRS) | 493 per 1000 | 447 per 1000 | OR 0.83 | 436 | ⊕⊕⊕⊝ | |
| Endpoint score (HDRS or MADRS) | The mean endpoint score in the intervention groups was | 0 (0) | No data available on this outcome | |||
| Failure to complete ‐ total ‐ | 356 per 1000 | 356 per 1000 | OR 1.00 | 436 | ⊕⊕⊕⊝ | |
| Failure to complete ‐ inefficacy ‐ | 23 per 1000 | 0 per 1000 | OR 1.16 | 436 | ⊕⊕⊕⊝ | |
| Failure to complete ‐ side effects ‐ | 59 per 1000 | 60 per 1000 | OR 1.01 | 436 | ⊕⊕⊕⊝ | |
| *The basis for the assumed risk (e.g. the median control group risk across studies) is provided in footnotes. The corresponding risk (and its 95% confidence interval) is based on the assumed risk in the comparison group and the relative effect of the intervention (and its 95% CI). | ||||||
| GRADE Working Group grades of evidence | ||||||
| 1 Limitations in studies designs: no details on randomisation procedures and allocation concealment. Blinding stated but not tested. | ||||||
| Fluoxetine compared to citalopram | ||||||
| Patient or population: patients with depression | ||||||
| Outcomes | Illustrative comparative risks* (95% CI) | Relative effect | No of Participants | Quality of the evidence | Comments | |
| Assumed risk | Corresponding risk | |||||
| Citalopram | Fluoxetine | |||||
| Failure to respond (reduction ≥ 50% on HDRS) | 379 per 1000 | 268 per 1000 | OR 0.60 | 59 | ⊕⊝⊝⊝ | |
| Endpoint score (HDRS or MADRS) | The mean endpoint score in the intervention groups was | 661 | ⊕⊕⊕⊝ | This effect approaches zero | ||
| Failure to complete ‐ total ‐ | 211 per 1000 | 189 per 1000 | OR 0.87 | 732 | ⊕⊕⊕⊝ | |
| Failure to complete ‐ inefficacy ‐ | 75 per 1000 | 66 per 1000 | OR 0.87 | 732 | ⊕⊕⊕⊝ | |
| Failure to complete ‐ side effects ‐ | 75 per 1000 | 49 per 1000 | OR 0.64 | 732 | ⊕⊕⊕⊝ | |
| *The basis for the assumed risk (e.g. the median control group risk across studies) is provided in footnotes. The corresponding risk (and its 95% confidence interval) is based on the assumed risk in the comparison group and the relative effect of the intervention (and its 95% CI). | ||||||
| GRADE Working Group grades of evidence | ||||||
| 1 Limitations in studies designs: no details on randomisation procedures and allocation concealment. Blinding stated but not tested. 2 Only one study included in the analysis and less than 100 patients. | ||||||
| Fluoxetine compared to Crocus sativus | ||||||
| Patient or population: patients with depression | ||||||
| Outcomes | Illustrative comparative risks* (95% CI) | Relative effect | No of Participants | Quality of the evidence | Comments | |
| Assumed risk | Corresponding risk | |||||
| Crocus sativus | Fluoxetine | |||||
| Failure to respond (reduction ≥ 50% on HDRS) | 250 per 1000 | 150 per 1000 | OR 0.53 | 40 | ⊕⊝⊝⊝ | |
| Endpoint score (HDRS or MADRS) | The mean endpoint score in the intervention groups was | 0 (0) | No data available on this outcome | |||
| Failure to complete ‐ total ‐ | 50 per 1000 | 50 per 1000 | OR 1.00 | 40 | ⊕⊝⊝⊝ | |
| Failure to complete ‐ inefficacy ‐ | 0 per 1000 | Not estimable | 0 (0) | |||
| Failure to complete ‐ side effects ‐ | 0 per 1000 | Not estimable | 0 (0) | |||
| *The basis for the assumed risk (e.g. the median control group risk across studies) is provided in footnotes. The corresponding risk (and its 95% confidence interval) is based on the assumed risk in the comparison group and the relative effect of the intervention (and its 95% CI). | ||||||
| GRADE Working Group grades of evidence | ||||||
| 1 Limitations in studies designs: no details on randomisation procedures and allocation concealment. Blinding stated but not tested. Only one study included in the analysis and less than 50 patients. | ||||||
| Fluoxetine compared to for duloxetine | ||||||
| Patient or population: patients with depression | ||||||
| Outcomes | Illustrative comparative risks* (95% CI) | Relative effect | No of Participants | Quality of the evidence | Comments | |
| Assumed risk | Corresponding risk | |||||
| Fluoxetine | ||||||
| Failure to respond (reduction ≥ 50% on HDRS) | 400 per 1000 | 485 per 1000 | OR 1.41 | 103 | ⊕⊕⊝⊝ | |
| Endpoint score (HDRS or MADRS) | The mean endpoint score in the intervention groups was | 0 (0) | No data available on this outcome | |||
| Failure to complete ‐ total ‐ | 281 per 1000 | 260 per 1000 | OR 0.90 | 532 | ⊕⊕⊕⊝ | |
| Failure to complete ‐ inefficacy ‐ | 15 per 1000 | 47 per 1000 | OR 3.33 | 432 | ⊕⊕⊕⊝ | |
| Failure to complete ‐ side effects ‐ | 66 per 1000 | 19 per 1000 | OR 0.28 | 532 | ⊕⊕⊕⊝ | |
| *The basis for the assumed risk (e.g. the median control group risk across studies) is provided in footnotes. The corresponding risk (and its 95% confidence interval) is based on the assumed risk in the comparison group and the relative effect of the intervention (and its 95% CI). | ||||||
| GRADE Working Group grades of evidence | ||||||
| 1 Limitations in studies designs: no details on randomisation procedures and allocation concealment. Blinding stated but not tested. 2 Only one study included in the analysis. | ||||||
| Fluoxetine compared to escitalopram | ||||||
| Patient or population: patients with depression | ||||||
| Outcomes | Illustrative comparative risks* (95% CI) | Relative effect | No of Participants | Quality of the evidence | Comments | |
| Assumed risk | Corresponding risk | |||||
| Escitalopram | Fluoxetine | |||||
| Failure to respond (reduction ≥ 50% on HDRS) | 236 per 1000 | 239 per 1000 | OR 1.02 | 240 | ⊕⊕⊝⊝ | |
| Endpoint score (HDRS or MADRS) | The mean endpoint score in the intervention groups was | 231 | ⊕⊕⊝⊝ | This effect approaches zero | ||
| Failure to complete ‐ total ‐ | 148 per 1000 | 210 per 1000 | OR 1.53 | 578 | ⊕⊕⊕⊝ | |
| Failure to complete ‐ inefficacy ‐ | 13 per 1000 | 23 per 1000 | OR 1.74 | 578 | ⊕⊕⊕⊝ | |
| Failure to complete ‐ side effects ‐ | 77 per 1000 | 89 per 1000 | OR 1.17 | 578 | ⊕⊕⊕⊝ | |
| *The basis for the assumed risk (e.g. the median control group risk across studies) is provided in footnotes. The corresponding risk (and its 95% confidence interval) is based on the assumed risk in the comparison group and the relative effect of the intervention (and its 95% CI). | ||||||
| GRADE Working Group grades of evidence | ||||||
| 1 Limitations in studies designs: no details on randomisation procedures and allocation concealment. Blinding stated but not tested. 2 Only one study included in the analysis. | ||||||
| Fluoxetine compared to fluvoxamine | ||||||
| Patient or population: patients with depression | ||||||
| Outcomes | Illustrative comparative risks* (95% CI) | Relative effect | No of Participants | Quality of the evidence | Comments | |
| Assumed risk | Corresponding risk | |||||
| Fluvoxamine | Fluoxetine | |||||
| Failure to respond (reduction ≥ 50% on HDRS) | 605 per 1000 | 592 per 1000 | OR 0.95 | 177 | ⊕⊕⊝⊝ | |
| Endpoint score (HDRS or MADRS) | The mean endpoint score in the intervention groups was | 0 (0) | No data available on this outcome | |||
| Failure to complete ‐ total ‐ | 170 per 1000 | 936 per 1000 | OR 071 | 284 | ⊕⊕⊕⊝ | |
| Failure to complete ‐ inefficacy ‐ | 0 per 1000 | Not estimable | 0 (0) | |||
| Failure to complete ‐ side effects ‐ | 39 per 1000 | 41 per 1000 | OR 1.04 | 100 | ⊕⊕⊝⊝ | |
| *The basis for the assumed risk (e.g. the median control group risk across studies) is provided in footnotes. The corresponding risk (and its 95% confidence interval) is based on the assumed risk in the comparison group and the relative effect of the intervention (and its 95% CI). | ||||||
| GRADE Working Group grades of evidence | ||||||
| 1 Limitations in studies designs: no details on randomisation procedures and allocation concealment. Blinding stated but not tested. 2 Only one study included in the analysis. | ||||||
| Fluoxetine compared to hypericum | ||||||
| Patient or population: patients with depression | ||||||
| Outcomes | Illustrative comparative risks* (95% CI) | Relative effect | No of Participants | Quality of the evidence | Comments | |
| Assumed risk | Corresponding risk | |||||
| Hypericum | Fluoxetine | |||||
| Failure to respond (reduction ≥ 50% on HDRS) | 490 per 1000 | 485 per 1000 | OR 0.98 | 717 | ⊕⊕⊕⊝ | |
| Endpoint score (HDRS or MADRS) | The mean endpoint score in the intervention groups was | 648 | ⊕⊕⊕⊝ | This corresponds to a very small effect according | ||
| Failure to complete ‐ total ‐ | 129 per 1000 | 133 per 1000 | OR 1.04 | 679 | ⊕⊕⊕⊝ | |
| Failure to complete ‐ inefficacy ‐ | OR 4.70 | 401 | ⊕⊕⊕⊝ | |||
| Failure to complete ‐ side effects ‐ | 35 per 1000 | 42 per 1000 | OR 1.21 | 679 | ⊕⊕⊕⊝ | |
| *The basis for the assumed risk (e.g. the median control group risk across studies) is provided in footnotes. The corresponding risk (and its 95% confidence interval) is based on the assumed risk in the comparison group and the relative effect of the intervention (and its 95% CI). | ||||||
| GRADE Working Group grades of evidence | ||||||
| 1 Limitations in studies designs: no details on randomisation procedures and allocation concealment. Blinding stated but not tested. | ||||||
| Fluoxetine compared to maprotiline | ||||||
| Patient or population: patients with depression | ||||||
| Outcomes | Illustrative comparative risks* (95% CI) | Relative effect | No of Participants | Quality of the evidence | Comments | |
| Assumed risk | Corresponding risk | |||||
| Maprotiline | Fluoxetine | |||||
| Failure to respond (reduction ≥ 50% on HDRS) | 398 per 1000 | 563 per 1000 | OR 1.95 | 163 | ⊕⊕⊕⊝ | |
| Endpoint score (HDRS or MADRS) | The mean endpoint score in the intervention groups was | 433 | ⊕⊕⊕⊝ | This effect approaches zero | ||
| Failure to complete ‐ total ‐ | 92 per 1000 | 151 per 1000 | OR 1.75 | 351 | ⊕⊕⊕⊝ | |
| Failure to complete ‐ side effects ‐ | 67 per 1000 | 36 per 1000 | OR 0.53 | 209 | ⊕⊕⊕⊝ | |
| Failure to complete ‐ inefficacy ‐ | 19 per 1000 | 47 per 1000 | OR 2.54 | 209 | ⊕⊕⊕⊝ | |
| *The basis for the assumed risk (e.g. the median control group risk across studies) is provided in footnotes. The corresponding risk (and its 95% confidence interval) is based on the assumed risk in the comparison group and the relative effect of the intervention (and its 95% CI). | ||||||
| GRADE Working Group grades of evidence | ||||||
| 1 Limitations in studies designs: no details on randomisation procedures and allocation concealment. Blinding stated but not tested. | ||||||
| Fluoxetine compared to mianserin | ||||||
| Patient or population: patients with depression | ||||||
| Outcomes | Illustrative comparative risks* (95% CI) | Relative effect | No of Participants | Quality of the evidence | Comments | |
| Assumed risk | Corresponding risk | |||||
| Mianserin | Fluoxetine | |||||
| Failure to respond (reduction ≥ 50% on HDRS) | 593 per 1000 | 538 per 1000 | OR 0.80 | 53 | ⊕⊝⊝⊝ | |
| Endpoint score (HDRS or MADRS) | The mean endpoint score in the intervention groups was | 128 | ⊕⊕⊕⊝ | This corresponds to a small effect according | ||
| Failure to complete ‐ total ‐ | 362 per 1000 | 263 per 1000 | OR 0.63 | 93 | ⊕⊕⊕⊝ | |
| Failure to complete ‐ inefficacy ‐ | 74 per 1000 | 154 per 1000 | OR 2.27 | 53 | ⊕⊝⊝⊝ | |
| Failure to complete ‐ side effects ‐ | 148 per 1000 | 154 per 1000 | OR 1.05 | 53 | ⊕⊝⊝⊝ | |
| *The basis for the assumed risk (e.g. the median control group risk across studies) is provided in footnotes. The corresponding risk (and its 95% confidence interval) is based on the assumed risk in the comparison group and the relative effect of the intervention (and its 95% CI). | ||||||
| GRADE Working Group grades of evidence | ||||||
| 1 Limitations in studies designs: no details on randomisation procedures and allocation concealment. Blinding stated but not tested. 2 Only one study included in the analysis and less than 100 patients. | ||||||
| Fluoxetine compared to milnacipran | ||||||
| Patient or population: patients with depression | ||||||
| Outcomes | Illustrative comparative risks* (95% CI) | Relative effect | No of Participants | Quality of the evidence | Comments | |
| Assumed risk | Corresponding risk | |||||
| Milnacipran | Fluoxetine | |||||
| Failure to respond (reduction ≥ 50% on HDRS) | 473 per 1000 | 518 per 1000 | OR 1.20 | 370 | ⊕⊕⊕⊝ | |
| Endpoint score (HDRS or MADRS) | The mean endpoint score in the intervention groups was | 213 | ⊕⊕⊕⊝ | This corresponds to a small effect according | ||
| Failure to complete ‐ total ‐ | 411 per 1000 | 406 per 1000 | OR 0.98 | 560 | ⊕⊕⊕⊝ | |
| Failure to complete ‐ inefficacy ‐ | 137 per 1000 | 165 per 1000 | OR 1.25 | 560 | ⊕⊕⊕⊝ | |
| Failure to complete ‐ side effects ‐ | 71 per 1000 | 103 per 1000 | OR 1.50 | 560 | ⊕⊕⊕⊝ | |
| *The basis for the assumed risk (e.g. the median control group risk across studies) is provided in footnotes. The corresponding risk (and its 95% confidence interval) is based on the assumed risk in the comparison group and the relative effect of the intervention (and its 95% CI). | ||||||
| GRADE Working Group grades of evidence | ||||||
| 1 Limitations in studies designs: no details on randomisation procedures and allocation concealment. Blinding stated but not tested. | ||||||
| Fluoxetine compared to mirtazapine | ||||||
| Patient or population: patients with depression | ||||||
| Outcomes | Illustrative comparative risks* (95% CI) | Relative effect | No of Participants | Quality of the evidence | Comments | |
| Assumed risk | Corresponding risk | |||||
| Mirtazapine | Fluoxetine | |||||
| Failure to respond (reduction ≥ 50% on HDRS) | 354 per 1000 | 444 per 1000 | OR 1.46 | 600 | ⊕⊕⊕⊝ | |
| Endpoint score (HDRS or MADRS) | The mean endpoint score in the intervention groups was | 31 | ⊕⊝⊝⊝ | This corresponds to a medium effect according | ||
| Failure to complete ‐ total ‐ | 327 per 1000 | 304 per 1000 | OR 0.90 | 301 | ⊕⊕⊕⊝ | |
| Failure to complete ‐ inefficacy ‐ | 44 per 1000 | 62 per 1000 | OR 1.45 | 600 | ⊕⊕⊕⊝ | |
| Failure to complete ‐ side effects ‐ | 98 per 1000 | 93 per 1000 | OR 0.95 | 600 | ⊕⊕⊕⊝ | |
| *The basis for the assumed risk (e.g. the median control group risk across studies) is provided in footnotes. The corresponding risk (and its 95% confidence interval) is based on the assumed risk in the comparison group and the relative effect of the intervention (and its 95% CI). | ||||||
| GRADE Working Group grades of evidence | ||||||
| 1 Limitations in studies designs: no details on randomisation procedures and allocation concealment. Blinding stated but not tested. 2 Only one study included in the analysis and less than 100 patients. | ||||||
| Fluoxetine compared to moclobemide | ||||||
| Patient or population: patients with depression | ||||||
| Outcomes | Illustrative comparative risks* (95% CI) | Relative effect | No of Participants | Quality of the evidence | Comments | |
| Assumed risk | Corresponding risk | |||||
| Moclobemide | Fluoxetine | |||||
| Failure to respond (reduction ≥ 50% on HDRS) | 436 per 1000 | 496 per 1000 | OR 1.27 | 721 | ⊕⊕⊕⊝ | |
| Endpoint score (HDRS or MADRS) | The mean endpoint score in the intervention groups was | 540 | ⊕⊕⊕⊝ | This corresponds to a very small effect according | ||
| Failure to complete ‐ total ‐ | 207 per 1000 | 209 per 1000 | OR 1.01 | 721 | ⊕⊕⊕⊝ | |
| Failure to complete ‐ inefficacy ‐ | 62 per 1000 | 44 per 1000 | OR 0.70 | 679 | ⊕⊕⊕⊝ | |
| Failure to complete ‐ side effects ‐ | 86 per 1000 | 91 per 1000 | OR 1.07 | 721 | ⊕⊕⊕⊝ | |
| *The basis for the assumed risk (e.g. the median control group risk across studies) is provided in footnotes. The corresponding risk (and its 95% confidence interval) is based on the assumed risk in the comparison group and the relative effect of the intervention (and its 95% CI). | ||||||
| GRADE Working Group grades of evidence | ||||||
| 1 Limitations in studies designs: no details on randomisation procedures and allocation concealment. Blinding stated but not tested. | ||||||
| Fluoxetine compared to nefazodone | ||||||
| Patient or population: patients with depression | ||||||
| Outcomes | Illustrative comparative risks* (95% CI) | Relative effect | No of Participants | Quality of the evidence | Comments | |
| Assumed risk | Corresponding risk | |||||
| Nefazodone | Fluoxetine | |||||
| Failure to respond (reduction ≥ 50% on HDRS) | 0 per 1000 | Not estimable | 0 (0) | |||
| Endpoint score (HDRS or MADRS) | The mean endpoint score in the intervention groups was | 271 | ⊕⊕⊕⊝ | This effects approaches zero | ||
| Failure to complete ‐ total ‐ | 220 per 1000 | 132 per 1000 | OR 0.54 | 161 | ⊕⊕⊕⊝ | |
| Failure to complete ‐ inefficacy ‐ | 24 per 1000 | 17 per 1000 | OR 0.71 | 161 | ⊕⊕⊕⊝ | |
| Failure to complete ‐ side effects ‐ | 96 per 1000 | 75 per 1000 | OR 0.76 | 286 | ⊕⊕⊕⊝ | |
| *The basis for the assumed risk (e.g. the median control group risk across studies) is provided in footnotes. The corresponding risk (and its 95% confidence interval) is based on the assumed risk in the comparison group and the relative effect of the intervention (and its 95% CI). | ||||||
| GRADE Working Group grades of evidence | ||||||
| 1 Limitations in studies designs: no details on randomisation procedures and allocation concealment. Blinding stated but not tested. | ||||||
| Fluoxetine compared to paroxetine | ||||||
| Patient or population: patients with depression | ||||||
| Outcomes | Illustrative comparative risks* (95% CI) | Relative effect | No of Participants | Quality of the evidence | Comments | |
| Assumed risk | Corresponding risk | |||||
| Paroxetine | Fluoxetine | |||||
| Failure to respond (reduction ≥ 50% on HDRS) | 426 per 1000 | 477 per 1000 | OR 1.23 | 1574 | ⊕⊕⊕⊝ | |
| Endpoint score (HDRS or MADRS) | The mean endpoint score in the intervention groups was | 2061 | ⊕⊕⊕⊝ | This effect approaches zero | ||
| Failure to complete ‐ total ‐ | 317 per 1000 | 313 per 1000 | OR 0.98 | 1848 | ⊕⊕⊕⊝ | |
| Failure to complete ‐ inefficacy ‐ | 52 per 1000 | 39 per 1000 | OR 0.75 | 1005 | ⊕⊕⊕⊝ | |
| Failure to complete ‐ side effects ‐ | 133 per 1000 | 115 per 1000 | OR 0.85 | 1509 | ⊕⊕⊕⊝ | |
| *The basis for the assumed risk (e.g. the median control group risk across studies) is provided in footnotes. The corresponding risk (and its 95% confidence interval) is based on the assumed risk in the comparison group and the relative effect of the intervention (and its 95% CI). | ||||||
| GRADE Working Group grades of evidence | ||||||
| 1 Limitations in studies designs: no details on randomisation procedures and allocation concealment. Blinding stated but not tested. | ||||||
| Fluoxetine compared to phenelzine | ||||||
| Patient or population: patients with depression | ||||||
| Outcomes | Illustrative comparative risks* (95% CI) | Relative effect | No of Participants | Quality of the evidence | Comments | |
| Assumed risk | Corresponding risk | |||||
| Phenelzine | Fluoxetine | |||||
| Failure to respond (reduction ≥ 50% on HDRS) | 150 per 1000 | 200 per 1000 | OR 1.42 | 40 | ⊕⊝⊝⊝ | |
| Endpoint score (HDRS or MADRS) | The mean endpoint score in the intervention groups was | 40 | ⊕⊝⊝⊝ | This effect approaches zero | ||
| Failure to complete ‐ total ‐ | 100 per 1000 | 20 per 1000 | OR 0.18 | 40 | ⊕⊝⊝⊝ | |
| Failure to complete ‐ inefficacy ‐ | 0 per 1000 | Not estimable | 0 (0) | |||
| Failure to complete ‐ side effects ‐ | 50 per 1000 | 17 per 1000 | OR 0.32 | 40 | ⊕⊝⊝⊝ | |
| *The basis for the assumed risk (e.g. the median control group risk across studies) is provided in footnotes. The corresponding risk (and its 95% confidence interval) is based on the assumed risk in the comparison group and the relative effect of the intervention (and its 95% CI). | ||||||
| GRADE Working Group grades of evidence | ||||||
| 1 Limitations in studies designs: no details on randomisation procedures and allocation concealment. Blinding stated but not tested. Only one study included in the analysis and less than 50 patients. | ||||||
| Fluoxetine compared to pramipexole | ||||||
| Patient or population: patients with depression | ||||||
| Outcomes | Illustrative comparative risks* (95% CI) | Relative effect | No of Participants | Quality of the evidence | Comments | |
| Assumed risk | Corresponding risk | |||||
| Pramipexole | Fluoxetine | |||||
| Failure to respond (reduction ≥ 50% on HDRS) | 657 per 1000 | 513 per 1000 | OR 0.55 | 105 | ⊕⊕⊝⊝ | |
| Endpoint score (HDRS or MADRS) | The mean endpoint score in the intervention groups was | 0 (0) | No data available on this outcome | |||
| Failure to complete ‐ total ‐ | 443 per 1000 | 87 per 1000 | OR 0.12 | 105 | ⊕⊕⊝⊝ | |
| Failure to complete ‐ inefficacy ‐ | 57 per 1000 | 29 per 1000 | OR 0.49 | 105 | ⊕⊕⊝⊝ | |
| Failure to complete ‐ side effects ‐ | 314 per 1000 | 27 per 1000 | OR 0.06 | 105 | ⊕⊕⊝⊝ | |
| *The basis for the assumed risk (e.g. the median control group risk across studies) is provided in footnotes. The corresponding risk (and its 95% confidence interval) is based on the assumed risk in the comparison group and the relative effect of the intervention (and its 95% CI). | ||||||
| GRADE Working Group grades of evidence | ||||||
| 1 Limitations in studies designs: no details on randomisation procedures and allocation concealment. Blinding stated but not tested. Only one study included in the analysis. | ||||||
| Fluoxetine compared to reboxetine | ||||||
| Patient or population: patients with depression | ||||||
| Outcomes | Illustrative comparative risks* (95% CI) | Relative effect | No of Participants | Quality of the evidence | Comments | |
| Assumed risk | Corresponding risk | |||||
| Reboxetine | Fluoxetine | |||||
| Failure to respond (reduction ≥ 50% on HDRS) | 566 per 1000 | 501 per 1000 | OR 0.77 | 721 | ⊕⊕⊕⊝ | |
| Endpoint score (HDRS or MADRS) | The mean endpoint score in the intervention groups was | 205 | ⊕⊕⊕⊝ | This effect approaches zero | ||
| Failure to complete ‐ total ‐ | 361 per 1000 | 253 per 1000 | OR 0.60 | 764 | ⊕⊕⊕⊝ | |
| Failure to complete ‐ inefficacy ‐ | 88 per 1000 | 82 per 1000 | OR 0.92 | 464 | ⊕⊕⊕⊝ | |
| Failure to complete ‐ side effects ‐ | 129 per 1000 | 57 per 1000 | OR 0.41 | 211 | ⊕⊕⊕⊝ | |
| *The basis for the assumed risk (e.g. the median control group risk across studies) is provided in footnotes. The corresponding risk (and its 95% confidence interval) is based on the assumed risk in the comparison group and the relative effect of the intervention (and its 95% CI). | ||||||
| GRADE Working Group grades of evidence | ||||||
| 1 Limitations in studies designs: no details on randomisation procedures and allocation concealment. Blinding stated but not tested. | ||||||
| Fluoxetine compared to sertraline | ||||||
| Patient or population: patients with depression | ||||||
| Outcomes | Illustrative comparative risks* (95% CI) | Relative effect | No of Participants | Quality of the evidence | Comments | |
| Assumed risk | Corresponding risk | |||||
| Sertraline | Fluoxetine | |||||
| Failure to respond (reduction ≥ 50% on HDRS) | 416 per 1000 | 494 per 1000 | OR 1.37 | 1188 (6 studies) | ⊕⊕⊕⊝ | |
| Endpoint score (HDRS or MADRS) | The mean endpoint score in the intervention groups was | 1160 | ⊕⊕⊕⊝ | This corresponds to a very small effect according | ||
| Failure to complete ‐ total ‐ | 229 per 1000 | 258 per 1000 | OR 1.17 | 1591 | ⊕⊕⊕⊝ | |
| Failure to complete ‐ inefficacy ‐ | 70 per 1000 | 76 per 1000 | OR 1.09 | 1056 | ⊕⊕⊕⊝ | |
| Failure to complete ‐ side effects ‐ | 110 per 1000 | 134 per 1000 | OR 1.25 | 1591 | ⊕⊕⊕⊝ | |
| *The basis for the assumed risk (e.g. the median control group risk across studies) is provided in footnotes. The corresponding risk (and its 95% confidence interval) is based on the assumed risk in the comparison group and the relative effect of the intervention (and its 95% CI). | ||||||
| GRADE Working Group grades of evidence | ||||||
| 1 Limitations in studies designs: no details on randomisation procedures and allocation concealment. Blinding stated but not tested. | ||||||
| Fluoxetine compared to tianeptine | ||||||
| Patient or population: patients with depression | ||||||
| Outcomes | Illustrative comparative risks* (95% CI) | Relative effect | No of Participants | Quality of the evidence | Comments | |
| Assumed risk | Corresponding risk | |||||
| Tianeptine | Fluoxetine | |||||
| Failure to respond (reduction ≥ 50% on HDRS) | 534 per 1000 | 562 per 1000 | OR 1.12 | 387 | ⊕⊕⊕⊝ | |
| Endpoint score (HDRS or MADRS) | The mean endpoint score in the intervention groups was | 730 | ⊕⊕⊕⊝ | This corresponds to a very small effect according | ||
| Failure to complete ‐ total ‐ | 225 per 1000 | 218 per 1000 | OR 0.96 | 830 | ⊕⊕⊕⊝ | |
| Failure to complete ‐ inefficacy ‐ | 47 per 1000 | 39 per 1000 | OR 0.82 | 830 | ⊕⊕⊕⊝ | |
| Failure to complete ‐ side effects ‐ | 91 per 1000 | 101 per 1000 | OR 1.13 | 830 | ⊕⊕⊕⊝ | |
| *The basis for the assumed risk (e.g. the median control group risk across studies) is provided in footnotes. The corresponding risk (and its 95% confidence interval) is based on the assumed risk in the comparison group and the relative effect of the intervention (and its 95% CI). | ||||||
| GRADE Working Group grades of evidence | ||||||
| 1 Limitations in studies designs: no details on randomisation procedures and allocation concealment. Blinding stated but not tested. | ||||||
| Fluoxetine compared to trazodone | ||||||
| Patient or population: patients with depression | ||||||
| Outcomes | Illustrative comparative risks* (95% CI) | Relative effect | No of Participants | Quality of the evidence | Comments | |
| Assumed risk | Corresponding risk | |||||
| Trazodone | Fluoxetine | |||||
| Failure to respond (reduction ≥ 50% on HDRS) | 642 per 1000 | 467 per 1000 | OR 0.49 | 110 | ⊕⊕⊕⊝ | |
| Endpoint score (HDRS or MADRS) | The mean endpoint score in the intervention groups was | 203 | ⊕⊕⊕⊝ | This corresponds to a small effect according | ||
| Failure to complete ‐ total ‐ | 250 per 1000 | 145 per 1000 | OR 0.51 | 230 | ⊕⊕⊕⊝ | |
| Failure to complete ‐ inefficacy ‐ | 147 per 1000 | 38 per 1000 | OR 0.23 | 70 | ⊕⊕⊕⊝ | |
| Failure to complete ‐ side effects ‐ | 151 per 1000 | 105 per 1000 | OR 0.66 | 110 | ⊕⊕⊕⊝ | |
| *The basis for the assumed risk (e.g. the median control group risk across studies) is provided in footnotes. The corresponding risk (and its 95% confidence interval) is based on the assumed risk in the comparison group and the relative effect of the intervention (and its 95% CI). | ||||||
| GRADE Working Group grades of evidence | ||||||
| 1 Limitations in studies designs: no details on randomisation procedures and allocation concealment. Blinding stated but not tested. | ||||||
| Fluoxetine compared to venlafaxine | ||||||
| Patient or population: patients with depression | ||||||
| Outcomes | Illustrative comparative risks* (95% CI) | Relative effect | No of Participants | Quality of the evidence | Comments | |
| Assumed risk | Corresponding risk | |||||
| Venlafaxine | Fluoxetine | |||||
| Failure to respond (reduction ≥ 50% on HDRS) | 341 per 1000 | 400 per 1000 | OR 1.29 | 3387 | ⊕⊕⊕⊝ | |
| Endpoint score (HDRS or MADRS) | The mean endpoint score in the intervention groups was | 3097 | ⊕⊕⊕⊝ | This corresponds to a very small effect according | ||
| Failure to complete ‐ total ‐ | 256 per 1000 | 234 per 1000 | OR 0.89 | 2683 | ⊕⊕⊕⊝ | |
| Failure to complete ‐ inefficacy ‐ | 43 per 1000 | 56 per 1000 | OR 1.31 | 2640 | ⊕⊕⊕⊝ | |
| Failure to complete ‐ side effects ‐ | 116 per 1000 | 87 per 1000 | OR 0.72 | 2640 | ⊕⊕⊕⊝ | |
| *The basis for the assumed risk (e.g. the median control group risk across studies) is provided in footnotes. The corresponding risk (and its 95% confidence interval) is based on the assumed risk in the comparison group and the relative effect of the intervention (and its 95% CI). | ||||||
| GRADE Working Group grades of evidence | ||||||
| 1 Limitations in studies designs: no details on randomisation procedures and allocation concealment. Blinding stated but not tested. | ||||||
| Outcome or subgroup title | No. of studies | No. of participants | Statistical method | Effect size |
| 1 Failure to respond ‐ HDRS (‐50%) Show forest plot | 24 | 2124 | Odds Ratio (M‐H, Random, 95% CI) | 0.97 [0.77, 1.22] |
| 1.1 Fluoxetine vs Amitriptyline | 11 | 777 | Odds Ratio (M‐H, Random, 95% CI) | 0.93 [0.68, 1.28] |
| 1.2 Fluoxetine vs Clomipramine | 1 | 94 | Odds Ratio (M‐H, Random, 95% CI) | 0.63 [0.27, 1.45] |
| 1.3 Fluoxetine vs Desipramine | 2 | 84 | Odds Ratio (M‐H, Random, 95% CI) | 1.70 [0.56, 5.15] |
| 1.4 Fluoxetine vs Dothiepin/dosulepin | 2 | 144 | Odds Ratio (M‐H, Random, 95% CI) | 2.13 [1.08, 4.20] |
| 1.5 Fluoxetine vs Doxepine | 1 | 40 | Odds Ratio (M‐H, Random, 95% CI) | 1.0 [0.28, 3.54] |
| 1.6 Fluoxetine vs Imipramine | 5 | 761 | Odds Ratio (M‐H, Random, 95% CI) | 0.74 [0.41, 1.35] |
| 1.7 Fluoxetine vs Lofepramine | 1 | 183 | Odds Ratio (M‐H, Random, 95% CI) | 0.99 [0.55, 1.78] |
| 1.8 Fluoxetine vs Trimipramine | 1 | 41 | Odds Ratio (M‐H, Random, 95% CI) | 2.05 [0.56, 7.45] |
| 2 End‐point score on rating scale Show forest plot | 50 | 3393 | Std. Mean Difference (IV, Random, 95% CI) | 0.03 [‐0.07, 0.14] |
| 2.1 Fluoxetine vs Amiptriptyline | 19 | 1023 | Std. Mean Difference (IV, Random, 95% CI) | 0.10 [‐0.09, 0.29] |
| 2.2 Fluoxetine vs Clomipramine | 5 | 372 | Std. Mean Difference (IV, Random, 95% CI) | ‐0.10 [‐0.31, 0.10] |
| 2.3 Fluoxetine vs Desipramine | 4 | 147 | Std. Mean Difference (IV, Random, 95% CI) | 0.27 [‐0.32, 0.86] |
| 2.4 Fluoxetine vs Dothiepin/dosulepin | 4 | 266 | Std. Mean Difference (IV, Random, 95% CI) | 0.16 [‐0.27, 0.59] |
| 2.5 Fluoxetine vs Imipramine | 12 | 1063 | Std. Mean Difference (IV, Random, 95% CI) | ‐0.01 [‐0.21, 0.19] |
| 2.6 Fluoxetine vs Lofepramine | 1 | 183 | Std. Mean Difference (IV, Random, 95% CI) | 0.13 [‐0.16, 0.42] |
| 2.7 Fluoxetine vs Nomifensine | 1 | 28 | Std. Mean Difference (IV, Random, 95% CI) | ‐0.37 [‐1.12, 0.38] |
| 2.8 Fluoxetine vs Nortriptyline | 2 | 251 | Std. Mean Difference (IV, Random, 95% CI) | ‐0.48 [‐1.20, 0.24] |
| 2.9 Fluoxetine vs Trimipramine | 2 | 60 | Std. Mean Difference (IV, Random, 95% CI) | 0.41 [‐0.10, 0.92] |
| 3 Failure to complete ‐ Total Show forest plot | 49 | 4194 | Odds Ratio (M‐H, Random, 95% CI) | 0.79 [0.65, 0.96] |
| 3.1 Fluoxetine vs Amitriptyline | 18 | 1089 | Odds Ratio (M‐H, Random, 95% CI) | 0.62 [0.46, 0.85] |
| 3.2 Fluoxetine vs Clomipramine | 2 | 263 | Odds Ratio (M‐H, Random, 95% CI) | 0.65 [0.38, 1.14] |
| 3.3 Fluoxetine vs Desipramine | 2 | 104 | Odds Ratio (M‐H, Random, 95% CI) | 0.44 [0.16, 1.24] |
| 3.4 Fluoxetine vs Dothiepin/dosulepin | 5 | 478 | Odds Ratio (M‐H, Random, 95% CI) | 1.57 [0.92, 2.69] |
| 3.5 Fluoxetine vs Doxepine | 4 | 323 | Odds Ratio (M‐H, Random, 95% CI) | 0.81 [0.49, 1.32] |
| 3.6 Fluoxetine vs Imipramine | 12 | 1225 | Odds Ratio (M‐H, Random, 95% CI) | 0.79 [0.51, 1.21] |
| 3.7 Fluoxetine vs Lofepramine | 1 | 183 | Odds Ratio (M‐H, Random, 95% CI) | 0.50 [0.24, 1.04] |
| 3.8 Fluoxetine vs Nomifensine | 1 | 40 | Odds Ratio (M‐H, Random, 95% CI) | 6.33 [0.67, 60.16] |
| 3.9 Fluoxetine vs Nortriptyline | 3 | 448 | Odds Ratio (M‐H, Random, 95% CI) | 0.73 [0.36, 1.47] |
| 3.10 Fluoxetine vs Trimipramine | 1 | 41 | Odds Ratio (M‐H, Random, 95% CI) | 2.0 [0.41, 9.78] |
| 4 Failure to complete ‐ Inefficacy Show forest plot | 33 | 2911 | Odds Ratio (M‐H, Random, 95% CI) | 1.29 [0.96, 1.72] |
| 4.1 Fluoxetine vs Amitriptyline | 13 | 835 | Odds Ratio (M‐H, Random, 95% CI) | 0.91 [0.44, 1.88] |
| 4.2 Fluoxetine vs Clomipramine | 1 | 120 | Odds Ratio (M‐H, Random, 95% CI) | 7.37 [0.37, 145.75] |
| 4.3 Fluoxetine vs Desipramine | 2 | 104 | Odds Ratio (M‐H, Random, 95% CI) | 1.03 [0.20, 5.35] |
| 4.4 Fluoxetine vs Dothiepin/dosulepin | 3 | 271 | Odds Ratio (M‐H, Random, 95% CI) | 1.34 [0.49, 3.66] |
| 4.5 Fluoxetine vs Doxepine | 3 | 283 | Odds Ratio (M‐H, Random, 95% CI) | 1.72 [0.60, 4.92] |
| 4.6 Fluoxetine vs Imipramine | 10 | 1093 | Odds Ratio (M‐H, Random, 95% CI) | 1.41 [0.97, 2.05] |
| 4.7 Fluoxetine vs Nortriptyline | 1 | 205 | Odds Ratio (M‐H, Random, 95% CI) | 0.38 [0.07, 2.03] |
| 5 Failure to complete ‐ Side Effects Show forest plot | 40 | 3647 | Odds Ratio (M‐H, Random, 95% CI) | 0.55 [0.40, 0.75] |
| 5.1 Fluoxetine vs Amitriptyline | 16 | 1038 | Odds Ratio (M‐H, Random, 95% CI) | 0.41 [0.23, 0.71] |
| 5.2 Fluoxetine vs Clomipramine | 2 | 263 | Odds Ratio (M‐H, Random, 95% CI) | 0.30 [0.12, 0.79] |
| 5.3 Fluoxetine vs Desipramine | 2 | 104 | Odds Ratio (M‐H, Random, 95% CI) | 0.27 [0.04, 1.68] |
| 5.4 Fluoxetine vs Dothiepin/dosulepin | 5 | 478 | Odds Ratio (M‐H, Random, 95% CI) | 2.05 [0.59, 7.16] |
| 5.5 Fluoxetine vs Doxepine | 3 | 283 | Odds Ratio (M‐H, Random, 95% CI) | 0.82 [0.44, 1.53] |
| 5.6 Fluoxetine vs Imipramine | 10 | 1093 | Odds Ratio (M‐H, Random, 95% CI) | 0.47 [0.26, 0.86] |
| 5.7 Fluoxetine vs Lofepramine | 1 | 183 | Odds Ratio (M‐H, Random, 95% CI) | 0.16 [0.02, 1.38] |
| 5.8 Fluoxetine vs Nortriptyline | 1 | 205 | Odds Ratio (M‐H, Random, 95% CI) | 0.86 [0.42, 1.77] |
| Outcome or subgroup title | No. of studies | No. of participants | Statistical method | Effect size |
| 1 Failure to respond ‐ HDRS (‐50%) Show forest plot | 3 | Odds Ratio (M‐H, Random, 95% CI) | Subtotals only | |
| 1.1 Fluoxetine vs Maprotiline | 2 | 163 | Odds Ratio (M‐H, Random, 95% CI) | 1.95 [0.91, 4.18] |
| 1.2 Fluoxetine vs Mianserin | 1 | 53 | Odds Ratio (M‐H, Random, 95% CI) | 0.80 [0.27, 2.38] |
| 2 End‐point score on rating scale Show forest plot | 8 | Std. Mean Difference (IV, Random, 95% CI) | Subtotals only | |
| 2.1 Fluoxetine vs Maprotiline | 5 | 433 | Std. Mean Difference (IV, Random, 95% CI) | 0.04 [‐0.15, 0.23] |
| 2.2 Fluoxetine vs Mianserin | 3 | 128 | Std. Mean Difference (IV, Random, 95% CI) | 0.43 [‐0.38, 1.23] |
| 3 Failure to complete ‐ Total Show forest plot | 6 | Odds Ratio (M‐H, Random, 95% CI) | Subtotals only | |
| 3.1 Fluoxetine vs Maprotiline | 4 | 351 | Odds Ratio (M‐H, Random, 95% CI) | 1.75 [0.90, 3.41] |
| 3.2 Fluoxetine vs Mianserin | 2 | 93 | Odds Ratio (M‐H, Random, 95% CI) | 0.63 [0.18, 2.25] |
| 4 Failure to complete ‐ Inefficacy Show forest plot | 4 | Odds Ratio (M‐H, Random, 95% CI) | Subtotals only | |
| 4.1 Fluoxetine vs Maprotiline | 3 | 209 | Odds Ratio (M‐H, Random, 95% CI) | 2.54 [0.33, 19.19] |
| 4.2 Fluoxetine vs Mianserin | 1 | 53 | Odds Ratio (M‐H, Random, 95% CI) | 2.27 [0.38, 13.63] |
| 5 Failure to complete ‐ Side Effects Show forest plot | 4 | Odds Ratio (M‐H, Random, 95% CI) | Subtotals only | |
| 5.1 Fluoxetine vs Maprotiline | 3 | 209 | Odds Ratio (M‐H, Random, 95% CI) | 0.53 [0.15, 1.93] |
| 5.2 Fluoxetine vs Mianserin | 1 | 53 | Odds Ratio (M‐H, Random, 95% CI) | 1.05 [0.23, 4.70] |
| Outcome or subgroup title | No. of studies | No. of participants | Statistical method | Effect size |
| 1 Failure to respond ‐ HDRS (‐50%) Show forest plot | 17 | Odds Ratio (M‐H, Random, 95% CI) | Subtotals only | |
| 1.1 Fluoxetine vs Citalopram | 1 | 59 | Odds Ratio (M‐H, Random, 95% CI) | 0.60 [0.20, 1.79] |
| 1.2 Fluoxetine vs Escitalopram | 1 | 240 | Odds Ratio (M‐H, Random, 95% CI) | 1.02 [0.56, 1.85] |
| 1.3 Fluoxetine vs Fluvoxamine | 1 | 177 | Odds Ratio (M‐H, Random, 95% CI) | 0.95 [0.52, 1.74] |
| 1.4 Fluoxetine vs Paroxetine | 9 | 1574 | Odds Ratio (M‐H, Random, 95% CI) | 1.23 [0.93, 1.65] |
| 1.5 Fluoxetine vs Sertraline | 6 | 1188 | Odds Ratio (M‐H, Random, 95% CI) | 1.37 [1.08, 1.74] |
| 2 End‐point score on rating scales Show forest plot | 21 | Std. Mean Difference (IV, Random, 95% CI) | Subtotals only | |
| 2.1 Fluoxetine vs Citalopram | 3 | 661 | Std. Mean Difference (IV, Random, 95% CI) | 0.06 [‐0.10, 0.21] |
| 2.2 Fluoxetine vs Escitalopram | 1 | 231 | Std. Mean Difference (IV, Random, 95% CI) | 0.07 [‐0.19, 0.33] |
| 2.3 Fluoxetine vs Paroxetine | 11 | 2061 | Std. Mean Difference (IV, Random, 95% CI) | ‐0.01 [‐0.26, 0.24] |
| 2.4 Fluoxetine vs Sertraline | 7 | 1160 | Std. Mean Difference (IV, Random, 95% CI) | 0.09 [‐0.03, 0.20] |
| 3 Failure to complete ‐ Total Show forest plot | 25 | Odds Ratio (M‐H, Random, 95% CI) | Subtotals only | |
| 3.1 Fluoxetine vs Citalopram | 3 | 732 | Odds Ratio (M‐H, Random, 95% CI) | 0.87 [0.60, 1.27] |
| 3.2 Fluoxetine vs Escitalopram | 2 | 578 | Odds Ratio (M‐H, Random, 95% CI) | 1.53 [1.00, 2.37] |
| 3.3 Fluoxetine vs Fluvoxamine | 2 | 284 | Odds Ratio (M‐H, Random, 95% CI) | 0.71 [0.36, 1.37] |
| 3.4 Fluoxetine vs Paroxetine | 10 | 1848 | Odds Ratio (M‐H, Random, 95% CI) | 0.98 [0.81, 1.20] |
| 3.5 Fluoxetine vs Sertraline | 9 | 1591 | Odds Ratio (M‐H, Random, 95% CI) | 1.17 [0.93, 1.49] |
| 4 Failure to complete ‐ Inefficacy Show forest plot | 13 | Odds Ratio (M‐H, Random, 95% CI) | Subtotals only | |
| 4.1 Fluoxetine vs Citalopram | 3 | 732 | Odds Ratio (M‐H, Random, 95% CI) | 0.87 [0.48, 1.56] |
| 4.2 Fluoxetine vs Escitalopram | 2 | 578 | Odds Ratio (M‐H, Random, 95% CI) | 1.74 [0.46, 6.53] |
| 4.3 Fluoxetine vs Paroxetine | 4 | 1005 | Odds Ratio (M‐H, Random, 95% CI) | 0.75 [0.41, 1.39] |
| 4.4 Fluoxetine vs Sertraline | 5 | 1056 | Odds Ratio (M‐H, Random, 95% CI) | 1.09 [0.68, 1.77] |
| 5 Failure to complete ‐ Side Effects Show forest plot | 23 | Odds Ratio (M‐H, Random, 95% CI) | Subtotals only | |
| 5.1 Fluoxetine vs Citalopram | 3 | 732 | Odds Ratio (M‐H, Random, 95% CI) | 0.64 [0.34, 1.20] |
| 5.2 Fluoxetine vs Escitalopram | 2 | 578 | Odds Ratio (M‐H, Random, 95% CI) | 1.17 [0.64, 2.12] |
| 5.3 Fluoxetine vs Fluvoxamine | 1 | 100 | Odds Ratio (M‐H, Random, 95% CI) | 1.04 [0.14, 7.71] |
| 5.4 Fluoxetine vs Paroxetine | 9 | 1509 | Odds Ratio (M‐H, Random, 95% CI) | 0.85 [0.62, 1.16] |
| 5.5 Fluoxetine vs Sertraline | 9 | 1591 | Odds Ratio (M‐H, Random, 95% CI) | 1.25 [0.92, 1.70] |
| Outcome or subgroup title | No. of studies | No. of participants | Statistical method | Effect size |
| 1 Failure to respond ‐ HDRS (‐50%) Show forest plot | 15 | Odds Ratio (M‐H, Random, 95% CI) | Subtotals only | |
| 1.1 Fluoxetine vs Duloxetine | 1 | 103 | Odds Ratio (M‐H, Random, 95% CI) | 1.41 [0.61, 3.25] |
| 1.2 Fluoxetine vs Milnacipran | 2 | 370 | Odds Ratio (M‐H, Random, 95% CI) | 1.20 [0.78, 1.84] |
| 1.3 Fluoxetine vs Venlafaxine | 12 | 3387 | Odds Ratio (M‐H, Random, 95% CI) | 1.29 [1.10, 1.51] |
| 2 End‐point score on rating scale Show forest plot | 15 | Std. Mean Difference (IV, Random, 95% CI) | Subtotals only | |
| 2.1 Fluoxetine vs Milnacipran | 2 | 213 | Std. Mean Difference (IV, Random, 95% CI) | ‐0.36 [‐0.63, ‐0.08] |
| 2.2 Fluoxetine vs Venlafaxine | 13 | 3097 | Std. Mean Difference (IV, Random, 95% CI) | 0.10 [0.00, 0.19] |
| 3 Failure to complete ‐ Total Show forest plot | 19 | Odds Ratio (M‐H, Random, 95% CI) | Subtotals only | |
| 3.1 Fluoxetine vs Duloxetine | 2 | 532 | Odds Ratio (M‐H, Random, 95% CI) | 0.90 [0.53, 1.52] |
| 3.2 Fluoxetine vs Milnacipran | 3 | 560 | Odds Ratio (M‐H, Random, 95% CI) | 0.98 [0.68, 1.42] |
| 3.3 Fluoxetine vs Venlafaxine | 14 | 2683 | Odds Ratio (M‐H, Random, 95% CI) | 0.89 [0.74, 1.06] |
| 4 Failure to complete ‐ Inefficacy Show forest plot | 18 | Odds Ratio (M‐H, Random, 95% CI) | Subtotals only | |
| 4.1 Fluoxetine vs Duloxetine | 2 | 432 | Odds Ratio (M‐H, Random, 95% CI) | 3.33 [0.92, 12.11] |
| 4.2 Fluoxetine vs Milnacipran | 3 | 560 | Odds Ratio (M‐H, Random, 95% CI) | 1.25 [0.68, 2.30] |
| 4.3 Fluoxetine vs Venlafaxine | 13 | 2640 | Odds Ratio (M‐H, Random, 95% CI) | 1.31 [0.91, 1.89] |
| 5 Failure to complete ‐ Side Effects Show forest plot | 18 | Odds Ratio (M‐H, Random, 95% CI) | Subtotals only | |
| 5.1 Fluoxetine vs Duloxetine | 2 | 532 | Odds Ratio (M‐H, Random, 95% CI) | 0.28 [0.07, 1.23] |
| 5.2 Fluoxetine vs Milnacipran | 3 | 560 | Odds Ratio (M‐H, Random, 95% CI) | 1.50 [0.81, 2.76] |
| 5.3 Fluoxetine vs Venlafaxine | 13 | 2640 | Odds Ratio (M‐H, Random, 95% CI) | 0.72 [0.56, 0.94] |
| Outcome or subgroup title | No. of studies | No. of participants | Statistical method | Effect size |
| 1 Failure to respond ‐ HDRS (‐50%) Show forest plot | 16 | Odds Ratio (M‐H, Random, 95% CI) | Subtotals only | |
| 1.1 Fluoxetine vs Agomelatine | 1 | 515 | Odds Ratio (M‐H, Random, 95% CI) | 1.44 [0.99, 2.09] |
| 1.2 Fluoxetine vs Mirtazapine | 4 | 600 | Odds Ratio (M‐H, Random, 95% CI) | 1.46 [1.04, 2.04] |
| 1.3 Fluoxetine vs Moclobemide | 7 | 721 | Odds Ratio (M‐H, Random, 95% CI) | 1.27 [0.92, 1.75] |
| 1.4 Fluoxetine vs Phenelzine | 1 | 40 | Odds Ratio (M‐H, Random, 95% CI) | 1.42 [0.27, 7.34] |
| 1.5 Fluoxetine vs Reboxetine | 3 | 721 | Odds Ratio (M‐H, Random, 95% CI) | 0.77 [0.55, 1.10] |
| 2 End‐point score on rating scales Show forest plot | 13 | Std. Mean Difference (IV, Random, 95% CI) | Subtotals only | |
| 2.1 Fluoxetine vs Agomelatine | 3 | 1213 | Std. Mean Difference (IV, Random, 95% CI) | 0.02 [‐0.18, 0.23] |
| 2.2 Fluoxetine vs Mirtazapine | 1 | 31 | Std. Mean Difference (IV, Random, 95% CI) | 0.57 [‐0.15, 1.29] |
| 2.3 Fluoxetine vs Moclobemide | 6 | 540 | Std. Mean Difference (IV, Random, 95% CI) | 0.13 [‐0.04, 0.30] |
| 2.4 Fluoxetine vs Phenelzine | 1 | 40 | Std. Mean Difference (IV, Random, 95% CI) | ‐0.05 [‐0.67, 0.57] |
| 2.5 Fluoxetine vs Reboxetine | 2 | 205 | Std. Mean Difference (IV, Random, 95% CI) | 0.04 [‐0.31, 0.40] |
| 3 Failure to complete ‐ Total Show forest plot | 17 | Odds Ratio (M‐H, Random, 95% CI) | Subtotals only | |
| 3.1 Fluoxetine vs Agomelatine | 2 | 785 | Odds Ratio (M‐H, Random, 95% CI) | 1.22 [0.59, 2.49] |
| 3.2 Fluoxetine vs Mirtazapine | 3 | 301 | Odds Ratio (M‐H, Random, 95% CI) | 0.92 [0.51, 1.68] |
| 3.3 Fluoxetine vs Moclobemide | 7 | 721 | Odds Ratio (M‐H, Random, 95% CI) | 1.01 [0.70, 1.47] |
| 3.4 Fluoxetine vs Phenelzine | 1 | 40 | Odds Ratio (M‐H, Random, 95% CI) | 0.18 [0.01, 4.01] |
| 3.5 Fluoxetine vs Reboxetine | 4 | 764 | Odds Ratio (M‐H, Random, 95% CI) | 0.60 [0.44, 0.83] |
| 4 Failure to complete ‐ Inefficacy Show forest plot | 16 | Odds Ratio (M‐H, Random, 95% CI) | Subtotals only | |
| 4.1 Fluoxetine vs Agomelatine | 2 | 785 | Odds Ratio (M‐H, Random, 95% CI) | 1.08 [0.41, 2.88] |
| 4.2 Fluoxetine vs Mirtazapine | 4 | 600 | Odds Ratio (M‐H, Random, 95% CI) | 1.45 [0.71, 2.96] |
| 4.3 Fluoxetine vs Moclobemide | 6 | 679 | Odds Ratio (M‐H, Random, 95% CI) | 0.70 [0.32, 1.56] |
| 4.4 Fluoxetine vs Phenelzine | 1 | 40 | Odds Ratio (M‐H, Random, 95% CI) | 0.0 [0.0, 0.0] |
| 4.5 Fluoxetine vs Reboxetine | 3 | 464 | Odds Ratio (M‐H, Random, 95% CI) | 0.92 [0.47, 1.77] |
| 5 Failure to complete ‐ Side Effects Show forest plot | 16 | Odds Ratio (M‐H, Random, 95% CI) | Subtotals only | |
| 5.1 Fluoxetine vs Agomelatine | 2 | 785 | Odds Ratio (M‐H, Random, 95% CI) | 1.50 [0.73, 3.08] |
| 5.2 Fluoxetine vs Mirtazapine | 4 | 600 | Odds Ratio (M‐H, Random, 95% CI) | 0.95 [0.54, 1.66] |
| 5.3 Fluoxetine vs Moclobemide | 7 | 721 | Odds Ratio (M‐H, Random, 95% CI) | 1.04 [0.54, 2.01] |
| 5.4 Fluoxetine vs Phenelzine | 1 | 40 | Odds Ratio (M‐H, Random, 95% CI) | 0.32 [0.01, 8.26] |
| 5.5 Fluoxetine vs Reboxetine | 2 | 211 | Odds Ratio (M‐H, Random, 95% CI) | 0.40 [0.10, 1.61] |
| Outcome or subgroup title | No. of studies | No. of participants | Statistical method | Effect size |
| 1 Failure to respond ‐ HDRS (‐50%) Show forest plot | 8 | Odds Ratio (M‐H, Random, 95% CI) | Subtotals only | |
| 1.1 Fluoxetine vs Amineptine | 1 | 63 | Odds Ratio (M‐H, Random, 95% CI) | 0.37 [0.13, 1.04] |
| 1.2 Fluoxetine vs Bupropion | 2 | 436 | Odds Ratio (M‐H, Random, 95% CI) | 0.83 [0.48, 1.43] |
| 1.3 Fluoxetine vs Pramipexole | 1 | 105 | Odds Ratio (M‐H, Random, 95% CI) | 0.55 [0.24, 1.26] |
| 1.4 Fluoxetine vs Tianeptine | 1 | 387 | Odds Ratio (M‐H, Random, 95% CI) | 1.12 [0.75, 1.67] |
| 1.5 Fluoxetine vs Trazodone | 3 | 110 | Odds Ratio (M‐H, Random, 95% CI) | 0.49 [0.13, 1.86] |
| 2 End‐point score on rating scales Show forest plot | 13 | Std. Mean Difference (IV, Random, 95% CI) | Subtotals only | |
| 2.1 Fluoxetine vs ABT‐200 | 1 | 141 | Std. Mean Difference (IV, Random, 95% CI) | ‐1.85 [‐2.25, ‐1.45] |
| 2.2 Fluoxetine vs Amisulpride | 1 | 268 | Std. Mean Difference (IV, Random, 95% CI) | 0.17 [‐0.07, 0.41] |
| 2.3 Fluoxetine vs Nefazodone | 4 | 271 | Std. Mean Difference (IV, Random, 95% CI) | ‐0.06 [‐0.30, 0.18] |
| 2.4 Fluoxetine vs Tianeptine | 3 | 730 | Std. Mean Difference (IV, Random, 95% CI) | ‐0.15 [‐0.40, 0.10] |
| 2.5 Fluoxetine vs Trazodone | 4 | 203 | Std. Mean Difference (IV, Random, 95% CI) | ‐0.25 [‐0.76, 0.26] |
| 3 Failure to complete ‐ Total Show forest plot | 17 | Odds Ratio (M‐H, Random, 95% CI) | Subtotals only | |
| 3.1 Fluoxetine vs ABT‐200 | 1 | 144 | Odds Ratio (M‐H, Random, 95% CI) | 0.18 [0.08, 0.39] |
| 3.2 Fluoxetine vs Amineptine | 2 | 232 | Odds Ratio (M‐H, Random, 95% CI) | 0.61 [0.17, 2.21] |
| 3.3 Fluoxetine vs Amisulpride | 1 | 281 | Odds Ratio (M‐H, Random, 95% CI) | 1.39 [0.81, 2.38] |
| 3.4 Fluoxetine vs Bupropion | 2 | 436 | Odds Ratio (M‐H, Random, 95% CI) | 1.00 [0.67, 1.48] |
| 3.5 Fluoxetine vs Nefazodone | 3 | 161 | Odds Ratio (M‐H, Random, 95% CI) | 0.54 [0.22, 1.31] |
| 3.6 Fluoxetine vs Pramipexole | 1 | 105 | Odds Ratio (M‐H, Random, 95% CI) | 0.12 [0.03, 0.42] |
| 3.7 Fluoxetine vs Tianeptine | 3 | 830 | Odds Ratio (M‐H, Random, 95% CI) | 0.96 [0.69, 1.33] |
| 3.8 Fluoxetine vs Trazodone | 4 | 230 | Odds Ratio (M‐H, Random, 95% CI) | 0.51 [0.23, 1.13] |
| 4 Failure to complete ‐ Inefficacy Show forest plot | 14 | Odds Ratio (M‐H, Random, 95% CI) | Subtotals only | |
| 4.1 Fluoxetine vs ABT‐200 | 1 | 144 | Odds Ratio (M‐H, Random, 95% CI) | 0.24 [0.03, 2.20] |
| 4.2 Fluoxetine vs Amineptine | 1 | 63 | Odds Ratio (M‐H, Random, 95% CI) | 1.04 [0.19, 5.57] |
| 4.3 Fluoxetine vs Amisulpride | 1 | 281 | Odds Ratio (M‐H, Random, 95% CI) | 1.16 [0.43, 3.10] |
| 4.4 Fluoxetine vs Bupropion | 2 | 436 | Odds Ratio (M‐H, Random, 95% CI) | 1.16 [0.33, 4.10] |
| 4.5 Fluoxetine vs Nefazodone | 3 | 161 | Odds Ratio (M‐H, Random, 95% CI) | 0.71 [0.05, 10.71] |
| 4.6 Fluoxetine vs Pramipexole | 1 | 105 | Odds Ratio (M‐H, Random, 95% CI) | 0.49 [0.05, 4.51] |
| 4.7 Fluoxetine vs Tianeptine | 3 | 830 | Odds Ratio (M‐H, Random, 95% CI) | 0.82 [0.27, 2.53] |
| 4.8 Fluoxetine vs Trazodone | 2 | 70 | Odds Ratio (M‐H, Random, 95% CI) | 0.23 [0.04, 1.51] |
| 5 Failure to complete ‐ Side Effects Show forest plot | 17 | Odds Ratio (M‐H, Random, 95% CI) | Subtotals only | |
| 5.1 Fluoxetine vs ABT‐200 | 1 | 144 | Odds Ratio (M‐H, Random, 95% CI) | 0.08 [0.02, 0.27] |
| 5.2 Fluoxetine vs Amineptine | 2 | 232 | Odds Ratio (M‐H, Random, 95% CI) | 0.52 [0.03, 7.82] |
| 5.3 Fluoxetine vs Amisulpride | 1 | 281 | Odds Ratio (M‐H, Random, 95% CI) | 0.77 [0.33, 1.82] |
| 5.4 Fluoxetine vs Bupropion | 2 | 436 | Odds Ratio (M‐H, Random, 95% CI) | 1.01 [0.45, 2.25] |
| 5.5 Fluoxetine vs Nefazodone | 4 | 286 | Odds Ratio (M‐H, Random, 95% CI) | 0.76 [0.32, 1.81] |
| 5.6 Fluoxetine vs Pramipexole | 1 | 105 | Odds Ratio (M‐H, Random, 95% CI) | 0.06 [0.01, 0.50] |
| 5.7 Fluoxetine vs Tianeptine | 3 | 830 | Odds Ratio (M‐H, Random, 95% CI) | 1.13 [0.71, 1.80] |
| 5.8 Fluoxetine vs Trazodone | 3 | 110 | Odds Ratio (M‐H, Random, 95% CI) | 0.66 [0.20, 2.19] |
| Outcome or subgroup title | No. of studies | No. of participants | Statistical method | Effect size |
| 1 Failure to respond ‐ HDRS (‐50%) Show forest plot | 7 | Odds Ratio (M‐H, Random, 95% CI) | Subtotals only | |
| 1.1 Fluoxetine vs Crocus Sativus | 1 | 40 | Odds Ratio (M‐H, Random, 95% CI) | 0.53 [0.11, 2.60] |
| 1.2 Fluoxetine vs Hypericum | 6 | 717 | Odds Ratio (M‐H, Random, 95% CI) | 0.98 [0.55, 1.73] |
| 2 End‐point score on rating scales Show forest plot | 5 | Std. Mean Difference (IV, Random, 95% CI) | Subtotals only | |
| 2.1 Fluoxetine vs Hypericum | 5 | 648 | Std. Mean Difference (IV, Random, 95% CI) | 0.13 [‐0.02, 0.29] |
| 3 Failure to complete ‐ Total Show forest plot | 6 | Odds Ratio (M‐H, Random, 95% CI) | Subtotals only | |
| 3.1 Fluoxetine vs Crocus Sativus | 1 | 40 | Odds Ratio (M‐H, Random, 95% CI) | 1.0 [0.06, 17.18] |
| 3.2 Fluoxetine vs Hypericum | 5 | 679 | Odds Ratio (M‐H, Random, 95% CI) | 1.04 [0.58, 1.85] |
| 4 Failure to complete ‐ Inefficacy Show forest plot | 2 | Odds Ratio (M‐H, Random, 95% CI) | Subtotals only | |
| 4.1 Fluoxetine vs Hypericum | 2 | 401 | Odds Ratio (M‐H, Random, 95% CI) | 4.70 [0.22, 99.39] |
| 5 Failure to complete ‐ Side Effects Show forest plot | 5 | Odds Ratio (M‐H, Random, 95% CI) | Subtotals only | |
| 5.1 Fluoxetine vs Hypericum | 5 | 679 | Odds Ratio (M‐H, Random, 95% CI) | 1.21 [0.56, 2.64] |
| Outcome or subgroup title | No. of studies | No. of participants | Statistical method | Effect size |
| 1 follow‐up <6 weeks Show forest plot | 5 | 341 | Odds Ratio (M‐H, Random, 95% CI) | 0.67 [0.35, 1.27] |
| 1.1 Fluoxetine vs Amitriptyline | 3 | 207 | Odds Ratio (M‐H, Random, 95% CI) | 0.56 [0.19, 1.65] |
| 1.2 Fluoxetine vs Clomipramine | 1 | 94 | Odds Ratio (M‐H, Random, 95% CI) | 0.63 [0.27, 1.45] |
| 1.3 Fluoxetine vs Imipramine | 1 | 40 | Odds Ratio (M‐H, Random, 95% CI) | 1.42 [0.27, 7.34] |
| 2 follow‐up 6‐16 weeks Show forest plot | 18 | 1742 | Odds Ratio (M‐H, Random, 95% CI) | 1.02 [0.80, 1.31] |
| 2.1 Fluoxetine vs Amitriptyline | 8 | 570 | Odds Ratio (M‐H, Random, 95% CI) | 1.06 [0.75, 1.50] |
| 2.2 Fluoxetine vs Desipramine | 2 | 84 | Odds Ratio (M‐H, Random, 95% CI) | 1.70 [0.56, 5.15] |
| 2.3 Fluoxetine vs Dothiepin/dosulepin | 2 | 144 | Odds Ratio (M‐H, Random, 95% CI) | 2.13 [1.08, 4.20] |
| 2.4 Fluoxetine vs Doxepine | 1 | 40 | Odds Ratio (M‐H, Random, 95% CI) | 1.0 [0.28, 3.54] |
| 2.5 Fluoxetine vs Imipramine | 4 | 721 | Odds Ratio (M‐H, Random, 95% CI) | 0.69 [0.36, 1.34] |
| 2.6 Fluoxetine vs Lofepramine | 1 | 183 | Odds Ratio (M‐H, Random, 95% CI) | 0.99 [0.55, 1.78] |
| Outcome or subgroup title | No. of studies | No. of participants | Statistical method | Effect size |
| 1 follow‐up <6 weeks Show forest plot | 12 | 541 | Std. Mean Difference (IV, Random, 95% CI) | 0.18 [‐0.15, 0.50] |
| 1.1 Fluoxetine vs Amiptriptyline | 6 | 290 | Std. Mean Difference (IV, Random, 95% CI) | 0.39 [‐0.25, 1.02] |
| 1.2 Fluoxetine vs Clomipramine | 2 | 124 | Std. Mean Difference (IV, Random, 95% CI) | ‐0.00 [‐0.36, 0.35] |
| 1.3 Fluoxetine vs Desipramine | 1 | 26 | Std. Mean Difference (IV, Random, 95% CI) | 0.05 [‐0.72, 0.82] |
| 1.4 Fluoxetine vs Imipramine | 2 | 60 | Std. Mean Difference (IV, Random, 95% CI) | ‐0.04 [‐1.31, 1.22] |
| 1.5 Fluoxetine vs Trimipramine | 1 | 41 | Std. Mean Difference (IV, Random, 95% CI) | 0.38 [‐0.24, 1.00] |
| 2 follow‐up 6‐16 weeks Show forest plot | 36 | 2727 | Std. Mean Difference (IV, Random, 95% CI) | 0.04 [‐0.06, 0.14] |
| 2.1 Fluoxetine vs Amiptriptyline | 13 | 733 | Std. Mean Difference (IV, Random, 95% CI) | 0.07 [‐0.07, 0.22] |
| 2.2 Fluoxetine vs Clomipramine | 3 | 248 | Std. Mean Difference (IV, Random, 95% CI) | ‐0.15 [‐0.40, 0.10] |
| 2.3 Fluoxetine vs Desipramine | 3 | 121 | Std. Mean Difference (IV, Random, 95% CI) | 0.33 [‐0.47, 1.12] |
| 2.4 Fluoxetine vs Dothiepin/dosulepin | 4 | 266 | Std. Mean Difference (IV, Random, 95% CI) | 0.16 [‐0.27, 0.59] |
| 2.5 Fluoxetine vs Imipramine | 10 | 1003 | Std. Mean Difference (IV, Random, 95% CI) | ‐0.01 [‐0.21, 0.19] |
| 2.6 Fluoxetine vs Lofepramine | 1 | 183 | Std. Mean Difference (IV, Random, 95% CI) | 0.13 [‐0.16, 0.42] |
| 2.7 Fluoxetine vs Nortriptyline | 1 | 154 | Std. Mean Difference (IV, Random, 95% CI) | ‐0.12 [‐0.44, 0.20] |
| 2.8 Fluoxetine vs Trimipramine | 1 | 19 | Std. Mean Difference (IV, Random, 95% CI) | 0.47 [‐0.44, 1.39] |
| 3 follow‐up >16 weeks Show forest plot | 1 | 97 | Std. Mean Difference (IV, Random, 95% CI) | ‐0.86 [‐1.27, ‐0.44] |
| 3.1 Fluoxetine vs Nortriptyline | 1 | 97 | Std. Mean Difference (IV, Random, 95% CI) | ‐0.86 [‐1.27, ‐0.44] |
| Outcome or subgroup title | No. of studies | No. of participants | Statistical method | Effect size |
| 1 follow‐up <6 weeks Show forest plot | 11 | 663 | Odds Ratio (M‐H, Random, 95% CI) | 0.70 [0.47, 1.05] |
| 1.1 Fluoxetine vs Amitriptyline | 6 | 309 | Odds Ratio (M‐H, Random, 95% CI) | 0.57 [0.29, 1.13] |
| 1.2 Fluoxetine vs Doxepine | 1 | 51 | Odds Ratio (M‐H, Random, 95% CI) | 1.25 [0.29, 5.31] |
| 1.3 Fluoxetine vs Imipramine | 3 | 98 | Odds Ratio (M‐H, Random, 95% CI) | 0.56 [0.10, 3.13] |
| 1.4 Fluoxetine vs Nortriptyline | 1 | 205 | Odds Ratio (M‐H, Random, 95% CI) | 0.77 [0.44, 1.35] |
| 2 follow‐up 6‐16 weeks Show forest plot | 36 | 3450 | Odds Ratio (M‐H, Random, 95% CI) | 0.79 [0.63, 0.98] |
| 2.1 Fluoxetine vs Amitriptyline | 12 | 780 | Odds Ratio (M‐H, Random, 95% CI) | 0.63 [0.44, 0.90] |
| 2.2 Fluoxetine vs Clomipramine | 2 | 263 | Odds Ratio (M‐H, Random, 95% CI) | 0.65 [0.38, 1.14] |
| 2.3 Fluoxetine vs Desipramine | 2 | 104 | Odds Ratio (M‐H, Random, 95% CI) | 0.44 [0.16, 1.24] |
| 2.4 Fluoxetine vs Dothiepin/dosulepin | 5 | 478 | Odds Ratio (M‐H, Random, 95% CI) | 1.57 [0.92, 2.69] |
| 2.5 Fluoxetine vs Doxepine | 3 | 272 | Odds Ratio (M‐H, Random, 95% CI) | 0.78 [0.44, 1.40] |
| 2.6 Fluoxetine vs Imipramine | 9 | 1127 | Odds Ratio (M‐H, Random, 95% CI) | 0.81 [0.51, 1.27] |
| 2.7 Fluoxetine vs Lofepramine | 1 | 183 | Odds Ratio (M‐H, Random, 95% CI) | 0.50 [0.24, 1.04] |
| 2.8 Fluoxetine vs Nortriptyline | 2 | 243 | Odds Ratio (M‐H, Random, 95% CI) | 0.82 [0.17, 3.93] |
| Outcome or subgroup title | No. of studies | No. of participants | Statistical method | Effect size |
| 1 follow‐up <6 weeks Show forest plot | 5 | 401 | Odds Ratio (M‐H, Random, 95% CI) | 0.49 [0.16, 1.50] |
| 1.1 Fluoxetine vs Amitriptyline | 2 | 105 | Odds Ratio (M‐H, Random, 95% CI) | 0.38 [0.07, 2.09] |
| 1.2 Fluoxetine vs Doxepine | 1 | 51 | Odds Ratio (M‐H, Random, 95% CI) | 0.0 [0.0, 0.0] |
| 1.3 Fluoxetine vs Imipramine | 1 | 40 | Odds Ratio (M‐H, Random, 95% CI) | 3.15 [0.12, 82.16] |
| 1.4 Fluoxetine vs Nortriptyiline | 1 | 205 | Odds Ratio (M‐H, Random, 95% CI) | 0.38 [0.07, 2.03] |
| 2 follow‐up 6‐16 weeks Show forest plot | 28 | 2510 | Odds Ratio (M‐H, Random, 95% CI) | 1.38 [1.02, 1.87] |
| 2.1 Fluoxetine vs Amitriptyline | 11 | 730 | Odds Ratio (M‐H, Random, 95% CI) | 1.11 [0.50, 2.47] |
| 2.2 Fluoxetine vs Clomipramine | 1 | 120 | Odds Ratio (M‐H, Random, 95% CI) | 7.37 [0.37, 145.75] |
| 2.3 Fluoxetine vs Desipramine | 2 | 104 | Odds Ratio (M‐H, Random, 95% CI) | 1.03 [0.20, 5.35] |
| 2.4 Fluoxetine vs Dothiepin/dosulepin | 3 | 271 | Odds Ratio (M‐H, Random, 95% CI) | 1.34 [0.49, 3.66] |
| 2.5 Fluoxetine vs Doxepine | 2 | 232 | Odds Ratio (M‐H, Random, 95% CI) | 1.72 [0.60, 4.92] |
| 2.6 Fluoxetine vs Imipramine | 9 | 1053 | Odds Ratio (M‐H, Random, 95% CI) | 1.40 [0.96, 2.04] |
| Outcome or subgroup title | No. of studies | No. of participants | Statistical method | Effect size |
| 1 follow‐up <6 weeks Show forest plot | 7 | 554 | Odds Ratio (M‐H, Random, 95% CI) | 0.81 [0.46, 1.43] |
| 1.1 Fluoxetine vs Amitriptyline | 4 | 258 | Odds Ratio (M‐H, Random, 95% CI) | 0.62 [0.21, 1.82] |
| 1.2 Fluoxetine vs Doxepine | 1 | 51 | Odds Ratio (M‐H, Random, 95% CI) | 3.13 [0.30, 32.31] |
| 1.3 Fluoxetine vs Imipramine | 1 | 40 | Odds Ratio (M‐H, Random, 95% CI) | 0.63 [0.09, 4.24] |
| 1.4 Fluoxetine vs Nortriptyline | 1 | 205 | Odds Ratio (M‐H, Random, 95% CI) | 0.86 [0.42, 1.77] |
| 2 follow‐up 6‐16 weeks Show forest plot | 33 | 3093 | Odds Ratio (M‐H, Random, 95% CI) | 0.51 [0.36, 0.72] |
| 2.1 Fluoxetine vs Amitriptyline | 12 | 780 | Odds Ratio (M‐H, Random, 95% CI) | 0.33 [0.18, 0.61] |
| 2.2 Fluoxetine vs Clomipramine | 2 | 263 | Odds Ratio (M‐H, Random, 95% CI) | 0.30 [0.12, 0.79] |
| 2.3 Fluoxetine vs Desipramine | 2 | 104 | Odds Ratio (M‐H, Random, 95% CI) | 0.27 [0.04, 1.68] |
| 2.4 Fluoxetine vs Dothiepin/dosulepin | 5 | 478 | Odds Ratio (M‐H, Random, 95% CI) | 2.05 [0.59, 7.16] |
| 2.5 Fluoxetine vs Doxepine | 2 | 232 | Odds Ratio (M‐H, Random, 95% CI) | 0.73 [0.42, 1.28] |
| 2.6 Fluoxetine vs Imipramine | 9 | 1053 | Odds Ratio (M‐H, Random, 95% CI) | 0.47 [0.25, 0.87] |
| 2.7 Fluoxetine vs Lofepramine | 1 | 183 | Odds Ratio (M‐H, Random, 95% CI) | 0.16 [0.02, 1.38] |
| Outcome or subgroup title | No. of studies | No. of participants | Statistical method | Effect size |
| 1 follow‐up <6 weeks Show forest plot | 2 | Std. Mean Difference (IV, Random, 95% CI) | Subtotals only | |
| 1.1 Fluoxetine vs Maprotiline | 2 | 181 | Std. Mean Difference (IV, Random, 95% CI) | 0.06 [‐0.34, 0.46] |
| 2 follow‐up 6‐16 weeks Show forest plot | 6 | Std. Mean Difference (IV, Random, 95% CI) | Subtotals only | |
| 2.1 Fluoxetine vs Maprotiline | 3 | 252 | Std. Mean Difference (IV, Random, 95% CI) | 0.05 [‐0.20, 0.30] |
| 2.2 Fluoxetine vs Mianserin | 3 | 128 | Std. Mean Difference (IV, Random, 95% CI) | 0.43 [‐0.38, 1.23] |
| Outcome or subgroup title | No. of studies | No. of participants | Statistical method | Effect size |
| 1 follow‐up <6 weeks Show forest plot | 2 | Odds Ratio (M‐H, Random, 95% CI) | Subtotals only | |
| 1.1 Fluoxetine vs Maprotiline | 2 | 188 | Odds Ratio (M‐H, Random, 95% CI) | 1.54 [0.63, 3.75] |
| 2 follow‐up 6‐16 weeks Show forest plot | 4 | Odds Ratio (M‐H, Random, 95% CI) | Subtotals only | |
| 2.1 Fluoxetine vs Maprotiline | 2 | 163 | Odds Ratio (M‐H, Random, 95% CI) | 2.06 [0.75, 5.63] |
| 2.2 Fluoxetine vs Mianserin | 2 | 93 | Odds Ratio (M‐H, Random, 95% CI) | 0.63 [0.18, 2.25] |
| Outcome or subgroup title | No. of studies | No. of participants | Statistical method | Effect size |
| 1 follow‐up <6 weeks Show forest plot | 1 | Odds Ratio (M‐H, Random, 95% CI) | Subtotals only | |
| 1.1 Fluoxetine vs Maprotiline | 1 | 46 | Odds Ratio (M‐H, Random, 95% CI) | 0.0 [0.0, 0.0] |
| 2 follow‐up 6‐16 weeks Show forest plot | 3 | Odds Ratio (M‐H, Random, 95% CI) | Subtotals only | |
| 2.1 Fluoxetine vs Maprotiline | 2 | 163 | Odds Ratio (M‐H, Random, 95% CI) | 2.54 [0.33, 19.19] |
| 2.2 Fluoxetine vs Mianserin | 1 | 53 | Odds Ratio (M‐H, Random, 95% CI) | 2.27 [0.38, 13.63] |
| Outcome or subgroup title | No. of studies | No. of participants | Statistical method | Effect size |
| 1 follow‐up <6 weeks Show forest plot | 1 | Odds Ratio (M‐H, Random, 95% CI) | Subtotals only | |
| 1.1 Fluoxetine vs Maprotiline | 1 | 46 | Odds Ratio (M‐H, Random, 95% CI) | 0.41 [0.07, 2.49] |
| 2 follow‐up 6‐16 weeks Show forest plot | 3 | Odds Ratio (M‐H, Random, 95% CI) | Subtotals only | |
| 2.1 Fluoxetine vs Maprotiline | 2 | 163 | Odds Ratio (M‐H, Random, 95% CI) | 0.69 [0.11, 4.38] |
| 2.2 Fluoxetine vs Mianserin | 1 | 53 | Odds Ratio (M‐H, Random, 95% CI) | 1.05 [0.23, 4.70] |
| Outcome or subgroup title | No. of studies | No. of participants | Statistical method | Effect size |
| 1 follow‐up <6 weeks Show forest plot | 1 | Odds Ratio (M‐H, Random, 95% CI) | Subtotals only | |
| 1.1 Fluoxetine vs Citalopram | 1 | 59 | Odds Ratio (M‐H, Random, 95% CI) | 0.60 [0.20, 1.79] |
| 2 follow‐up 6‐16 weeks Show forest plot | 15 | Odds Ratio (M‐H, Random, 95% CI) | Subtotals only | |
| 2.1 Fluoxetine vs Fluvoxamine | 1 | 177 | Odds Ratio (M‐H, Random, 95% CI) | 0.95 [0.52, 1.74] |
| 2.2 Fluoxetine vs Paroxetine | 9 | 1574 | Odds Ratio (M‐H, Random, 95% CI) | 1.23 [0.93, 1.65] |
| 2.3 Fluoxetine vs Sertraline | 5 | 950 | Odds Ratio (M‐H, Random, 95% CI) | 1.31 [1.00, 1.71] |
| 2.4 Fluoxetine vs Escitalopram | 1 | 240 | Odds Ratio (M‐H, Random, 95% CI) | 1.02 [0.56, 1.85] |
| 3 follow‐up >16 weeks Show forest plot | 1 | Odds Ratio (M‐H, Random, 95% CI) | Subtotals only | |
| 3.1 Fluoxetine vs Sertraline | 1 | 238 | Odds Ratio (M‐H, Random, 95% CI) | 1.67 [0.97, 2.85] |
| Outcome or subgroup title | No. of studies | No. of participants | Statistical method | Effect size |
| 1 follow‐up <6 weeks Show forest plot | 1 | Std. Mean Difference (IV, Random, 95% CI) | Subtotals only | |
| 1.1 Fluoxetine vs Citalopram | 1 | 51 | Std. Mean Difference (IV, Random, 95% CI) | 0.07 [‐0.48, 0.61] |
| 2 follow‐up >16 weeks Show forest plot | 2 | Std. Mean Difference (IV, Random, 95% CI) | Subtotals only | |
| 2.1 Fluoxetine vs Paroxetine | 1 | 242 | Std. Mean Difference (IV, Random, 95% CI) | 0.24 [‐0.01, 0.49] |
| 2.2 Fluoxetine vs Sertraline | 1 | 168 | Std. Mean Difference (IV, Random, 95% CI) | 0.22 [‐0.08, 0.53] |
| 3 follow‐up 6‐16 weeks Show forest plot | 18 | Std. Mean Difference (IV, Random, 95% CI) | Subtotals only | |
| 3.1 Fluoxetine vs Citalopram | 2 | 610 | Std. Mean Difference (IV, Random, 95% CI) | 0.05 [‐0.10, 0.21] |
| 3.2 Fluoxetine vs Paroxetine | 10 | 1819 | Std. Mean Difference (IV, Random, 95% CI) | ‐0.03 [‐0.31, 0.24] |
| 3.3 Fluoxetine vs Sertraline | 6 | 992 | Std. Mean Difference (IV, Random, 95% CI) | 0.06 [‐0.06, 0.19] |
| 3.4 Fluoxetine vs Escitalopram | 1 | 231 | Std. Mean Difference (IV, Random, 95% CI) | 0.07 [‐0.19, 0.33] |
| Outcome or subgroup title | No. of studies | No. of participants | Statistical method | Effect size |
| 1 follow‐up <6 weeks Show forest plot | 1 | Odds Ratio (M‐H, Random, 95% CI) | Subtotals only | |
| 1.1 Fluoxetine vs Citalopram | 1 | 59 | Odds Ratio (M‐H, Random, 95% CI) | 0.96 [0.22, 4.27] |
| 2 follow‐up 6‐16 weeks Show forest plot | 21 | Odds Ratio (M‐H, Random, 95% CI) | Subtotals only | |
| 2.1 Fluoxetine vs Citalopram | 2 | 673 | Odds Ratio (M‐H, Random, 95% CI) | 0.87 [0.59, 1.27] |
| 2.2 Fluoxetine vs Fluvoxamine | 2 | 284 | Odds Ratio (M‐H, Random, 95% CI) | 0.71 [0.36, 1.37] |
| 2.3 Fluoxetine vs Paroxetine | 9 | 1606 | Odds Ratio (M‐H, Random, 95% CI) | 1.00 [0.81, 1.25] |
| 2.4 Fluoxetine vs Sertraline | 7 | 1111 | Odds Ratio (M‐H, Random, 95% CI) | 1.12 [0.85, 1.48] |
| 2.5 Fluoxetine vs Escitalopram | 2 | 578 | Odds Ratio (M‐H, Random, 95% CI) | 1.53 [1.00, 2.37] |
| 3 follow‐up >16 weeks Show forest plot | 3 | Odds Ratio (M‐H, Random, 95% CI) | Subtotals only | |
| 3.1 Fluoxetine vs Paroxetine | 1 | 242 | Odds Ratio (M‐H, Random, 95% CI) | 0.89 [0.53, 1.49] |
| 3.2 Fluoxetine vs Sertraline | 2 | 480 | Odds Ratio (M‐H, Random, 95% CI) | 1.33 [0.84, 2.09] |
| Outcome or subgroup title | No. of studies | No. of participants | Statistical method | Effect size |
| 1 follow‐up <6 weeks Show forest plot | 1 | Odds Ratio (M‐H, Random, 95% CI) | Subtotals only | |
| 1.1 Fluoxetine vs Citalopram | 1 | 59 | Odds Ratio (M‐H, Random, 95% CI) | 0.47 [0.04, 5.43] |
| 2 follow‐up >16 weeks Show forest plot | 1 | Odds Ratio (M‐H, Random, 95% CI) | Subtotals only | |
| 2.1 Fluoxetine vs Sertraline | 1 | 238 | Odds Ratio (M‐H, Random, 95% CI) | 0.98 [0.47, 2.07] |
| 3 follow‐up 6‐16 weeks Show forest plot | 11 | Odds Ratio (M‐H, Random, 95% CI) | Subtotals only | |
| 3.1 Fluoxetine vs Citalopram | 2 | 673 | Odds Ratio (M‐H, Random, 95% CI) | 0.90 [0.49, 1.65] |
| 3.2 Fluoxetine vs Paroxetine | 4 | 1005 | Odds Ratio (M‐H, Random, 95% CI) | 0.75 [0.41, 1.39] |
| 3.3 Fluoxetine vs Sertraline | 4 | 818 | Odds Ratio (M‐H, Random, 95% CI) | 1.18 [0.61, 2.29] |
| 3.4 Fluoxetine vs Escitalopram | 2 | 578 | Odds Ratio (M‐H, Random, 95% CI) | 1.74 [0.46, 6.53] |
| Outcome or subgroup title | No. of studies | No. of participants | Statistical method | Effect size |
| 1 follow‐up <6 weeks Show forest plot | 1 | Odds Ratio (M‐H, Random, 95% CI) | Subtotals only | |
| 1.1 Fluoxetine vs Citalopram | 1 | 59 | Odds Ratio (M‐H, Random, 95% CI) | 1.5 [0.23, 9.70] |
| 2 follow‐up 6‐16 weeks Show forest plot | 20 | Odds Ratio (M‐H, Random, 95% CI) | Subtotals only | |
| 2.1 Fluoxetine vs Citalopram | 2 | 673 | Odds Ratio (M‐H, Random, 95% CI) | 0.57 [0.29, 1.12] |
| 2.2 Fluoxetine vs Fluvoxamine | 1 | 100 | Odds Ratio (M‐H, Random, 95% CI) | 1.04 [0.14, 7.71] |
| 2.3 Fluoxetine vs Paroxetine | 9 | 1509 | Odds Ratio (M‐H, Random, 95% CI) | 0.85 [0.62, 1.16] |
| 2.4 Fluoxetine vs Sertraline | 7 | 1111 | Odds Ratio (M‐H, Random, 95% CI) | 1.21 [0.85, 1.71] |
| 2.5 Fluoxetina vs Escitalopram | 2 | 578 | Odds Ratio (M‐H, Random, 95% CI) | 1.17 [0.64, 2.12] |
| 3 follow‐up >16 weeks Show forest plot | 2 | Odds Ratio (M‐H, Random, 95% CI) | Subtotals only | |
| 3.1 Fluoxetine vs Sertraline | 2 | 480 | Odds Ratio (M‐H, Random, 95% CI) | 1.41 [0.72, 2.76] |
| Outcome or subgroup title | No. of studies | No. of participants | Statistical method | Effect size |
| 1 follow‐up <6 weeks Show forest plot | 1 | Odds Ratio (M‐H, Random, 95% CI) | Subtotals only | |
| 1.1 Fluoxetine vs Moclobemide | 1 | 70 | Odds Ratio (M‐H, Random, 95% CI) | 1.01 [0.39, 2.60] |
| 2 follow‐up 6‐16 weeks Show forest plot | 15 | Odds Ratio (M‐H, Random, 95% CI) | Subtotals only | |
| 2.1 Fluoxetine vs Agomelatine | 1 | 515 | Odds Ratio (M‐H, Random, 95% CI) | 1.44 [0.99, 2.09] |
| 2.2 Fluoxetine vs Mirtazapine | 4 | 600 | Odds Ratio (M‐H, Random, 95% CI) | 1.46 [1.04, 2.04] |
| 2.3 Fluoxetine vs Moclobemide | 6 | 651 | Odds Ratio (M‐H, Random, 95% CI) | 1.31 [0.90, 1.89] |
| 2.4 Fluoxetine vs Phenelzine | 1 | 40 | Odds Ratio (M‐H, Random, 95% CI) | 1.42 [0.27, 7.34] |
| 2.5 Fluoxetine vs Reboxetine | 3 | 721 | Odds Ratio (M‐H, Random, 95% CI) | 0.77 [0.55, 1.10] |
| Outcome or subgroup title | No. of studies | No. of participants | Statistical method | Effect size |
| 1 follow‐up <6 weeks Show forest plot | 1 | Std. Mean Difference (IV, Random, 95% CI) | Subtotals only | |
| 1.1 Fluoxetine vs Moclobemide | 1 | 53 | Std. Mean Difference (IV, Random, 95% CI) | ‐0.12 [‐0.66, 0.42] |
| 2 follow‐up 6‐16 weeks Show forest plot | 12 | Std. Mean Difference (IV, Random, 95% CI) | Subtotals only | |
| 2.1 Fluoxetine vs Agomelatine | 3 | 1213 | Std. Mean Difference (IV, Random, 95% CI) | 0.02 [‐0.18, 0.23] |
| 2.2 Fluoxetine vs Mirtazapine | 1 | 31 | Std. Mean Difference (IV, Random, 95% CI) | 0.57 [‐0.15, 1.29] |
| 2.3 Fluoxetine vs Moclobemide | 5 | 487 | Std. Mean Difference (IV, Random, 95% CI) | 0.16 [‐0.02, 0.33] |
| 2.4 Fluoxetine vs Phenelzine | 1 | 40 | Std. Mean Difference (IV, Random, 95% CI) | ‐0.05 [‐0.67, 0.57] |
| 2.5 Fluoxetine vs Reboxetine | 2 | 205 | Std. Mean Difference (IV, Random, 95% CI) | 0.04 [‐0.31, 0.40] |
| Outcome or subgroup title | No. of studies | No. of participants | Statistical method | Effect size |
| 1 follow‐up <6 weeks Show forest plot | 1 | Odds Ratio (M‐H, Random, 95% CI) | Subtotals only | |
| 1.1 Fluoxetine vs Moclobemide | 1 | 70 | Odds Ratio (M‐H, Random, 95% CI) | 0.92 [0.31, 2.76] |
| 2 follow‐up 6‐16 weeks Show forest plot | 15 | Odds Ratio (M‐H, Random, 95% CI) | Subtotals only | |
| 2.1 Fluoxetina vs Agomelatine | 2 | 785 | Odds Ratio (M‐H, Random, 95% CI) | 1.22 [0.59, 2.49] |
| 2.2 Fluoxetine vs Mirtazapine | 3 | 301 | Odds Ratio (M‐H, Random, 95% CI) | 0.92 [0.51, 1.68] |
| 2.3 Fluoxetine vs Moclobemide | 6 | 651 | Odds Ratio (M‐H, Random, 95% CI) | 1.02 [0.68, 1.53] |
| 2.4 Fluoxetine vs Reboxetine | 4 | 764 | Odds Ratio (M‐H, Random, 95% CI) | 0.60 [0.44, 0.83] |
| Outcome or subgroup title | No. of studies | No. of participants | Statistical method | Effect size |
| 1 follow‐up <6 weeks Show forest plot | 1 | Odds Ratio (M‐H, Random, 95% CI) | Subtotals only | |
| 1.1 Fluoxetine vs Moclobemide | 1 | 70 | Odds Ratio (M‐H, Random, 95% CI) | 1.06 [0.20, 5.68] |
| 2 follow‐up 6‐16 weeks Show forest plot | 15 | Odds Ratio (M‐H, Random, 95% CI) | Subtotals only | |
| 2.1 Fluoxetine vs Agomelatine | 2 | 785 | Odds Ratio (M‐H, Random, 95% CI) | 1.08 [0.41, 2.88] |
| 2.2 Fluoxetine vs Mirtazapine | 4 | 600 | Odds Ratio (M‐H, Random, 95% CI) | 1.45 [0.71, 2.96] |
| 2.3 Fluoxetine vs Moclobemide | 5 | 609 | Odds Ratio (M‐H, Random, 95% CI) | 0.61 [0.23, 1.65] |
| 2.4 Fluoxetine vs Phenelzine | 1 | 40 | Odds Ratio (M‐H, Random, 95% CI) | 0.0 [0.0, 0.0] |
| 2.5 Fluoxetine vs Reboxetine | 3 | 464 | Odds Ratio (M‐H, Random, 95% CI) | 0.92 [0.47, 1.77] |
| Outcome or subgroup title | No. of studies | No. of participants | Statistical method | Effect size |
| 1 follow‐up <6 weeks Show forest plot | 1 | Odds Ratio (M‐H, Random, 95% CI) | Subtotals only | |
| 1.1 Fluoxetine vs Moclobemide | 1 | 70 | Odds Ratio (M‐H, Random, 95% CI) | 0.0 [0.0, 0.0] |
| 2 follow‐up 6‐16 weeks Show forest plot | 15 | Odds Ratio (M‐H, Random, 95% CI) | Subtotals only | |
| 2.1 Fluoxetine vs Agomelatine | 2 | 785 | Odds Ratio (M‐H, Random, 95% CI) | 1.50 [0.73, 3.08] |
| 2.2 Fluoxetine vs Mirtazapine | 4 | 600 | Odds Ratio (M‐H, Random, 95% CI) | 0.95 [0.54, 1.66] |
| 2.3 Fluoxetine vs Moclobemide | 6 | 651 | Odds Ratio (M‐H, Random, 95% CI) | 1.04 [0.54, 2.01] |
| 2.4 Fluoxetine vs Phenelzine | 1 | 40 | Odds Ratio (M‐H, Random, 95% CI) | 0.32 [0.01, 8.26] |
| 2.5 Fluoxetine vs Reboxetine | 2 | 211 | Odds Ratio (M‐H, Random, 95% CI) | 0.40 [0.10, 1.61] |