Fluoxetine versus other types of pharmacotherapy for depression
Information
- DOI:
- https://doi.org/10.1002/14651858.CD004185.pub3Copy DOI

- Database:
-
- Cochrane Database of Systematic Reviews
- Version published:
-
- 17 July 2013see what's new
- Type:
-
- Intervention
- Stage:
-
- Review
- Cochrane Editorial Group:
-
Cochrane Common Mental Disorders Group
- Copyright:
-
- Copyright © 2013 The Cochrane Collaboration. Published by John Wiley & Sons, Ltd.
Article metrics
Altmetric:
Cited by:
Authors
Contributions of authors
LRM, CG, MP collected the data; LRM, MP, AC and CB ran the analysis; LRM, CG, MP, DP, TAF, AC and CB drafted and critically revised the manuscript.
Sources of support
Internal sources
-
Department of Public Health and Community Medicine, Section of Psychiatry, University of Verona, Italy.
-
Department of Psychiatry, University of Oxford, UK.
External sources
-
No sources of support supplied
Declarations of interest
LRM, CG, MP, DP, AC, CB: none declared.
TAF has received honoraria for speaking at continuing medical education (CME) meetings sponsored by Asahi Kasei, Eli Lilly, GlaxoSmithKline, Mochida, MSD, Otsuka, Pfizer, Shionogi and Tanabe‐Mitsubishi. He is a diplomate of the Academy of Cognitive Therapy. He has received royalties from Igaku‐Shoin, Seiwa‐Shoten and Nihon Bunka Kagakusha. He is on the advisory board for Sekisui Chemicals and Takeda Science Foundation. The Japanese Ministry of Education, Science, and Technology; the Japanese Ministry of Health, Labor and Welfare; and the Japan Foundation for Neuroscience and Mental Health have funded his research projects.
Acknowledgements
We would like to thank the CCDAN Editorial Team for their support, information and advice. We also would like to thank authors that provided additional data to be used in the present report (Professor Yusuf Moosa, Professor Homayoun Amini).
CRG funding acknowledgement
The National Institute for Health Research (NIHR) is the largest single funder of the Cochrane Depression, Anxiety and Neurosis Group.
Disclaimer
The views and opinions expressed herein are those of the authors and do not necessarily reflect those of the NIHR, NHS or the Department of Health.
Version history
| Published | Title | Stage | Authors | Version |
| 2013 Jul 17 | Fluoxetine versus other types of pharmacotherapy for depression | Review | Laura R Magni, Marianna Purgato, Chiara Gastaldon, Davide Papola, Toshi A Furukawa, Andrea Cipriani, Corrado Barbui | |
| 2005 Oct 19 | Fluoxetine versus other types of pharmacotherapy for depression | Review | Andrea Cipriani, Paulo Brambilla, Toshi A Furukawa, John Geddes, Manuela Gregis, Matthew Hotopf, Lara Malvini, Corrado Barbui | |
| 2003 Apr 22 | Fluoxetine versus other types of pharmacotherapy for depression | Protocol | Andrea Cipriani, P Brambilla, Corrado Barbui, Matthew Hotopf, B Brambilla | |
Differences between protocol and review
In this update of the review we applied the risk of bias tool to assess the quality of all included studies. However, a formal comparison of intervention effects according to risk of bias was not performed as for most studies the risk of bias was rated as unclear.
A dosage subgroup analysis was not performed as this can be more appropriately examined in a MTM meta‐analysis (see discussion).
Summary of findings tables using the GRADE methodology were added.
Keywords
MeSH
Medical Subject Headings (MeSH) Keywords
- Antidepressive Agents [therapeutic use];
- Antidepressive Agents, Second-Generation [*therapeutic use];
- Antidepressive Agents, Tricyclic [therapeutic use];
- Depression [*drug therapy];
- Fluoxetine [*therapeutic use];
- Randomized Controlled Trials as Topic;
- Selective Serotonin Reuptake Inhibitors [*therapeutic use];
Medical Subject Headings Check Words
Humans;

Study flow diagram, 2005 version.

Study flow diagram, 2012 version.
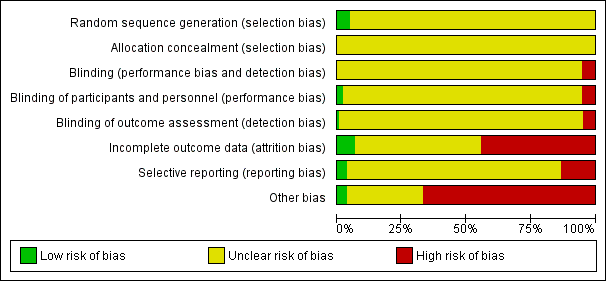
Risk of bias graph: review authors' judgements about each risk of bias item presented as percentages across all included studies.

Risk of bias summary: review authors' judgements about each risk of bias item for each included study.

Comparison 1 Fluoxetine versus TCAs, Outcome 1 Failure to respond ‐ HDRS (‐50%).

Comparison 1 Fluoxetine versus TCAs, Outcome 2 End‐point score on rating scale.

Comparison 1 Fluoxetine versus TCAs, Outcome 3 Failure to complete ‐ Total.

Comparison 1 Fluoxetine versus TCAs, Outcome 4 Failure to complete ‐ Inefficacy.

Comparison 1 Fluoxetine versus TCAs, Outcome 5 Failure to complete ‐ Side Effects.

Comparison 2 Fluoxetine versus heterocyclics, Outcome 1 Failure to respond ‐ HDRS (‐50%).

Comparison 2 Fluoxetine versus heterocyclics, Outcome 2 End‐point score on rating scale.

Comparison 2 Fluoxetine versus heterocyclics, Outcome 3 Failure to complete ‐ Total.

Comparison 2 Fluoxetine versus heterocyclics, Outcome 4 Failure to complete ‐ Inefficacy.

Comparison 2 Fluoxetine versus heterocyclics, Outcome 5 Failure to complete ‐ Side Effects.

Comparison 3 Fluoxetine versus other SSRIs, Outcome 1 Failure to respond ‐ HDRS (‐50%).

Comparison 3 Fluoxetine versus other SSRIs, Outcome 2 End‐point score on rating scales.

Comparison 3 Fluoxetine versus other SSRIs, Outcome 3 Failure to complete ‐ Total.

Comparison 3 Fluoxetine versus other SSRIs, Outcome 4 Failure to complete ‐ Inefficacy.

Comparison 3 Fluoxetine versus other SSRIs, Outcome 5 Failure to complete ‐ Side Effects.

Comparison 4 Fluoxetine versus SNRIs, Outcome 1 Failure to respond ‐ HDRS (‐50%).

Comparison 4 Fluoxetine versus SNRIs, Outcome 2 End‐point score on rating scale.

Comparison 4 Fluoxetine versus SNRIs, Outcome 3 Failure to complete ‐ Total.

Comparison 4 Fluoxetine versus SNRIs, Outcome 4 Failure to complete ‐ Inefficacy.

Comparison 4 Fluoxetine versus SNRIs, Outcome 5 Failure to complete ‐ Side Effects.

Comparison 5 Fluoxetine versus MAOIs or newer ADs, Outcome 1 Failure to respond ‐ HDRS (‐50%).

Comparison 5 Fluoxetine versus MAOIs or newer ADs, Outcome 2 End‐point score on rating scales.

Comparison 5 Fluoxetine versus MAOIs or newer ADs, Outcome 3 Failure to complete ‐ Total.

Comparison 5 Fluoxetine versus MAOIs or newer ADs, Outcome 4 Failure to complete ‐ Inefficacy.

Comparison 5 Fluoxetine versus MAOIs or newer ADs, Outcome 5 Failure to complete ‐ Side Effects.

Comparison 6 Fluoxetine versus other conventional psychotropic drugs, Outcome 1 Failure to respond ‐ HDRS (‐50%).

Comparison 6 Fluoxetine versus other conventional psychotropic drugs, Outcome 2 End‐point score on rating scales.

Comparison 6 Fluoxetine versus other conventional psychotropic drugs, Outcome 3 Failure to complete ‐ Total.

Comparison 6 Fluoxetine versus other conventional psychotropic drugs, Outcome 4 Failure to complete ‐ Inefficacy.

Comparison 6 Fluoxetine versus other conventional psychotropic drugs, Outcome 5 Failure to complete ‐ Side Effects.

Comparison 7 Fluoxetine versus other non‐conventional AD agents, Outcome 1 Failure to respond ‐ HDRS (‐50%).

Comparison 7 Fluoxetine versus other non‐conventional AD agents, Outcome 2 End‐point score on rating scales.

Comparison 7 Fluoxetine versus other non‐conventional AD agents, Outcome 3 Failure to complete ‐ Total.

Comparison 7 Fluoxetine versus other non‐conventional AD agents, Outcome 4 Failure to complete ‐ Inefficacy.

Comparison 7 Fluoxetine versus other non‐conventional AD agents, Outcome 5 Failure to complete ‐ Side Effects.

Comparison 8 Subgroup analysis for fluoxetine versus TCAs: failure to respond, Outcome 1 follow‐up <6 weeks.

Comparison 8 Subgroup analysis for fluoxetine versus TCAs: failure to respond, Outcome 2 follow‐up 6‐16 weeks.

Comparison 9 Subgroup analysis for fluoxetine versus TCAs: endpoint score, Outcome 1 follow‐up <6 weeks.

Comparison 9 Subgroup analysis for fluoxetine versus TCAs: endpoint score, Outcome 2 follow‐up 6‐16 weeks.

Comparison 9 Subgroup analysis for fluoxetine versus TCAs: endpoint score, Outcome 3 follow‐up >16 weeks.

Comparison 10 Subgroup analysis for fluoxetine versus TCAs: failure to complete ‐ total, Outcome 1 follow‐up <6 weeks.

Comparison 10 Subgroup analysis for fluoxetine versus TCAs: failure to complete ‐ total, Outcome 2 follow‐up 6‐16 weeks.

Comparison 11 Subgroup analysis for fluoxetine versus TCAs: failure to complete ‐ inefficacy, Outcome 1 follow‐up <6 weeks.

Comparison 11 Subgroup analysis for fluoxetine versus TCAs: failure to complete ‐ inefficacy, Outcome 2 follow‐up 6‐16 weeks.

Comparison 12 Subgroup analysis for fluoxetine versus TCAs: failure to complete ‐ side effects, Outcome 1 follow‐up <6 weeks.

Comparison 12 Subgroup analysis for fluoxetine versus TCAs: failure to complete ‐ side effects, Outcome 2 follow‐up 6‐16 weeks.

Comparison 13 Subgroup analysis for fluoxetine versus heterocyclics: endpoint score, Outcome 1 follow‐up <6 weeks.

Comparison 13 Subgroup analysis for fluoxetine versus heterocyclics: endpoint score, Outcome 2 follow‐up 6‐16 weeks.

Comparison 14 Subgroup analysis for fluoxetine versus heterocyclics: failure to complete ‐ total, Outcome 1 follow‐up <6 weeks.

Comparison 14 Subgroup analysis for fluoxetine versus heterocyclics: failure to complete ‐ total, Outcome 2 follow‐up 6‐16 weeks.

Comparison 15 Subgroup analysis for fluoxetine versus heterocyclics: failure to complete ‐ inefficacy, Outcome 1 follow‐up <6 weeks.

Comparison 15 Subgroup analysis for fluoxetine versus heterocyclics: failure to complete ‐ inefficacy, Outcome 2 follow‐up 6‐16 weeks.

Comparison 16 Subgroup analysis for fluoxetine versus heterocyclics: failure to complete ‐ side effects, Outcome 1 follow‐up <6 weeks.

Comparison 16 Subgroup analysis for fluoxetine versus heterocyclics: failure to complete ‐ side effects, Outcome 2 follow‐up 6‐16 weeks.

Comparison 17 Subgroup analysis for fluoxetine versus other SSRIs: failure to respond, Outcome 1 follow‐up <6 weeks.

Comparison 17 Subgroup analysis for fluoxetine versus other SSRIs: failure to respond, Outcome 2 follow‐up 6‐16 weeks.

Comparison 17 Subgroup analysis for fluoxetine versus other SSRIs: failure to respond, Outcome 3 follow‐up >16 weeks.

Comparison 18 Subgroup analysis for fluoxetine versus other SSRIs: endpoint score, Outcome 1 follow‐up <6 weeks.

Comparison 18 Subgroup analysis for fluoxetine versus other SSRIs: endpoint score, Outcome 2 follow‐up >16 weeks.

Comparison 18 Subgroup analysis for fluoxetine versus other SSRIs: endpoint score, Outcome 3 follow‐up 6‐16 weeks.

Comparison 19 Subgroup analysis for fluoxetine versus other SSRIs: failure to complete ‐ total, Outcome 1 follow‐up <6 weeks.

Comparison 19 Subgroup analysis for fluoxetine versus other SSRIs: failure to complete ‐ total, Outcome 2 follow‐up 6‐16 weeks.

Comparison 19 Subgroup analysis for fluoxetine versus other SSRIs: failure to complete ‐ total, Outcome 3 follow‐up >16 weeks.

Comparison 20 Subgroup analysis for fluoxetine versus other SSRIs: failure to complete ‐ inefficacy, Outcome 1 follow‐up <6 weeks.

Comparison 20 Subgroup analysis for fluoxetine versus other SSRIs: failure to complete ‐ inefficacy, Outcome 2 follow‐up >16 weeks.

Comparison 20 Subgroup analysis for fluoxetine versus other SSRIs: failure to complete ‐ inefficacy, Outcome 3 follow‐up 6‐16 weeks.

Comparison 21 Subgroup analysis for fluoxetine versus other SSRIs: failure to complete ‐ side effects, Outcome 1 follow‐up <6 weeks.

Comparison 21 Subgroup analysis for fluoxetine versus other SSRIs: failure to complete ‐ side effects, Outcome 2 follow‐up 6‐16 weeks.

Comparison 21 Subgroup analysis for fluoxetine versus other SSRIs: failure to complete ‐ side effects, Outcome 3 follow‐up >16 weeks.

Comparison 22 Subgroup analysis for fluoxetine versus MAOIs or newer ADs: failure to respond, Outcome 1 follow‐up <6 weeks.

Comparison 22 Subgroup analysis for fluoxetine versus MAOIs or newer ADs: failure to respond, Outcome 2 follow‐up 6‐16 weeks.

Comparison 23 Subgroup analysis for fluoxetine versus MAOIs or newer ADs: endpoint score, Outcome 1 follow‐up <6 weeks.

Comparison 23 Subgroup analysis for fluoxetine versus MAOIs or newer ADs: endpoint score, Outcome 2 follow‐up 6‐16 weeks.

Comparison 24 Subgroup analysis for fluoxetine versus MAOIs or newer ADs: failure to complete ‐ total, Outcome 1 follow‐up <6 weeks.

Comparison 24 Subgroup analysis for fluoxetine versus MAOIs or newer ADs: failure to complete ‐ total, Outcome 2 follow‐up 6‐16 weeks.

Comparison 25 Subgroup analysis for fluoxetine versus MAOIs or newer ADs: failure to complete ‐ inefficacy, Outcome 1 follow‐up <6 weeks.

Comparison 25 Subgroup analysis for fluoxetine versus MAOIs or newer ADs: failure to complete ‐ inefficacy, Outcome 2 follow‐up 6‐16 weeks.

Comparison 26 Subgroup analysis for fluoxetine versus MAOIs or newer ADs: failure to complete ‐ side effects, Outcome 1 follow‐up <6 weeks.

Comparison 26 Subgroup analysis for fluoxetine versus MAOIs or newer ADs: failure to complete ‐ side effects, Outcome 2 follow‐up 6‐16 weeks.
| Fluoxetine compared to TCAs | ||||||
| Patient or population: patients with depression | ||||||
| Outcomes | Illustrative comparative risks* (95% CI) | Relative effect | No of Participants | Quality of the evidence | Comments | |
| Assumed risk | Corresponding risk | |||||
| TCAs | Fluoxetine | |||||
| Failure to respond (reduction ≥ 50% on HDRS) | 471 per 1000 | 463 per 1000 | OR 0.97 | 2124 | ⊕⊕⊕⊝ | |
| Endpoint score (HDRS or MADRS) | The mean endpoint score in the intervention groups was | 3393 | ⊕⊕⊕⊝ | This effect approaches zero | ||
| Failure to complete ‐ total ‐ | 335 per 1000 | 284 per 1000 | OR 0.79 | 4194 | ⊕⊕⊕⊝ | |
| Failure to complete ‐ side effects ‐ | 193 per 1000 | 116 per 1000 | OR 0.55 | 3647 | ⊕⊕⊕⊝ | |
| Failure to complete ‐ inefficacy ‐ | 68 per 1000 | 87 per 1000 | OR 1.29 | 2911 | ⊕⊕⊕⊝ | |
| *The basis for the assumed risk (e.g. the median control group risk across studies) is provided in footnotes. The corresponding risk (and its 95% confidence interval) is based on the assumed risk in the comparison group and the relative effect of the intervention (and its 95% CI). | ||||||
| GRADE Working Group grades of evidence | ||||||
| 1 Limitations in study design: no details on randomisation procedures and allocation concealment. Blinding stated but not tested. | ||||||
| Fluoxetine compared to ABT 200 | ||||||
| Patient or population: patients with depression | ||||||
| Outcomes | Illustrative comparative risks* (95% CI) | Relative effect | No of Participants | Quality of the evidence | Comments | |
| Assumed risk | Corresponding risk | |||||
| ABT 200 | Fluoxetine | |||||
| Failure to respond (reduction ≥ 50% on HDRS) | 0 per 1000 | Not estimable | 0 (0) | |||
| Endpoint score (HDRS or MADRS) | The mean endpoint score in the intervention groups was | 141 | ⊕⊕⊝⊝ | This corresponds to a large effect according | ||
| Failure to complete ‐ total ‐ | 528 per 1000 | 167 per 1000 | OR 0.18 | 144 | ⊕⊕⊝⊝ | |
| Failure to complete ‐ inefficacy ‐ | 56 per 1000 | 14 per 1000 | OR 0.24 | 144 | ⊕⊕⊝⊝ | |
| Failure to complete ‐ side effects ‐ | 361 per 1000 | 43 per 1000 | OR 0.08 | 144 | ⊕⊕⊝⊝ | |
| *The basis for the assumed risk (e.g. the median control group risk across studies) is provided in footnotes. The corresponding risk (and its 95% confidence interval) is based on the assumed risk in the comparison group and the relative effect of the intervention (and its 95% CI). | ||||||
| GRADE Working Group grades of evidence | ||||||
| 1 Limitations in study design: no details on randomisation procedures and allocation concealment. Blinding stated but not tested. Only one study included in the analysis. | ||||||
| Fluoxetine compared to agomelatine | ||||||
| Patient or population: patients with depression | ||||||
| Outcomes | Illustrative comparative risks* (95% CI) | Relative effect | No of Participants | Quality of the evidence | Comments | |
| Assumed risk | Corresponding risk | |||||
| Agomelatine | Fluoxetine | |||||
| Failure to respond (reduction ≥ 50% on HDRS) | 282 per 1000 | 361 per 1000 | OR 1.44 | 515 | ⊕⊕⊝⊝ | |
| Endpoint score (HDRS or MADRS) | The mean endpoint score in the intervention groups was | 1213 | ⊕⊕⊕⊝ | This effect approaches zero | ||
| Failure to complete ‐ total ‐ | 135 per 1000 | 170 per 1000 | OR 1.31 | 785 | ⊕⊕⊕⊝ | |
| Failure to complete ‐ inefficacy ‐ | 55 per 1000 | 59 per 1000 | OR 1.08 | 785 | ⊕⊕⊕⊝ | |
| Failure to complete ‐ side effects ‐ | 34 per 1000 | 50 per 1000 | OR 1.51 | 785 | ⊕⊕⊕⊝ | |
| *The basis for the assumed risk (e.g. the median control group risk across studies) is provided in footnotes. The corresponding risk (and its 95% confidence interval) is based on the assumed risk in the comparison group and the relative effect of the intervention (and its 95% CI). | ||||||
| GRADE Working Group grades of evidence | ||||||
| 1 Limitations in studies designs: no details on randomisation procedures and allocation concealment. Blinding stated but not tested. 2 Only one study included in this analysis. | ||||||
| Fluoxetine compared to amineptine | ||||||
| Patient or population: patients with depression | ||||||
| Outcomes | Illustrative comparative risks* (95% CI) | Relative effect | No of Participants | Quality of the evidence | Comments | |
| Assumed risk | Corresponding risk | |||||
| Amineptine | Fluoxetine | |||||
| Failure to respond (reduction ≥ 50% on HDRS) | 719 per 1000 | 486 per 1000 | OR 0.37 | 63 | ⊕⊕⊕⊝ | |
| Endpoint score (HDRS or MADRS) | The mean endpoint score in the intervention groups was | 0 (0) | No data available on this outcome | |||
| Failure to complete ‐ total ‐ | 210 per 1000 | 140 per 1000 | OR 0.61 | 232 | ⊕⊕⊕⊝ | |
| Failure to complete ‐ inefficacy ‐ | 94 per 1000 | 97 per 1000 | OR 1.04 | 63 | ⊕⊕⊕⊝ | |
| Failure to complete ‐ side effects ‐ (Copy) | 84 per 1000 | 46 per 1000 | OR 0.52 | 232 | ⊕⊕⊕⊝ | |
| *The basis for the assumed risk (e.g. the median control group risk across studies) is provided in footnotes. The corresponding risk (and its 95% confidence interval) is based on the assumed risk in the comparison group and the relative effect of the intervention (and its 95% CI). | ||||||
| GRADE Working Group grades of evidence | ||||||
| 1 Limitations in studies designs: no details on randomisation procedures and allocation concealment. Blinding stated but not tested. | ||||||
| Fluoxetine compared to amisulpride | ||||||
| Patient or population: patients with depression | ||||||
| Outcomes | Illustrative comparative risks* (95% CI) | Relative effect | No of Participants | Quality of the evidence | Comments | |
| Assumed risk | Corresponding risk | |||||
| Amisulpride | Fluoxetine | |||||
| Failure to respond (reduction ≥ 50% on HDRS) | 0 per 1000 | Not estimable | 0 (0) | |||
| Endpoint score (HDRS or MADRS) | The mean endpoint score in the intervention groups was | 268 | ⊕⊕⊝⊝ | This corresponds to a very small effect according | ||
| Failure to complete ‐ total ‐ | 225 per 1000 | 288 per 1000 | OR 1.39 | 281 | ⊕⊕⊝⊝ | |
| Failure to complete ‐ inefficacy ‐ | 56 per 1000 | 65 per 1000 | OR 1.16 | 281 | ⊕⊕⊝⊝ | |
| Failure to complete ‐ side effects ‐ | 92 per 1000 | 72 per 1000 | OR 0.77 | 281 | ⊕⊕⊝⊝ | |
| *The basis for the assumed risk (e.g. the median control group risk across studies) is provided in footnotes. The corresponding risk (and its 95% confidence interval) is based on the assumed risk in the comparison group and the relative effect of the intervention (and its 95% CI). | ||||||
| GRADE Working Group grades of evidence | ||||||
| 1 Limitations in studies designs: no details on randomisation procedures and allocation concealment. Blinding stated but not tested. Only one study included in the analysis. | ||||||
| Fluoxetine compared to bupropion | ||||||
| Patient or population: patients with depression | ||||||
| Outcomes | Illustrative comparative risks* (95% CI) | Relative effect | No of Participants | Quality of the evidence | Comments | |
| Assumed risk | Corresponding risk | |||||
| Bupropion | Fluoxetine | |||||
| Failure to respond (reduction ≥ 50% on HDRS) | 493 per 1000 | 447 per 1000 | OR 0.83 | 436 | ⊕⊕⊕⊝ | |
| Endpoint score (HDRS or MADRS) | The mean endpoint score in the intervention groups was | 0 (0) | No data available on this outcome | |||
| Failure to complete ‐ total ‐ | 356 per 1000 | 356 per 1000 | OR 1.00 | 436 | ⊕⊕⊕⊝ | |
| Failure to complete ‐ inefficacy ‐ | 23 per 1000 | 0 per 1000 | OR 1.16 | 436 | ⊕⊕⊕⊝ | |
| Failure to complete ‐ side effects ‐ | 59 per 1000 | 60 per 1000 | OR 1.01 | 436 | ⊕⊕⊕⊝ | |
| *The basis for the assumed risk (e.g. the median control group risk across studies) is provided in footnotes. The corresponding risk (and its 95% confidence interval) is based on the assumed risk in the comparison group and the relative effect of the intervention (and its 95% CI). | ||||||
| GRADE Working Group grades of evidence | ||||||
| 1 Limitations in studies designs: no details on randomisation procedures and allocation concealment. Blinding stated but not tested. | ||||||
| Fluoxetine compared to citalopram | ||||||
| Patient or population: patients with depression | ||||||
| Outcomes | Illustrative comparative risks* (95% CI) | Relative effect | No of Participants | Quality of the evidence | Comments | |
| Assumed risk | Corresponding risk | |||||
| Citalopram | Fluoxetine | |||||
| Failure to respond (reduction ≥ 50% on HDRS) | 379 per 1000 | 268 per 1000 | OR 0.60 | 59 | ⊕⊝⊝⊝ | |
| Endpoint score (HDRS or MADRS) | The mean endpoint score in the intervention groups was | 661 | ⊕⊕⊕⊝ | This effect approaches zero | ||
| Failure to complete ‐ total ‐ | 211 per 1000 | 189 per 1000 | OR 0.87 | 732 | ⊕⊕⊕⊝ | |
| Failure to complete ‐ inefficacy ‐ | 75 per 1000 | 66 per 1000 | OR 0.87 | 732 | ⊕⊕⊕⊝ | |
| Failure to complete ‐ side effects ‐ | 75 per 1000 | 49 per 1000 | OR 0.64 | 732 | ⊕⊕⊕⊝ | |
| *The basis for the assumed risk (e.g. the median control group risk across studies) is provided in footnotes. The corresponding risk (and its 95% confidence interval) is based on the assumed risk in the comparison group and the relative effect of the intervention (and its 95% CI). | ||||||
| GRADE Working Group grades of evidence | ||||||
| 1 Limitations in studies designs: no details on randomisation procedures and allocation concealment. Blinding stated but not tested. 2 Only one study included in the analysis and less than 100 patients. | ||||||
| Fluoxetine compared to Crocus sativus | ||||||
| Patient or population: patients with depression | ||||||
| Outcomes | Illustrative comparative risks* (95% CI) | Relative effect | No of Participants | Quality of the evidence | Comments | |
| Assumed risk | Corresponding risk | |||||
| Crocus sativus | Fluoxetine | |||||
| Failure to respond (reduction ≥ 50% on HDRS) | 250 per 1000 | 150 per 1000 | OR 0.53 | 40 | ⊕⊝⊝⊝ | |
| Endpoint score (HDRS or MADRS) | The mean endpoint score in the intervention groups was | 0 (0) | No data available on this outcome | |||
| Failure to complete ‐ total ‐ | 50 per 1000 | 50 per 1000 | OR 1.00 | 40 | ⊕⊝⊝⊝ | |
| Failure to complete ‐ inefficacy ‐ | 0 per 1000 | Not estimable | 0 (0) | |||
| Failure to complete ‐ side effects ‐ | 0 per 1000 | Not estimable | 0 (0) | |||
| *The basis for the assumed risk (e.g. the median control group risk across studies) is provided in footnotes. The corresponding risk (and its 95% confidence interval) is based on the assumed risk in the comparison group and the relative effect of the intervention (and its 95% CI). | ||||||
| GRADE Working Group grades of evidence | ||||||
| 1 Limitations in studies designs: no details on randomisation procedures and allocation concealment. Blinding stated but not tested. Only one study included in the analysis and less than 50 patients. | ||||||
| Fluoxetine compared to for duloxetine | ||||||
| Patient or population: patients with depression | ||||||
| Outcomes | Illustrative comparative risks* (95% CI) | Relative effect | No of Participants | Quality of the evidence | Comments | |
| Assumed risk | Corresponding risk | |||||
| Fluoxetine | ||||||
| Failure to respond (reduction ≥ 50% on HDRS) | 400 per 1000 | 485 per 1000 | OR 1.41 | 103 | ⊕⊕⊝⊝ | |
| Endpoint score (HDRS or MADRS) | The mean endpoint score in the intervention groups was | 0 (0) | No data available on this outcome | |||
| Failure to complete ‐ total ‐ | 281 per 1000 | 260 per 1000 | OR 0.90 | 532 | ⊕⊕⊕⊝ | |
| Failure to complete ‐ inefficacy ‐ | 15 per 1000 | 47 per 1000 | OR 3.33 | 432 | ⊕⊕⊕⊝ | |
| Failure to complete ‐ side effects ‐ | 66 per 1000 | 19 per 1000 | OR 0.28 | 532 | ⊕⊕⊕⊝ | |
| *The basis for the assumed risk (e.g. the median control group risk across studies) is provided in footnotes. The corresponding risk (and its 95% confidence interval) is based on the assumed risk in the comparison group and the relative effect of the intervention (and its 95% CI). | ||||||
| GRADE Working Group grades of evidence | ||||||
| 1 Limitations in studies designs: no details on randomisation procedures and allocation concealment. Blinding stated but not tested. 2 Only one study included in the analysis. | ||||||
| Fluoxetine compared to escitalopram | ||||||
| Patient or population: patients with depression | ||||||
| Outcomes | Illustrative comparative risks* (95% CI) | Relative effect | No of Participants | Quality of the evidence | Comments | |
| Assumed risk | Corresponding risk | |||||
| Escitalopram | Fluoxetine | |||||
| Failure to respond (reduction ≥ 50% on HDRS) | 236 per 1000 | 239 per 1000 | OR 1.02 | 240 | ⊕⊕⊝⊝ | |
| Endpoint score (HDRS or MADRS) | The mean endpoint score in the intervention groups was | 231 | ⊕⊕⊝⊝ | This effect approaches zero | ||
| Failure to complete ‐ total ‐ | 148 per 1000 | 210 per 1000 | OR 1.53 | 578 | ⊕⊕⊕⊝ | |
| Failure to complete ‐ inefficacy ‐ | 13 per 1000 | 23 per 1000 | OR 1.74 | 578 | ⊕⊕⊕⊝ | |
| Failure to complete ‐ side effects ‐ | 77 per 1000 | 89 per 1000 | OR 1.17 | 578 | ⊕⊕⊕⊝ | |
| *The basis for the assumed risk (e.g. the median control group risk across studies) is provided in footnotes. The corresponding risk (and its 95% confidence interval) is based on the assumed risk in the comparison group and the relative effect of the intervention (and its 95% CI). | ||||||
| GRADE Working Group grades of evidence | ||||||
| 1 Limitations in studies designs: no details on randomisation procedures and allocation concealment. Blinding stated but not tested. 2 Only one study included in the analysis. | ||||||
| Fluoxetine compared to fluvoxamine | ||||||
| Patient or population: patients with depression | ||||||
| Outcomes | Illustrative comparative risks* (95% CI) | Relative effect | No of Participants | Quality of the evidence | Comments | |
| Assumed risk | Corresponding risk | |||||
| Fluvoxamine | Fluoxetine | |||||
| Failure to respond (reduction ≥ 50% on HDRS) | 605 per 1000 | 592 per 1000 | OR 0.95 | 177 | ⊕⊕⊝⊝ | |
| Endpoint score (HDRS or MADRS) | The mean endpoint score in the intervention groups was | 0 (0) | No data available on this outcome | |||
| Failure to complete ‐ total ‐ | 170 per 1000 | 936 per 1000 | OR 071 | 284 | ⊕⊕⊕⊝ | |
| Failure to complete ‐ inefficacy ‐ | 0 per 1000 | Not estimable | 0 (0) | |||
| Failure to complete ‐ side effects ‐ | 39 per 1000 | 41 per 1000 | OR 1.04 | 100 | ⊕⊕⊝⊝ | |
| *The basis for the assumed risk (e.g. the median control group risk across studies) is provided in footnotes. The corresponding risk (and its 95% confidence interval) is based on the assumed risk in the comparison group and the relative effect of the intervention (and its 95% CI). | ||||||
| GRADE Working Group grades of evidence | ||||||
| 1 Limitations in studies designs: no details on randomisation procedures and allocation concealment. Blinding stated but not tested. 2 Only one study included in the analysis. | ||||||
| Fluoxetine compared to hypericum | ||||||
| Patient or population: patients with depression | ||||||
| Outcomes | Illustrative comparative risks* (95% CI) | Relative effect | No of Participants | Quality of the evidence | Comments | |
| Assumed risk | Corresponding risk | |||||
| Hypericum | Fluoxetine | |||||
| Failure to respond (reduction ≥ 50% on HDRS) | 490 per 1000 | 485 per 1000 | OR 0.98 | 717 | ⊕⊕⊕⊝ | |
| Endpoint score (HDRS or MADRS) | The mean endpoint score in the intervention groups was | 648 | ⊕⊕⊕⊝ | This corresponds to a very small effect according | ||
| Failure to complete ‐ total ‐ | 129 per 1000 | 133 per 1000 | OR 1.04 | 679 | ⊕⊕⊕⊝ | |
| Failure to complete ‐ inefficacy ‐ | OR 4.70 | 401 | ⊕⊕⊕⊝ | |||
| Failure to complete ‐ side effects ‐ | 35 per 1000 | 42 per 1000 | OR 1.21 | 679 | ⊕⊕⊕⊝ | |
| *The basis for the assumed risk (e.g. the median control group risk across studies) is provided in footnotes. The corresponding risk (and its 95% confidence interval) is based on the assumed risk in the comparison group and the relative effect of the intervention (and its 95% CI). | ||||||
| GRADE Working Group grades of evidence | ||||||
| 1 Limitations in studies designs: no details on randomisation procedures and allocation concealment. Blinding stated but not tested. | ||||||
| Fluoxetine compared to maprotiline | ||||||
| Patient or population: patients with depression | ||||||
| Outcomes | Illustrative comparative risks* (95% CI) | Relative effect | No of Participants | Quality of the evidence | Comments | |
| Assumed risk | Corresponding risk | |||||
| Maprotiline | Fluoxetine | |||||
| Failure to respond (reduction ≥ 50% on HDRS) | 398 per 1000 | 563 per 1000 | OR 1.95 | 163 | ⊕⊕⊕⊝ | |
| Endpoint score (HDRS or MADRS) | The mean endpoint score in the intervention groups was | 433 | ⊕⊕⊕⊝ | This effect approaches zero | ||
| Failure to complete ‐ total ‐ | 92 per 1000 | 151 per 1000 | OR 1.75 | 351 | ⊕⊕⊕⊝ | |
| Failure to complete ‐ side effects ‐ | 67 per 1000 | 36 per 1000 | OR 0.53 | 209 | ⊕⊕⊕⊝ | |
| Failure to complete ‐ inefficacy ‐ | 19 per 1000 | 47 per 1000 | OR 2.54 | 209 | ⊕⊕⊕⊝ | |
| *The basis for the assumed risk (e.g. the median control group risk across studies) is provided in footnotes. The corresponding risk (and its 95% confidence interval) is based on the assumed risk in the comparison group and the relative effect of the intervention (and its 95% CI). | ||||||
| GRADE Working Group grades of evidence | ||||||
| 1 Limitations in studies designs: no details on randomisation procedures and allocation concealment. Blinding stated but not tested. | ||||||
| Fluoxetine compared to mianserin | ||||||
| Patient or population: patients with depression | ||||||
| Outcomes | Illustrative comparative risks* (95% CI) | Relative effect | No of Participants | Quality of the evidence | Comments | |
| Assumed risk | Corresponding risk | |||||
| Mianserin | Fluoxetine | |||||
| Failure to respond (reduction ≥ 50% on HDRS) | 593 per 1000 | 538 per 1000 | OR 0.80 | 53 | ⊕⊝⊝⊝ | |
| Endpoint score (HDRS or MADRS) | The mean endpoint score in the intervention groups was | 128 | ⊕⊕⊕⊝ | This corresponds to a small effect according | ||
| Failure to complete ‐ total ‐ | 362 per 1000 | 263 per 1000 | OR 0.63 | 93 | ⊕⊕⊕⊝ | |
| Failure to complete ‐ inefficacy ‐ | 74 per 1000 | 154 per 1000 | OR 2.27 | 53 | ⊕⊝⊝⊝ | |
| Failure to complete ‐ side effects ‐ | 148 per 1000 | 154 per 1000 | OR 1.05 | 53 | ⊕⊝⊝⊝ | |
| *The basis for the assumed risk (e.g. the median control group risk across studies) is provided in footnotes. The corresponding risk (and its 95% confidence interval) is based on the assumed risk in the comparison group and the relative effect of the intervention (and its 95% CI). | ||||||
| GRADE Working Group grades of evidence | ||||||
| 1 Limitations in studies designs: no details on randomisation procedures and allocation concealment. Blinding stated but not tested. 2 Only one study included in the analysis and less than 100 patients. | ||||||
| Fluoxetine compared to milnacipran | ||||||
| Patient or population: patients with depression | ||||||
| Outcomes | Illustrative comparative risks* (95% CI) | Relative effect | No of Participants | Quality of the evidence | Comments | |
| Assumed risk | Corresponding risk | |||||
| Milnacipran | Fluoxetine | |||||
| Failure to respond (reduction ≥ 50% on HDRS) | 473 per 1000 | 518 per 1000 | OR 1.20 | 370 | ⊕⊕⊕⊝ | |
| Endpoint score (HDRS or MADRS) | The mean endpoint score in the intervention groups was | 213 | ⊕⊕⊕⊝ | This corresponds to a small effect according | ||
| Failure to complete ‐ total ‐ | 411 per 1000 | 406 per 1000 | OR 0.98 | 560 | ⊕⊕⊕⊝ | |
| Failure to complete ‐ inefficacy ‐ | 137 per 1000 | 165 per 1000 | OR 1.25 | 560 | ⊕⊕⊕⊝ | |
| Failure to complete ‐ side effects ‐ | 71 per 1000 | 103 per 1000 | OR 1.50 | 560 | ⊕⊕⊕⊝ | |
| *The basis for the assumed risk (e.g. the median control group risk across studies) is provided in footnotes. The corresponding risk (and its 95% confidence interval) is based on the assumed risk in the comparison group and the relative effect of the intervention (and its 95% CI). | ||||||
| GRADE Working Group grades of evidence | ||||||
| 1 Limitations in studies designs: no details on randomisation procedures and allocation concealment. Blinding stated but not tested. | ||||||
| Fluoxetine compared to mirtazapine | ||||||
| Patient or population: patients with depression | ||||||
| Outcomes | Illustrative comparative risks* (95% CI) | Relative effect | No of Participants | Quality of the evidence | Comments | |
| Assumed risk | Corresponding risk | |||||
| Mirtazapine | Fluoxetine | |||||
| Failure to respond (reduction ≥ 50% on HDRS) | 354 per 1000 | 444 per 1000 | OR 1.46 | 600 | ⊕⊕⊕⊝ | |
| Endpoint score (HDRS or MADRS) | The mean endpoint score in the intervention groups was | 31 | ⊕⊝⊝⊝ | This corresponds to a medium effect according | ||
| Failure to complete ‐ total ‐ | 327 per 1000 | 304 per 1000 | OR 0.90 | 301 | ⊕⊕⊕⊝ | |
| Failure to complete ‐ inefficacy ‐ | 44 per 1000 | 62 per 1000 | OR 1.45 | 600 | ⊕⊕⊕⊝ | |
| Failure to complete ‐ side effects ‐ | 98 per 1000 | 93 per 1000 | OR 0.95 | 600 | ⊕⊕⊕⊝ | |
| *The basis for the assumed risk (e.g. the median control group risk across studies) is provided in footnotes. The corresponding risk (and its 95% confidence interval) is based on the assumed risk in the comparison group and the relative effect of the intervention (and its 95% CI). | ||||||
| GRADE Working Group grades of evidence | ||||||
| 1 Limitations in studies designs: no details on randomisation procedures and allocation concealment. Blinding stated but not tested. 2 Only one study included in the analysis and less than 100 patients. | ||||||
| Fluoxetine compared to moclobemide | ||||||
| Patient or population: patients with depression | ||||||
| Outcomes | Illustrative comparative risks* (95% CI) | Relative effect | No of Participants | Quality of the evidence | Comments | |
| Assumed risk | Corresponding risk | |||||
| Moclobemide | Fluoxetine | |||||
| Failure to respond (reduction ≥ 50% on HDRS) | 436 per 1000 | 496 per 1000 | OR 1.27 | 721 | ⊕⊕⊕⊝ | |
| Endpoint score (HDRS or MADRS) | The mean endpoint score in the intervention groups was | 540 | ⊕⊕⊕⊝ | This corresponds to a very small effect according | ||
| Failure to complete ‐ total ‐ | 207 per 1000 | 209 per 1000 | OR 1.01 | 721 | ⊕⊕⊕⊝ | |
| Failure to complete ‐ inefficacy ‐ | 62 per 1000 | 44 per 1000 | OR 0.70 | 679 | ⊕⊕⊕⊝ | |
| Failure to complete ‐ side effects ‐ | 86 per 1000 | 91 per 1000 | OR 1.07 | 721 | ⊕⊕⊕⊝ | |
| *The basis for the assumed risk (e.g. the median control group risk across studies) is provided in footnotes. The corresponding risk (and its 95% confidence interval) is based on the assumed risk in the comparison group and the relative effect of the intervention (and its 95% CI). | ||||||
| GRADE Working Group grades of evidence | ||||||
| 1 Limitations in studies designs: no details on randomisation procedures and allocation concealment. Blinding stated but not tested. | ||||||
| Fluoxetine compared to nefazodone | ||||||
| Patient or population: patients with depression | ||||||
| Outcomes | Illustrative comparative risks* (95% CI) | Relative effect | No of Participants | Quality of the evidence | Comments | |
| Assumed risk | Corresponding risk | |||||
| Nefazodone | Fluoxetine | |||||
| Failure to respond (reduction ≥ 50% on HDRS) | 0 per 1000 | Not estimable | 0 (0) | |||
| Endpoint score (HDRS or MADRS) | The mean endpoint score in the intervention groups was | 271 | ⊕⊕⊕⊝ | This effects approaches zero | ||
| Failure to complete ‐ total ‐ | 220 per 1000 | 132 per 1000 | OR 0.54 | 161 | ⊕⊕⊕⊝ | |
| Failure to complete ‐ inefficacy ‐ | 24 per 1000 | 17 per 1000 | OR 0.71 | 161 | ⊕⊕⊕⊝ | |
| Failure to complete ‐ side effects ‐ | 96 per 1000 | 75 per 1000 | OR 0.76 | 286 | ⊕⊕⊕⊝ | |
| *The basis for the assumed risk (e.g. the median control group risk across studies) is provided in footnotes. The corresponding risk (and its 95% confidence interval) is based on the assumed risk in the comparison group and the relative effect of the intervention (and its 95% CI). | ||||||
| GRADE Working Group grades of evidence | ||||||
| 1 Limitations in studies designs: no details on randomisation procedures and allocation concealment. Blinding stated but not tested. | ||||||
| Fluoxetine compared to paroxetine | ||||||
| Patient or population: patients with depression | ||||||
| Outcomes | Illustrative comparative risks* (95% CI) | Relative effect | No of Participants | Quality of the evidence | Comments | |
| Assumed risk | Corresponding risk | |||||
| Paroxetine | Fluoxetine | |||||
| Failure to respond (reduction ≥ 50% on HDRS) | 426 per 1000 | 477 per 1000 | OR 1.23 | 1574 | ⊕⊕⊕⊝ | |
| Endpoint score (HDRS or MADRS) | The mean endpoint score in the intervention groups was | 2061 | ⊕⊕⊕⊝ | This effect approaches zero | ||
| Failure to complete ‐ total ‐ | 317 per 1000 | 313 per 1000 | OR 0.98 | 1848 | ⊕⊕⊕⊝ | |
| Failure to complete ‐ inefficacy ‐ | 52 per 1000 | 39 per 1000 | OR 0.75 | 1005 | ⊕⊕⊕⊝ | |
| Failure to complete ‐ side effects ‐ | 133 per 1000 | 115 per 1000 | OR 0.85 | 1509 | ⊕⊕⊕⊝ | |
| *The basis for the assumed risk (e.g. the median control group risk across studies) is provided in footnotes. The corresponding risk (and its 95% confidence interval) is based on the assumed risk in the comparison group and the relative effect of the intervention (and its 95% CI). | ||||||
| GRADE Working Group grades of evidence | ||||||
| 1 Limitations in studies designs: no details on randomisation procedures and allocation concealment. Blinding stated but not tested. | ||||||
| Fluoxetine compared to phenelzine | ||||||
| Patient or population: patients with depression | ||||||
| Outcomes | Illustrative comparative risks* (95% CI) | Relative effect | No of Participants | Quality of the evidence | Comments | |
| Assumed risk | Corresponding risk | |||||
| Phenelzine | Fluoxetine | |||||
| Failure to respond (reduction ≥ 50% on HDRS) | 150 per 1000 | 200 per 1000 | OR 1.42 | 40 | ⊕⊝⊝⊝ | |
| Endpoint score (HDRS or MADRS) | The mean endpoint score in the intervention groups was | 40 | ⊕⊝⊝⊝ | This effect approaches zero | ||
| Failure to complete ‐ total ‐ | 100 per 1000 | 20 per 1000 | OR 0.18 | 40 | ⊕⊝⊝⊝ | |
| Failure to complete ‐ inefficacy ‐ | 0 per 1000 | Not estimable | 0 (0) | |||
| Failure to complete ‐ side effects ‐ | 50 per 1000 | 17 per 1000 | OR 0.32 | 40 | ⊕⊝⊝⊝ | |
| *The basis for the assumed risk (e.g. the median control group risk across studies) is provided in footnotes. The corresponding risk (and its 95% confidence interval) is based on the assumed risk in the comparison group and the relative effect of the intervention (and its 95% CI). | ||||||
| GRADE Working Group grades of evidence | ||||||
| 1 Limitations in studies designs: no details on randomisation procedures and allocation concealment. Blinding stated but not tested. Only one study included in the analysis and less than 50 patients. | ||||||
| Fluoxetine compared to pramipexole | ||||||
| Patient or population: patients with depression | ||||||
| Outcomes | Illustrative comparative risks* (95% CI) | Relative effect | No of Participants | Quality of the evidence | Comments | |
| Assumed risk | Corresponding risk | |||||
| Pramipexole | Fluoxetine | |||||
| Failure to respond (reduction ≥ 50% on HDRS) | 657 per 1000 | 513 per 1000 | OR 0.55 | 105 | ⊕⊕⊝⊝ | |
| Endpoint score (HDRS or MADRS) | The mean endpoint score in the intervention groups was | 0 (0) | No data available on this outcome | |||
| Failure to complete ‐ total ‐ | 443 per 1000 | 87 per 1000 | OR 0.12 | 105 | ⊕⊕⊝⊝ | |
| Failure to complete ‐ inefficacy ‐ | 57 per 1000 | 29 per 1000 | OR 0.49 | 105 | ⊕⊕⊝⊝ | |
| Failure to complete ‐ side effects ‐ | 314 per 1000 | 27 per 1000 | OR 0.06 | 105 | ⊕⊕⊝⊝ | |
| *The basis for the assumed risk (e.g. the median control group risk across studies) is provided in footnotes. The corresponding risk (and its 95% confidence interval) is based on the assumed risk in the comparison group and the relative effect of the intervention (and its 95% CI). | ||||||
| GRADE Working Group grades of evidence | ||||||
| 1 Limitations in studies designs: no details on randomisation procedures and allocation concealment. Blinding stated but not tested. Only one study included in the analysis. | ||||||
| Fluoxetine compared to reboxetine | ||||||
| Patient or population: patients with depression | ||||||
| Outcomes | Illustrative comparative risks* (95% CI) | Relative effect | No of Participants | Quality of the evidence | Comments | |
| Assumed risk | Corresponding risk | |||||
| Reboxetine | Fluoxetine | |||||
| Failure to respond (reduction ≥ 50% on HDRS) | 566 per 1000 | 501 per 1000 | OR 0.77 | 721 | ⊕⊕⊕⊝ | |
| Endpoint score (HDRS or MADRS) | The mean endpoint score in the intervention groups was | 205 | ⊕⊕⊕⊝ | This effect approaches zero | ||
| Failure to complete ‐ total ‐ | 361 per 1000 | 253 per 1000 | OR 0.60 | 764 | ⊕⊕⊕⊝ | |
| Failure to complete ‐ inefficacy ‐ | 88 per 1000 | 82 per 1000 | OR 0.92 | 464 | ⊕⊕⊕⊝ | |
| Failure to complete ‐ side effects ‐ | 129 per 1000 | 57 per 1000 | OR 0.41 | 211 | ⊕⊕⊕⊝ | |
| *The basis for the assumed risk (e.g. the median control group risk across studies) is provided in footnotes. The corresponding risk (and its 95% confidence interval) is based on the assumed risk in the comparison group and the relative effect of the intervention (and its 95% CI). | ||||||
| GRADE Working Group grades of evidence | ||||||
| 1 Limitations in studies designs: no details on randomisation procedures and allocation concealment. Blinding stated but not tested. | ||||||
| Fluoxetine compared to sertraline | ||||||
| Patient or population: patients with depression | ||||||
| Outcomes | Illustrative comparative risks* (95% CI) | Relative effect | No of Participants | Quality of the evidence | Comments | |
| Assumed risk | Corresponding risk | |||||
| Sertraline | Fluoxetine | |||||
| Failure to respond (reduction ≥ 50% on HDRS) | 416 per 1000 | 494 per 1000 | OR 1.37 | 1188 (6 studies) | ⊕⊕⊕⊝ | |
| Endpoint score (HDRS or MADRS) | The mean endpoint score in the intervention groups was | 1160 | ⊕⊕⊕⊝ | This corresponds to a very small effect according | ||
| Failure to complete ‐ total ‐ | 229 per 1000 | 258 per 1000 | OR 1.17 | 1591 | ⊕⊕⊕⊝ | |
| Failure to complete ‐ inefficacy ‐ | 70 per 1000 | 76 per 1000 | OR 1.09 | 1056 | ⊕⊕⊕⊝ | |
| Failure to complete ‐ side effects ‐ | 110 per 1000 | 134 per 1000 | OR 1.25 | 1591 | ⊕⊕⊕⊝ | |
| *The basis for the assumed risk (e.g. the median control group risk across studies) is provided in footnotes. The corresponding risk (and its 95% confidence interval) is based on the assumed risk in the comparison group and the relative effect of the intervention (and its 95% CI). | ||||||
| GRADE Working Group grades of evidence | ||||||
| 1 Limitations in studies designs: no details on randomisation procedures and allocation concealment. Blinding stated but not tested. | ||||||
| Fluoxetine compared to tianeptine | ||||||
| Patient or population: patients with depression | ||||||
| Outcomes | Illustrative comparative risks* (95% CI) | Relative effect | No of Participants | Quality of the evidence | Comments | |
| Assumed risk | Corresponding risk | |||||
| Tianeptine | Fluoxetine | |||||
| Failure to respond (reduction ≥ 50% on HDRS) | 534 per 1000 | 562 per 1000 | OR 1.12 | 387 | ⊕⊕⊕⊝ | |
| Endpoint score (HDRS or MADRS) | The mean endpoint score in the intervention groups was | 730 | ⊕⊕⊕⊝ | This corresponds to a very small effect according | ||
| Failure to complete ‐ total ‐ | 225 per 1000 | 218 per 1000 | OR 0.96 | 830 | ⊕⊕⊕⊝ | |
| Failure to complete ‐ inefficacy ‐ | 47 per 1000 | 39 per 1000 | OR 0.82 | 830 | ⊕⊕⊕⊝ | |
| Failure to complete ‐ side effects ‐ | 91 per 1000 | 101 per 1000 | OR 1.13 | 830 | ⊕⊕⊕⊝ | |
| *The basis for the assumed risk (e.g. the median control group risk across studies) is provided in footnotes. The corresponding risk (and its 95% confidence interval) is based on the assumed risk in the comparison group and the relative effect of the intervention (and its 95% CI). | ||||||
| GRADE Working Group grades of evidence | ||||||
| 1 Limitations in studies designs: no details on randomisation procedures and allocation concealment. Blinding stated but not tested. | ||||||
| Fluoxetine compared to trazodone | ||||||
| Patient or population: patients with depression | ||||||
| Outcomes | Illustrative comparative risks* (95% CI) | Relative effect | No of Participants | Quality of the evidence | Comments | |
| Assumed risk | Corresponding risk | |||||
| Trazodone | Fluoxetine | |||||
| Failure to respond (reduction ≥ 50% on HDRS) | 642 per 1000 | 467 per 1000 | OR 0.49 | 110 | ⊕⊕⊕⊝ | |
| Endpoint score (HDRS or MADRS) | The mean endpoint score in the intervention groups was | 203 | ⊕⊕⊕⊝ | This corresponds to a small effect according | ||
| Failure to complete ‐ total ‐ | 250 per 1000 | 145 per 1000 | OR 0.51 | 230 | ⊕⊕⊕⊝ | |
| Failure to complete ‐ inefficacy ‐ | 147 per 1000 | 38 per 1000 | OR 0.23 | 70 | ⊕⊕⊕⊝ | |
| Failure to complete ‐ side effects ‐ | 151 per 1000 | 105 per 1000 | OR 0.66 | 110 | ⊕⊕⊕⊝ | |
| *The basis for the assumed risk (e.g. the median control group risk across studies) is provided in footnotes. The corresponding risk (and its 95% confidence interval) is based on the assumed risk in the comparison group and the relative effect of the intervention (and its 95% CI). | ||||||
| GRADE Working Group grades of evidence | ||||||
| 1 Limitations in studies designs: no details on randomisation procedures and allocation concealment. Blinding stated but not tested. | ||||||
| Fluoxetine compared to venlafaxine | ||||||
| Patient or population: patients with depression | ||||||
| Outcomes | Illustrative comparative risks* (95% CI) | Relative effect | No of Participants | Quality of the evidence | Comments | |
| Assumed risk | Corresponding risk | |||||
| Venlafaxine | Fluoxetine | |||||
| Failure to respond (reduction ≥ 50% on HDRS) | 341 per 1000 | 400 per 1000 | OR 1.29 | 3387 | ⊕⊕⊕⊝ | |
| Endpoint score (HDRS or MADRS) | The mean endpoint score in the intervention groups was | 3097 | ⊕⊕⊕⊝ | This corresponds to a very small effect according | ||
| Failure to complete ‐ total ‐ | 256 per 1000 | 234 per 1000 | OR 0.89 | 2683 | ⊕⊕⊕⊝ | |
| Failure to complete ‐ inefficacy ‐ | 43 per 1000 | 56 per 1000 | OR 1.31 | 2640 | ⊕⊕⊕⊝ | |
| Failure to complete ‐ side effects ‐ | 116 per 1000 | 87 per 1000 | OR 0.72 | 2640 | ⊕⊕⊕⊝ | |
| *The basis for the assumed risk (e.g. the median control group risk across studies) is provided in footnotes. The corresponding risk (and its 95% confidence interval) is based on the assumed risk in the comparison group and the relative effect of the intervention (and its 95% CI). | ||||||
| GRADE Working Group grades of evidence | ||||||
| 1 Limitations in studies designs: no details on randomisation procedures and allocation concealment. Blinding stated but not tested. | ||||||
| Outcome or subgroup title | No. of studies | No. of participants | Statistical method | Effect size |
| 1 Failure to respond ‐ HDRS (‐50%) Show forest plot | 24 | 2124 | Odds Ratio (M‐H, Random, 95% CI) | 0.97 [0.77, 1.22] |
| 1.1 Fluoxetine vs Amitriptyline | 11 | 777 | Odds Ratio (M‐H, Random, 95% CI) | 0.93 [0.68, 1.28] |
| 1.2 Fluoxetine vs Clomipramine | 1 | 94 | Odds Ratio (M‐H, Random, 95% CI) | 0.63 [0.27, 1.45] |
| 1.3 Fluoxetine vs Desipramine | 2 | 84 | Odds Ratio (M‐H, Random, 95% CI) | 1.70 [0.56, 5.15] |
| 1.4 Fluoxetine vs Dothiepin/dosulepin | 2 | 144 | Odds Ratio (M‐H, Random, 95% CI) | 2.13 [1.08, 4.20] |
| 1.5 Fluoxetine vs Doxepine | 1 | 40 | Odds Ratio (M‐H, Random, 95% CI) | 1.0 [0.28, 3.54] |
| 1.6 Fluoxetine vs Imipramine | 5 | 761 | Odds Ratio (M‐H, Random, 95% CI) | 0.74 [0.41, 1.35] |
| 1.7 Fluoxetine vs Lofepramine | 1 | 183 | Odds Ratio (M‐H, Random, 95% CI) | 0.99 [0.55, 1.78] |
| 1.8 Fluoxetine vs Trimipramine | 1 | 41 | Odds Ratio (M‐H, Random, 95% CI) | 2.05 [0.56, 7.45] |
| 2 End‐point score on rating scale Show forest plot | 50 | 3393 | Std. Mean Difference (IV, Random, 95% CI) | 0.03 [‐0.07, 0.14] |
| 2.1 Fluoxetine vs Amiptriptyline | 19 | 1023 | Std. Mean Difference (IV, Random, 95% CI) | 0.10 [‐0.09, 0.29] |
| 2.2 Fluoxetine vs Clomipramine | 5 | 372 | Std. Mean Difference (IV, Random, 95% CI) | ‐0.10 [‐0.31, 0.10] |
| 2.3 Fluoxetine vs Desipramine | 4 | 147 | Std. Mean Difference (IV, Random, 95% CI) | 0.27 [‐0.32, 0.86] |
| 2.4 Fluoxetine vs Dothiepin/dosulepin | 4 | 266 | Std. Mean Difference (IV, Random, 95% CI) | 0.16 [‐0.27, 0.59] |
| 2.5 Fluoxetine vs Imipramine | 12 | 1063 | Std. Mean Difference (IV, Random, 95% CI) | ‐0.01 [‐0.21, 0.19] |
| 2.6 Fluoxetine vs Lofepramine | 1 | 183 | Std. Mean Difference (IV, Random, 95% CI) | 0.13 [‐0.16, 0.42] |
| 2.7 Fluoxetine vs Nomifensine | 1 | 28 | Std. Mean Difference (IV, Random, 95% CI) | ‐0.37 [‐1.12, 0.38] |
| 2.8 Fluoxetine vs Nortriptyline | 2 | 251 | Std. Mean Difference (IV, Random, 95% CI) | ‐0.48 [‐1.20, 0.24] |
| 2.9 Fluoxetine vs Trimipramine | 2 | 60 | Std. Mean Difference (IV, Random, 95% CI) | 0.41 [‐0.10, 0.92] |
| 3 Failure to complete ‐ Total Show forest plot | 49 | 4194 | Odds Ratio (M‐H, Random, 95% CI) | 0.79 [0.65, 0.96] |
| 3.1 Fluoxetine vs Amitriptyline | 18 | 1089 | Odds Ratio (M‐H, Random, 95% CI) | 0.62 [0.46, 0.85] |
| 3.2 Fluoxetine vs Clomipramine | 2 | 263 | Odds Ratio (M‐H, Random, 95% CI) | 0.65 [0.38, 1.14] |
| 3.3 Fluoxetine vs Desipramine | 2 | 104 | Odds Ratio (M‐H, Random, 95% CI) | 0.44 [0.16, 1.24] |
| 3.4 Fluoxetine vs Dothiepin/dosulepin | 5 | 478 | Odds Ratio (M‐H, Random, 95% CI) | 1.57 [0.92, 2.69] |
| 3.5 Fluoxetine vs Doxepine | 4 | 323 | Odds Ratio (M‐H, Random, 95% CI) | 0.81 [0.49, 1.32] |
| 3.6 Fluoxetine vs Imipramine | 12 | 1225 | Odds Ratio (M‐H, Random, 95% CI) | 0.79 [0.51, 1.21] |
| 3.7 Fluoxetine vs Lofepramine | 1 | 183 | Odds Ratio (M‐H, Random, 95% CI) | 0.50 [0.24, 1.04] |
| 3.8 Fluoxetine vs Nomifensine | 1 | 40 | Odds Ratio (M‐H, Random, 95% CI) | 6.33 [0.67, 60.16] |
| 3.9 Fluoxetine vs Nortriptyline | 3 | 448 | Odds Ratio (M‐H, Random, 95% CI) | 0.73 [0.36, 1.47] |
| 3.10 Fluoxetine vs Trimipramine | 1 | 41 | Odds Ratio (M‐H, Random, 95% CI) | 2.0 [0.41, 9.78] |
| 4 Failure to complete ‐ Inefficacy Show forest plot | 33 | 2911 | Odds Ratio (M‐H, Random, 95% CI) | 1.29 [0.96, 1.72] |
| 4.1 Fluoxetine vs Amitriptyline | 13 | 835 | Odds Ratio (M‐H, Random, 95% CI) | 0.91 [0.44, 1.88] |
| 4.2 Fluoxetine vs Clomipramine | 1 | 120 | Odds Ratio (M‐H, Random, 95% CI) | 7.37 [0.37, 145.75] |
| 4.3 Fluoxetine vs Desipramine | 2 | 104 | Odds Ratio (M‐H, Random, 95% CI) | 1.03 [0.20, 5.35] |
| 4.4 Fluoxetine vs Dothiepin/dosulepin | 3 | 271 | Odds Ratio (M‐H, Random, 95% CI) | 1.34 [0.49, 3.66] |
| 4.5 Fluoxetine vs Doxepine | 3 | 283 | Odds Ratio (M‐H, Random, 95% CI) | 1.72 [0.60, 4.92] |
| 4.6 Fluoxetine vs Imipramine | 10 | 1093 | Odds Ratio (M‐H, Random, 95% CI) | 1.41 [0.97, 2.05] |
| 4.7 Fluoxetine vs Nortriptyline | 1 | 205 | Odds Ratio (M‐H, Random, 95% CI) | 0.38 [0.07, 2.03] |
| 5 Failure to complete ‐ Side Effects Show forest plot | 40 | 3647 | Odds Ratio (M‐H, Random, 95% CI) | 0.55 [0.40, 0.75] |
| 5.1 Fluoxetine vs Amitriptyline | 16 | 1038 | Odds Ratio (M‐H, Random, 95% CI) | 0.41 [0.23, 0.71] |
| 5.2 Fluoxetine vs Clomipramine | 2 | 263 | Odds Ratio (M‐H, Random, 95% CI) | 0.30 [0.12, 0.79] |
| 5.3 Fluoxetine vs Desipramine | 2 | 104 | Odds Ratio (M‐H, Random, 95% CI) | 0.27 [0.04, 1.68] |
| 5.4 Fluoxetine vs Dothiepin/dosulepin | 5 | 478 | Odds Ratio (M‐H, Random, 95% CI) | 2.05 [0.59, 7.16] |
| 5.5 Fluoxetine vs Doxepine | 3 | 283 | Odds Ratio (M‐H, Random, 95% CI) | 0.82 [0.44, 1.53] |
| 5.6 Fluoxetine vs Imipramine | 10 | 1093 | Odds Ratio (M‐H, Random, 95% CI) | 0.47 [0.26, 0.86] |
| 5.7 Fluoxetine vs Lofepramine | 1 | 183 | Odds Ratio (M‐H, Random, 95% CI) | 0.16 [0.02, 1.38] |
| 5.8 Fluoxetine vs Nortriptyline | 1 | 205 | Odds Ratio (M‐H, Random, 95% CI) | 0.86 [0.42, 1.77] |
| Outcome or subgroup title | No. of studies | No. of participants | Statistical method | Effect size |
| 1 Failure to respond ‐ HDRS (‐50%) Show forest plot | 3 | Odds Ratio (M‐H, Random, 95% CI) | Subtotals only | |
| 1.1 Fluoxetine vs Maprotiline | 2 | 163 | Odds Ratio (M‐H, Random, 95% CI) | 1.95 [0.91, 4.18] |
| 1.2 Fluoxetine vs Mianserin | 1 | 53 | Odds Ratio (M‐H, Random, 95% CI) | 0.80 [0.27, 2.38] |
| 2 End‐point score on rating scale Show forest plot | 8 | Std. Mean Difference (IV, Random, 95% CI) | Subtotals only | |
| 2.1 Fluoxetine vs Maprotiline | 5 | 433 | Std. Mean Difference (IV, Random, 95% CI) | 0.04 [‐0.15, 0.23] |
| 2.2 Fluoxetine vs Mianserin | 3 | 128 | Std. Mean Difference (IV, Random, 95% CI) | 0.43 [‐0.38, 1.23] |
| 3 Failure to complete ‐ Total Show forest plot | 6 | Odds Ratio (M‐H, Random, 95% CI) | Subtotals only | |
| 3.1 Fluoxetine vs Maprotiline | 4 | 351 | Odds Ratio (M‐H, Random, 95% CI) | 1.75 [0.90, 3.41] |
| 3.2 Fluoxetine vs Mianserin | 2 | 93 | Odds Ratio (M‐H, Random, 95% CI) | 0.63 [0.18, 2.25] |
| 4 Failure to complete ‐ Inefficacy Show forest plot | 4 | Odds Ratio (M‐H, Random, 95% CI) | Subtotals only | |
| 4.1 Fluoxetine vs Maprotiline | 3 | 209 | Odds Ratio (M‐H, Random, 95% CI) | 2.54 [0.33, 19.19] |
| 4.2 Fluoxetine vs Mianserin | 1 | 53 | Odds Ratio (M‐H, Random, 95% CI) | 2.27 [0.38, 13.63] |
| 5 Failure to complete ‐ Side Effects Show forest plot | 4 | Odds Ratio (M‐H, Random, 95% CI) | Subtotals only | |
| 5.1 Fluoxetine vs Maprotiline | 3 | 209 | Odds Ratio (M‐H, Random, 95% CI) | 0.53 [0.15, 1.93] |
| 5.2 Fluoxetine vs Mianserin | 1 | 53 | Odds Ratio (M‐H, Random, 95% CI) | 1.05 [0.23, 4.70] |
| Outcome or subgroup title | No. of studies | No. of participants | Statistical method | Effect size |
| 1 Failure to respond ‐ HDRS (‐50%) Show forest plot | 17 | Odds Ratio (M‐H, Random, 95% CI) | Subtotals only | |
| 1.1 Fluoxetine vs Citalopram | 1 | 59 | Odds Ratio (M‐H, Random, 95% CI) | 0.60 [0.20, 1.79] |
| 1.2 Fluoxetine vs Escitalopram | 1 | 240 | Odds Ratio (M‐H, Random, 95% CI) | 1.02 [0.56, 1.85] |
| 1.3 Fluoxetine vs Fluvoxamine | 1 | 177 | Odds Ratio (M‐H, Random, 95% CI) | 0.95 [0.52, 1.74] |
| 1.4 Fluoxetine vs Paroxetine | 9 | 1574 | Odds Ratio (M‐H, Random, 95% CI) | 1.23 [0.93, 1.65] |
| 1.5 Fluoxetine vs Sertraline | 6 | 1188 | Odds Ratio (M‐H, Random, 95% CI) | 1.37 [1.08, 1.74] |
| 2 End‐point score on rating scales Show forest plot | 21 | Std. Mean Difference (IV, Random, 95% CI) | Subtotals only | |
| 2.1 Fluoxetine vs Citalopram | 3 | 661 | Std. Mean Difference (IV, Random, 95% CI) | 0.06 [‐0.10, 0.21] |
| 2.2 Fluoxetine vs Escitalopram | 1 | 231 | Std. Mean Difference (IV, Random, 95% CI) | 0.07 [‐0.19, 0.33] |
| 2.3 Fluoxetine vs Paroxetine | 11 | 2061 | Std. Mean Difference (IV, Random, 95% CI) | ‐0.01 [‐0.26, 0.24] |
| 2.4 Fluoxetine vs Sertraline | 7 | 1160 | Std. Mean Difference (IV, Random, 95% CI) | 0.09 [‐0.03, 0.20] |
| 3 Failure to complete ‐ Total Show forest plot | 25 | Odds Ratio (M‐H, Random, 95% CI) | Subtotals only | |
| 3.1 Fluoxetine vs Citalopram | 3 | 732 | Odds Ratio (M‐H, Random, 95% CI) | 0.87 [0.60, 1.27] |
| 3.2 Fluoxetine vs Escitalopram | 2 | 578 | Odds Ratio (M‐H, Random, 95% CI) | 1.53 [1.00, 2.37] |
| 3.3 Fluoxetine vs Fluvoxamine | 2 | 284 | Odds Ratio (M‐H, Random, 95% CI) | 0.71 [0.36, 1.37] |
| 3.4 Fluoxetine vs Paroxetine | 10 | 1848 | Odds Ratio (M‐H, Random, 95% CI) | 0.98 [0.81, 1.20] |
| 3.5 Fluoxetine vs Sertraline | 9 | 1591 | Odds Ratio (M‐H, Random, 95% CI) | 1.17 [0.93, 1.49] |
| 4 Failure to complete ‐ Inefficacy Show forest plot | 13 | Odds Ratio (M‐H, Random, 95% CI) | Subtotals only | |
| 4.1 Fluoxetine vs Citalopram | 3 | 732 | Odds Ratio (M‐H, Random, 95% CI) | 0.87 [0.48, 1.56] |
| 4.2 Fluoxetine vs Escitalopram | 2 | 578 | Odds Ratio (M‐H, Random, 95% CI) | 1.74 [0.46, 6.53] |
| 4.3 Fluoxetine vs Paroxetine | 4 | 1005 | Odds Ratio (M‐H, Random, 95% CI) | 0.75 [0.41, 1.39] |
| 4.4 Fluoxetine vs Sertraline | 5 | 1056 | Odds Ratio (M‐H, Random, 95% CI) | 1.09 [0.68, 1.77] |
| 5 Failure to complete ‐ Side Effects Show forest plot | 23 | Odds Ratio (M‐H, Random, 95% CI) | Subtotals only | |
| 5.1 Fluoxetine vs Citalopram | 3 | 732 | Odds Ratio (M‐H, Random, 95% CI) | 0.64 [0.34, 1.20] |
| 5.2 Fluoxetine vs Escitalopram | 2 | 578 | Odds Ratio (M‐H, Random, 95% CI) | 1.17 [0.64, 2.12] |
| 5.3 Fluoxetine vs Fluvoxamine | 1 | 100 | Odds Ratio (M‐H, Random, 95% CI) | 1.04 [0.14, 7.71] |
| 5.4 Fluoxetine vs Paroxetine | 9 | 1509 | Odds Ratio (M‐H, Random, 95% CI) | 0.85 [0.62, 1.16] |
| 5.5 Fluoxetine vs Sertraline | 9 | 1591 | Odds Ratio (M‐H, Random, 95% CI) | 1.25 [0.92, 1.70] |
| Outcome or subgroup title | No. of studies | No. of participants | Statistical method | Effect size |
| 1 Failure to respond ‐ HDRS (‐50%) Show forest plot | 15 | Odds Ratio (M‐H, Random, 95% CI) | Subtotals only | |
| 1.1 Fluoxetine vs Duloxetine | 1 | 103 | Odds Ratio (M‐H, Random, 95% CI) | 1.41 [0.61, 3.25] |
| 1.2 Fluoxetine vs Milnacipran | 2 | 370 | Odds Ratio (M‐H, Random, 95% CI) | 1.20 [0.78, 1.84] |
| 1.3 Fluoxetine vs Venlafaxine | 12 | 3387 | Odds Ratio (M‐H, Random, 95% CI) | 1.29 [1.10, 1.51] |
| 2 End‐point score on rating scale Show forest plot | 15 | Std. Mean Difference (IV, Random, 95% CI) | Subtotals only | |
| 2.1 Fluoxetine vs Milnacipran | 2 | 213 | Std. Mean Difference (IV, Random, 95% CI) | ‐0.36 [‐0.63, ‐0.08] |
| 2.2 Fluoxetine vs Venlafaxine | 13 | 3097 | Std. Mean Difference (IV, Random, 95% CI) | 0.10 [0.00, 0.19] |
| 3 Failure to complete ‐ Total Show forest plot | 19 | Odds Ratio (M‐H, Random, 95% CI) | Subtotals only | |
| 3.1 Fluoxetine vs Duloxetine | 2 | 532 | Odds Ratio (M‐H, Random, 95% CI) | 0.90 [0.53, 1.52] |
| 3.2 Fluoxetine vs Milnacipran | 3 | 560 | Odds Ratio (M‐H, Random, 95% CI) | 0.98 [0.68, 1.42] |
| 3.3 Fluoxetine vs Venlafaxine | 14 | 2683 | Odds Ratio (M‐H, Random, 95% CI) | 0.89 [0.74, 1.06] |
| 4 Failure to complete ‐ Inefficacy Show forest plot | 18 | Odds Ratio (M‐H, Random, 95% CI) | Subtotals only | |
| 4.1 Fluoxetine vs Duloxetine | 2 | 432 | Odds Ratio (M‐H, Random, 95% CI) | 3.33 [0.92, 12.11] |
| 4.2 Fluoxetine vs Milnacipran | 3 | 560 | Odds Ratio (M‐H, Random, 95% CI) | 1.25 [0.68, 2.30] |
| 4.3 Fluoxetine vs Venlafaxine | 13 | 2640 | Odds Ratio (M‐H, Random, 95% CI) | 1.31 [0.91, 1.89] |
| 5 Failure to complete ‐ Side Effects Show forest plot | 18 | Odds Ratio (M‐H, Random, 95% CI) | Subtotals only | |
| 5.1 Fluoxetine vs Duloxetine | 2 | 532 | Odds Ratio (M‐H, Random, 95% CI) | 0.28 [0.07, 1.23] |
| 5.2 Fluoxetine vs Milnacipran | 3 | 560 | Odds Ratio (M‐H, Random, 95% CI) | 1.50 [0.81, 2.76] |
| 5.3 Fluoxetine vs Venlafaxine | 13 | 2640 | Odds Ratio (M‐H, Random, 95% CI) | 0.72 [0.56, 0.94] |
| Outcome or subgroup title | No. of studies | No. of participants | Statistical method | Effect size |
| 1 Failure to respond ‐ HDRS (‐50%) Show forest plot | 16 | Odds Ratio (M‐H, Random, 95% CI) | Subtotals only | |
| 1.1 Fluoxetine vs Agomelatine | 1 | 515 | Odds Ratio (M‐H, Random, 95% CI) | 1.44 [0.99, 2.09] |
| 1.2 Fluoxetine vs Mirtazapine | 4 | 600 | Odds Ratio (M‐H, Random, 95% CI) | 1.46 [1.04, 2.04] |
| 1.3 Fluoxetine vs Moclobemide | 7 | 721 | Odds Ratio (M‐H, Random, 95% CI) | 1.27 [0.92, 1.75] |
| 1.4 Fluoxetine vs Phenelzine | 1 | 40 | Odds Ratio (M‐H, Random, 95% CI) | 1.42 [0.27, 7.34] |
| 1.5 Fluoxetine vs Reboxetine | 3 | 721 | Odds Ratio (M‐H, Random, 95% CI) | 0.77 [0.55, 1.10] |
| 2 End‐point score on rating scales Show forest plot | 13 | Std. Mean Difference (IV, Random, 95% CI) | Subtotals only | |
| 2.1 Fluoxetine vs Agomelatine | 3 | 1213 | Std. Mean Difference (IV, Random, 95% CI) | 0.02 [‐0.18, 0.23] |
| 2.2 Fluoxetine vs Mirtazapine | 1 | 31 | Std. Mean Difference (IV, Random, 95% CI) | 0.57 [‐0.15, 1.29] |
| 2.3 Fluoxetine vs Moclobemide | 6 | 540 | Std. Mean Difference (IV, Random, 95% CI) | 0.13 [‐0.04, 0.30] |
| 2.4 Fluoxetine vs Phenelzine | 1 | 40 | Std. Mean Difference (IV, Random, 95% CI) | ‐0.05 [‐0.67, 0.57] |
| 2.5 Fluoxetine vs Reboxetine | 2 | 205 | Std. Mean Difference (IV, Random, 95% CI) | 0.04 [‐0.31, 0.40] |
| 3 Failure to complete ‐ Total Show forest plot | 17 | Odds Ratio (M‐H, Random, 95% CI) | Subtotals only | |
| 3.1 Fluoxetine vs Agomelatine | 2 | 785 | Odds Ratio (M‐H, Random, 95% CI) | 1.22 [0.59, 2.49] |
| 3.2 Fluoxetine vs Mirtazapine | 3 | 301 | Odds Ratio (M‐H, Random, 95% CI) | 0.92 [0.51, 1.68] |
| 3.3 Fluoxetine vs Moclobemide | 7 | 721 | Odds Ratio (M‐H, Random, 95% CI) | 1.01 [0.70, 1.47] |
| 3.4 Fluoxetine vs Phenelzine | 1 | 40 | Odds Ratio (M‐H, Random, 95% CI) | 0.18 [0.01, 4.01] |
| 3.5 Fluoxetine vs Reboxetine | 4 | 764 | Odds Ratio (M‐H, Random, 95% CI) | 0.60 [0.44, 0.83] |
| 4 Failure to complete ‐ Inefficacy Show forest plot | 16 | Odds Ratio (M‐H, Random, 95% CI) | Subtotals only | |
| 4.1 Fluoxetine vs Agomelatine | 2 | 785 | Odds Ratio (M‐H, Random, 95% CI) | 1.08 [0.41, 2.88] |
| 4.2 Fluoxetine vs Mirtazapine | 4 | 600 | Odds Ratio (M‐H, Random, 95% CI) | 1.45 [0.71, 2.96] |
| 4.3 Fluoxetine vs Moclobemide | 6 | 679 | Odds Ratio (M‐H, Random, 95% CI) | 0.70 [0.32, 1.56] |
| 4.4 Fluoxetine vs Phenelzine | 1 | 40 | Odds Ratio (M‐H, Random, 95% CI) | 0.0 [0.0, 0.0] |
| 4.5 Fluoxetine vs Reboxetine | 3 | 464 | Odds Ratio (M‐H, Random, 95% CI) | 0.92 [0.47, 1.77] |
| 5 Failure to complete ‐ Side Effects Show forest plot | 16 | Odds Ratio (M‐H, Random, 95% CI) | Subtotals only | |
| 5.1 Fluoxetine vs Agomelatine | 2 | 785 | Odds Ratio (M‐H, Random, 95% CI) | 1.50 [0.73, 3.08] |
| 5.2 Fluoxetine vs Mirtazapine | 4 | 600 | Odds Ratio (M‐H, Random, 95% CI) | 0.95 [0.54, 1.66] |
| 5.3 Fluoxetine vs Moclobemide | 7 | 721 | Odds Ratio (M‐H, Random, 95% CI) | 1.04 [0.54, 2.01] |
| 5.4 Fluoxetine vs Phenelzine | 1 | 40 | Odds Ratio (M‐H, Random, 95% CI) | 0.32 [0.01, 8.26] |
| 5.5 Fluoxetine vs Reboxetine | 2 | 211 | Odds Ratio (M‐H, Random, 95% CI) | 0.40 [0.10, 1.61] |
| Outcome or subgroup title | No. of studies | No. of participants | Statistical method | Effect size |
| 1 Failure to respond ‐ HDRS (‐50%) Show forest plot | 8 | Odds Ratio (M‐H, Random, 95% CI) | Subtotals only | |
| 1.1 Fluoxetine vs Amineptine | 1 | 63 | Odds Ratio (M‐H, Random, 95% CI) | 0.37 [0.13, 1.04] |
| 1.2 Fluoxetine vs Bupropion | 2 | 436 | Odds Ratio (M‐H, Random, 95% CI) | 0.83 [0.48, 1.43] |
| 1.3 Fluoxetine vs Pramipexole | 1 | 105 | Odds Ratio (M‐H, Random, 95% CI) | 0.55 [0.24, 1.26] |
| 1.4 Fluoxetine vs Tianeptine | 1 | 387 | Odds Ratio (M‐H, Random, 95% CI) | 1.12 [0.75, 1.67] |
| 1.5 Fluoxetine vs Trazodone | 3 | 110 | Odds Ratio (M‐H, Random, 95% CI) | 0.49 [0.13, 1.86] |
| 2 End‐point score on rating scales Show forest plot | 13 | Std. Mean Difference (IV, Random, 95% CI) | Subtotals only | |
| 2.1 Fluoxetine vs ABT‐200 | 1 | 141 | Std. Mean Difference (IV, Random, 95% CI) | ‐1.85 [‐2.25, ‐1.45] |
| 2.2 Fluoxetine vs Amisulpride | 1 | 268 | Std. Mean Difference (IV, Random, 95% CI) | 0.17 [‐0.07, 0.41] |
| 2.3 Fluoxetine vs Nefazodone | 4 | 271 | Std. Mean Difference (IV, Random, 95% CI) | ‐0.06 [‐0.30, 0.18] |
| 2.4 Fluoxetine vs Tianeptine | 3 | 730 | Std. Mean Difference (IV, Random, 95% CI) | ‐0.15 [‐0.40, 0.10] |
| 2.5 Fluoxetine vs Trazodone | 4 | 203 | Std. Mean Difference (IV, Random, 95% CI) | ‐0.25 [‐0.76, 0.26] |
| 3 Failure to complete ‐ Total Show forest plot | 17 | Odds Ratio (M‐H, Random, 95% CI) | Subtotals only | |
| 3.1 Fluoxetine vs ABT‐200 | 1 | 144 | Odds Ratio (M‐H, Random, 95% CI) | 0.18 [0.08, 0.39] |
| 3.2 Fluoxetine vs Amineptine | 2 | 232 | Odds Ratio (M‐H, Random, 95% CI) | 0.61 [0.17, 2.21] |
| 3.3 Fluoxetine vs Amisulpride | 1 | 281 | Odds Ratio (M‐H, Random, 95% CI) | 1.39 [0.81, 2.38] |
| 3.4 Fluoxetine vs Bupropion | 2 | 436 | Odds Ratio (M‐H, Random, 95% CI) | 1.00 [0.67, 1.48] |
| 3.5 Fluoxetine vs Nefazodone | 3 | 161 | Odds Ratio (M‐H, Random, 95% CI) | 0.54 [0.22, 1.31] |
| 3.6 Fluoxetine vs Pramipexole | 1 | 105 | Odds Ratio (M‐H, Random, 95% CI) | 0.12 [0.03, 0.42] |
| 3.7 Fluoxetine vs Tianeptine | 3 | 830 | Odds Ratio (M‐H, Random, 95% CI) | 0.96 [0.69, 1.33] |
| 3.8 Fluoxetine vs Trazodone | 4 | 230 | Odds Ratio (M‐H, Random, 95% CI) | 0.51 [0.23, 1.13] |
| 4 Failure to complete ‐ Inefficacy Show forest plot | 14 | Odds Ratio (M‐H, Random, 95% CI) | Subtotals only | |
| 4.1 Fluoxetine vs ABT‐200 | 1 | 144 | Odds Ratio (M‐H, Random, 95% CI) | 0.24 [0.03, 2.20] |
| 4.2 Fluoxetine vs Amineptine | 1 | 63 | Odds Ratio (M‐H, Random, 95% CI) | 1.04 [0.19, 5.57] |
| 4.3 Fluoxetine vs Amisulpride | 1 | 281 | Odds Ratio (M‐H, Random, 95% CI) | 1.16 [0.43, 3.10] |
| 4.4 Fluoxetine vs Bupropion | 2 | 436 | Odds Ratio (M‐H, Random, 95% CI) | 1.16 [0.33, 4.10] |
| 4.5 Fluoxetine vs Nefazodone | 3 | 161 | Odds Ratio (M‐H, Random, 95% CI) | 0.71 [0.05, 10.71] |
| 4.6 Fluoxetine vs Pramipexole | 1 | 105 | Odds Ratio (M‐H, Random, 95% CI) | 0.49 [0.05, 4.51] |
| 4.7 Fluoxetine vs Tianeptine | 3 | 830 | Odds Ratio (M‐H, Random, 95% CI) | 0.82 [0.27, 2.53] |
| 4.8 Fluoxetine vs Trazodone | 2 | 70 | Odds Ratio (M‐H, Random, 95% CI) | 0.23 [0.04, 1.51] |
| 5 Failure to complete ‐ Side Effects Show forest plot | 17 | Odds Ratio (M‐H, Random, 95% CI) | Subtotals only | |
| 5.1 Fluoxetine vs ABT‐200 | 1 | 144 | Odds Ratio (M‐H, Random, 95% CI) | 0.08 [0.02, 0.27] |
| 5.2 Fluoxetine vs Amineptine | 2 | 232 | Odds Ratio (M‐H, Random, 95% CI) | 0.52 [0.03, 7.82] |
| 5.3 Fluoxetine vs Amisulpride | 1 | 281 | Odds Ratio (M‐H, Random, 95% CI) | 0.77 [0.33, 1.82] |
| 5.4 Fluoxetine vs Bupropion | 2 | 436 | Odds Ratio (M‐H, Random, 95% CI) | 1.01 [0.45, 2.25] |
| 5.5 Fluoxetine vs Nefazodone | 4 | 286 | Odds Ratio (M‐H, Random, 95% CI) | 0.76 [0.32, 1.81] |
| 5.6 Fluoxetine vs Pramipexole | 1 | 105 | Odds Ratio (M‐H, Random, 95% CI) | 0.06 [0.01, 0.50] |
| 5.7 Fluoxetine vs Tianeptine | 3 | 830 | Odds Ratio (M‐H, Random, 95% CI) | 1.13 [0.71, 1.80] |
| 5.8 Fluoxetine vs Trazodone | 3 | 110 | Odds Ratio (M‐H, Random, 95% CI) | 0.66 [0.20, 2.19] |
| Outcome or subgroup title | No. of studies | No. of participants | Statistical method | Effect size |
| 1 Failure to respond ‐ HDRS (‐50%) Show forest plot | 7 | Odds Ratio (M‐H, Random, 95% CI) | Subtotals only | |
| 1.1 Fluoxetine vs Crocus Sativus | 1 | 40 | Odds Ratio (M‐H, Random, 95% CI) | 0.53 [0.11, 2.60] |
| 1.2 Fluoxetine vs Hypericum | 6 | 717 | Odds Ratio (M‐H, Random, 95% CI) | 0.98 [0.55, 1.73] |
| 2 End‐point score on rating scales Show forest plot | 5 | Std. Mean Difference (IV, Random, 95% CI) | Subtotals only | |
| 2.1 Fluoxetine vs Hypericum | 5 | 648 | Std. Mean Difference (IV, Random, 95% CI) | 0.13 [‐0.02, 0.29] |
| 3 Failure to complete ‐ Total Show forest plot | 6 | Odds Ratio (M‐H, Random, 95% CI) | Subtotals only | |
| 3.1 Fluoxetine vs Crocus Sativus | 1 | 40 | Odds Ratio (M‐H, Random, 95% CI) | 1.0 [0.06, 17.18] |
| 3.2 Fluoxetine vs Hypericum | 5 | 679 | Odds Ratio (M‐H, Random, 95% CI) | 1.04 [0.58, 1.85] |
| 4 Failure to complete ‐ Inefficacy Show forest plot | 2 | Odds Ratio (M‐H, Random, 95% CI) | Subtotals only | |
| 4.1 Fluoxetine vs Hypericum | 2 | 401 | Odds Ratio (M‐H, Random, 95% CI) | 4.70 [0.22, 99.39] |
| 5 Failure to complete ‐ Side Effects Show forest plot | 5 | Odds Ratio (M‐H, Random, 95% CI) | Subtotals only | |
| 5.1 Fluoxetine vs Hypericum | 5 | 679 | Odds Ratio (M‐H, Random, 95% CI) | 1.21 [0.56, 2.64] |
| Outcome or subgroup title | No. of studies | No. of participants | Statistical method | Effect size |
| 1 follow‐up <6 weeks Show forest plot | 5 | 341 | Odds Ratio (M‐H, Random, 95% CI) | 0.67 [0.35, 1.27] |
| 1.1 Fluoxetine vs Amitriptyline | 3 | 207 | Odds Ratio (M‐H, Random, 95% CI) | 0.56 [0.19, 1.65] |
| 1.2 Fluoxetine vs Clomipramine | 1 | 94 | Odds Ratio (M‐H, Random, 95% CI) | 0.63 [0.27, 1.45] |
| 1.3 Fluoxetine vs Imipramine | 1 | 40 | Odds Ratio (M‐H, Random, 95% CI) | 1.42 [0.27, 7.34] |
| 2 follow‐up 6‐16 weeks Show forest plot | 18 | 1742 | Odds Ratio (M‐H, Random, 95% CI) | 1.02 [0.80, 1.31] |
| 2.1 Fluoxetine vs Amitriptyline | 8 | 570 | Odds Ratio (M‐H, Random, 95% CI) | 1.06 [0.75, 1.50] |
| 2.2 Fluoxetine vs Desipramine | 2 | 84 | Odds Ratio (M‐H, Random, 95% CI) | 1.70 [0.56, 5.15] |
| 2.3 Fluoxetine vs Dothiepin/dosulepin | 2 | 144 | Odds Ratio (M‐H, Random, 95% CI) | 2.13 [1.08, 4.20] |
| 2.4 Fluoxetine vs Doxepine | 1 | 40 | Odds Ratio (M‐H, Random, 95% CI) | 1.0 [0.28, 3.54] |
| 2.5 Fluoxetine vs Imipramine | 4 | 721 | Odds Ratio (M‐H, Random, 95% CI) | 0.69 [0.36, 1.34] |
| 2.6 Fluoxetine vs Lofepramine | 1 | 183 | Odds Ratio (M‐H, Random, 95% CI) | 0.99 [0.55, 1.78] |
| Outcome or subgroup title | No. of studies | No. of participants | Statistical method | Effect size |
| 1 follow‐up <6 weeks Show forest plot | 12 | 541 | Std. Mean Difference (IV, Random, 95% CI) | 0.18 [‐0.15, 0.50] |
| 1.1 Fluoxetine vs Amiptriptyline | 6 | 290 | Std. Mean Difference (IV, Random, 95% CI) | 0.39 [‐0.25, 1.02] |
| 1.2 Fluoxetine vs Clomipramine | 2 | 124 | Std. Mean Difference (IV, Random, 95% CI) | ‐0.00 [‐0.36, 0.35] |
| 1.3 Fluoxetine vs Desipramine | 1 | 26 | Std. Mean Difference (IV, Random, 95% CI) | 0.05 [‐0.72, 0.82] |
| 1.4 Fluoxetine vs Imipramine | 2 | 60 | Std. Mean Difference (IV, Random, 95% CI) | ‐0.04 [‐1.31, 1.22] |
| 1.5 Fluoxetine vs Trimipramine | 1 | 41 | Std. Mean Difference (IV, Random, 95% CI) | 0.38 [‐0.24, 1.00] |
| 2 follow‐up 6‐16 weeks Show forest plot | 36 | 2727 | Std. Mean Difference (IV, Random, 95% CI) | 0.04 [‐0.06, 0.14] |
| 2.1 Fluoxetine vs Amiptriptyline | 13 | 733 | Std. Mean Difference (IV, Random, 95% CI) | 0.07 [‐0.07, 0.22] |
| 2.2 Fluoxetine vs Clomipramine | 3 | 248 | Std. Mean Difference (IV, Random, 95% CI) | ‐0.15 [‐0.40, 0.10] |
| 2.3 Fluoxetine vs Desipramine | 3 | 121 | Std. Mean Difference (IV, Random, 95% CI) | 0.33 [‐0.47, 1.12] |
| 2.4 Fluoxetine vs Dothiepin/dosulepin | 4 | 266 | Std. Mean Difference (IV, Random, 95% CI) | 0.16 [‐0.27, 0.59] |
| 2.5 Fluoxetine vs Imipramine | 10 | 1003 | Std. Mean Difference (IV, Random, 95% CI) | ‐0.01 [‐0.21, 0.19] |
| 2.6 Fluoxetine vs Lofepramine | 1 | 183 | Std. Mean Difference (IV, Random, 95% CI) | 0.13 [‐0.16, 0.42] |
| 2.7 Fluoxetine vs Nortriptyline | 1 | 154 | Std. Mean Difference (IV, Random, 95% CI) | ‐0.12 [‐0.44, 0.20] |
| 2.8 Fluoxetine vs Trimipramine | 1 | 19 | Std. Mean Difference (IV, Random, 95% CI) | 0.47 [‐0.44, 1.39] |
| 3 follow‐up >16 weeks Show forest plot | 1 | 97 | Std. Mean Difference (IV, Random, 95% CI) | ‐0.86 [‐1.27, ‐0.44] |
| 3.1 Fluoxetine vs Nortriptyline | 1 | 97 | Std. Mean Difference (IV, Random, 95% CI) | ‐0.86 [‐1.27, ‐0.44] |
| Outcome or subgroup title | No. of studies | No. of participants | Statistical method | Effect size |
| 1 follow‐up <6 weeks Show forest plot | 11 | 663 | Odds Ratio (M‐H, Random, 95% CI) | 0.70 [0.47, 1.05] |
| 1.1 Fluoxetine vs Amitriptyline | 6 | 309 | Odds Ratio (M‐H, Random, 95% CI) | 0.57 [0.29, 1.13] |
| 1.2 Fluoxetine vs Doxepine | 1 | 51 | Odds Ratio (M‐H, Random, 95% CI) | 1.25 [0.29, 5.31] |
| 1.3 Fluoxetine vs Imipramine | 3 | 98 | Odds Ratio (M‐H, Random, 95% CI) | 0.56 [0.10, 3.13] |
| 1.4 Fluoxetine vs Nortriptyline | 1 | 205 | Odds Ratio (M‐H, Random, 95% CI) | 0.77 [0.44, 1.35] |
| 2 follow‐up 6‐16 weeks Show forest plot | 36 | 3450 | Odds Ratio (M‐H, Random, 95% CI) | 0.79 [0.63, 0.98] |
| 2.1 Fluoxetine vs Amitriptyline | 12 | 780 | Odds Ratio (M‐H, Random, 95% CI) | 0.63 [0.44, 0.90] |
| 2.2 Fluoxetine vs Clomipramine | 2 | 263 | Odds Ratio (M‐H, Random, 95% CI) | 0.65 [0.38, 1.14] |
| 2.3 Fluoxetine vs Desipramine | 2 | 104 | Odds Ratio (M‐H, Random, 95% CI) | 0.44 [0.16, 1.24] |
| 2.4 Fluoxetine vs Dothiepin/dosulepin | 5 | 478 | Odds Ratio (M‐H, Random, 95% CI) | 1.57 [0.92, 2.69] |
| 2.5 Fluoxetine vs Doxepine | 3 | 272 | Odds Ratio (M‐H, Random, 95% CI) | 0.78 [0.44, 1.40] |
| 2.6 Fluoxetine vs Imipramine | 9 | 1127 | Odds Ratio (M‐H, Random, 95% CI) | 0.81 [0.51, 1.27] |
| 2.7 Fluoxetine vs Lofepramine | 1 | 183 | Odds Ratio (M‐H, Random, 95% CI) | 0.50 [0.24, 1.04] |
| 2.8 Fluoxetine vs Nortriptyline | 2 | 243 | Odds Ratio (M‐H, Random, 95% CI) | 0.82 [0.17, 3.93] |
| Outcome or subgroup title | No. of studies | No. of participants | Statistical method | Effect size |
| 1 follow‐up <6 weeks Show forest plot | 5 | 401 | Odds Ratio (M‐H, Random, 95% CI) | 0.49 [0.16, 1.50] |
| 1.1 Fluoxetine vs Amitriptyline | 2 | 105 | Odds Ratio (M‐H, Random, 95% CI) | 0.38 [0.07, 2.09] |
| 1.2 Fluoxetine vs Doxepine | 1 | 51 | Odds Ratio (M‐H, Random, 95% CI) | 0.0 [0.0, 0.0] |
| 1.3 Fluoxetine vs Imipramine | 1 | 40 | Odds Ratio (M‐H, Random, 95% CI) | 3.15 [0.12, 82.16] |
| 1.4 Fluoxetine vs Nortriptyiline | 1 | 205 | Odds Ratio (M‐H, Random, 95% CI) | 0.38 [0.07, 2.03] |
| 2 follow‐up 6‐16 weeks Show forest plot | 28 | 2510 | Odds Ratio (M‐H, Random, 95% CI) | 1.38 [1.02, 1.87] |
| 2.1 Fluoxetine vs Amitriptyline | 11 | 730 | Odds Ratio (M‐H, Random, 95% CI) | 1.11 [0.50, 2.47] |
| 2.2 Fluoxetine vs Clomipramine | 1 | 120 | Odds Ratio (M‐H, Random, 95% CI) | 7.37 [0.37, 145.75] |
| 2.3 Fluoxetine vs Desipramine | 2 | 104 | Odds Ratio (M‐H, Random, 95% CI) | 1.03 [0.20, 5.35] |
| 2.4 Fluoxetine vs Dothiepin/dosulepin | 3 | 271 | Odds Ratio (M‐H, Random, 95% CI) | 1.34 [0.49, 3.66] |
| 2.5 Fluoxetine vs Doxepine | 2 | 232 | Odds Ratio (M‐H, Random, 95% CI) | 1.72 [0.60, 4.92] |
| 2.6 Fluoxetine vs Imipramine | 9 | 1053 | Odds Ratio (M‐H, Random, 95% CI) | 1.40 [0.96, 2.04] |
| Outcome or subgroup title | No. of studies | No. of participants | Statistical method | Effect size |
| 1 follow‐up <6 weeks Show forest plot | 7 | 554 | Odds Ratio (M‐H, Random, 95% CI) | 0.81 [0.46, 1.43] |
| 1.1 Fluoxetine vs Amitriptyline | 4 | 258 | Odds Ratio (M‐H, Random, 95% CI) | 0.62 [0.21, 1.82] |
| 1.2 Fluoxetine vs Doxepine | 1 | 51 | Odds Ratio (M‐H, Random, 95% CI) | 3.13 [0.30, 32.31] |
| 1.3 Fluoxetine vs Imipramine | 1 | 40 | Odds Ratio (M‐H, Random, 95% CI) | 0.63 [0.09, 4.24] |
| 1.4 Fluoxetine vs Nortriptyline | 1 | 205 | Odds Ratio (M‐H, Random, 95% CI) | 0.86 [0.42, 1.77] |
| 2 follow‐up 6‐16 weeks Show forest plot | 33 | 3093 | Odds Ratio (M‐H, Random, 95% CI) | 0.51 [0.36, 0.72] |
| 2.1 Fluoxetine vs Amitriptyline | 12 | 780 | Odds Ratio (M‐H, Random, 95% CI) | 0.33 [0.18, 0.61] |
| 2.2 Fluoxetine vs Clomipramine | 2 | 263 | Odds Ratio (M‐H, Random, 95% CI) | 0.30 [0.12, 0.79] |
| 2.3 Fluoxetine vs Desipramine | 2 | 104 | Odds Ratio (M‐H, Random, 95% CI) | 0.27 [0.04, 1.68] |
| 2.4 Fluoxetine vs Dothiepin/dosulepin | 5 | 478 | Odds Ratio (M‐H, Random, 95% CI) | 2.05 [0.59, 7.16] |
| 2.5 Fluoxetine vs Doxepine | 2 | 232 | Odds Ratio (M‐H, Random, 95% CI) | 0.73 [0.42, 1.28] |
| 2.6 Fluoxetine vs Imipramine | 9 | 1053 | Odds Ratio (M‐H, Random, 95% CI) | 0.47 [0.25, 0.87] |
| 2.7 Fluoxetine vs Lofepramine | 1 | 183 | Odds Ratio (M‐H, Random, 95% CI) | 0.16 [0.02, 1.38] |
| Outcome or subgroup title | No. of studies | No. of participants | Statistical method | Effect size |
| 1 follow‐up <6 weeks Show forest plot | 2 | Std. Mean Difference (IV, Random, 95% CI) | Subtotals only | |
| 1.1 Fluoxetine vs Maprotiline | 2 | 181 | Std. Mean Difference (IV, Random, 95% CI) | 0.06 [‐0.34, 0.46] |
| 2 follow‐up 6‐16 weeks Show forest plot | 6 | Std. Mean Difference (IV, Random, 95% CI) | Subtotals only | |
| 2.1 Fluoxetine vs Maprotiline | 3 | 252 | Std. Mean Difference (IV, Random, 95% CI) | 0.05 [‐0.20, 0.30] |
| 2.2 Fluoxetine vs Mianserin | 3 | 128 | Std. Mean Difference (IV, Random, 95% CI) | 0.43 [‐0.38, 1.23] |
| Outcome or subgroup title | No. of studies | No. of participants | Statistical method | Effect size |
| 1 follow‐up <6 weeks Show forest plot | 2 | Odds Ratio (M‐H, Random, 95% CI) | Subtotals only | |
| 1.1 Fluoxetine vs Maprotiline | 2 | 188 | Odds Ratio (M‐H, Random, 95% CI) | 1.54 [0.63, 3.75] |
| 2 follow‐up 6‐16 weeks Show forest plot | 4 | Odds Ratio (M‐H, Random, 95% CI) | Subtotals only | |
| 2.1 Fluoxetine vs Maprotiline | 2 | 163 | Odds Ratio (M‐H, Random, 95% CI) | 2.06 [0.75, 5.63] |
| 2.2 Fluoxetine vs Mianserin | 2 | 93 | Odds Ratio (M‐H, Random, 95% CI) | 0.63 [0.18, 2.25] |
| Outcome or subgroup title | No. of studies | No. of participants | Statistical method | Effect size |
| 1 follow‐up <6 weeks Show forest plot | 1 | Odds Ratio (M‐H, Random, 95% CI) | Subtotals only | |
| 1.1 Fluoxetine vs Maprotiline | 1 | 46 | Odds Ratio (M‐H, Random, 95% CI) | 0.0 [0.0, 0.0] |
| 2 follow‐up 6‐16 weeks Show forest plot | 3 | Odds Ratio (M‐H, Random, 95% CI) | Subtotals only | |
| 2.1 Fluoxetine vs Maprotiline | 2 | 163 | Odds Ratio (M‐H, Random, 95% CI) | 2.54 [0.33, 19.19] |
| 2.2 Fluoxetine vs Mianserin | 1 | 53 | Odds Ratio (M‐H, Random, 95% CI) | 2.27 [0.38, 13.63] |
| Outcome or subgroup title | No. of studies | No. of participants | Statistical method | Effect size |
| 1 follow‐up <6 weeks Show forest plot | 1 | Odds Ratio (M‐H, Random, 95% CI) | Subtotals only | |
| 1.1 Fluoxetine vs Maprotiline | 1 | 46 | Odds Ratio (M‐H, Random, 95% CI) | 0.41 [0.07, 2.49] |
| 2 follow‐up 6‐16 weeks Show forest plot | 3 | Odds Ratio (M‐H, Random, 95% CI) | Subtotals only | |
| 2.1 Fluoxetine vs Maprotiline | 2 | 163 | Odds Ratio (M‐H, Random, 95% CI) | 0.69 [0.11, 4.38] |
| 2.2 Fluoxetine vs Mianserin | 1 | 53 | Odds Ratio (M‐H, Random, 95% CI) | 1.05 [0.23, 4.70] |
| Outcome or subgroup title | No. of studies | No. of participants | Statistical method | Effect size |
| 1 follow‐up <6 weeks Show forest plot | 1 | Odds Ratio (M‐H, Random, 95% CI) | Subtotals only | |
| 1.1 Fluoxetine vs Citalopram | 1 | 59 | Odds Ratio (M‐H, Random, 95% CI) | 0.60 [0.20, 1.79] |
| 2 follow‐up 6‐16 weeks Show forest plot | 15 | Odds Ratio (M‐H, Random, 95% CI) | Subtotals only | |
| 2.1 Fluoxetine vs Fluvoxamine | 1 | 177 | Odds Ratio (M‐H, Random, 95% CI) | 0.95 [0.52, 1.74] |
| 2.2 Fluoxetine vs Paroxetine | 9 | 1574 | Odds Ratio (M‐H, Random, 95% CI) | 1.23 [0.93, 1.65] |
| 2.3 Fluoxetine vs Sertraline | 5 | 950 | Odds Ratio (M‐H, Random, 95% CI) | 1.31 [1.00, 1.71] |
| 2.4 Fluoxetine vs Escitalopram | 1 | 240 | Odds Ratio (M‐H, Random, 95% CI) | 1.02 [0.56, 1.85] |
| 3 follow‐up >16 weeks Show forest plot | 1 | Odds Ratio (M‐H, Random, 95% CI) | Subtotals only | |
| 3.1 Fluoxetine vs Sertraline | 1 | 238 | Odds Ratio (M‐H, Random, 95% CI) | 1.67 [0.97, 2.85] |
| Outcome or subgroup title | No. of studies | No. of participants | Statistical method | Effect size |
| 1 follow‐up <6 weeks Show forest plot | 1 | Std. Mean Difference (IV, Random, 95% CI) | Subtotals only | |
| 1.1 Fluoxetine vs Citalopram | 1 | 51 | Std. Mean Difference (IV, Random, 95% CI) | 0.07 [‐0.48, 0.61] |
| 2 follow‐up >16 weeks Show forest plot | 2 | Std. Mean Difference (IV, Random, 95% CI) | Subtotals only | |
| 2.1 Fluoxetine vs Paroxetine | 1 | 242 | Std. Mean Difference (IV, Random, 95% CI) | 0.24 [‐0.01, 0.49] |
| 2.2 Fluoxetine vs Sertraline | 1 | 168 | Std. Mean Difference (IV, Random, 95% CI) | 0.22 [‐0.08, 0.53] |
| 3 follow‐up 6‐16 weeks Show forest plot | 18 | Std. Mean Difference (IV, Random, 95% CI) | Subtotals only | |
| 3.1 Fluoxetine vs Citalopram | 2 | 610 | Std. Mean Difference (IV, Random, 95% CI) | 0.05 [‐0.10, 0.21] |
| 3.2 Fluoxetine vs Paroxetine | 10 | 1819 | Std. Mean Difference (IV, Random, 95% CI) | ‐0.03 [‐0.31, 0.24] |
| 3.3 Fluoxetine vs Sertraline | 6 | 992 | Std. Mean Difference (IV, Random, 95% CI) | 0.06 [‐0.06, 0.19] |
| 3.4 Fluoxetine vs Escitalopram | 1 | 231 | Std. Mean Difference (IV, Random, 95% CI) | 0.07 [‐0.19, 0.33] |
| Outcome or subgroup title | No. of studies | No. of participants | Statistical method | Effect size |
| 1 follow‐up <6 weeks Show forest plot | 1 | Odds Ratio (M‐H, Random, 95% CI) | Subtotals only | |
| 1.1 Fluoxetine vs Citalopram | 1 | 59 | Odds Ratio (M‐H, Random, 95% CI) | 0.96 [0.22, 4.27] |
| 2 follow‐up 6‐16 weeks Show forest plot | 21 | Odds Ratio (M‐H, Random, 95% CI) | Subtotals only | |
| 2.1 Fluoxetine vs Citalopram | 2 | 673 | Odds Ratio (M‐H, Random, 95% CI) | 0.87 [0.59, 1.27] |
| 2.2 Fluoxetine vs Fluvoxamine | 2 | 284 | Odds Ratio (M‐H, Random, 95% CI) | 0.71 [0.36, 1.37] |
| 2.3 Fluoxetine vs Paroxetine | 9 | 1606 | Odds Ratio (M‐H, Random, 95% CI) | 1.00 [0.81, 1.25] |
| 2.4 Fluoxetine vs Sertraline | 7 | 1111 | Odds Ratio (M‐H, Random, 95% CI) | 1.12 [0.85, 1.48] |
| 2.5 Fluoxetine vs Escitalopram | 2 | 578 | Odds Ratio (M‐H, Random, 95% CI) | 1.53 [1.00, 2.37] |
| 3 follow‐up >16 weeks Show forest plot | 3 | Odds Ratio (M‐H, Random, 95% CI) | Subtotals only | |
| 3.1 Fluoxetine vs Paroxetine | 1 | 242 | Odds Ratio (M‐H, Random, 95% CI) | 0.89 [0.53, 1.49] |
| 3.2 Fluoxetine vs Sertraline | 2 | 480 | Odds Ratio (M‐H, Random, 95% CI) | 1.33 [0.84, 2.09] |
| Outcome or subgroup title | No. of studies | No. of participants | Statistical method | Effect size |
| 1 follow‐up <6 weeks Show forest plot | 1 | Odds Ratio (M‐H, Random, 95% CI) | Subtotals only | |
| 1.1 Fluoxetine vs Citalopram | 1 | 59 | Odds Ratio (M‐H, Random, 95% CI) | 0.47 [0.04, 5.43] |
| 2 follow‐up >16 weeks Show forest plot | 1 | Odds Ratio (M‐H, Random, 95% CI) | Subtotals only | |
| 2.1 Fluoxetine vs Sertraline | 1 | 238 | Odds Ratio (M‐H, Random, 95% CI) | 0.98 [0.47, 2.07] |
| 3 follow‐up 6‐16 weeks Show forest plot | 11 | Odds Ratio (M‐H, Random, 95% CI) | Subtotals only | |
| 3.1 Fluoxetine vs Citalopram | 2 | 673 | Odds Ratio (M‐H, Random, 95% CI) | 0.90 [0.49, 1.65] |
| 3.2 Fluoxetine vs Paroxetine | 4 | 1005 | Odds Ratio (M‐H, Random, 95% CI) | 0.75 [0.41, 1.39] |
| 3.3 Fluoxetine vs Sertraline | 4 | 818 | Odds Ratio (M‐H, Random, 95% CI) | 1.18 [0.61, 2.29] |
| 3.4 Fluoxetine vs Escitalopram | 2 | 578 | Odds Ratio (M‐H, Random, 95% CI) | 1.74 [0.46, 6.53] |
| Outcome or subgroup title | No. of studies | No. of participants | Statistical method | Effect size |
| 1 follow‐up <6 weeks Show forest plot | 1 | Odds Ratio (M‐H, Random, 95% CI) | Subtotals only | |
| 1.1 Fluoxetine vs Citalopram | 1 | 59 | Odds Ratio (M‐H, Random, 95% CI) | 1.5 [0.23, 9.70] |
| 2 follow‐up 6‐16 weeks Show forest plot | 20 | Odds Ratio (M‐H, Random, 95% CI) | Subtotals only | |
| 2.1 Fluoxetine vs Citalopram | 2 | 673 | Odds Ratio (M‐H, Random, 95% CI) | 0.57 [0.29, 1.12] |
| 2.2 Fluoxetine vs Fluvoxamine | 1 | 100 | Odds Ratio (M‐H, Random, 95% CI) | 1.04 [0.14, 7.71] |
| 2.3 Fluoxetine vs Paroxetine | 9 | 1509 | Odds Ratio (M‐H, Random, 95% CI) | 0.85 [0.62, 1.16] |
| 2.4 Fluoxetine vs Sertraline | 7 | 1111 | Odds Ratio (M‐H, Random, 95% CI) | 1.21 [0.85, 1.71] |
| 2.5 Fluoxetina vs Escitalopram | 2 | 578 | Odds Ratio (M‐H, Random, 95% CI) | 1.17 [0.64, 2.12] |
| 3 follow‐up >16 weeks Show forest plot | 2 | Odds Ratio (M‐H, Random, 95% CI) | Subtotals only | |
| 3.1 Fluoxetine vs Sertraline | 2 | 480 | Odds Ratio (M‐H, Random, 95% CI) | 1.41 [0.72, 2.76] |
| Outcome or subgroup title | No. of studies | No. of participants | Statistical method | Effect size |
| 1 follow‐up <6 weeks Show forest plot | 1 | Odds Ratio (M‐H, Random, 95% CI) | Subtotals only | |
| 1.1 Fluoxetine vs Moclobemide | 1 | 70 | Odds Ratio (M‐H, Random, 95% CI) | 1.01 [0.39, 2.60] |
| 2 follow‐up 6‐16 weeks Show forest plot | 15 | Odds Ratio (M‐H, Random, 95% CI) | Subtotals only | |
| 2.1 Fluoxetine vs Agomelatine | 1 | 515 | Odds Ratio (M‐H, Random, 95% CI) | 1.44 [0.99, 2.09] |
| 2.2 Fluoxetine vs Mirtazapine | 4 | 600 | Odds Ratio (M‐H, Random, 95% CI) | 1.46 [1.04, 2.04] |
| 2.3 Fluoxetine vs Moclobemide | 6 | 651 | Odds Ratio (M‐H, Random, 95% CI) | 1.31 [0.90, 1.89] |
| 2.4 Fluoxetine vs Phenelzine | 1 | 40 | Odds Ratio (M‐H, Random, 95% CI) | 1.42 [0.27, 7.34] |
| 2.5 Fluoxetine vs Reboxetine | 3 | 721 | Odds Ratio (M‐H, Random, 95% CI) | 0.77 [0.55, 1.10] |
| Outcome or subgroup title | No. of studies | No. of participants | Statistical method | Effect size |
| 1 follow‐up <6 weeks Show forest plot | 1 | Std. Mean Difference (IV, Random, 95% CI) | Subtotals only | |
| 1.1 Fluoxetine vs Moclobemide | 1 | 53 | Std. Mean Difference (IV, Random, 95% CI) | ‐0.12 [‐0.66, 0.42] |
| 2 follow‐up 6‐16 weeks Show forest plot | 12 | Std. Mean Difference (IV, Random, 95% CI) | Subtotals only | |
| 2.1 Fluoxetine vs Agomelatine | 3 | 1213 | Std. Mean Difference (IV, Random, 95% CI) | 0.02 [‐0.18, 0.23] |
| 2.2 Fluoxetine vs Mirtazapine | 1 | 31 | Std. Mean Difference (IV, Random, 95% CI) | 0.57 [‐0.15, 1.29] |
| 2.3 Fluoxetine vs Moclobemide | 5 | 487 | Std. Mean Difference (IV, Random, 95% CI) | 0.16 [‐0.02, 0.33] |
| 2.4 Fluoxetine vs Phenelzine | 1 | 40 | Std. Mean Difference (IV, Random, 95% CI) | ‐0.05 [‐0.67, 0.57] |
| 2.5 Fluoxetine vs Reboxetine | 2 | 205 | Std. Mean Difference (IV, Random, 95% CI) | 0.04 [‐0.31, 0.40] |
| Outcome or subgroup title | No. of studies | No. of participants | Statistical method | Effect size |
| 1 follow‐up <6 weeks Show forest plot | 1 | Odds Ratio (M‐H, Random, 95% CI) | Subtotals only | |
| 1.1 Fluoxetine vs Moclobemide | 1 | 70 | Odds Ratio (M‐H, Random, 95% CI) | 0.92 [0.31, 2.76] |
| 2 follow‐up 6‐16 weeks Show forest plot | 15 | Odds Ratio (M‐H, Random, 95% CI) | Subtotals only | |
| 2.1 Fluoxetina vs Agomelatine | 2 | 785 | Odds Ratio (M‐H, Random, 95% CI) | 1.22 [0.59, 2.49] |
| 2.2 Fluoxetine vs Mirtazapine | 3 | 301 | Odds Ratio (M‐H, Random, 95% CI) | 0.92 [0.51, 1.68] |
| 2.3 Fluoxetine vs Moclobemide | 6 | 651 | Odds Ratio (M‐H, Random, 95% CI) | 1.02 [0.68, 1.53] |
| 2.4 Fluoxetine vs Reboxetine | 4 | 764 | Odds Ratio (M‐H, Random, 95% CI) | 0.60 [0.44, 0.83] |
| Outcome or subgroup title | No. of studies | No. of participants | Statistical method | Effect size |
| 1 follow‐up <6 weeks Show forest plot | 1 | Odds Ratio (M‐H, Random, 95% CI) | Subtotals only | |
| 1.1 Fluoxetine vs Moclobemide | 1 | 70 | Odds Ratio (M‐H, Random, 95% CI) | 1.06 [0.20, 5.68] |
| 2 follow‐up 6‐16 weeks Show forest plot | 15 | Odds Ratio (M‐H, Random, 95% CI) | Subtotals only | |
| 2.1 Fluoxetine vs Agomelatine | 2 | 785 | Odds Ratio (M‐H, Random, 95% CI) | 1.08 [0.41, 2.88] |
| 2.2 Fluoxetine vs Mirtazapine | 4 | 600 | Odds Ratio (M‐H, Random, 95% CI) | 1.45 [0.71, 2.96] |
| 2.3 Fluoxetine vs Moclobemide | 5 | 609 | Odds Ratio (M‐H, Random, 95% CI) | 0.61 [0.23, 1.65] |
| 2.4 Fluoxetine vs Phenelzine | 1 | 40 | Odds Ratio (M‐H, Random, 95% CI) | 0.0 [0.0, 0.0] |
| 2.5 Fluoxetine vs Reboxetine | 3 | 464 | Odds Ratio (M‐H, Random, 95% CI) | 0.92 [0.47, 1.77] |
| Outcome or subgroup title | No. of studies | No. of participants | Statistical method | Effect size |
| 1 follow‐up <6 weeks Show forest plot | 1 | Odds Ratio (M‐H, Random, 95% CI) | Subtotals only | |
| 1.1 Fluoxetine vs Moclobemide | 1 | 70 | Odds Ratio (M‐H, Random, 95% CI) | 0.0 [0.0, 0.0] |
| 2 follow‐up 6‐16 weeks Show forest plot | 15 | Odds Ratio (M‐H, Random, 95% CI) | Subtotals only | |
| 2.1 Fluoxetine vs Agomelatine | 2 | 785 | Odds Ratio (M‐H, Random, 95% CI) | 1.50 [0.73, 3.08] |
| 2.2 Fluoxetine vs Mirtazapine | 4 | 600 | Odds Ratio (M‐H, Random, 95% CI) | 0.95 [0.54, 1.66] |
| 2.3 Fluoxetine vs Moclobemide | 6 | 651 | Odds Ratio (M‐H, Random, 95% CI) | 1.04 [0.54, 2.01] |
| 2.4 Fluoxetine vs Phenelzine | 1 | 40 | Odds Ratio (M‐H, Random, 95% CI) | 0.32 [0.01, 8.26] |
| 2.5 Fluoxetine vs Reboxetine | 2 | 211 | Odds Ratio (M‐H, Random, 95% CI) | 0.40 [0.10, 1.61] |