| 1 Failure to respond ‐ HDRS (‐50%) Show forest plot | 24 | 2124 | Odds Ratio (M‐H, Random, 95% CI) | 0.97 [0.77, 1.22] |
|
| 1.1 Fluoxetine vs Amitriptyline | 11 | 777 | Odds Ratio (M‐H, Random, 95% CI) | 0.93 [0.68, 1.28] |
| 1.2 Fluoxetine vs Clomipramine | 1 | 94 | Odds Ratio (M‐H, Random, 95% CI) | 0.63 [0.27, 1.45] |
| 1.3 Fluoxetine vs Desipramine | 2 | 84 | Odds Ratio (M‐H, Random, 95% CI) | 1.70 [0.56, 5.15] |
| 1.4 Fluoxetine vs Dothiepin/dosulepin | 2 | 144 | Odds Ratio (M‐H, Random, 95% CI) | 2.13 [1.08, 4.20] |
| 1.5 Fluoxetine vs Doxepine | 1 | 40 | Odds Ratio (M‐H, Random, 95% CI) | 1.0 [0.28, 3.54] |
| 1.6 Fluoxetine vs Imipramine | 5 | 761 | Odds Ratio (M‐H, Random, 95% CI) | 0.74 [0.41, 1.35] |
| 1.7 Fluoxetine vs Lofepramine | 1 | 183 | Odds Ratio (M‐H, Random, 95% CI) | 0.99 [0.55, 1.78] |
| 1.8 Fluoxetine vs Trimipramine | 1 | 41 | Odds Ratio (M‐H, Random, 95% CI) | 2.05 [0.56, 7.45] |
| 2 End‐point score on rating scale Show forest plot | 50 | 3393 | Std. Mean Difference (IV, Random, 95% CI) | 0.03 [‐0.07, 0.14] |
|
| 2.1 Fluoxetine vs Amiptriptyline | 19 | 1023 | Std. Mean Difference (IV, Random, 95% CI) | 0.10 [‐0.09, 0.29] |
| 2.2 Fluoxetine vs Clomipramine | 5 | 372 | Std. Mean Difference (IV, Random, 95% CI) | ‐0.10 [‐0.31, 0.10] |
| 2.3 Fluoxetine vs Desipramine | 4 | 147 | Std. Mean Difference (IV, Random, 95% CI) | 0.27 [‐0.32, 0.86] |
| 2.4 Fluoxetine vs Dothiepin/dosulepin | 4 | 266 | Std. Mean Difference (IV, Random, 95% CI) | 0.16 [‐0.27, 0.59] |
| 2.5 Fluoxetine vs Imipramine | 12 | 1063 | Std. Mean Difference (IV, Random, 95% CI) | ‐0.01 [‐0.21, 0.19] |
| 2.6 Fluoxetine vs Lofepramine | 1 | 183 | Std. Mean Difference (IV, Random, 95% CI) | 0.13 [‐0.16, 0.42] |
| 2.7 Fluoxetine vs Nomifensine | 1 | 28 | Std. Mean Difference (IV, Random, 95% CI) | ‐0.37 [‐1.12, 0.38] |
| 2.8 Fluoxetine vs Nortriptyline | 2 | 251 | Std. Mean Difference (IV, Random, 95% CI) | ‐0.48 [‐1.20, 0.24] |
| 2.9 Fluoxetine vs Trimipramine | 2 | 60 | Std. Mean Difference (IV, Random, 95% CI) | 0.41 [‐0.10, 0.92] |
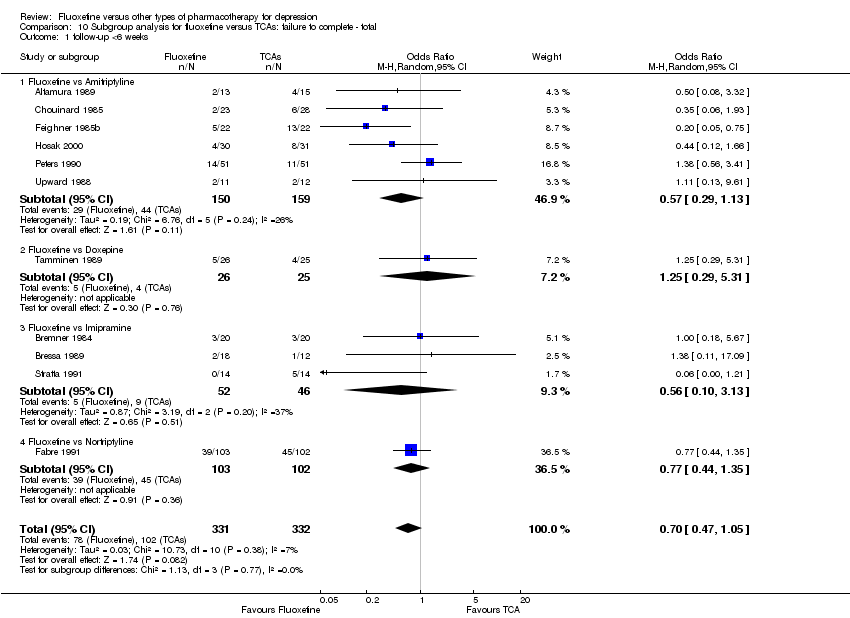
| 3 Failure to complete ‐ Total Show forest plot | 49 | 4194 | Odds Ratio (M‐H, Random, 95% CI) | 0.79 [0.65, 0.96] |
|
| 3.1 Fluoxetine vs Amitriptyline | 18 | 1089 | Odds Ratio (M‐H, Random, 95% CI) | 0.62 [0.46, 0.85] |
| 3.2 Fluoxetine vs Clomipramine | 2 | 263 | Odds Ratio (M‐H, Random, 95% CI) | 0.65 [0.38, 1.14] |
| 3.3 Fluoxetine vs Desipramine | 2 | 104 | Odds Ratio (M‐H, Random, 95% CI) | 0.44 [0.16, 1.24] |
| 3.4 Fluoxetine vs Dothiepin/dosulepin | 5 | 478 | Odds Ratio (M‐H, Random, 95% CI) | 1.57 [0.92, 2.69] |
| 3.5 Fluoxetine vs Doxepine | 4 | 323 | Odds Ratio (M‐H, Random, 95% CI) | 0.81 [0.49, 1.32] |
| 3.6 Fluoxetine vs Imipramine | 12 | 1225 | Odds Ratio (M‐H, Random, 95% CI) | 0.79 [0.51, 1.21] |
| 3.7 Fluoxetine vs Lofepramine | 1 | 183 | Odds Ratio (M‐H, Random, 95% CI) | 0.50 [0.24, 1.04] |
| 3.8 Fluoxetine vs Nomifensine | 1 | 40 | Odds Ratio (M‐H, Random, 95% CI) | 6.33 [0.67, 60.16] |
| 3.9 Fluoxetine vs Nortriptyline | 3 | 448 | Odds Ratio (M‐H, Random, 95% CI) | 0.73 [0.36, 1.47] |
| 3.10 Fluoxetine vs Trimipramine | 1 | 41 | Odds Ratio (M‐H, Random, 95% CI) | 2.0 [0.41, 9.78] |
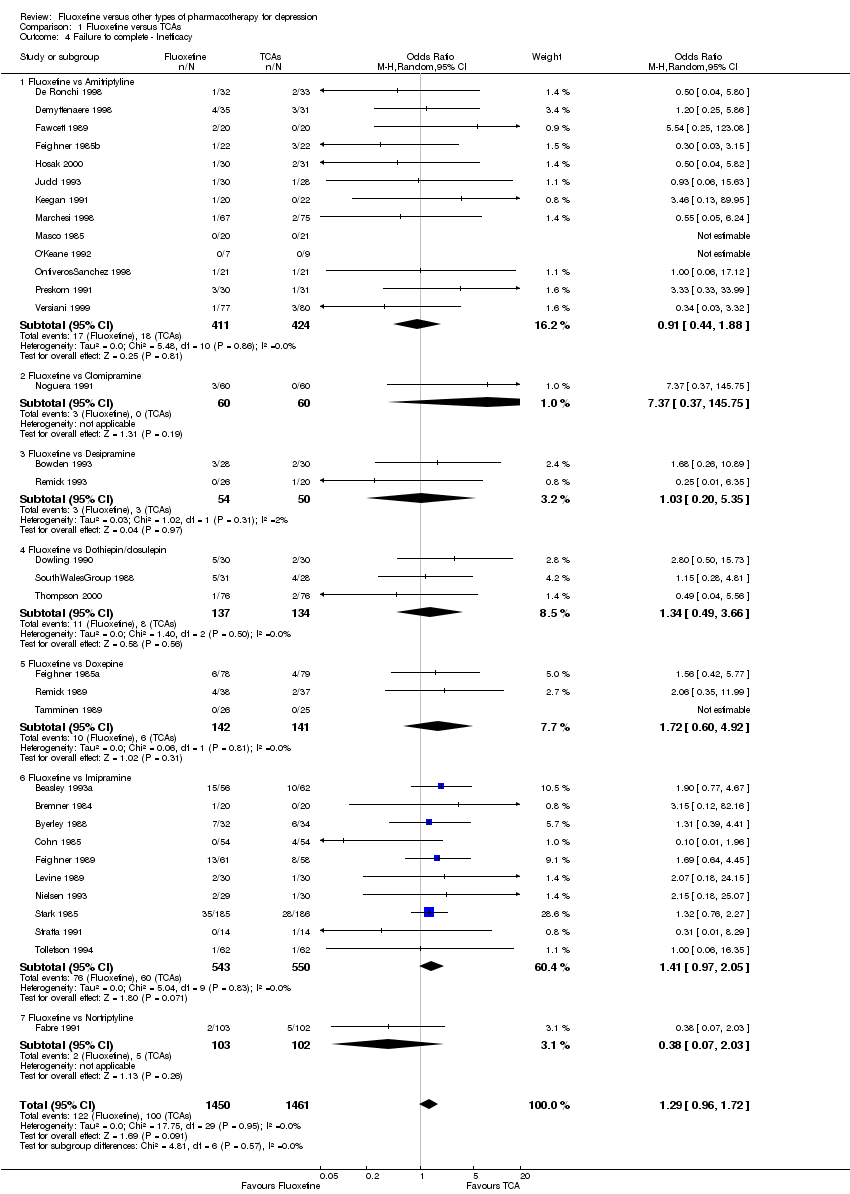
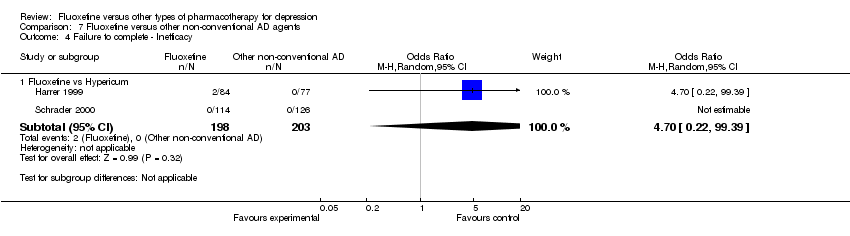
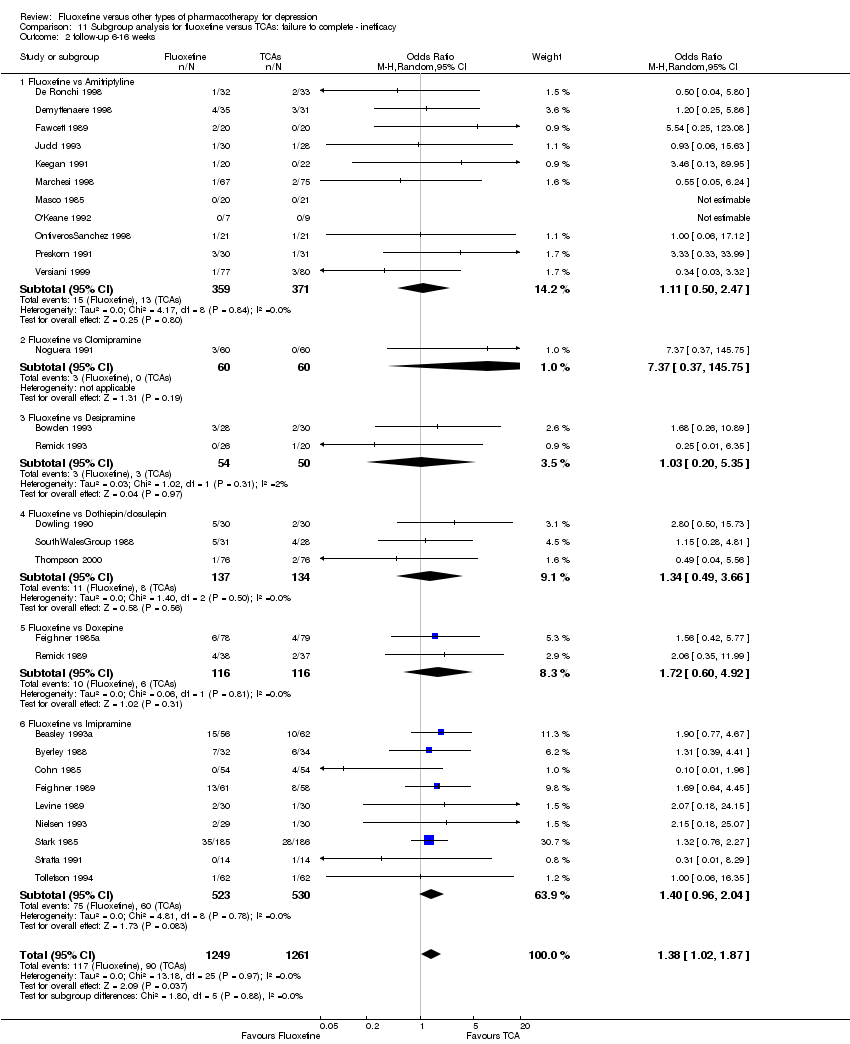
| 4 Failure to complete ‐ Inefficacy Show forest plot | 33 | 2911 | Odds Ratio (M‐H, Random, 95% CI) | 1.29 [0.96, 1.72] |
|
| 4.1 Fluoxetine vs Amitriptyline | 13 | 835 | Odds Ratio (M‐H, Random, 95% CI) | 0.91 [0.44, 1.88] |
| 4.2 Fluoxetine vs Clomipramine | 1 | 120 | Odds Ratio (M‐H, Random, 95% CI) | 7.37 [0.37, 145.75] |
| 4.3 Fluoxetine vs Desipramine | 2 | 104 | Odds Ratio (M‐H, Random, 95% CI) | 1.03 [0.20, 5.35] |
| 4.4 Fluoxetine vs Dothiepin/dosulepin | 3 | 271 | Odds Ratio (M‐H, Random, 95% CI) | 1.34 [0.49, 3.66] |
| 4.5 Fluoxetine vs Doxepine | 3 | 283 | Odds Ratio (M‐H, Random, 95% CI) | 1.72 [0.60, 4.92] |
| 4.6 Fluoxetine vs Imipramine | 10 | 1093 | Odds Ratio (M‐H, Random, 95% CI) | 1.41 [0.97, 2.05] |
| 4.7 Fluoxetine vs Nortriptyline | 1 | 205 | Odds Ratio (M‐H, Random, 95% CI) | 0.38 [0.07, 2.03] |
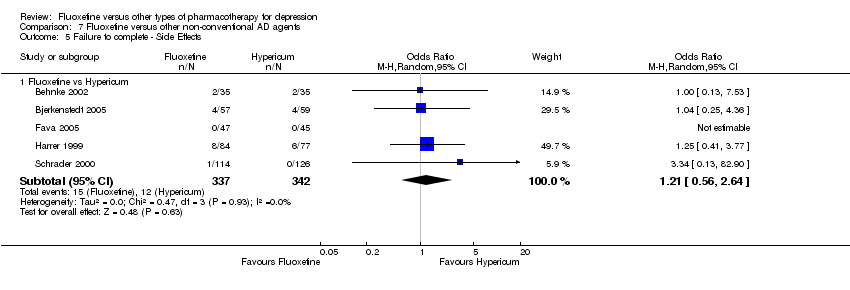
| 5 Failure to complete ‐ Side Effects Show forest plot | 40 | 3647 | Odds Ratio (M‐H, Random, 95% CI) | 0.55 [0.40, 0.75] |
|
| 5.1 Fluoxetine vs Amitriptyline | 16 | 1038 | Odds Ratio (M‐H, Random, 95% CI) | 0.41 [0.23, 0.71] |
| 5.2 Fluoxetine vs Clomipramine | 2 | 263 | Odds Ratio (M‐H, Random, 95% CI) | 0.30 [0.12, 0.79] |
| 5.3 Fluoxetine vs Desipramine | 2 | 104 | Odds Ratio (M‐H, Random, 95% CI) | 0.27 [0.04, 1.68] |
| 5.4 Fluoxetine vs Dothiepin/dosulepin | 5 | 478 | Odds Ratio (M‐H, Random, 95% CI) | 2.05 [0.59, 7.16] |
| 5.5 Fluoxetine vs Doxepine | 3 | 283 | Odds Ratio (M‐H, Random, 95% CI) | 0.82 [0.44, 1.53] |
| 5.6 Fluoxetine vs Imipramine | 10 | 1093 | Odds Ratio (M‐H, Random, 95% CI) | 0.47 [0.26, 0.86] |
| 5.7 Fluoxetine vs Lofepramine | 1 | 183 | Odds Ratio (M‐H, Random, 95% CI) | 0.16 [0.02, 1.38] |
| 5.8 Fluoxetine vs Nortriptyline | 1 | 205 | Odds Ratio (M‐H, Random, 95% CI) | 0.86 [0.42, 1.77] |