Cirugía para mujeres con prolapso del compartimiento anterior
Información
- DOI:
- https://doi.org/10.1002/14651858.CD004014.pub6Copiar DOI

- Base de datos:
-
- Cochrane Database of Systematic Reviews
- Versión publicada:
-
- 30 noviembre 2016see what's new
- Tipo:
-
- Intervention
- Etapa:
-
- Review
- Grupo Editorial Cochrane:
-
Grupo Cochrane de Ginecología y fertilidad
- Copyright:
-
- Copyright © 2017 The Cochrane Collaboration. Published by John Wiley & Sons, Ltd.
Cifras del artículo
Altmetric:
Citado por:
Autores
Contributions of authors
All review authors contributed to writing of the protocol. Four review authors (C Maher, C Schmid, B Feiner, K Baessler) assessed the relevance and eligibility of studies for inclusion in the review. They then assessed the quality of included studies; five (C Maher, N Haya, C Schmid, K Baessler, B Feiner) independently extracted data from trial reports, interpreted results and contributed to the writing of the draft version of this review. Julie Brown assisted with preparation of the review for publication.
Sources of support
Internal sources
-
Cochrane, UK.
Cochrane Review Support Programme: Pelvic organ prolapse reviews
External sources
-
National Institute for Health Research (NIHR), UK.
This project was supported by the NIHR, via Cochrane Infrastructure funding to the Cochrane Incontinence Group. The views and opinions expressed therein are those of the review authors and do not necessarily reflect those of the Systematic Reviews Programme, the NIHR, the NHS or the Department of Health.
Declarations of interest
Nil.
Acknowledgements
We would like to thank Sheila Wallace, Information Specialist of the Cochrane Incontinence Review Group, for designing the search strategy and running the searches for this review. We gratefully acknowledge the work and support of the Cochrane Gynaecology and Fertility Group, specifically, Helen Nagels, Jane Marjoribanks and Professor Cindy Farquhar, in completing this review.
Version history
| Published | Title | Stage | Authors | Version |
| 2016 Nov 30 | Surgery for women with anterior compartment prolapse | Review | Christopher Maher, Benjamin Feiner, Kaven Baessler, Corina Christmann‐Schmid, Nir Haya, Julie Brown | |
| 2013 Apr 30 | Surgical management of pelvic organ prolapse in women | Review | Christopher Maher, Benjamin Feiner, Kaven Baessler, Corina Schmid | |
| 2010 Apr 14 | Surgical management of pelvic organ prolapse in women | Review | Christopher Maher, Benjamin Feiner, Kaven Baessler, Cathryn MA Glazener | |
| 2007 Jul 18 | Surgical management of pelvic organ prolapse in women | Review | Christopher Maher, Kaven Baessler, Cathryn MA Glazener, Elisabeth J Adams, Suzanne Hagen | |
| 2004 Oct 18 | Surgical management of pelvic organ prolapse in women | Review | Christopher Maher, Kaven Baessler, Cathryn MA Glazener, Elisabeth J Adams, Suzanne Hagen | |
| 2003 Jan 20 | Surgical management of pelvic organ prolapse in women | Protocol | Christopher Maher, M Carey, Elisabeth J Adams, Suzanne Hagen | |
Differences between protocol and review
We conducted a post hoc subgroup analysis for the second comparison, which limited analysis to the study of meshes currently available on the market. This step was added at the request of a peer reviewer.
Keywords
MeSH
Medical Subject Headings (MeSH) Keywords
- Cystocele [surgery];
- Gynecologic Surgical Procedures [methods];
- Pelvic Organ Prolapse [prevention & control, *surgery];
- Randomized Controlled Trials as Topic;
- Rectal Prolapse [surgery];
- Secondary Prevention;
- Surgical Mesh;
- Suture Techniques;
- Urinary Incontinence [surgery];
- Uterine Prolapse [surgery];
Medical Subject Headings Check Words
Female; Humans;
PICO
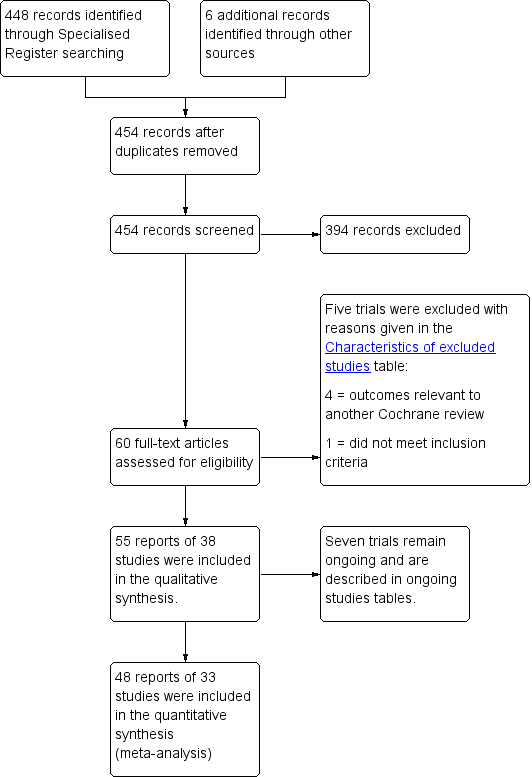
PRISMA study flow diagram for 2016 review.
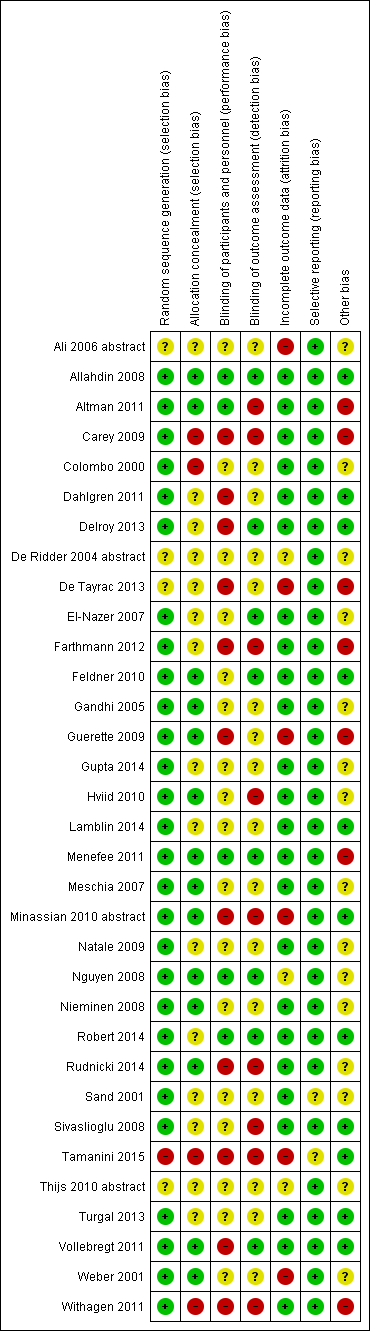
Risk of bias summary: review authors' judgements about each risk of bias item for each included study.
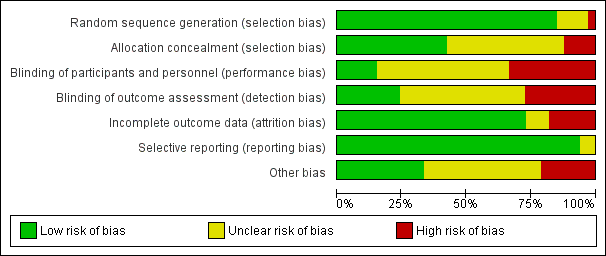
Risk of bias graph: review authors' judgements about each risk of bias item presented as percentages across all included studies.
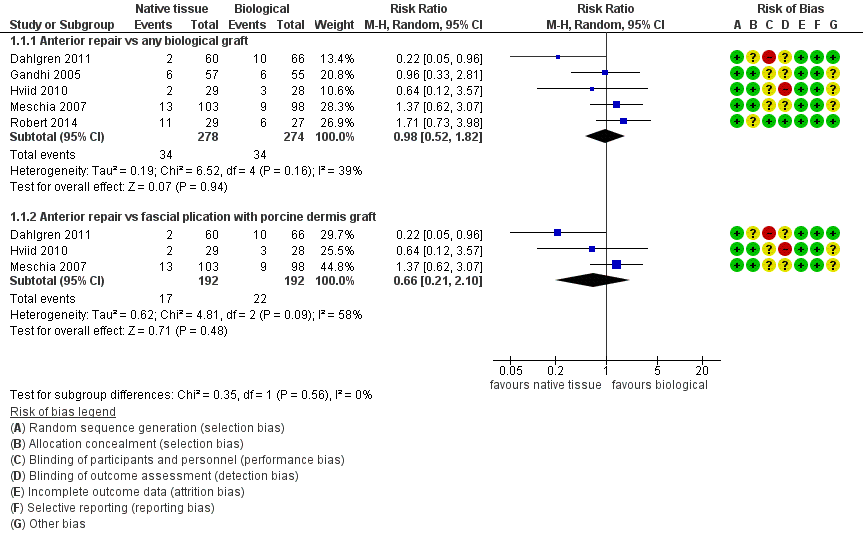
Forest plot of comparison: 1 Native tissue versus biological graft, outcome: 1.1 Awareness of prolapse.

Forest plot of comparison: 2 Native tissue versus polypropylene mesh, outcome: 2.1 Awareness of prolapse.
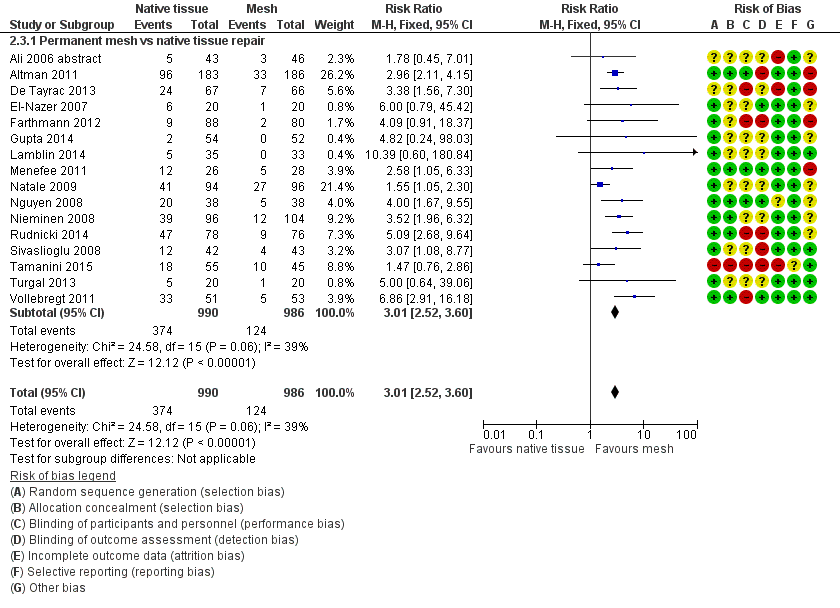
Forest plot of comparison: 2 Native tissue versus polypropylene mesh, outcome: 2.3 Recurrent anterior compartment prolapse.

Funnel plot of comparison: 2 Native tissue versus polypropylene mesh, outcome: 2.3 Recurrent anterior compartment prolapse.

Comparison 1 Native tissue versus biological graft, Outcome 1 Awareness of prolapse.

Comparison 1 Native tissue versus biological graft, Outcome 2 Repeat surgery.
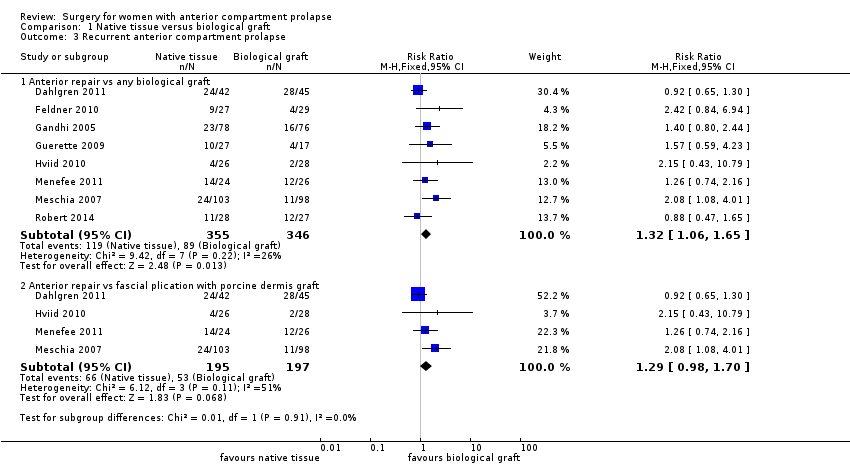
Comparison 1 Native tissue versus biological graft, Outcome 3 Recurrent anterior compartment prolapse.

Comparison 1 Native tissue versus biological graft, Outcome 4 Stress urinary incontinence.
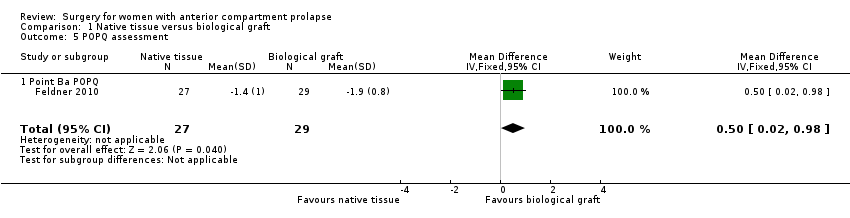
Comparison 1 Native tissue versus biological graft, Outcome 5 POPQ assessment.

Comparison 1 Native tissue versus biological graft, Outcome 6 Urge incontinence.
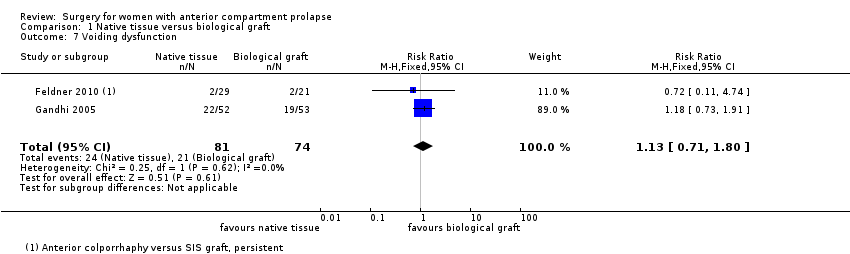
Comparison 1 Native tissue versus biological graft, Outcome 7 Voiding dysfunction.

Comparison 1 Native tissue versus biological graft, Outcome 8 Dyspareunia.
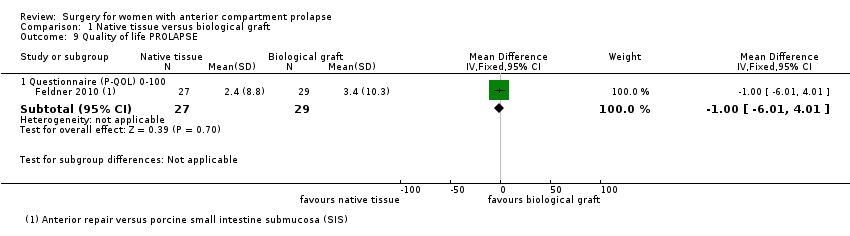
Comparison 1 Native tissue versus biological graft, Outcome 9 Quality of life PROLAPSE.
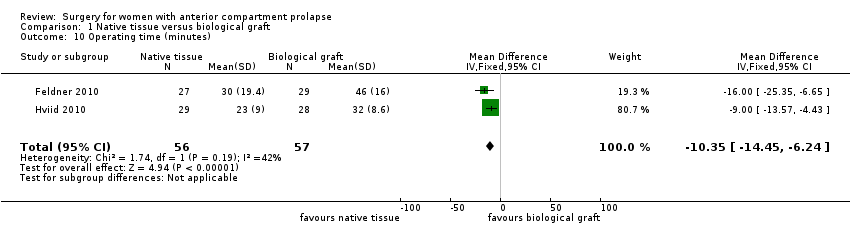
Comparison 1 Native tissue versus biological graft, Outcome 10 Operating time (minutes).

Comparison 1 Native tissue versus biological graft, Outcome 11 Hospital stay.

Comparison 2 Native tissue versus polypropylene mesh, Outcome 1 Awareness of prolapse.
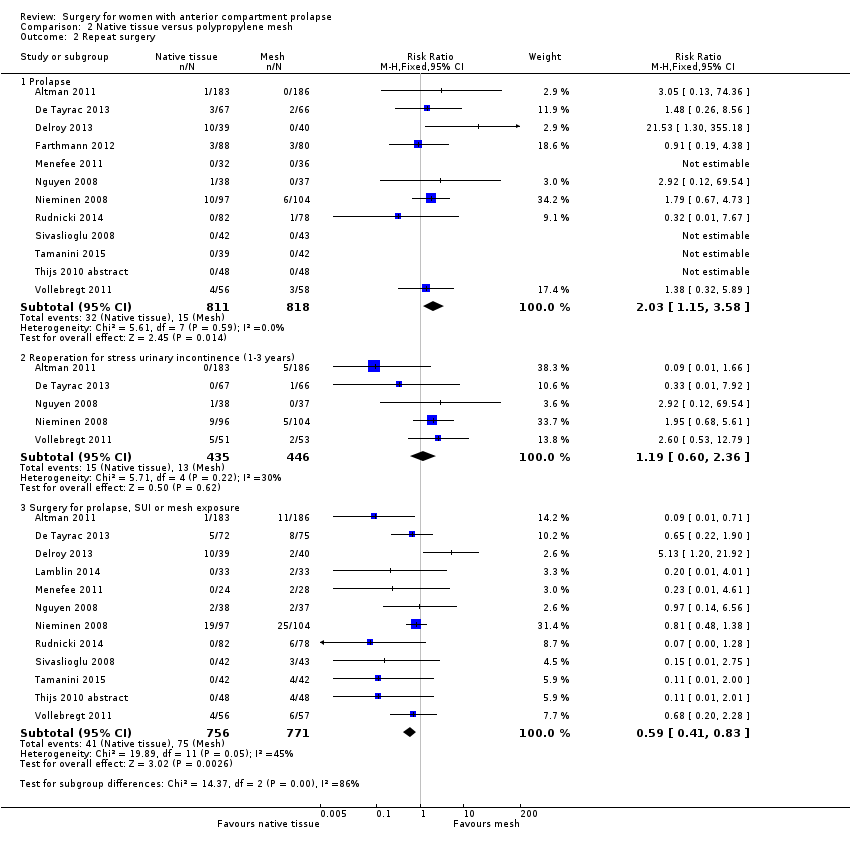
Comparison 2 Native tissue versus polypropylene mesh, Outcome 2 Repeat surgery.
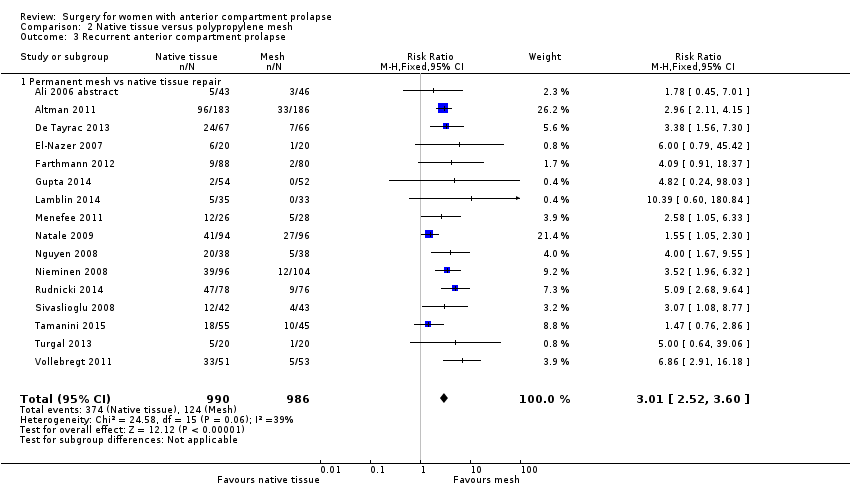
Comparison 2 Native tissue versus polypropylene mesh, Outcome 3 Recurrent anterior compartment prolapse.

Comparison 2 Native tissue versus polypropylene mesh, Outcome 4 Bladder injury.

Comparison 2 Native tissue versus polypropylene mesh, Outcome 5 Apical or posterior compartment prolapse.

Comparison 2 Native tissue versus polypropylene mesh, Outcome 6 POPQ assessment.

Comparison 2 Native tissue versus polypropylene mesh, Outcome 7 Stress urinary incontinence (de novo).
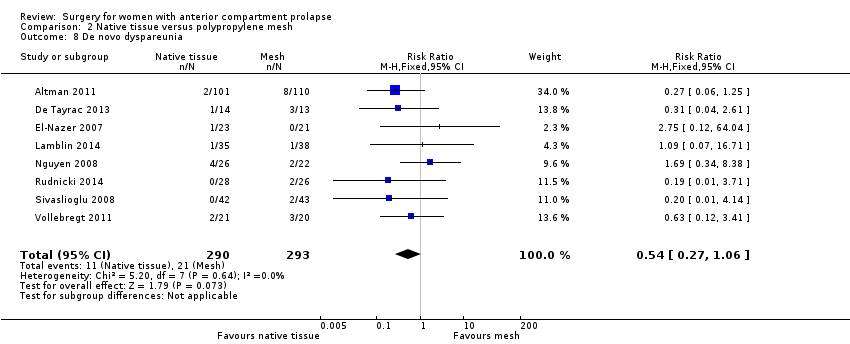
Comparison 2 Native tissue versus polypropylene mesh, Outcome 8 De novo dyspareunia.

Comparison 2 Native tissue versus polypropylene mesh, Outcome 9 Voiding dysfunction.

Comparison 2 Native tissue versus polypropylene mesh, Outcome 10 Urge incontinence.
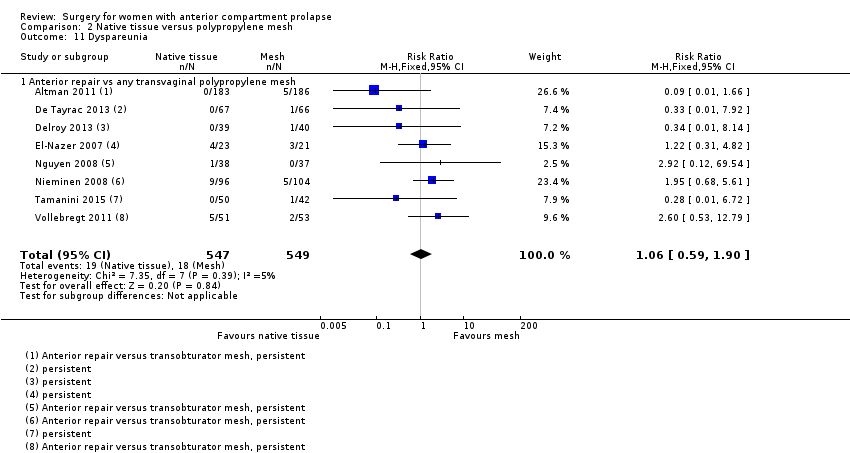
Comparison 2 Native tissue versus polypropylene mesh, Outcome 11 Dyspareunia.

Comparison 2 Native tissue versus polypropylene mesh, Outcome 12 Quality of life PROLAPSE.

Comparison 2 Native tissue versus polypropylene mesh, Outcome 13 Hospital stay (days).
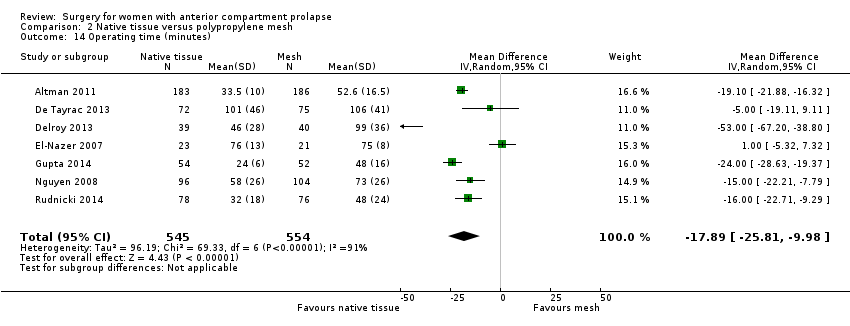
Comparison 2 Native tissue versus polypropylene mesh, Outcome 14 Operating time (minutes).

Comparison 2 Native tissue versus polypropylene mesh, Outcome 15 Transfusion.
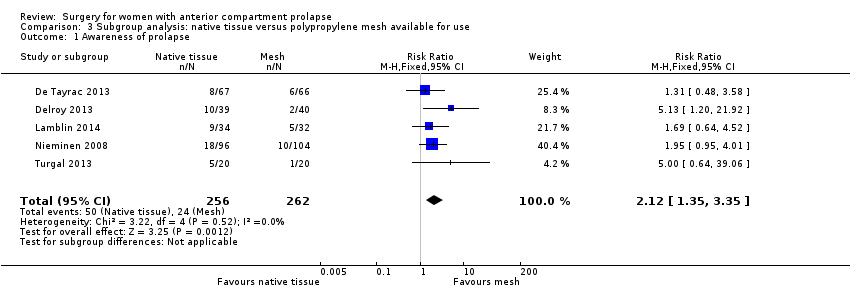
Comparison 3 Subgroup analysis: native tissue versus polypropylene mesh available for use, Outcome 1 Awareness of prolapse.

Comparison 3 Subgroup analysis: native tissue versus polypropylene mesh available for use, Outcome 2 Repeat surgery.

Comparison 3 Subgroup analysis: native tissue versus polypropylene mesh available for use, Outcome 3 Recurrent anterior compartment prolapse.
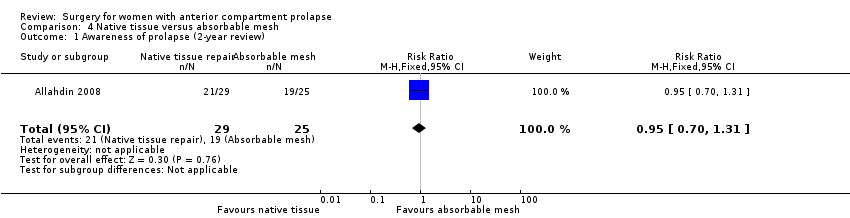
Comparison 4 Native tissue versus absorbable mesh, Outcome 1 Awareness of prolapse (2‐year review).
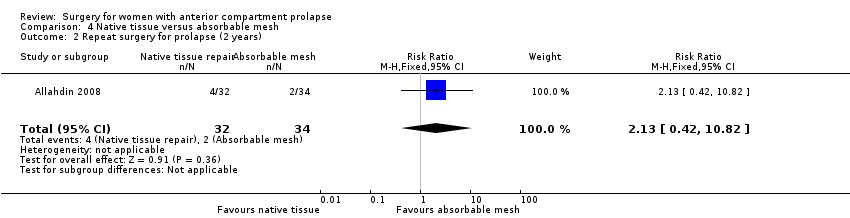
Comparison 4 Native tissue versus absorbable mesh, Outcome 2 Repeat surgery for prolapse (2 years).

Comparison 4 Native tissue versus absorbable mesh, Outcome 3 Anterior compartment prolapse (3 months‐2 years).

Comparison 4 Native tissue versus absorbable mesh, Outcome 4 Death.

Comparison 4 Native tissue versus absorbable mesh, Outcome 5 Posterior compartment prolapse.

Comparison 4 Native tissue versus absorbable mesh, Outcome 6 Stress urinary incontinence.
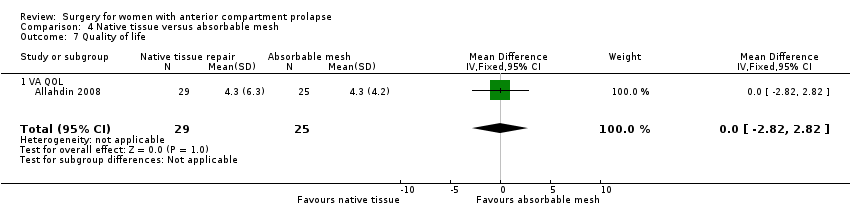
Comparison 4 Native tissue versus absorbable mesh, Outcome 7 Quality of life.
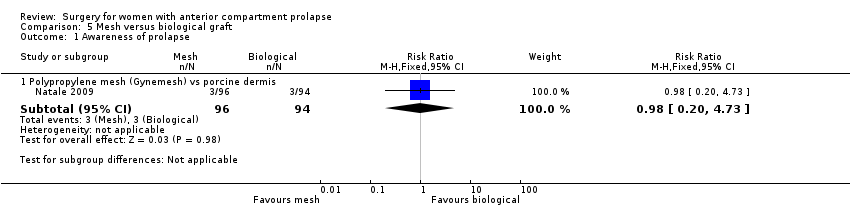
Comparison 5 Mesh versus biological graft, Outcome 1 Awareness of prolapse.

Comparison 5 Mesh versus biological graft, Outcome 2 Repeat surgery.

Comparison 5 Mesh versus biological graft, Outcome 3 Recurrent anterior wall compartment prolapse (stage 2 or greater).

Comparison 5 Mesh versus biological graft, Outcome 4 Mesh exposure.

Comparison 5 Mesh versus biological graft, Outcome 5 Stress urinary incontinence (de novo).
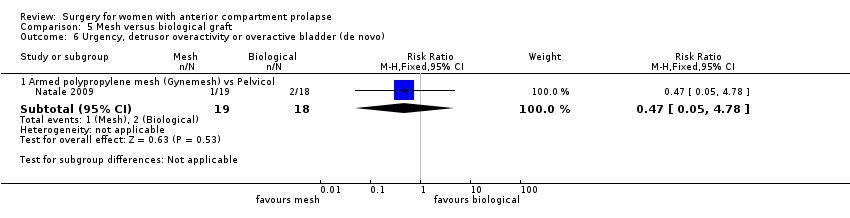
Comparison 5 Mesh versus biological graft, Outcome 6 Urgency, detrusor overactivity or overactive bladder (de novo).

Comparison 5 Mesh versus biological graft, Outcome 7 Dyspareunia (persistent).
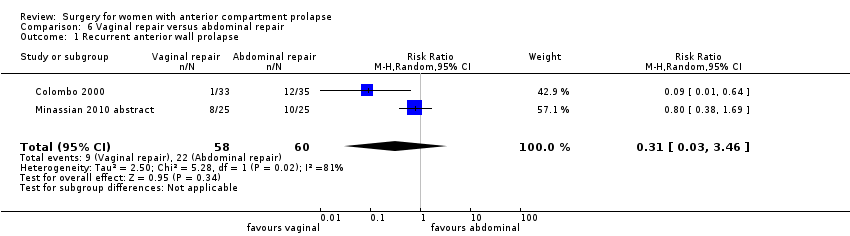
Comparison 6 Vaginal repair versus abdominal repair, Outcome 1 Recurrent anterior wall prolapse.
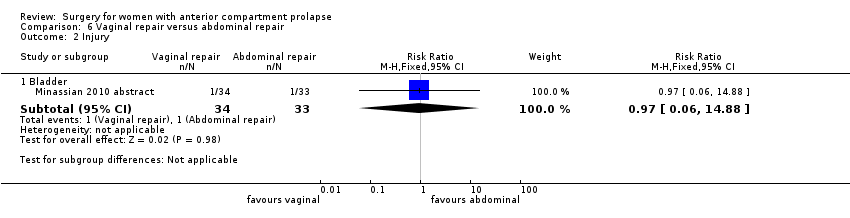
Comparison 6 Vaginal repair versus abdominal repair, Outcome 2 Injury.

Comparison 6 Vaginal repair versus abdominal repair, Outcome 3 Posterior compartment prolapse.
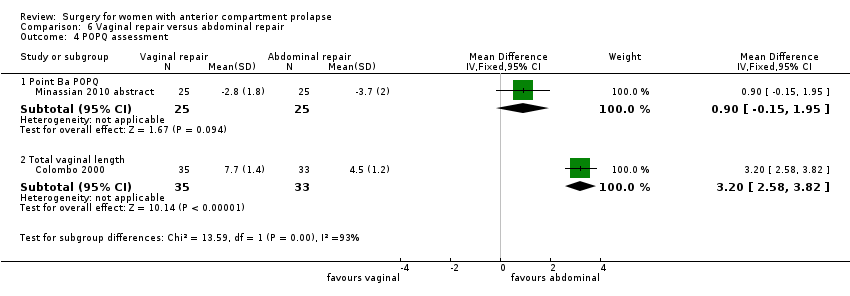
Comparison 6 Vaginal repair versus abdominal repair, Outcome 4 POPQ assessment.

Comparison 6 Vaginal repair versus abdominal repair, Outcome 5 Dyspareunia.
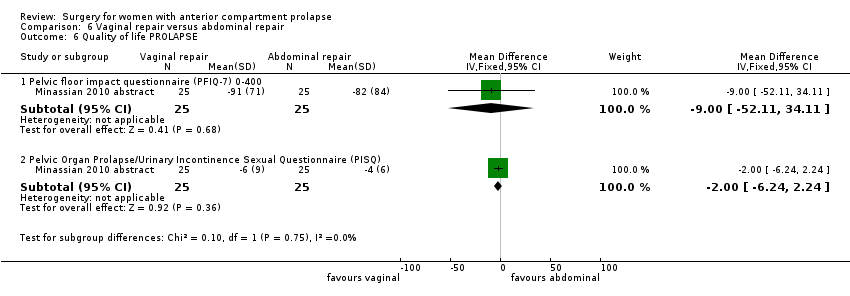
Comparison 6 Vaginal repair versus abdominal repair, Outcome 6 Quality of life PROLAPSE.
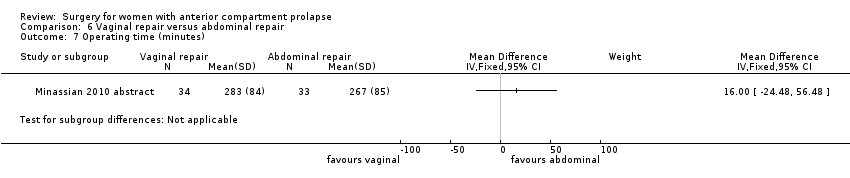
Comparison 6 Vaginal repair versus abdominal repair, Outcome 7 Operating time (minutes).
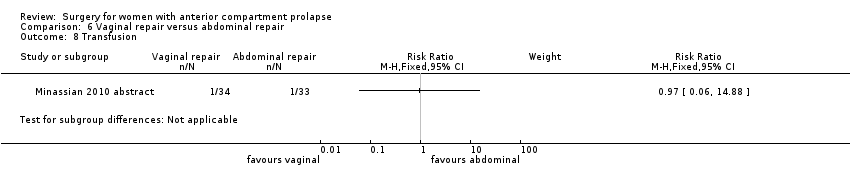
Comparison 6 Vaginal repair versus abdominal repair, Outcome 8 Transfusion.

Comparison 7 Native tissue repair versus graft repair for anterior and/or posterior prolapse, Outcome 1 Awareness of prolapse.

Comparison 7 Native tissue repair versus graft repair for anterior and/or posterior prolapse, Outcome 2 Repeat surgery prolapse.

Comparison 7 Native tissue repair versus graft repair for anterior and/or posterior prolapse, Outcome 3 Recurrent anterior wall prolapse (stage 2 or greater).

Comparison 7 Native tissue repair versus graft repair for anterior and/or posterior prolapse, Outcome 4 Bladder injury.

Comparison 7 Native tissue repair versus graft repair for anterior and/or posterior prolapse, Outcome 5 Stress urinary incontinence (de novo).

Comparison 7 Native tissue repair versus graft repair for anterior and/or posterior prolapse, Outcome 6 Dyspareunia (de novo and persistent).

Comparison 7 Native tissue repair versus graft repair for anterior and/or posterior prolapse, Outcome 7 Quality of life PROLAPSE.
| Anterior prolapse repair: native tissue versus biological graft in women with anterior compartment pelvic organ prolapse | ||||||
| Patient or population: women with anterior compartment pelvic organ prolapse Comparison: biological graft | ||||||
| Outcomes | Illustrative comparative risks* (95% CI) | Relative effect | Number of participants | Quality of the evidence | Comments | |
| Assumed risk | Corresponding risk | |||||
| Biological graft | Native tissue | |||||
| Awareness of prolapse (1‐2 years) | 124 per 1000 | 122 per 1000 | RR 0.98 | 552 | ⊕⊕⊕⊝ | |
| Repeat surgery for prolapse (1‐2 years) | 44 per 1000 | 45 per 1000 | RR 1.02 | 650 | ⊕⊕⊕⊝ | |
| Recurrent anterior compartment prolapse (1‐2 years) | 257 per 1000 | 340 per 1000 | RR 1.32 | 701 | ⊕⊕⊝⊝ | |
| Stress urinary incontinence (1‐2 years) | 130 per 1000 | 187 per 1000 | RR 1.44 | 218 | ⊕⊕⊕⊕ | Repeat surgery for SUI was not reported by any studies |
| Dyspareunia (1‐2 years) | 149 per 1000 | 129 per 1000 | RR 0.87 | 151 | ⊕⊕⊕⊝ | |
| *The basis for the assumed risk is the mean control group risk across studies. The corresponding risk (and its 95% confidence interval) is based on the assumed risk in the comparison group and the relative effect of the intervention (and its 95% CI). | ||||||
| GRADE Working Group grades of evidence | ||||||
| aRisk of bias: allocation concealment not reported in 2/5, downgraded one level. bSerious imprecision: wide confidence interval, greater than 25% increase in RR, downgraded one level. | ||||||
| Anterior prolapse repair: native tissue versus polypropylene mesh for women with anterior compartment pelvic organ prolapse | ||||||
| Patient or population: women with anterior compartment pelvic organ prolapse Setting: hospital departments of obstetrics and gynaecology Comparison: polypropylene mesh | ||||||
| Outcomes | Illustrative comparative risks* (95% CI) | Relative effect | Number of participants | Quality of the evidence | Comments | |
| Assumed risk | Corresponding risk | |||||
| Polypropylene mesh repair | Native tissue repair | |||||
| Awareness of prolapse (1‐3 years) | 130 per 1000 | 230 per 1000 | RR 1.77 | 1133 | ⊕⊕⊕⊝ | |
| Repeat surgery for prolapse (1‐3 years) | 18 per 1000 | 37 per 1000 | RR 2.03 | 1629 | ⊕⊕⊕⊝ | |
| Repeat surgery for stress urinary incontinence (1‐2 years) | 29 per 1000 | 35 per 1000 (17 to 69) | RR 1.19 (0.60 to 2.36) | 881 (5 studies) | Low3,4 | |
| Recurrent anterior compartment prolapse (1‐3 years) | 126 per 1000 | 379 per 1000 | RR 3.01 | 1976 | ⊕⊕⊝⊝ | |
| Stress urinary incontinence (de novo) (1‐3 years) | 102 per 1000 | 69 per 1000 | RR 0.67 | 957 | ⊕⊕⊝⊝ | |
| Dyspareunia (de novo) (1‐2 years) | 72 per 1000 | 39 per 1000 (19 to 76) | RR 0.54 (0.27 to 1.06) | 583 (8 studies) | ⊕⊕⊕⊝ | |
| Repeat surgery for prolapse, SUI or mesh exposure (1‐3 years) | 97 per 1000 | 54 per 1000 | RR 0.59 (0.41 to 0.83) | 1527 (12 studies) | ⊕⊕⊕⊝ | |
| *The basis for the assumed risk is the mean control group risk across studies. The corresponding risk (and its 95% confidence interval) is based on the assumed risk in the comparison group and the relative effect of the intervention (and its 95% CI). | ||||||
| GRADE Working Group grades of evidence | ||||||
| 1Risk of bias: allocation concealment not reported in 4/9, downgraded one level. 3Risk of bias: allocation concealment not reported in 2/5: downgraded one level. 4Serious imprecision: wide CI with lower RR (0.25), downgraded one level. 5Risk of bias: 11/15 trials did not report blinded outcome assessment, downgraded one level. 6Risk of bias: allocation concealment not reported in 7/15, downgraded one level. 7Risk of bias: poor methodological reporting of allocation concealment and/or blinding, downgraded one level. | ||||||
| Anterior prolapse repair: native tissue repair versus absorbable mesh for women with anterior and/or posterior compartment pelvic organ prolapse | ||||||
| Patient or population: women with anterior compartment pelvic organ prolapse Setting: hospital departments of obstetrics and gynaecology | ||||||
| Outcomes | Illustrative comparative risks* (95% CI) | Relative effect | Number of participants | Quality of the evidence | Comments | |
| Assumed risk | Corresponding risk | |||||
| Absorbable mesh | Native tissue repair | |||||
| Awareness of prolapse (2 years) | 760 per 1000 | 722 per 1000 | RR 0.95 | 54 | ⊕⊝⊝⊝ | |
| Repeat surgery for prolapse (stage 2 or greater) at 2 years | 59 per 1000 | 125 per 1000 | RR 2.13 | 66 | ⊕⊝⊝⊝ | |
| Recurrent anterior compartment prolapse | 267 per 1000 | 401 per 1000 | RR 1.50 | 268 | ⊕⊕⊝⊝ | |
| De novo dyspareunia | Not reported in the included studies | |||||
| Stress urinary incontinence (2 years) | 818 per 1000 | 589 per 1000 | RR 0.72 | 49 | ⊕⊝⊝⊝ | Repeat surgery for SUI was not reported by any studies |
| *The basis for the assumed risk is the mean control group risk across studies. The corresponding risk (and its 95% confidence interval) is based on the assumed risk in the comparison group and the relative effect of the intervention (and its 95% CI). | ||||||
| GRADE Working Group grades of evidence | ||||||
| aRisk of bias: at 2 years, 18% lost to review, downgraded one level. dRisk of bias: blinded outcome assessment not reported in 2/3 trials, and high attrition in one, downgraded one level. | ||||||
| Study ID | Mesh exposure | Mesh repairs |
| Al‐Nazer 2007 | 1 | 21 |
| Ali 2006 abstract | 3 | 46 |
| Altman 2011 | 21 | 183 |
| De Tayrac 2013 | 7 | 76 |
| Delroy 2013 | 2 | 40 |
| Gupta 2014 | 4 | 44 |
| Lamblin 2014 | 2 | 33 |
| Menefee 2011 | 5 | 28 |
| Nguyen 2008 | 2 | 37 |
| Nieminen 2008 | 18 | 104 |
| Rudnick 2014 | 12 | 78 |
| Sivaslioglu 2008 | 3 | 43 |
| Tamanini 2014 | 7 | 42 |
| Turgal 2014 | 3 | 20 |
| Thijs 2010 abstract | 9 | 48 |
| Vollebregt 2011 | 2 | 53 |
| Total | 101 | 896 |
| Anterior repair vs absorbable mesh | ||
| Sand 2001 | 0 | 73 |
| Weber 2001 | 1 | 26 |
| Study ID | Surgery mesh exposure | Mesh repairs |
| Altman 2011 (1) | 6 | 183 |
| De Tayrac 2013 (2) | 4 | 76 |
| Delroy 2013 (3) | 2 | 40 |
| Gupta 2014 (4) | 2 | 44 |
| Nguyen 2008 (5) | 2 | 37 |
| Nieminen 2008 (6) | 14 | 104 |
| Rudnick 2014 (7) | 5 | 78 |
| Sivaslioglu 2008 (8) | 3 | 43 |
| Tamanini 2014 (9) | 7 | 42 |
| Turgal 2014 | 5 | 20 |
| Thijs 2010 abstract (10) | 4 | 48 |
| Vollebregt 2011 (11) | 2 | 53 |
| Total | 56 | 768 |
| Study ID | Mesh exposure | Mesh repairs |
| Carey 2009 | 4 | 63 |
| Withagen 2011 | 14 | 83 |
| Total | 18 | 146 |
| Study ID | Reoperation mesh exposure | Mesh repairs |
| Carey 2009 | 3 | 63 |
| Withagen 2011 | 5 | 83 |
| Total | 8 | 146 |
| Outcome or subgroup title | No. of studies | No. of participants | Statistical method | Effect size |
| 1 Awareness of prolapse Show forest plot | 5 | Risk Ratio (M‐H, Random, 95% CI) | Subtotals only | |
| 1.1 Anterior repair vs any biological graft | 5 | 552 | Risk Ratio (M‐H, Random, 95% CI) | 0.98 [0.52, 1.82] |
| 1.2 Anterior repair vs fascial plication with porcine dermis graft | 3 | 384 | Risk Ratio (M‐H, Random, 95% CI) | 0.66 [0.21, 2.10] |
| 2 Repeat surgery Show forest plot | 7 | Risk Ratio (M‐H, Fixed, 95% CI) | Subtotals only | |
| 2.1 Prolapse | 7 | 650 | Risk Ratio (M‐H, Fixed, 95% CI) | 1.02 [0.53, 1.97] |
| 3 Recurrent anterior compartment prolapse Show forest plot | 8 | Risk Ratio (M‐H, Fixed, 95% CI) | Subtotals only | |
| 3.1 Anterior repair vs any biological graft | 8 | 701 | Risk Ratio (M‐H, Fixed, 95% CI) | 1.32 [1.06, 1.65] |
| 3.2 Anterior repair vs fascial plication with porcine dermis graft | 4 | 392 | Risk Ratio (M‐H, Fixed, 95% CI) | 1.29 [0.98, 1.70] |
| 4 Stress urinary incontinence Show forest plot | 2 | 218 | Risk Ratio (M‐H, Fixed, 95% CI) | 1.44 [0.79, 2.64] |
| 5 POPQ assessment Show forest plot | 1 | 56 | Mean Difference (IV, Fixed, 95% CI) | 0.5 [0.02, 0.98] |
| 5.1 Point Ba POPQ | 1 | 56 | Mean Difference (IV, Fixed, 95% CI) | 0.5 [0.02, 0.98] |
| 6 Urge incontinence Show forest plot | 1 | Risk Ratio (M‐H, Fixed, 95% CI) | Subtotals only | |
| 7 Voiding dysfunction Show forest plot | 2 | 155 | Risk Ratio (M‐H, Fixed, 95% CI) | 1.13 [0.71, 1.80] |
| 8 Dyspareunia Show forest plot | 2 | 151 | Risk Ratio (M‐H, Fixed, 95% CI) | 0.87 [0.39, 1.93] |
| 9 Quality of life PROLAPSE Show forest plot | 1 | Mean Difference (IV, Fixed, 95% CI) | Subtotals only | |
| 9.1 Questionnaire (P‐QOL) 0‐100 | 1 | 56 | Mean Difference (IV, Fixed, 95% CI) | ‐1.0 [‐6.01, 4.01] |
| 10 Operating time (minutes) Show forest plot | 2 | 113 | Mean Difference (IV, Fixed, 95% CI) | ‐10.35 [‐14.45, ‐6.24] |
| 11 Hospital stay Show forest plot | 1 | 201 | Mean Difference (IV, Fixed, 95% CI) | 0.30 [‐0.09, 0.69] |
| Outcome or subgroup title | No. of studies | No. of participants | Statistical method | Effect size |
| 1 Awareness of prolapse Show forest plot | 9 | 1133 | Risk Ratio (M‐H, Fixed, 95% CI) | 1.77 [1.37, 2.28] |
| 2 Repeat surgery Show forest plot | 13 | Risk Ratio (M‐H, Fixed, 95% CI) | Subtotals only | |
| 2.1 Prolapse | 12 | 1629 | Risk Ratio (M‐H, Fixed, 95% CI) | 2.03 [1.15, 3.58] |
| 2.2 Reoperation for stress urinary incontinence (1‐3 years) | 5 | 881 | Risk Ratio (M‐H, Fixed, 95% CI) | 1.19 [0.60, 2.36] |
| 2.3 Surgery for prolapse, SUI or mesh exposure | 12 | 1527 | Risk Ratio (M‐H, Fixed, 95% CI) | 0.59 [0.41, 0.83] |
| 3 Recurrent anterior compartment prolapse Show forest plot | 16 | 1976 | Risk Ratio (M‐H, Fixed, 95% CI) | 3.01 [2.52, 3.60] |
| 3.1 Permanent mesh vs native tissue repair | 16 | 1976 | Risk Ratio (M‐H, Fixed, 95% CI) | 3.01 [2.52, 3.60] |
| 4 Bladder injury Show forest plot | 6 | Risk Ratio (M‐H, Fixed, 95% CI) | Subtotals only | |
| 4.1 Anterior repair vs any transvaginal polypropylene mesh | 6 | 871 | Risk Ratio (M‐H, Fixed, 95% CI) | 0.21 [0.06, 0.82] |
| 5 Apical or posterior compartment prolapse Show forest plot | 2 | 300 | Risk Ratio (M‐H, Fixed, 95% CI) | 0.54 [0.30, 0.99] |
| 6 POPQ assessment Show forest plot | 6 | Mean Difference (IV, Random, 95% CI) | Subtotals only | |
| 6.1 Point Ba POPQ | 6 | 568 | Mean Difference (IV, Random, 95% CI) | 0.55 [0.30, 0.80] |
| 6.2 Point Bp POPQ | 3 | 276 | Mean Difference (IV, Random, 95% CI) | ‐0.43 [‐0.92, 0.06] |
| 6.3 Point C POPQ | 4 | 369 | Mean Difference (IV, Random, 95% CI) | 0.27 [‐0.47, 1.01] |
| 6.4 Total vaginal length | 3 | 366 | Mean Difference (IV, Random, 95% CI) | ‐0.18 [‐0.78, 0.43] |
| 7 Stress urinary incontinence (de novo) Show forest plot | 6 | Risk Ratio (M‐H, Fixed, 95% CI) | Subtotals only | |
| 7.1 Polypropylene mesh vs native tissue (de novo) | 6 | 957 | Risk Ratio (M‐H, Fixed, 95% CI) | 0.67 [0.44, 1.01] |
| 8 De novo dyspareunia Show forest plot | 8 | 583 | Risk Ratio (M‐H, Fixed, 95% CI) | 0.54 [0.27, 1.06] |
| 9 Voiding dysfunction Show forest plot | 3 | Risk Ratio (M‐H, Fixed, 95% CI) | Subtotals only | |
| 9.1 Anterior repair vs polypropylene mesh (persistent) | 3 | 277 | Risk Ratio (M‐H, Fixed, 95% CI) | 1.22 [0.33, 4.47] |
| 10 Urge incontinence Show forest plot | 2 | Risk Ratio (M‐H, Fixed, 95% CI) | Subtotals only | |
| 10.1 Anterior repair vs transvaginal permanent mesh | 2 | 198 | Risk Ratio (M‐H, Fixed, 95% CI) | 2.20 [0.33, 14.68] |
| 11 Dyspareunia Show forest plot | 8 | 1096 | Risk Ratio (M‐H, Fixed, 95% CI) | 1.06 [0.59, 1.90] |
| 11.1 Anterior repair vs any transvaginal polypropylene mesh | 8 | 1096 | Risk Ratio (M‐H, Fixed, 95% CI) | 1.06 [0.59, 1.90] |
| 12 Quality of life PROLAPSE Show forest plot | 8 | Mean Difference (IV, Random, 95% CI) | Subtotals only | |
| 12.1 Questionnaire (PQOL) 0‐100 | 2 | 164 | Mean Difference (IV, Random, 95% CI) | 1.09 [‐1.19, 3.37] |
| 12.2 Pelvic Floor Impact Questionnaire (PFIQ‐7) 0‐400 | 3 | 290 | Mean Difference (IV, Random, 95% CI) | 1.90 [‐7.78, 11.59] |
| 12.3 Pelvic floor distress inventory (PFD1‐20) 0‐300 | 3 | 294 | Mean Difference (IV, Random, 95% CI) | 3.89 [‐12.82, 20.61] |
| 12.4 Pelvic Organ Prolapse/Urinary Incontinence Sexual Questionnaire (PISQ) | 4 | 741 | Mean Difference (IV, Random, 95% CI) | ‐0.06 [‐0.76, 0.64] |
| 12.5 ICIQ‐QOL | 1 | 92 | Mean Difference (IV, Random, 95% CI) | 0.70 [‐0.15, 1.55] |
| 12.6 ICIQ‐VS | 1 | 92 | Mean Difference (IV, Random, 95% CI) | 1.10 [‐0.88, 3.08] |
| 13 Hospital stay (days) Show forest plot | 5 | 707 | Mean Difference (IV, Random, 95% CI) | 0.08 [‐0.17, 0.33] |
| 14 Operating time (minutes) Show forest plot | 7 | 1099 | Mean Difference (IV, Random, 95% CI) | ‐17.89 [‐25.81, ‐9.98] |
| 15 Transfusion Show forest plot | 4 | 486 | Risk Ratio (M‐H, Fixed, 95% CI) | 0.42 [0.24, 0.76] |
| Outcome or subgroup title | No. of studies | No. of participants | Statistical method | Effect size |
| 1 Awareness of prolapse Show forest plot | 5 | 518 | Risk Ratio (M‐H, Fixed, 95% CI) | 2.12 [1.35, 3.35] |
| 2 Repeat surgery Show forest plot | 7 | Risk Ratio (M‐H, Fixed, 95% CI) | Subtotals only | |
| 2.1 Prolapse | 7 | 815 | Risk Ratio (M‐H, Fixed, 95% CI) | 2.34 [1.20, 4.59] |
| 2.2 Repeat surgery for stress urinary incontinence (1‐3 years) | 2 | 333 | Risk Ratio (M‐H, Fixed, 95% CI) | 1.56 [0.60, 4.10] |
| 2.3 Repeat surgery for prolapse, SUI or mesh exposure | 6 | 648 | Risk Ratio (M‐H, Fixed, 95% CI) | 0.82 [0.55, 1.24] |
| 3 Recurrent anterior compartment prolapse Show forest plot | 8 | 970 | Risk Ratio (M‐H, Fixed, 95% CI) | 2.35 [1.83, 3.01] |
| 3.1 Permanent mesh vs native tissue repair | 8 | 970 | Risk Ratio (M‐H, Fixed, 95% CI) | 2.35 [1.83, 3.01] |
| Outcome or subgroup title | No. of studies | No. of participants | Statistical method | Effect size |
| 1 Awareness of prolapse (2‐year review) Show forest plot | 1 | 54 | Risk Ratio (M‐H, Fixed, 95% CI) | 0.95 [0.70, 1.31] |
| 2 Repeat surgery for prolapse (2 years) Show forest plot | 1 | 66 | Risk Ratio (M‐H, Fixed, 95% CI) | 2.13 [0.42, 10.82] |
| 3 Anterior compartment prolapse (3 months‐2 years) Show forest plot | 3 | 268 | Risk Ratio (M‐H, Fixed, 95% CI) | 1.50 [1.09, 2.06] |
| 4 Death Show forest plot | 2 | 175 | Risk Ratio (M‐H, Fixed, 95% CI) | 0.0 [0.0, 0.0] |
| 5 Posterior compartment prolapse Show forest plot | 1 | 132 | Risk Ratio (M‐H, Fixed, 95% CI) | 0.88 [0.31, 2.49] |
| 6 Stress urinary incontinence Show forest plot | 1 | 49 | Risk Ratio (M‐H, Fixed, 95% CI) | 0.72 [0.50, 1.05] |
| 7 Quality of life Show forest plot | 1 | 54 | Mean Difference (IV, Fixed, 95% CI) | 0.0 [‐2.82, 2.82] |
| 7.1 VA QOL | 1 | 54 | Mean Difference (IV, Fixed, 95% CI) | 0.0 [‐2.82, 2.82] |
| Outcome or subgroup title | No. of studies | No. of participants | Statistical method | Effect size |
| 1 Awareness of prolapse Show forest plot | 1 | Risk Ratio (M‐H, Fixed, 95% CI) | Subtotals only | |
| 1.1 Polypropylene mesh (Gynemesh) vs porcine dermis | 1 | 190 | Risk Ratio (M‐H, Fixed, 95% CI) | 0.98 [0.20, 4.73] |
| 2 Repeat surgery Show forest plot | 2 | Risk Ratio (M‐H, Fixed, 95% CI) | Subtotals only | |
| 2.1 Prolapse | 2 | 315 | Risk Ratio (M‐H, Fixed, 95% CI) | 3.05 [0.87, 10.73] |
| 3 Recurrent anterior wall compartment prolapse (stage 2 or greater) Show forest plot | 2 | Risk Ratio (M‐H, Random, 95% CI) | Subtotals only | |
| 3.1 Permanent mesh vs biological graft | 1 | 190 | Risk Ratio (M‐H, Random, 95% CI) | 0.64 [0.43, 0.96] |
| 3.2 Absorbable mesh vs biological graft | 1 | 125 | Risk Ratio (M‐H, Random, 95% CI) | 3.22 [1.38, 7.52] |
| 4 Mesh exposure Show forest plot | 2 | Risk Ratio (M‐H, Fixed, 95% CI) | Subtotals only | |
| 4.1 Polypropylene mesh vs porcine dermis | 2 | 241 | Risk Ratio (M‐H, Fixed, 95% CI) | 0.09 [0.01, 0.69] |
| 5 Stress urinary incontinence (de novo) Show forest plot | 1 | Risk Ratio (M‐H, Fixed, 95% CI) | Subtotals only | |
| 5.1 Armed polypropylene mesh (Gynemesh) vs Pelvicol | 1 | 190 | Risk Ratio (M‐H, Fixed, 95% CI) | 1.96 [0.18, 21.23] |
| 6 Urgency, detrusor overactivity or overactive bladder (de novo) Show forest plot | 1 | Risk Ratio (M‐H, Fixed, 95% CI) | Subtotals only | |
| 6.1 Armed polypropylene mesh (Gynemesh) vs Pelvicol | 1 | 37 | Risk Ratio (M‐H, Fixed, 95% CI) | 0.47 [0.05, 4.78] |
| 7 Dyspareunia (persistent) Show forest plot | 1 | Risk Ratio (M‐H, Fixed, 95% CI) | Subtotals only | |
| 7.1 Armed polypropylene mesh (Gynemesh) vs Pelvicol | 1 | 190 | Risk Ratio (M‐H, Fixed, 95% CI) | 0.82 [0.37, 1.80] |
| Outcome or subgroup title | No. of studies | No. of participants | Statistical method | Effect size |
| 1 Recurrent anterior wall prolapse Show forest plot | 2 | 118 | Risk Ratio (M‐H, Random, 95% CI) | 0.31 [0.03, 3.46] |
| 2 Injury Show forest plot | 1 | Risk Ratio (M‐H, Fixed, 95% CI) | Subtotals only | |
| 2.1 Bladder | 1 | 67 | Risk Ratio (M‐H, Fixed, 95% CI) | 0.97 [0.06, 14.88] |
| 3 Posterior compartment prolapse Show forest plot | 2 | 118 | Risk Ratio (M‐H, Random, 95% CI) | 1.81 [0.17, 19.65] |
| 4 POPQ assessment Show forest plot | 2 | Mean Difference (IV, Fixed, 95% CI) | Subtotals only | |
| 4.1 Point Ba POPQ | 1 | 50 | Mean Difference (IV, Fixed, 95% CI) | 0.90 [‐0.15, 1.95] |
| 4.2 Total vaginal length | 1 | 68 | Mean Difference (IV, Fixed, 95% CI) | 3.20 [2.58, 3.82] |
| 5 Dyspareunia Show forest plot | 2 | 97 | Risk Ratio (M‐H, Fixed, 95% CI) | 5.17 [1.63, 16.35] |
| 6 Quality of life PROLAPSE Show forest plot | 1 | Mean Difference (IV, Fixed, 95% CI) | Subtotals only | |
| 6.1 Pelvic floor impact questionnaire (PFIQ‐7) 0‐400 | 1 | 50 | Mean Difference (IV, Fixed, 95% CI) | ‐9.0 [‐52.11, 34.11] |
| 6.2 Pelvic Organ Prolapse/Urinary Incontinence Sexual Questionnaire (PISQ) | 1 | 50 | Mean Difference (IV, Fixed, 95% CI) | ‐2.0 [‐6.24, 2.24] |
| 7 Operating time (minutes) Show forest plot | 1 | Mean Difference (IV, Fixed, 95% CI) | Subtotals only | |
| 8 Transfusion Show forest plot | 1 | Risk Ratio (M‐H, Fixed, 95% CI) | Subtotals only | |
| Outcome or subgroup title | No. of studies | No. of participants | Statistical method | Effect size |
| 1 Awareness of prolapse Show forest plot | 3 | 406 | Risk Ratio (M‐H, Random, 95% CI) | 0.85 [0.36, 1.99] |
| 1.1 Anterior and/or posterior repair vs polypropylene mesh | 2 | 280 | Risk Ratio (M‐H, Random, 95% CI) | 1.17 [0.70, 1.96] |
| 1.2 Anterior and/or posterior repair vs porcine dermis (Pelvicol) | 1 | 126 | Risk Ratio (M‐H, Random, 95% CI) | 0.22 [0.05, 0.96] |
| 2 Repeat surgery prolapse Show forest plot | 2 | 291 | Risk Ratio (M‐H, Fixed, 95% CI) | 6.86 [0.86, 54.99] |
| 2.1 Anterior and/or posterior repair vs polypropylene mesh | 2 | 291 | Risk Ratio (M‐H, Fixed, 95% CI) | 6.86 [0.86, 54.99] |
| 3 Recurrent anterior wall prolapse (stage 2 or greater) Show forest plot | 3 | 492 | Risk Ratio (M‐H, Fixed, 95% CI) | 1.04 [0.77, 1.40] |
| 3.1 Anterior colporrhaphy vs polypropylene mesh | 2 | 280 | Risk Ratio (M‐H, Fixed, 95% CI) | 1.18 [0.70, 1.97] |
| 3.2 Anterior colporrhaphy vs biological graft | 1 | 87 | Risk Ratio (M‐H, Fixed, 95% CI) | 0.92 [0.65, 1.30] |
| 3.3 Anterior and/or posterior repair vs biological graft | 1 | 125 | Risk Ratio (M‐H, Fixed, 95% CI) | 1.08 [0.33, 3.56] |
| 4 Bladder injury Show forest plot | 1 | 166 | Risk Ratio (M‐H, Fixed, 95% CI) | 0.20 [0.01, 4.01] |
| 5 Stress urinary incontinence (de novo) Show forest plot | 1 | 105 | Risk Ratio (M‐H, Fixed, 95% CI) | 0.98 [0.34, 2.85] |
| 6 Dyspareunia (de novo and persistent) Show forest plot | 2 | Risk Ratio (M‐H, Fixed, 95% CI) | Subtotals only | |
| 6.1 Anterior repair vs polypropylene mesh (de novo) | 2 | 188 | Risk Ratio (M‐H, Fixed, 95% CI) | 1.23 [0.64, 2.36] |
| 6.2 Anterior repair vs polypropylene mesh (persistent) | 1 | 122 | Risk Ratio (M‐H, Fixed, 95% CI) | 1.03 [0.70, 1.52] |
| 7 Quality of life PROLAPSE Show forest plot | 1 | Mean Difference (IV, Fixed, 95% CI) | Subtotals only | |
| 7.1 Pelvic Organ Prolapse/Urinary Incontinence Sexual Questionnaire (PISQ) | 1 | 60 | Mean Difference (IV, Fixed, 95% CI) | 0.40 [‐2.74, 3.54] |