روشهای شستوشو در کاتتریزاسیون ادراری ساکن طولانیمدت در بزرگسالان
چکیده
پیشینه
افرادی که نیاز به تخلیه طولانی‐مدت مثانه با یک کاتتر ثابت دارند، ممکن است دچار انسداد کاتتر شوند. برای پیشگیری از وقوع این عارضه، محلولهای مختلفی برای شستوشوی کاتتر مورد استفاده قرار میگیرد. این مطالعه یک بهروزرسانی از مطالعه مروری منتشرشده در سال 2010 است.
اهداف
تعیین اینکه برخی از روشهای شستوشو از لحاظ اثربخشی، قابلیت پذیرش، عوارض جانبی، کیفیت زندگی، بهتر از بقیه هستند یا خیر و ارزیابی و بررسی منتقدانه خلاصه شواهد اقتصادی مربوط به مدیریت شستوشوی کاتتریزاسیون ادراری ساکن طولانیمدت در بزرگسالان.
روشهای جستوجو
پایگاه ثبت تخصصی کارآزماییهای گروه بیاختیاری در کاکرین را که شامل کارآزماییهای شناساییشده از پایگاه مرکزی ثبت کارآزماییهای کنترل شده کاکرین (CENTRAL)؛ MEDLINE؛ MEDLINE In‐Process؛ MEDLINE Epub Ahead of Print؛ CINAHL؛ ClinicalTrials.gov؛ WHO ICTRP و جستوجوی دستی مجلات و خلاصه مقالات کنفرانسها تا 23 می 2016 بودند، جستوجو کردیم. همچنین تمامی فهرست منابع کارآزماییهای شناساییشده را مورد بررسی قرار داده و با تولید کنندگان و محققان در این زمینه تماس گرفتیم.
معیارهای انتخاب
تمامی کارآزماییهای تصادفیسازی و شبه‐تصادفیسازی شده مربوط به مقایسه روشهای شستوشوی کاتتر (برای مثال شستوشو در برابر عدم‐شستوشو، محلولهای مختلف شستوشو، فراوانی، طول دوره، حجم، غلظت، روش مصرف) در بزرگسالان (16 سال و بالاتر) در هر محیطی (یعنی بیمارستان، خانههای پرستاری/سالمندان، جامعه)، با یک سوند مجرای ادراری یا سوپرا‐پوبیک ثابت که به مدت بیش از 28 روز در آنجا باقی میماند.
گردآوری و تجزیهوتحلیل دادهها
دو نویسنده مرور بهطور مستقل از هم دادهها را استخراج کردند. اختلافات با بحث و گفتوگو حلوفصل شدند. دادهها بر اساس کتابچه راهنمای کاکرین، ارزیابی و تجزیهوتحلیل شدند. اگر دادهها در کارآزماییها بهطور کامل گزارش نشده بودند، از نویسندگان درخواست شدند. برای پیامدهای رتبهای (categorical)، اعدادی که یک پیامد را گزارش میکنند با اعداد در معرض خطر در هر گروه مرتبط بودند تا خطر نسبی (RR) را به دست آورند. برای پیامدهای پیوسته (continuous)، از میانگین و انحراف معیار (standard deviation; SD) برای به دست آوردن تفاوت میانگین (MD) استفاده شد.
نتایج اصلی
هفت کارآزمایی را شامل 349 شرکتکننده انتخاب کردیم، که 217 نفر از آنها مطالعات را کامل کردند. سه کارآزمایی به صورت متقاطع (cross‐over) و چهار کارآزمایی به صورت کارآزماییهای تصادفیسازی و کنترل شده (randomised controlled trials; RCTs) گروه‐موازی انجام شدند. از این تعداد، دو کارآزمایی برای این بهروزرسانی اضافه شدند (یک RCT گروه ‐ موازی با 40 شرکتکننده و یک RCT متقاطع با 67 شرکتکننده). آنالیز سه کارآزمایی متقاطع نتایجی را کمتر از حد مطلوب به همراه داشت، زیرا بر اساس تفاوتهای بین‐گروهی بنا شدند تا تفاوتهای فردی شرکتکنندگان برای مداخلات متوالی. دو کارآزمایی گروه‐موازی، ارزش بالینی محدودی داشتند: یک مورد نتایج مربوط به کاتترهای سوپرا‐پوبیک و مجرای ادراری را ترکیب کرد و دیگری، دادههای مربوط به فقط چهار شرکتکننده را ارائه داد. فقط یک کارآزمایی فاقد محدودیتهای روششناسی معنیدار بود، اما در بهکارگیری و حفظ شرکتکنندگان در این مطالعه مشکل داشت.
مطالعات وارد شده دادههای مربوط به شش پیامد را از نه پیامد اولیه و ثانویه گزارش کردند. هیچکدام از کارآزماییها موارد زیر را مورد بررسی قرار ندادند: تعداد کاتترهای استفاده شده، اقدامات قابلیت پذیرش شستوشو (از جمله رضایت بیمار، ناراحتی بیمار، درد و سهولت استفاده)، یا وضعیت سلامت/ مقیاسهای سلامت روان؛ دادههای بسیار محدودی در رابطه با پیامدهای اقتصادی سلامت گردآوری شد. کارآزماییها، فقط سه مورد را از هشت مقایسه مداخلهای شناسایی شده ارزیابی کردند. دو کارآزمایی به بیش از یک گروه مقایسه پرداختند.
چهار کارآزمایی، شستوشو (محلول سالین یا محلول اسیدی) را در مقابل عدم شستوشو مقایسه کردند. ما مطمئن نیستیم که محلولهای شستوشو (سالین یا اسیدی)، در مقایسه با عدم‐استفاده از محلولهای شستوشو، تاثیر مهمی بر نرخ عفونت راه ادراری علامتدار یا طول مدت باقی ماندن هر کاتتر در محل داشته باشند، زیرا نتایج نامشخص هستند.
چهار کارآزمایی، انواع مختلفی را از محلولهای شستوشو مقایسه کردند؛ محلول سالین در مقابل محلول اسیدی (2 کارآزمایی)؛ محلول سالین در مقابل محلول اسیدی در مقایسه با محلول آنتیبیوتیکی (1 کارآزمایی)، و محلول سالین در برابر محلول آنتیبیوتیکی (1 کارآزمایی). ما مطمئن نیستیم که نوع محلول شستوشو تاثیر مهمی بر میزان عفونت راه ادراری علامتدار یا طول مدت باقی ماندن هر کاتتر در محل داشته باشد، زیرا نتایج نامشخص هستند.
یک کارآزمایی ترکیبات مختلف محلول اسیدی (محلول قویتر در مقابل محلول ضعیفتر) را مقایسه کرد. ما مطمئن نیستیم که ترکیبات مختلف محلولهای اسیدی، تاثیر مهمی بر نرخ عفونت راه ادراری علامتدار یا طول مدت قرارگیری هر کاتتر در محل داشته باشند، زیرا فقط 14 شرکتکننده (از میان 25 مورد به کار گرفته شده)، این کارآزمایی سه‐بازویی و 12 هفتهای را کامل کردند.
چهار مطالعه، اثرات مضر احتمالی استفاده از شستوشو را، مانند وجود خون در محلول شستوشو، تغییرات در فشار خون و اسپاسم مثانه را گزارش کردند.
کارآزماییهای کوچک بسیار کمی وجود داشتند که واجد معیارهای ورود به مرور باشند. خطر بالای سوگیری (bias) در مطالعات انتخاب شده منجر به شکلگیری شواهدی با کیفیت پائین یا بسیار پائین شد.
نتیجهگیریهای نویسندگان
دادههای بهدست آمده از هفت کارآزمایی که روشهای مختلف شستوشو را با هم مقایسه کردند، محدود بوده، و بهطور کلی، کیفیت روششناسی ضعیفی داشته یا ضعیف گزارش شدند. شواهد برای نتیجهگیری در مورد اینکه شستوشو مفید بود یا مضر، کافی نبود. مطالعات دقیقتر و با کیفیت بالا که توان کافی آزمون را برای شناسایی منافع استفاده از شستوشو در مقایسه با عدم شستوشو داشته باشند، مورد نیاز است. همچنین انجام کارآزماییهایی برای مقایسه محلولهای مختلف شستوشو، حجم شستوشو، و فراوانیها یا زمانبندیهای شستوشو مورد نیاز است.
PICO
خلاصه به زبان ساده
محلولهای شستوشوی کاتتر ادراری چقدر موثر هستند؟
سوال مطالعه مروری
هدف ما ارزیابی اثربخشی محلولهای شستوشوی کاتتر ادراری بود. این بهروزرسانی مطالعه مروری است که پیش از این در سال 2010 منتشر شد.
پیشینه
به دلایل متعددی، برخی از افراد قادر به خالی کردن درست و کامل مثانه خود نیستند یا ادرار نشت میکند (بیاختیاری ادراری). کاتترهای ادراری، لولههای نرمی هستند که داخل مثانه جاگذاری میشوند تا ادرار را به داخل یک کیسه جمعآوری هدایت کنند و اغلب برای کمک به افراد مبتلا به بیاختیاری ادراری مورد استفاده قرار میگیرند. نوع مشابهی از کاتتر برای مردان و زنان استفاده میشود.
در انگلستان، حدود 4% از افرادی که مراقبت در منزل دریافت میکنند، و حدود 9% از بیماران در خانههای سالمندان (اما احتمالا تا حدود 40% در بعضی مناطق)، با کاتترهای طولانی‐مدت زندگی میکنند.
مراقبت از کاتتر ادراری ممکن است دشوار باشد، و ممکن است مشکلاتی رخ دهد، به خصوص اگر به مدت طولانی استفاده شود.
انسداد کاتتر زمانی رخ میدهد که مدت زمان طولانی در مثانه نگاه داشته شود. انسداد ایجاد شده ممکن است در نیمی از همه افرادی که دارای کاتترهای طولانی‐مدت هستند، درد و ناراحتی ایجاد کند. محلولهای مایع را میتوان به داخل کاتتر تزریق کرد تا مانع از تشکیل یا از بین رفتن انسدادها شوند. این کار شستوشو (washout) نامیده میشود. این مشکلات نشان میدهد که ارائه کمک از سوی متخصصان مراقبت سلامت به افراد مبتلا به انسداد کاتتر ادراری ضروری است.
تاریخ جستوجو
شواهد تا 23 می 2016 بهروز است.
ویژگیهای مطالعه
ما هفت مطالعه را وارد کردیم که اطلاعات مربوط به 217 نفر را از 349 بیماری که این کارآزمایی را آغاز کرده و مطالعه را کامل کردند، ارائه دادند. دو مطالعه برای این بهروزرسانی، جدید بودند. مطالعاتی که بین سالهای 1979 و 2014 منتشر شدند، در ایالات متحده آمریکا (3 مطالعه)، انگلستان (2 مطالعه) انجام گرفتند، و یک مطالعه نیز هم در کانادا و هم در فنلاند انجام شد.
این مطالعات، افراد دارای کاتترهای طولانی‐مدت را انتخاب کردند. افراد بهطور تصادفی به گروه شستوشو یا عدم شستوشو اختصاص یافته، و اثرات با هم مقایسه شدند. همچنین مطالعاتی را وارد کردیم که انواع مختلفی را از محلولهای شستوشو مقایسه کردند.
چهار مطالعه، اثرات مضر احتمالی استفاده از شستوشو را، مانند وجود خون در محلول شستوشو، تغییرات در فشار خون و اسپاسم مثانه را گزارش کردند.
منابع تامین مالی مطالعه
مطالعات وارد شده توسط Novobay Pharmaceuticals Inc (Linsenmeyer 2014)؛ Alberta Heritage Foundation for Medical Research and the Canadian Nurses Foundation (Moore 2009)؛ National institute of Aging, National Institutes of Health (Muncie 1989)؛ Paralyzed Veterans of America Spinal Cord Research Foundation (Waites 2006) حمایت مالی شدند. سه مطالعه، منابع مالی خود را گزارش نکردند.
نتایج کلیدی
شواهد تحقیقاتی کافی و مناسب برای تعیین اینکه شستوشوی کاتتر مفید بود یا خیر، وجود نداشت.
کیفیت شواهد
بهطور کلی، کارآزماییهای وارد شده کوچک بوده و نواقص روششناسی داشتند. این مشکلات شامل جزئیات محدود مربوط به چگونگی تصادفیسازی شرکتکنندگان درون گروهها و نحوه کورسازی شرکتکنندگان و محققان نسبت به این گروهها بودند. سطح کیفیت شواهد پائین تا بسیار پائین بود. انجام کارآزماییهای جدیدی مورد نیاز است تا بهطور قطعی به این سوال پژوهشی پاسخ داده شود.
Authors' conclusions
Summary of findings
| Any washout compared to no washout for participants with long‐term indwelling urinary catheterisation | ||||||
| Patient or population: Long‐term indwelling urinary catheterisation in adults | ||||||
| Outcomes | Illustrative comparative risks* (95% CI) | Relative effect | No of Participants | Quality of the evidence | Comments | |
| Assumed risk | Corresponding risk | |||||
| No washout | Any washout | |||||
| Symptomatic UTI (Number of participants with symptomatic UTI, citric acid or saline washout versus no washout) | 0 per 1000 | 0 per 1000 (0 to 0) | Not estimable | 53 | ⊕⊕⊝⊝ | No participants met the study criteria for symptomatic UTI |
| Symtomatic UTI Mean number of episodes of high temperature (saline washout versus no washout) | ‐ | The mean number of episodes of high temperature (saline washout versus no washout) in the intervention groups was: 0.78 (‐0.14 to 1.70) | Not estimable | 23 | ⊕⊝⊝⊝ | |
| Symptomatic UTI Mean number of episodes of high temperature due to possible urinary origin (saline washout versus no washout) | ‐ | The mean number of episodes of high temperature of possible urinary origin (saline washout versus no washout) in the intervention groups was: 1.80 (1.02 to 2.58) | Not estimable | 23 | ⊕⊝⊝⊝ | |
| Number of catheters used (Number of participants needing catheter replacement, saline washout versus no washout) | 526 per 1000 | 353 per 1000 (179 to 689) | RR 0.67 | 40 | ⊕⊝⊝⊝ | |
| Length of time each catheter was in situ | Not estimable | Not reported | No data available | |||
| Catheter removal rates due to blockage/infection | Not estimable | Not reported | No data available | |||
| Rates of asymptomatic bacteriuria | Not estimable | Not reported | No data available | |||
| *The basis for the assumed risk (e.g. the median control group risk across studies) is provided in footnotes. The corresponding risk (and its 95% confidence interval) is based on the assumed risk in the comparison group and the relative effect of the intervention (and its 95% CI). | ||||||
| GRADE Working Group grades of evidence | ||||||
| 1 Downgraded two levels: The sample size was small (N = 53). Personnel not blinded to allocation of treatment. Blinding of outcome assessment not clear. | ||||||
| One washout solution versus another for participants with long‐term indwelling urinary catheterisation | ||||||
| Patient or population: Long‐term indwelling urinary catheterisation in adults | ||||||
| Outcomes | Illustrative comparative risks* (95% CI) | Relative effect | No of Participants | Quality of the evidence | Comments | |
| Assumed risk | Corresponding risk | |||||
| Control | One washout solution versus another | |||||
| Symptomatic UTI Number of participants with symptomatic UTI (citric acid versus saline) | 0 per 1000 | 0 per 1000 (0 to 0) | Not estimable | 33 | ⊕⊕⊝⊝ | No participants met the study criteria for symptomatic UTI |
| Symtomatic UTI Mean number of episodes of high temperature | Not estimable | Not reported | No data available | |||
| Symptomatic UTI Mean number of episodes of high temperature due to possible urinary origin | Not estimable | Not reported | No data available | |||
| Number of catheters used Number of participants needing catheter replacement | Not estimable | Not reported | No data available | |||
| Length of time each catheter was in situ | Not estimable | Not reported | No data available | |||
| Catheter removal rates due to blockage/infection | Not estimable | Not reported | No data available | |||
| Rates of asymptomatic bacteriuria | Not estimable | Not reported | No data available | |||
| *The basis for the assumed risk (e.g. the median control group risk across studies) is provided in footnotes. The corresponding risk (and its 95% confidence interval) is based on the assumed risk in the comparison group and the relative effect of the intervention (and its 95% CI). | ||||||
| GRADE Working Group grades of evidence | ||||||
| 1 Downgraded two levels: The sample size was small (N = 33). Personnel not blinded to allocation of treatment. Blinding of outcome assessment not clear. | ||||||
Background
Description of the condition
Indwelling catheterisation may be used for people with intractable incontinence or chronic bladder outlet obstruction. People may require long‐term urinary catheterisation for a number of reasons: urinary retention (incomplete emptying of the bladder) caused by benign prostatic hyperplasia (enlarged prostate) or prostate tumour, reduced bladder contractility, or urinary incontinence (involuntary leakage of urine) not amenable to toileting, intermittent catheterisation, or any other method of management. People with conditions such as multiple sclerosis, dementia, stroke, spina bifida, and spinal cord injury may be susceptible to these problems.
Numbers of people being managed using long‐term catheters is difficult to estimate. Between April and May 2013, 1181 long‐term care facilities in Europe participated in a point prevalence survey of healthcare‐associated infection and related risk factors. The median percentage of long‐term care facility residents with a urinary catheter was 6.3%; the highest percentage of urinary catheterisation was reported in the Czech Republic (33.3%) (ECDC 2014). The percentage of people receiving care at home with a urinary catheter was estimated to be 5.4% in another European study (range 0% to 23%) (Sørbye 2005). Those using catheters long‐term often experience complications such as blockage, leakage and infection. These complications can have significant implications for resource use and quality of life due to increased general practitioner and hospital outpatient appointments, emergency admissions and nursing resource demands (Evans 2000).
Bacterial infection
Bacteriuria, which occurs when bacteria colonise the urinary tract, is the root cause of catheter‐associated complications. Bacteriuria risk increases with days of catheterisation (Garibaldi 1974; Stark 1984); over time, all people with a catheter will develop bacteruria (SIGN 2012). Increased levels of bacteriuria may expose people to increased risk of complications, including catheter‐associated urinary tract infection (CAUTI), secondary bacteraemia (blood infection) and infection at other sites, such as the joints. Up to 30% of long‐term catheterised people will become symptomatic and require some intervention (Saint 1999). Bacteriuria and CAUTI are significant problems in long‐term care. People with urinary catheters are up to 6.5 times more likely to develop urinary tract infection (Sørbye 2005); the prevalence of CAUTI has been estimated to be 8.5% (Getliffe 2006).
In an attempt to deal with the problems of bacterial colonisation, encrustations (biofilm) and CAUTI, catheter washouts or irrigations (sometimes called bladder washouts or irrigations) were introduced (Getliffe 2003). Over the last few decades, various antibiotic and antiseptic solutions have been used as washout solutions with the aim of preventing and treating catheter‐associated problems. However, evidence about their effectiveness is conflicting. Concerns exist that use of washouts can damage the bladder mucosa and increase infection rates due to opening the closed catheter system. Current UK National Health Service guidelines specify that antibiotic solutions are not effective in treating CAUTI (HIS 2004). Use of antiseptic washouts is also believed to be of little value for the prevention and treatment of CAUTI and is no longer advised in practice (Pellowe 2003).
Catheter blockage
The most common problem of long‐term indwelling catheters is the formation of encrustations on the luminal and outer surfaces of the catheter with consequent blockage and by‐passing of urine resulting in urinary leakage. Nearly half of all people with an indwelling catheter experience problems with catheter blockage due to encrustation (Getliffe 1992; Kohler‐Ockmore 1996; Kunin 1987; Roe 1987). Blockage of an indwelling catheter is traumatic, causing pain and distress. The most commonly isolated bacteria in blockages is Proteus mirabilis (Stickler 2010), which may cause crystalline deposits (such as calcium phosphate and magnesium ammonium phosphate (struvite)) to build up through a rise in pH caused by the metabolism of urea to ammonia and bicarbonate (Hesse 1992; Wilks 2015).
Fungal infection
Candiduria (the presence of Candida species in the urine) can also occur in people with long‐term indwelling catheters, and its incidence is directly related to duration of catheterisation, hospitalisation and antibiotic use (Hamory 1978). Candida spp are thought to be the second most common micro‐organisms causing CAUTI or asymptomatic colonisation in people who are catheterised (Padawer 2015). Candiduria is generally asymptomatic but rare complications can include fungal balls in the bladder or renal pelvis, kidney infection and disseminated candidiasis (infection with Candida spp). Management for people with asymptomatic catheter‐associated candiduria is unclear. Removing the catheter results in the disappearance of candiduria in about a third of people. For people who are asymptomatic. but in whom candiduria persists or must remain catheterised, several management techniques have been used, primarily involving oral medication or bladder irrigation. The solutions used and the method of administration (continuous irrigation), in the treatment of fungal infections are very different and hence were not evaluated in this review.
Description of the intervention
Current practice for the management of people with catheter encrustation and blockage varies but is largely dependent on the use of catheter maintenance solutions. Treatments commonly used for people living in the community include washing out the catheter with saline or acidic solutions or both. However, there is much debate about this practice.
How the intervention might work
In vitro evidence suggests that normal saline is ineffective in diminishing encrustations but there is some evidence that methenamine preparations and acidic washouts reduce catheter encrustation (Getliffe 1994; Hesse 1989; King 1991). Other research work questions the efficacy of acidification of the urine for preventing catheter encrustation (Bibby 1993). Furthermore, none of the continence advisers questioned in a 1993 study thought that regular washouts were useful compared to 25% of district nurses who thought they were (Capewell 1993). Despite the controversy surrounding the effectiveness of washouts for managing encrustation and blockage, they are widely used (Pomfret 2004).
Why it is important to do this review
There is no consensus regarding the indications for use of catheter washouts nor the method of administration, frequency, duration of administration or choice of solution. The wide variety of solutions available, combined with the multiplicity of possible procedures for their application, and potential risks posed, indicated need for an update of this systematic review. We aimed to summarise the evidence from randomised controlled trials on the use of catheter washouts for the management of adults with long‐term indwelling urinary catheters.
Objectives
To determine if certain washout regimens are better than others in terms of effectiveness, acceptability, complications, quality of life and critically appraise and summarise economic evidence for the management of long‐term indwelling urinary catheterisation in adults.
Methods
Criteria for considering studies for this review
Types of studies
All randomised or quasi‐randomised controlled trials, including cross‐over designs, evaluating the use of urinary catheter washouts in long‐term catheterised adults.
Types of participants
Adults, aged at least 16 years, in any setting (i.e. hospital, nursing or residential home, community) with an indwelling urethral, suprapubic or perineal catheter in situ for more than 28 days. Adults whose treatment combined intermittent catheterisation with periods of indwelling catheterisation were included only if the indwelling catheter had been in situ for more than 28 days at the time of data collection.
Types of interventions
The interventions considered included catheter washouts with water, saline, antiseptic, acidic, antimicrobial or antibiotic solutions alone or in any combination. Studies were considered that compared:
-
washouts with controls who did not receive washouts;
-
washouts with other participants who received different washouts;
-
different washout regimens at different time periods i.e. cross‐over studies; and
-
different washout regimens i.e. frequency, duration, volume, concentration, method of administration.
Throughout the literature, the terminology used to refer to the 'washing‐out' of catheters is somewhat confusing. The term 'washout' tends to be used in the US literature whereas in the UK, catheter washouts are often referred to as 'catheter maintenance solutions' or 'bladder washout' which can cause confusion with bladder irrigation/lavage used after surgery (Getliffe 1996). In this review all trials referring to catheter or bladder washouts were considered with the exception of post‐surgical bladder irrigations, therapeutic bladder instillations used, for example, in the treatment of people with cancer, and continuous irrigations with antifungal solutions.
Trials that involved irrigation of catheter drainage bags were not considered in this review. Other types of interventions to prevent or reduce encrustation or infection, such as changes in fluid intake or use of oral prophylactic antibiotics, were also excluded.
We planned to compare:
-
use of any type of catheter washout (e.g. water, saline, antiseptic, antibiotic) versus not using one;
-
one type of catheter washout solution versus another type;
-
clinically or microbiologically indicated washout versus routine washout;
-
long intervals between catheter washouts versus short intervals;
-
one method of administration of catheter washouts (e.g. agitation, gravity, syringe) versus another method;
-
smaller volumes of washout solution versus larger volumes;
-
a stronger solution of washout versus a weaker solution; and
-
a single washout instillation versus two or more sequential washout instillations of the same type.
Types of outcome measures
Primary outcomes
Catheter washouts were introduced to prevent or reduce the occurrence of catheter‐associated infection. In recent years their use has been primarily aimed at minimising the effects of recurrent encrustation and blockage. Primary outcomes considered were objective measures of catheter‐associated urinary tract infection (CAUTI; which ranged in definitions among trials) and catheter blockage. Such measures include:
-
symptomatic urinary tract infections (UTIs) (as defined by the trialists);
-
number of catheters used;
-
length of time each catheter was in situ;
-
catheter removal rates due to blockage or infection (definitions of blockage or infection were those used in the trial reports); and
-
rates of asymptomatic bacteriuria.
Secondary outcomes
1. Washout acceptability measures
Reported levels of patient discomfort associated with washouts; patient satisfaction with the outcome of washouts (i.e. minimisation of catheter‐associated problems, reduction in pain and trauma when the catheter was withdrawn); and ease of use of washouts/washout regimens for patients, their carers and healthcare practitioners were considered.
2. Health status or measures of psychological health
Quality of life and psychological outcome indicators as measured by generic validated instruments such as Short Form 36 (SF‐36) (Ware 1993) and Hospital Anxiety and Depression Score (HADS) (Zigmond 1983) were sought.
3. Measures of complications or adverse effects of washouts
Adverse effects that result at the time of washout administration, such as inability to tolerate washout solution and irritation or trauma to urethral or bladder tissue were considered. These effects may be indicated by bypassing or bleeding around the catheter or by volume of red blood cells returned during washout procedure. Use of prophylactic antibiotics and rescue antibiotics were also included.
4. Health economic outcomes
Economic measures considered included costs of washouts, resource implications associated with different washouts/washout regimens, and any reports of formal economic evaluations of washouts, such as cost‐effectiveness or cost‐utility analysis.
Search methods for identification of studies
We did not impose any language or other limitations on the searches.
Electronic searches
We searched the Cochrane Incontinence Group Specialised Trials Register for this update. Details of the search methods used to build the Specialised Register are presented in the Group's module in the Cochrane Library. The Register contains trials identified from the Cochrane Central Register of Controlled Trials (CENTRAL), MEDLINE, MEDLINE In‐Process, MEDLINE Epub Ahead of Print, CINAHL, ClinicalTrials.gov, WHO ICTRP, UK Clinical Research Network Portfolio and results from handsearching journals and conference proceedings. Many of the trials in the Cochrane Incontinence Group Specialised Register are also contained in CENTRAL. The last search was conducted 23 May 2016.
The terms used to search the Cochrane Incontinence Specialised Register are given in Appendix 1.
Searches performed by the review authors for the 2010 version of this review (Hagen 2010) are detailed in Appendix 2.
Searching other resources
We searched the reference lists of relevant articles for other possibly relevant trials.
For the 2010 version of the review key researchers in the field of catheter management, and catheter maintenance solution manufacturers (BBraun, Coloplast and Bard) were contacted to identify other possibly relevant trials (Hagen 2010).
We contacted the authors of any ongoing studies to enquire as to whether any results were available (October 2015).
Data collection and analysis
Selection of studies
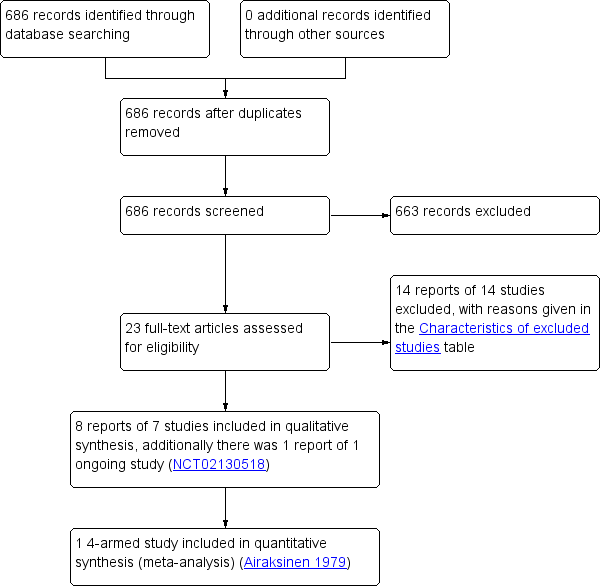
Two review authors (AS, SH) independently screened titles and abstracts for inclusion of all the potential studies identified as a result of the search. We retrieved the full‐text study reports and the same two review authors independently screened the full‐text to identify studies for inclusion. We recorded reasons for exclusion of the ineligible studies. We resolved disagreements through discussion or, if required, we consulted a third review author (WM). We identified and excluded duplicates and collated multiple reports of the same study so that each study rather than each report was the unit of interest in the review. We recorded the selection process in a PRISMA flow diagram (Figure 1), and Characteristics of excluded studies.

Study flow diagram
Data extraction and management
We used a data collection form for study characteristics and outcome data which was used for the 2010 version of this review (Hagen 2010). Two review authors (AS, SH) extracted study characteristics from included studies. We extracted the following study characteristics.
-
Methods: study design, total duration of study, details of any run‐in period, number of study centres and location, study setting, withdrawals, random allocation sequence, outcome assessment blinding and date of study.
-
Participants: N, mean age, age range, gender, inclusion criteria, and exclusion criteria.
-
Interventions: intervention, comparison, method of administration.
-
Outcomes: primary and secondary outcomes specified and collected, and time points reported.
-
Notes: funding for trial, and notable conflicts of interest of trial authors.
Two review authors (AS, SH) independently extracted outcome data from included studies. We noted in Characteristics of included studies if outcome data were not reported in a usable way. We resolved disagreements by consensus or by involving a third review author (WM). One review author (SH) transferred data into the Review Manager file (RevMan 2014). We double‐checked that data were entered correctly by comparing the data presented in the systematic review with the study reports. A second review author (AS) spot‐checked study characteristics for accuracy against the trial report.
Assessment of risk of bias in included studies
Two review authors (AS, SH) independently assessed risk of bias for each study using the criteria outlined in the Cochrane Handbook for Systematic Reviews of Interventions (Higgins 2011). We resolved disagreements by discussion or by involving another review author (WM). We assessed the risk of bias according to the following domains.
-
Random sequence generation.
-
Allocation concealment.
-
Blinding of participants and personnel.
-
Blinding of outcome assessment.
-
Incomplete outcome data.
-
Selective outcome reporting.
-
Other bias.
We graded each potential source of bias as high, low or unclear and justified our judgement in the 'Risk of bias' table. We summarised the risk of bias judgements across different studies for each of the domains listed. We considered blinding separately for different key outcomes, where necessary. Where information on risk of bias related to unpublished data or correspondence with a trialist, we noted this in the 'Risk of bias' table.
When considering treatment effects, we took into account the risk of bias for the studies that contribute to that outcome.
Measures of treatment effect
We intended to enter the outcome data for each study into the data tables in Review Manager 5 to calculate the treatment effects (RevMan 2014). We planned to use risk ratio for dichotomous outcomes, and mean differences or standardised mean differences for continuous outcomes. This was not possible because only single studies were available for analyses.
Unit of analysis issues
We planned to analyse cross‐over trials with continuous outcomes by determining the mean and standard error of the person difference between treatment periods; however, data from cross‐over trials were not reported appropriately and this was not possible.
Dealing with missing data
We contacted investigators or study sponsors to verify key study characteristics and obtain missing numerical outcome data where possible. Where this was not possible, and the missing data were thought to introduce serious bias, we planned to explore the impact of including such studies in the overall assessment of results by a sensitivity analysis. However, this was not possible.
Assessment of heterogeneity
We planned to use the I² statistic to measure heterogeneity among the trials in each analysis. If we identified substantial heterogeneity, we planned to report it and explore possible causes by prespecified subgroup analysis. However, this was not possible as only single studies were identified.
Assessment of reporting biases
We planned that if the meta‐analysis included more than 10 trials, we would construct a funnel plot to assess reporting biases (Higgins 2011). However, this was not possible.
Data synthesis
Included trial data were to be analysed as described in the Cochrane Handbook for Systematic Reviews of Interventions (Higgins 2011). It was planned that where possible (only with two independent comparisons from one trial), meta‐analysis would be undertaken using a fixed‐effect model approach, if there was no evidence of significant heterogeneity. For cross‐over trials we planned to analyse data as recommended in section 16.4 of the Handbook. However, no suitable data were available and meta‐analysis was not performed.
GRADE and 'Summary of findings' table
We created 'Summary of findings' tables using clinically important primary outcomes:
-
rates of symptomatic UTIs (as defined by the trialists);
-
number of catheters used;
-
length of time each catheter was in situ;
-
catheter removal rates due to blockage or infection (definitions of blockage or infection were those used in the trial reports); and
-
rates of asymptomatic bacteriuria.
We used the five GRADE considerations (study limitations, consistency of effect, imprecision, indirectness and publication bias) to assess the quality of the body of evidence as it relates to the studies which contribute data to the meta‐analyses for the prespecified outcomes (Atkins 2004). We used methods and recommendations described in Section 8.5 and Chapter 12 of the Cochrane Handbook for Systematic Reviews of Interventions (Higgins 2011) using GRADEpro GDT software (GRADEpro GDT 2015). We justified all decisions to down‐ or up‐grade the quality of studies using footnotes, and made comments to aid the reader's understanding of the review where necessary.
Summary of findings tables were not presented for comparisons where no studies were identified. Presentation of summary of findings tables for these comparisons will be considered in future updates of the review if more data becomes available.
Subgroup analysis and investigation of heterogeneity
We intended to perform subgroup analysis to explore the impact of subgroups on the intervention. Insufficient data were provided and analyses was not performed.
Sensitivity analysis
We intended to conduct sensitivity analysis by including or excluding trials we judged as high risk of bias. We did not conduct sensitivity analysis because meta‐analysis was not performed.
Results
Description of studies
Results of the search
The search identified 686 records (Figure 1). Of these, 23 reported potentially eligible studies. Clarification was sought at this stage regarding study characteristics from five study authors: two authors responded, two authors could not be contacted and a response was not received from one author.
This update included two new studies (Airaksinen 1979; Linsenmeyer 2014; 107 participants) to bring the total number of included studies to seven (349 participants randomised). Airaksinen 1979 was identified as a study awaiting assessment in the 2010 review. Four studies were parallel‐group randomised controlled trials (RCTs) and included a total of 213 participants (Airaksinen 1979; McNicoll 2003; Moore 2009; Waites 2006) and three were randomised cross‐over trials which included a total of 136 participants (Kennedy 1992; Linsenmeyer 2014; Muncie 1989). Three studies were conducted in the USA (Linsenmeyer 2014; Muncie 1989; Waites 2006), two in the UK (Kennedy 1992; McNicoll 2003), and one each in Canada (Moore 2009) and Finland (Airaksinen 1979).
One study (NCT02130518) is ongoing and results are not yet available (see Characteristics of ongoing studies).
Included studies
Participants
Airaksinen 1979 studied 40 participants (16 males, 24 females) who were recruited from a Finnish health service centre and were randomly assigned into four groups (two experimental and two control). Washouts were withheld in the control groups.
Kennedy 1992 studied 25 elderly women from three UK hospitals who were long‐term catheterised. This study comprised a within‐patient comparison of three different solutions (saline, citric acid 3.23%, citric acid 6%). Participants received all three washout solutions but in different orders.
Linsenmeyer 2014 studied 67 adults with neurogenic bladder who had long‐term indwelling transurethral or suprapubic urinary catheters in this multicentre study conducted in the USA. This study compared the use of an antimicrobial washout solution with saline. The study was funded by Novobay Pharmaceuticals.
McNicoll 2003 studied 11 people in this UK‐based study who were living in the community with long‐term catheters known to block with encrustation. This study compared the use of citric acid washouts with planned catheter changes.
Moore 2009 studied 73 (36 males, 37 females) Canadian community‐dwelling or long‐term care adults with long‐term indwelling catheters that required changing every three weeks or less, requiring supportive or continuing care. Participants were randomly assigned to one of three groups: control (usual care, no washout), saline washout or acidic washout. The study was funded by the Alberta Heritage Foundation for Medical Research and the Canadian Nurses Foundation.
Muncie 1989 studied 44 long‐term hospitalised female patients at one centre in Baltimore USA, aged 18 years or more who had indwelling urethral catheters in place for 30 consecutive days or longer. This randomised cross‐over trial compared saline washout with no washout and was funded by the National Institutes of Health.
Waites 2006 randomised 89 community‐residing patients (49 male, 40 female) in this USA‐based study with neurogenic bladder managed by indwelling catheter. This trial compared twice daily washout using one of three different solutions (saline, acetic acid, neomycin‐polymyxin). This study was funded by the Paralyzed Vetrans of America Spinal Cord Research Foundation.
Interventions
Three trials compared washout (using saline and/or acidic solution) with no washout (Airaksinen 1979; Moore 2009; Muncie 1989). Three trials compared different types of washout solution (Kennedy 1992; Linsenmeyer 2014; Waites 2006). Kennedy 1992 included a comparison of alternative compositions of an acidic solution, and Linsenmeyer 2014 compared an antimicrobial solution with saline. McNicoll 2003 compared washout use with planned catheter removal. The protocol for the planned catheter removal group in McNicoll 2003 was not described, but varied from patient to patient. McNicoll 2003 was included in analyses comparing washout versus no washout.
Washout versus no washout
Moore 2009 reported that participants were randomised to one of three groups: usual care with no washout; weekly catheter washout with 50 mL sterile normal saline; and weekly catheter washout with 50 mL sterile Contisol (also known as Suby G) (citric acid 3.23%). Study endpoints were eight weeks, three or more catheter changes, or symptomatic UTI requiring antibiotics.
Muncie 1989 compared 10 weeks of once daily normal saline washout (30 mL via syringe) with 10 weeks of no washout. New catheters were inserted at the beginning and end of each study phase, and drainage bags were changed weekly in both groups. The intervention duration was 24 weeks (2‐week no washout run‐in period, 10‐week washout or no washout phase, and 2‐week no intervention period before entering alternate phase).
Airaksinen 1979 randomised 40 patients to four groups of 10 participants. Group 1 had Silicath catheter with regular wash out; group 2 also had Silicath catheter but without washout; group 3 had Silastic catheter with wash out; and group 4 had Silastic catheter but without washout. Those groups who received the washout had this at two week intervals with normal saline; the volume used was 10 mL or 20 mL depending on the size of the catheter.
McNicoll 2003 included two parallel groups: daily instillation of citric acid catheter maintenance solution, and planned catheter removal. The volume of solution and method of administration in the washout group were not stated. The control group were to receive "planned catheter changes" but the protocol was not described and this varied among patients. The intervention duration was 12 weeks.
Different types of solution
Three types of solution were evaluated in Kennedy 1992: three weeks of twice weekly washout with 0.9% sodium chloride (saline); three weeks of twice weekly washout with Suby G; three weeks of twice weekly washout with Solution R (citric acid 6%, gluconolactone 0.6%, light magnesium carbonate 2.8%, disodium edetate 0.01%). All washouts were administered by attaching a 100 mL sterile, pre‐packed sachet to the catheter and allowing it to drain into the bladder via gravity. The intervention duration was 12 weeks (1‐week normal saline washout run‐in period, plus a 3‐week phase with each of the solutions, and 1‐week normal saline washout between solutions).
Waites 2006 compared three solutions: eight weeks of twice daily normal saline washout; eight weeks of twice daily 0.25% acetic acid washout; and eight weeks of twice daily neomycin‐polymyxin GU washout (containing 40 mg/mL neomycin sulphate and 200,000 U/mL polymyxin B). At each washout, 30 mL of the irrigant was instilled for 20 minutes via a syringe.
Moore 2009 had three arms and provided a comparison of saline and Contisol washout solutions in addition to a washout versus no washout comparison.
Linsenmeyer 2014 compared different treatment regimens: 0.2% auriclosene in preliminary formulation was dosed for over 2 weeks (3 times/week), 0.2% auriclosene was dosed on the same schedule, 0.2% auriclosene twice weekly over four weeks. The control was saline. Participants were randomised to one irrigation solution for the first treatment regimen and after a washout period, irrigated with the other solution.
A stronger solution of washout versus a weaker solution
In Kennedy 1992, two groups received washouts with different compositions of acidic solution: one solution contained 3.23% citric acid (Suby G) and the other 6% citric acid (Solution R). However, other chemical components of the two solutions also differed.
Excluded studies
See Characteristics of excluded studies. We excluded 14 studies; the most common reasons for exclusion were that participants were not catheterised for more than 28 days or the study was not an RCT (Andersson 1986; Bach 1990; Bruun 1978; Davies 1987; Elliott 1989; Elliott 1990; Furuno 1998; Gelman 1980; Kennedy 1984; Meyers 1964; Robertson 1990; Ruwaldt 1983; Vainrub 1977; Warren 1978).
Ongoing studies
One randomised, double‐blinded study (NCT02130518) is currently ongoing and aims to compare the use of 0.2% auriclosene solution (8 treatments over 4 weeks) with a placebo comparator auriclosene vehicle solution (8 treatments over 4 weeks). Authors were contacted and responded that no results for this trial were currently available. This study is being conducted in the USA and is funded by NovoBay Pharmaceuticals. Further details are presented in Characteristics of ongoing studies.
Risk of bias in included studies
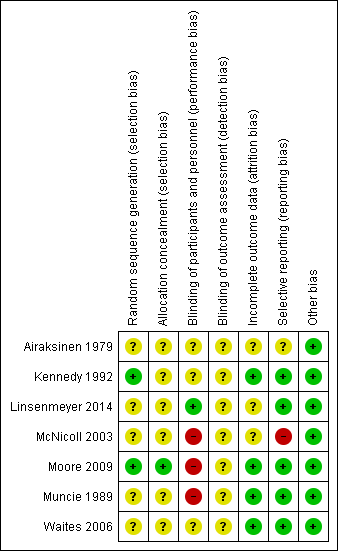
All but one trial had at least one factor associated with risk of bias (Figure 2; Figure 3).
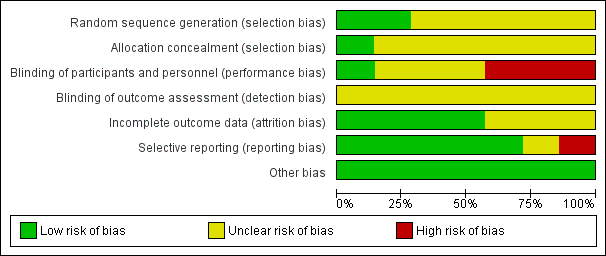
Methodological quality graph: review authors' judgements about each methodological quality item presented as percentages across all included studies

Methodological quality summary: review authors' judgements about each methodological quality item for each included study
Allocation
Little information was provided about the process of concealment of group allocation in most included trials. In Kennedy 1992 it was assumed the allocation process was not concealed because random number tables were used to determine the order in which participants received the three solutions; this study was assessed at unclear risk of bias. Five studies indicated that participants were randomly allocated to study groups, but details were not provided (Airaksinen 1979; Linsenmeyer 2014; McNicoll 2003; Muncie 1989; Waites 2006). These studies were assessed as unclear risk of bias. Group assignment was determined by a computer‐generated list of random numbers, placed in opaque envelopes, which were opened by the participant after consent was obtained in Moore 2009 (low risk of bias).
Blinding
Most studies gave insufficient or no information relating to blinding. This may have been because blinding in this area of research is difficult; both participants and healthcare providers are aware of bladder washout being performed, and different washout solutions may look different and can be identified. There were no details about blinding of participants, healthcare providers or study assessors in relation to the intervention in four studies (Airaksinen 1979; Kennedy 1992; McNicoll 2003; Muncie 1989). These were assessed as unclear risk of bias. Moore 2009 acknowledged that it was not possible to blind the research nurse (who was also the outcome assessor who performed the washout) to the two washout solutions due to the nature of the packaging. Participants and healthcare providers in two studies were blinded to treatment status but descriptions were not provided (Linsenmeyer 2014; Waites 2006). These studies were assessed at low and unclear risk of bias, respectively.
Incomplete outcome data
All included trials reported significant rates of withdrawals and drop‐outs, resulting in incomplete outcome data. However, withdrawals and drop‐outs were well described generally with four trials assessed as low risk and three of unclear risk. Two trials (Muncie 1989; Waites 2006) explored differences between completers and non‐completers. Two small trials (Kennedy 1992; McNicoll 2003) reported serious losses of participants resulting in few data for analysis (14 and 4 participants, respectively), compared with larger analysis data sets of other trials (Airaksinen 1979 N = 36, Linsenmeyer 2014 N = 48, Moore 2009 N = 53, Muncie 1989 N = 32, and Waites 2006 N = 52).
Selective reporting
Most trials reported all outcomes in results sections and were assessed as low risk. There was some discrepancy in outcomes reported in Airaksinen 1979 which was assessed as unclear risk of bias. McNicoll 2003 stated in the methods section that UTI rates were to be reported, but these were not described in the results. This trial was judged at high risk of bias.
Other potential sources of bias
Only Moore 2009 stated that data were analysed using an intention‐to‐treat analysis for the primary outcome variable; that is, the length of time each catheter was in situ was recorded as the date the participant withdrew from the study. The remaining trials either did not analyse according to the intention‐to‐treat principle (Linsenmeyer 2014; McNicoll 2003; Muncie 1989; Waites 2006) or this was unclear (Airaksinen 1979; Kennedy 1992).
Effects of interventions
See: Summary of findings for the main comparison Any washout compared to no washout for participants with long‐term indwelling urinary catheterisation; Summary of findings 2 One washout solution versus another for participants with long‐term indwelling urinary catheterisation
With two exceptions (Linsenmeyer 2014; McNicoll 2003), all included studies reported data on bacteriuria or symptomatic UTI. All except two trials (Airaksinen 1979; Waites 2006) presented data on catheter removal rates, either reporting mean number of days a catheter was in situ (Kennedy 1992; Moore 2009) or mean number of replacements (McNicoll 2003; Muncie 1989). Kennedy 1992, Linsenmeyer 2014, and Moore 2009 looked specifically at the problem of catheter blockage due to encrustation. Four trials reported data on complications or adverse events of washouts: Kennedy 1992 reported red blood or urothelial cells in the washout fluid; Moore 2009 investigated incidence of microscopic haematuria and leukocytes in pre‐washout dipstick urinalysis; Linsenmeyer 2014 looked at irrigation‐induced autonomic dysreflexia; and Waites 2006 reported bladder spasms due to the washout procedure. Only McNicoll 2003 considered health economic outcomes, reporting on the cost and time of administration.
Some included trials addressed more than one pre‐identified intervention comparison. Four trials provided data on washout versus no washout (Airaksinen 1979; McNicoll 2003; Moore 2009; Muncie 1989). Four trials compared different types of washout solutions (Kennedy 1992; Linsenmeyer 2014; Moore 2009; Waites 2006). Kennedy 1992 compared three washout solutions: saline with one acidic solution (Solution R, contained 6% citric acid) with another alternative composition (Suby G, contained 3.23% citric acid).
Insufficient data were available in a form that enabled entry for meta‐analysis. No data were entered from four trials (Kennedy 1992; McNicoll 2003; Muncie 1989; Waites 2006). Kennedy 1992 and Muncie 1989 were cross‐over trials which did not present data in a way that highlighted the paired nature of the data, making assessment problematic. Data from only four participants were reported in McNicoll 2003. In Waites 2006 and Linsenmeyer 2014 investigators reported combined outcome data for participants with urethral and suprapubic catheters which made clinically‐relevant interpretation difficult.
The trials had small sample sizes (range 25 to 89), although numbers of participants who completed were far fewer (range 4 to 53). The authors of one of the largest trials (Moore 2009) (N = 73; N = 53 completed) proposed, based on their data, that a trial with at least 400 participants per arm would be required to give adequate power to detect a 20% difference in length of time each catheter was in situ.
1. Any catheter washout versus no washout
Four trials addressed this comparison (Airaksinen 1979; McNicoll 2003; Moore 2009; Muncie 1989).
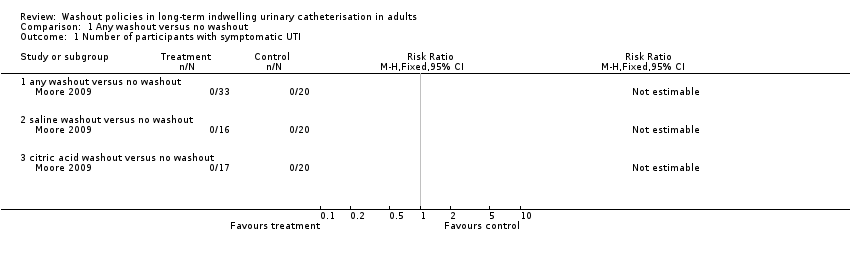
Symptomatic urinary tract infection (UTI)
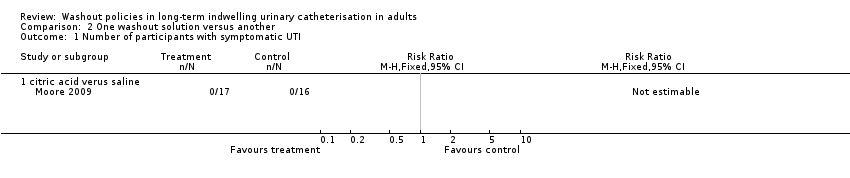
Moore 2009 reported no symptomatic UTIs in any study participants in the washout or non‐washout groups (Analysis 1.1). Symptomatic UTI was defined by Moore 2009 as the presence of at least one of five indications: fever, urgency, dysuria or suprapubic tenderness, haematuria or positive urine culture. Self‐reported UTIs (which did not meet the study criteria for symptomatic UTI) were noted in each group (citric acid 5/24, saline 2/18, no washout 3/23, P not reported).
Number of catheters used
No data were reported.
Length of time each catheter in situ
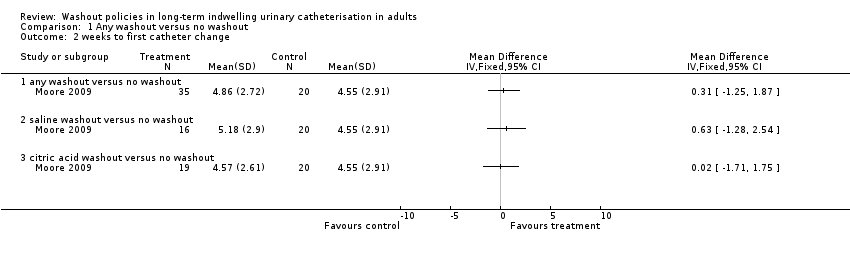
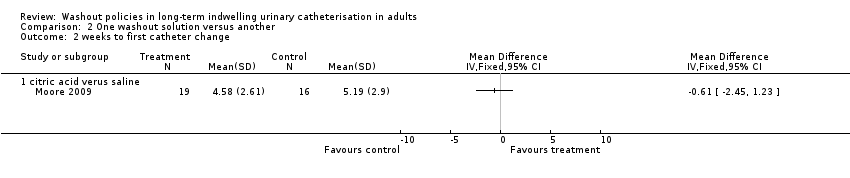
Moore 2009 recorded the number of weeks until first catheter change and reported no significant differences in the mean time for the three groups: citric acid 4.57 (SD 2.61) (N = 19); saline 5.18 (SD 2.90) (N = 16); and no washout 4.55 (SD 2.91, N = 20) (P = 0.642; Analysis 1.2).
Catheter removal rates due to blockage or infection
The mean catheter replacement rate per 100 days of catheterisation was reported by Muncie 1989: for the saline washout periods the mean was 5.5 catheters replaced (n = 32 ), for the no washout periods the mean was 4.7 catheters replaced (n = 32). Muncie 1989 also reported (saline washout/no washout) numbers of catheters for each period: replaced due to obstruction (39/32); replaced due to leakage (11/21); and removed out with the study protocol (87/63). The study authors concluded that daily saline washouts had no significant effect on the incidence of total number of catheter replacements. No details of statistical tests were presented.
McNicoll 2003 reported on the mean number of catheter replacements during a 12 week period: the citric acid washout group mean was 9 (SD 0) (n = 1), the no‐washout group mean was 14.3 (SD 11.2, n = 3; P not reported).
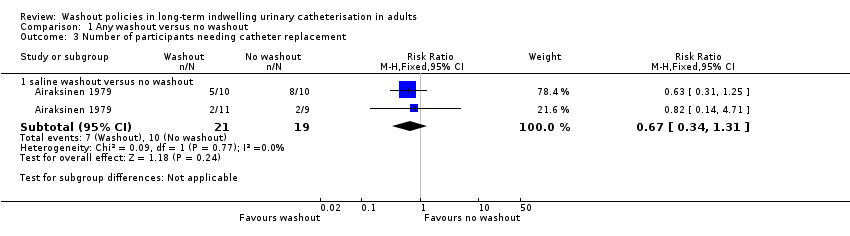
Airaksinen 1979 also compared different types of silicone catheters. All participants received new catheters on day 0; participants in both Silicath catheter groups had these replaced at three months (as per manufacturers' guidelines). Airaksinen 1979 stated that in the Silicath catheter group with regular irrigation, 5/10 participants required a catheter change in the first three months of the study compared to those with similar catheters who were in the control group (no irrigation) in which 8/10 participants required a catheter change (Analysis 1.3; stated P < 0.01). In the silastic catheter intervention group 2/11 participants required a catheter change compared with 2/9 participants in the silastic control group (Analysis 1.3; RR 0.67, 95% CI 0.34 to 1.31, P < 0.50; 1 study. 40 participants; very low quality evidence).
Rates of asymptomatic bacteriuria
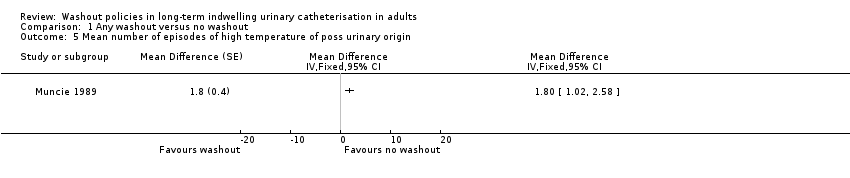
Given that catheter obstructions may be related to particular bacterial species, Muncie 1989 reported the mean number of species at ≥10⁵ CFU/mL per urine specimen for each group (N = 23 participants) who completed the cross‐over trial. Urine specimens were obtained for culture every two weeks. For the saline washout periods the mean was 4.0, for the no washout periods the mean was 3.8. No test of statistical difference was reported. The four most prevalent organisms were Providencia stuartii, Escherichia coli, P mirabilis and Enterococcus spp. The percentage of specimens in which each strain was present was similar in the saline washout and no washout periods of the study.
Washout acceptability measures
No data were reported.
Health status or measures of psychological health
No data were reported.
Complications and adverse events
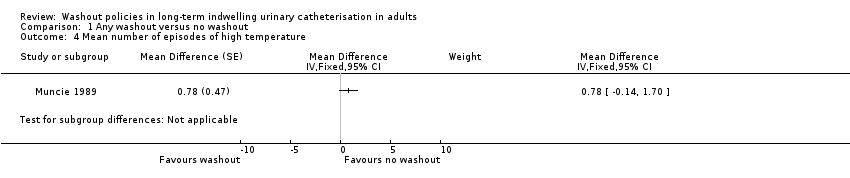
Muncie 1989 looked at episodes of high temperature with possible urinary origin as a proxy for symptomatic UTI. Data were reported for 32 participants (including those who did not complete the trial) for combined phases of this cross‐over trial. The mean number of episodes of high temperature of possible urinary origin per 100 days of catheterisation for the three periods was reported: mean for the saline washout period was 1.2 (SD 1.3), and for the no washout period was 0.9 (SD 1.1). This was also reported separately for each period of the study: period 1, irrigation versus none; period 2, irrigation versus none; and for all episodes of high temperature (Analysis 1.4) as well as those of urinary origin (Analysis 1.5). The study authors reported that the difference was not statistically significant, although no details were given.
Health economic outcomes
McNicoll 2003 reported that 37.25 hours were spent administering washouts over the 12 week period for one participant in the intervention group. McNicoll 2003 reported that care for the "planned catheter change" group took less time, but no comparison data were presented. The cost of the intervention was GBP 975.51 for the participant in the washout group whose treatment required over 37 hours of washout time compared to a mean GBP 189 (SD GBP 103) per person for the cost of care in the control group. The price per year was not given.
2. One type of catheter washout solution versus another
Four trials addressed this comparison (Kennedy 1992; Linsenmeyer 2014; Moore 2009; Waites 2006).
Symptomatic UTI
The rate of participants discontinuing the use of washouts due to the development of a symptomatic UTI was reported by Waites 2006: saline 1/29 participants (3%), acetic acid 6/30 participants (20%), and neomycin‐polymyxin 4/30 participants (13%). The difference between groups was not statistically significant (P = 0.15). Overall, a significantly greater proportion of acetic acid group participants discontinued (P = 0.0005), but this difference was due to more participants in this group discontinuing for "personal reasons unrelated to health". Moore 2009 found no symptomatic UTIs in any group in the trial using the citric acid or saline solutions (Analysis 2.1).
Number of catheters used
No data were reported.
Length of time each catheter in situ
Kennedy 1992 reported mean days the catheter was in situ: saline 16.3 days, Suby G 14.3 days, Solution R 14.2 days. No standard deviations were reported, but the study authors reported no significant differences between groups (P not reported). It was noted that only three participants retained their catheter for the full length of each trial period. Moore 2009 reported the mean time until first catheter change; there was no significant difference among trial groups, including the two groups receiving different washout solutions (citric acid versus saline, Analysis 2.2).
Catheter removal rates due to blockage or infection
In Kennedy 1992, 100 of 120 study catheters were examined for encrustation. The number of catheters found to be blocked (defined as the eye or lumen completely blocked resulting in no flow of urine) when removed after each three week solution period was reported: saline 18/44 catheters (41%), Suby G 14/29 catheters (48%), Solution R 7/27 catheters (26%). The study authors concluded that Solution R produced the best results and Suby G the worst, but no statistical tests were presented, and a time effect was noted such that blocked catheters would be removed early (before they could be examined) thus distorting the data. Regarding degree of visual encrustation, Kennedy 1992 reported little difference among the three solutions up to day 10, after which it was felt Solution R did not reduce encrustation. Mean encrustation scores were presented but without standard deviations. Similarly, insufficient information was presented relating to the mean number of episodes of bypassing per week (saline 1.55, Suby G 1.4, Solution R 1.9), although the study authors reported that differences among groups for this outcome were not statistically significant (P value not reported).
Linsenmeyer 2014 compared auriclosene and saline washouts and reported encrustation rates only for participants in this study (N = 14). The area of encrustation (expressed as a percentage) within the catheter was assessed at three pre‐selected locations. The maximum encrustation in any part of the catheter was used to determine catheter patency and was the primary endpoint of this trial. The auriclosene irrigation resulted in an average encrustation of 21.7% (95% CI 2.1% to 41.2%), versus 76.9% (95% CI 54.9% to 98.8%) average encrustation with saline (P value not reported). Linsenmeyer 2014 reported percentages of catheters removed for clinical blockage and due to 100% encrustation. Of those irrigated with the auriclosene solution, 14% had to be removed due to any clinical blockage; none of these catheters were 100% encrusted. By contrast, 64% of catheters irrigated with saline were removed due to clinical blockage, and of these, all were completely blocked.
Rates of asymptomatic bacteriuria
In the cross‐over trial by Kennedy 1992 comparing three solutions, the percentage of participants with bacteria observed in washout fluid at the end of a washout period with one of the trial solutions were: saline 100%, Suby G 75%, Solution R 76%. Only percentages were presented and the denominators were unclear for these percentages. The presence of bacteria was also measured in 66 urine specimens collected from 25 participants at the time of catheter change. Of these, four samples showed no significant bacterial growth (3 after antibiotic treatment and 1 after saline washouts). It was therefore concluded that none of the solutions tested eliminated bacteria. The study authors stated that Suby G and Solution R appeared to reduce levels of bacteria but that differences were not statistically significant (statistical test results were not presented). It was further concluded that treatment with acidic solutions (Suby G and Solution R) did not prevent or reduce urease‐producer bacteria. The published data on presence of bacteria were inadequately reported.
The percentages of participants harbouring Enterococcus spp (alone or in conjunction with other types of bacteria) after completing the Waites 2006 trial were: saline 13/21 participants (62%), acetic acid 7/9 participants (87%) and neomycin‐polymyxin 19/22 participants (86%). No test of significant difference between groups was presented. In the antibiotic group, from study start to finish there was a significant increase in the number of participants with Enterococci spp bacteria (P = 0.02). Data were reported graphically; exact values were not available. The study authors reported detecting no advantages from the antibiotic or acidic solutions over saline in reducing urinary bacterial load.
Washout acceptability measures
No data were reported.
Health status or measures of psychological health
No data were reported.
Measures of complications or adverse effects
Blood in the urine
The presence of blood in the urine may indicate damage caused by the washout procedure. Kennedy 1992 reported the percentage of participants in each group who had red blood cells in their washout fluid at the end of each treatment period (saline 21%, Suby G 17%, Solution R 14%). Study authors also reported a significant difference among treatment groups (P = 0.028) associated with a higher red blood cell count in the Suby G group compared to other groups. Moore 2009 reported results from urine dipstick testing, and found that all participants, irrespective of group, exhibited blood in the urine consistently.
Urothelial cells in the urine
Presence of urothelial cells in washout fluid at the end of each treatment period was reported by Kennedy 1992: saline 100%, Suby G 86%, Solution R 100%. Study authors reported finding evidence of a significant difference among treatment groups for urothelial cells over time (P = 0.068), but that this was unlikely to be clinically significant.
Bladder spasms
Waites 2006 reported on the incidence of bladder spasms directly attributable to bladder washout, which occurred on a small number of occasions (saline 0/29 participants, acetic acid 1/30 participants, neomycin‐polymyxin 2/30 participants). Bladder spasms caused these participants to discontinue with washouts (P not reported).
Health economic outcomes
No data were reported.
3. Clinically or microbiologically indicated washout versus routine washout
No data were reported.
4. Long intervals between catheter washouts versus short intervals
No data were reported.
5. One method of administration of catheter washouts versus another method
No data were reported.
6. Smaller volumes of washout solution versus larger volumes
No data were reported.
7. A stronger solution of washout versus a weaker solution
Kennedy 1992 addressed this comparison in a cross‐over trial. Kennedy 1992 compared two acidic solutions with different compositions. The citric acid content of one solution (solution R, 6%) was higher than the other (Suby G, 3.23%), however it was noted that the other elements of the solutions also differed. Therefore, any differences may not be attributable to the strength of the citric acid solution.
Symptomatic UTI
No data were reported.
Number of catheters used
No data were reported.
Length of time each catheter in situ
The mean time for catheter in situ was 14.3 days (Suby G) and 14.2 days (Solution R). No significant differences were found (Kennedy 1992).
Catheter removal rates due to blockage or infection
The study authors concluded that Solution R performed better than Suby G in terms of fewer blocked catheters (26% versus 48%, no significance test reported). The results presented did not utilise the cross‐over nature of the trial and were not informative (Kennedy 1992).
Rates of asymptomatic bacteriuria
Kennedy 1992 concluded there was no significant difference (P not reported) between Suby G (containing 3.23% citric acid) and Solution R (containing 6% citric acid) in terms of reducing the level of bacteria in the urine.
Washout acceptability measures
No data were reported.
Health status or measures of psychological health
No data were reported.
Measures of complications or adverse effects
No data were reported.
Health economic outcomes
No data were reported.
8. A single washout instillation versus two or more sequential washout instillations of the same type
No data were reported.
Discussion
There were insufficient data providing reliable evidence about the benefit or harms of washout policies to prevent catheter blockage or encrustation or for the relative merits of different washout solutions. Given that it was not possible to obtain sufficient information for further interpretation or analysis of existing published data from study authors, further high quality trials must be considered to provide rigorous evidence relating to the use of washouts. There are several important issues raised by this review which have implications for future research in this area.
Summary of main results
We identified seven trials eligible for inclusion in this review relating to the use of washouts for people with long‐term indwelling catheters. Most trials were small and under powered with inadequate reporting to permit judgement. The studies reviewed consisted of three randomised cross‐over trials which had poor data reporting, three parallel group randomised controlled trials (RCTs) with very limited data, and one well‐designed, but potentially under‐powered, RCT. Of the nine primary and secondary outcome measures sought, data were available for six. Trials assessed only three of the eight intervention comparisons identified. Due to the imprecision of the results of the included trials we are uncertain if washouts have an important effect on the primary outcomes of numbers of participants with symptomatic urinary tract infections (UTIs) and length of time each catheter was in situ. Main results are summarised in summary of findings Table for the main comparison and summary of findings Table 2.
Overall completeness and applicability of evidence
None of the included trials addressed: number of catheters used, washout acceptability measures (including patient satisfaction, patient discomfort, pain and ease of use), or health status/measures of psychological health and very limited health economic data were available. Any new policy regarding the management of long‐term urinary catheters with or without the use of washout solutions must be shown to be favourable for these important outcomes. As for the eight pre‐identified washout comparisons, the included trials provided data relating to only three (any catheter washout solution versus no catheter washout; one type of catheter washout solution versus another type; and a stronger washout solution versus a weaker washout solution). No trials looked at different volumes of the same washout solution. Studies tended to use the volume of solution provided in the manufacturer's pre‐prepared containers. Volumes ranged from 10 mL (Airaksinen 1979) to 100 mL (Kennedy 1992). None of the trials compared different washout frequencies. However, washout frequency varied: twice daily (Waites 2006), daily (McNicoll 2003; Muncie 1989), twice weekly (Linsenmeyer 2014; Waites 2006), weekly (Moore 2009), and every two weeks (Airaksinen 1979). The length of time the washout was retained in the bladder ranged from 15 minutes (Linsenmeyer 2014; Moore 2009) to 20 to 30 minutes (Kennedy 1992)), as did the duration of the intervention from 3 weeks (Kennedy 1992) to 26 weeks (Airaksinen 1979).
It is important that a washout period is used in cross‐over trials where there is potential for a carry‐over effect from one treatment period to the next. Both included cross‐over trials used this approach; Muncie 1989 used a two‐week phase between trial periods with no intervention, and Kennedy 1992 used a one‐week phase during which participants had a saline washout. Both Muncie 1989 and Kennedy 1992 also used run‐in periods of two weeks of no washout and one week of saline washout respectively. Linsenmeyer 2014 stated that a washout period was used between different solutions but the timing was not provided. No reason was given for length of the run‐in or washout periods.
Included trials' participants varied in several ways. In some trials participants had histories of blocked catheters (Linsenmeyer 2014; McNicoll 2003; Moore 2009); other trials did not limit participation in this way, or did not mention any history of catheter blocking. There may be merit in looking specifically at those people with a history of catheter blocking; anecdotally, it is thought that some people are more susceptible than others.
The participant characteristics and settings varied in the trials. Kennedy 1992 and Muncie 1989 studied older women (mean ages 82 years and 71 years, respectively) who were inpatients in long‐term or geriatric care settings compared to community‐dwelling men and women with neurogenic bladder studied by Waites 2006 (mean age 45.8 years) and Linsenmeyer 2014 (mean age 46.6 years). Moore 2009 and Airaksinen 1979 studied a mix of long‐term or hospital care and home care participants. No information on age and gender was available for McNicoll 2003. The effects of a washout, if any, may differ in such diverse populations and careful thought is needed regarding whether such trials results could be usefully compared in future reviews.
Quality of the evidence
The quality of the trials and their reporting was generally inadequate. All the trials had small sample sizes; overall 349 participants were randomised and 217 completed the studies. The randomisation sequence of participants was clearly described in only two trials (Kennedy 1992; Moore 2009) and unclear in five. Concealment of group allocation was poor or inadequately described in all but one trial (Moore 2009). Three trials were deemed at high risk of bias for lack of blinding (McNicoll 2003; Moore 2009; Muncie 1989). However, depending on the washout regimen, blinding of participants or the health professional to the intervention may have been impossible. In regard to detection bias, the seven studies did not describe accurately the methods of detecting outcomes; therefore, all were assessed as unclear risk of bias. We assessed four trials (Kennedy 1992; Moore 2009; Muncie 1989; Waites 2006) to be at low risk of attrition bias. Three lacked detail and were judged to be an unclear bias (Airaksinen 1979; Linsenmeyer 2014; McNicoll 2003).
The included trials were somewhat heterogeneous in terms of the outcomes measured. Most trials assessed bacteriuria, and blockage/encrustation, although methods for doing so and definitions used varied greatly. Definitions of symptomatic UTI in particular were poorly described and differed among trials. Standardised methods for assessing these key outcomes in catheter research are needed. There was a consistent lack of adequate reporting of statistical information e.g. denominators for percentages, summary statistics such as standard deviations and details of statistical tests. This made interpreting the study results difficult, and extracting the data impossible in many cases. The methods used by study authors to analyse data from the cross‐over trials were referenced and seemed appropriate, taking into account the paired nature of the data. However, the reporting of these analyses in the reports was poor and assessment of the findings and data extraction were not possible.
Potential biases in the review process
We searched all relevant databases without language restriction to obtain as many reports of trials as possible. We also included trial registries in this search and contacted authors for further information about trials that were reported as completed, where applicable. However, despite these attempts to minimise publication bias it is possible that not all eligible trials were included in the databases that we searched. To reduce the risk of bias during the review process, we used the methodology described in the Cochrane Handbook for Systematic Reviews of Interventions (Higgins 2011), this included two authors screening the literature search results for potentially eligible studies and double data extraction.
Agreements and disagreements with other studies or reviews
The Centers for Disease Control and Prevention (CDC) Guideline for prevention of catheter‐associated urinary tract infections (CAUTI) was updated in 2009 due to an increasing focus on the non‐acute setting and patients in need of long‐term urinary catheterisation. The Guideline considered the best practices for preventing CAUTI associated with obstructed urinary catheters and concluded that no recommendation could be given for the use of irrigation solutions because the evidence was not available to answer the question. Many of the studies referred to by Gould 2010 considered patients who used intermittent catheterisation and therefore were not included in this review because they did not match our inclusion criteria. The findings of Gould 2010 agree with findings from this review and provide further support for the need for high quality trials in this area. No other systematic reviews of catheter washout solutions were found.
Study flow diagram

Methodological quality graph: review authors' judgements about each methodological quality item presented as percentages across all included studies
Methodological quality summary: review authors' judgements about each methodological quality item for each included study
Comparison 1 Any washout versus no washout, Outcome 1 Number of participants with symptomatic UTI.
Comparison 1 Any washout versus no washout, Outcome 2 weeks to first catheter change.
Comparison 1 Any washout versus no washout, Outcome 3 Number of participants needing catheter replacement.
Comparison 1 Any washout versus no washout, Outcome 4 Mean number of episodes of high temperature.
Comparison 1 Any washout versus no washout, Outcome 5 Mean number of episodes of high temperature of poss urinary origin.
Comparison 2 One washout solution versus another, Outcome 1 Number of participants with symptomatic UTI.
Comparison 2 One washout solution versus another, Outcome 2 weeks to first catheter change.
| Any washout compared to no washout for participants with long‐term indwelling urinary catheterisation | ||||||
| Patient or population: Long‐term indwelling urinary catheterisation in adults | ||||||
| Outcomes | Illustrative comparative risks* (95% CI) | Relative effect | No of Participants | Quality of the evidence | Comments | |
| Assumed risk | Corresponding risk | |||||
| No washout | Any washout | |||||
| Symptomatic UTI (Number of participants with symptomatic UTI, citric acid or saline washout versus no washout) | 0 per 1000 | 0 per 1000 (0 to 0) | Not estimable | 53 | ⊕⊕⊝⊝ | No participants met the study criteria for symptomatic UTI |
| Symtomatic UTI Mean number of episodes of high temperature (saline washout versus no washout) | ‐ | The mean number of episodes of high temperature (saline washout versus no washout) in the intervention groups was: 0.78 (‐0.14 to 1.70) | Not estimable | 23 | ⊕⊝⊝⊝ | |
| Symptomatic UTI Mean number of episodes of high temperature due to possible urinary origin (saline washout versus no washout) | ‐ | The mean number of episodes of high temperature of possible urinary origin (saline washout versus no washout) in the intervention groups was: 1.80 (1.02 to 2.58) | Not estimable | 23 | ⊕⊝⊝⊝ | |
| Number of catheters used (Number of participants needing catheter replacement, saline washout versus no washout) | 526 per 1000 | 353 per 1000 (179 to 689) | RR 0.67 | 40 | ⊕⊝⊝⊝ | |
| Length of time each catheter was in situ | Not estimable | Not reported | No data available | |||
| Catheter removal rates due to blockage/infection | Not estimable | Not reported | No data available | |||
| Rates of asymptomatic bacteriuria | Not estimable | Not reported | No data available | |||
| *The basis for the assumed risk (e.g. the median control group risk across studies) is provided in footnotes. The corresponding risk (and its 95% confidence interval) is based on the assumed risk in the comparison group and the relative effect of the intervention (and its 95% CI). | ||||||
| GRADE Working Group grades of evidence | ||||||
| 1 Downgraded two levels: The sample size was small (N = 53). Personnel not blinded to allocation of treatment. Blinding of outcome assessment not clear. | ||||||
| One washout solution versus another for participants with long‐term indwelling urinary catheterisation | ||||||
| Patient or population: Long‐term indwelling urinary catheterisation in adults | ||||||
| Outcomes | Illustrative comparative risks* (95% CI) | Relative effect | No of Participants | Quality of the evidence | Comments | |
| Assumed risk | Corresponding risk | |||||
| Control | One washout solution versus another | |||||
| Symptomatic UTI Number of participants with symptomatic UTI (citric acid versus saline) | 0 per 1000 | 0 per 1000 (0 to 0) | Not estimable | 33 | ⊕⊕⊝⊝ | No participants met the study criteria for symptomatic UTI |
| Symtomatic UTI Mean number of episodes of high temperature | Not estimable | Not reported | No data available | |||
| Symptomatic UTI Mean number of episodes of high temperature due to possible urinary origin | Not estimable | Not reported | No data available | |||
| Number of catheters used Number of participants needing catheter replacement | Not estimable | Not reported | No data available | |||
| Length of time each catheter was in situ | Not estimable | Not reported | No data available | |||
| Catheter removal rates due to blockage/infection | Not estimable | Not reported | No data available | |||
| Rates of asymptomatic bacteriuria | Not estimable | Not reported | No data available | |||
| *The basis for the assumed risk (e.g. the median control group risk across studies) is provided in footnotes. The corresponding risk (and its 95% confidence interval) is based on the assumed risk in the comparison group and the relative effect of the intervention (and its 95% CI). | ||||||
| GRADE Working Group grades of evidence | ||||||
| 1 Downgraded two levels: The sample size was small (N = 33). Personnel not blinded to allocation of treatment. Blinding of outcome assessment not clear. | ||||||
| Outcome or subgroup title | No. of studies | No. of participants | Statistical method | Effect size |
| 1 Number of participants with symptomatic UTI Show forest plot | 1 | Risk Ratio (M‐H, Fixed, 95% CI) | Totals not selected | |
| 1.1 any washout versus no washout | 1 | Risk Ratio (M‐H, Fixed, 95% CI) | 0.0 [0.0, 0.0] | |
| 1.2 saline washout versus no washout | 1 | Risk Ratio (M‐H, Fixed, 95% CI) | 0.0 [0.0, 0.0] | |
| 1.3 citric acid washout versus no washout | 1 | Risk Ratio (M‐H, Fixed, 95% CI) | 0.0 [0.0, 0.0] | |
| 2 weeks to first catheter change Show forest plot | 1 | Mean Difference (IV, Fixed, 95% CI) | Totals not selected | |
| 2.1 any washout versus no washout | 1 | Mean Difference (IV, Fixed, 95% CI) | 0.0 [0.0, 0.0] | |
| 2.2 saline washout versus no washout | 1 | Mean Difference (IV, Fixed, 95% CI) | 0.0 [0.0, 0.0] | |
| 2.3 citric acid washout versus no washout | 1 | Mean Difference (IV, Fixed, 95% CI) | 0.0 [0.0, 0.0] | |
| 3 Number of participants needing catheter replacement Show forest plot | 1 | Risk Ratio (M‐H, Fixed, 95% CI) | Subtotals only | |
| 3.1 saline washout versus no washout | 1 | 40 | Risk Ratio (M‐H, Fixed, 95% CI) | 0.67 [0.34, 1.31] |
| 4 Mean number of episodes of high temperature Show forest plot | 1 | Mean Difference (Fixed, 95% CI) | Subtotals only | |
| 5 Mean number of episodes of high temperature of poss urinary origin Show forest plot | 1 | Mean Difference (Fixed, 95% CI) | Totals not selected | |
| Outcome or subgroup title | No. of studies | No. of participants | Statistical method | Effect size |
| 1 Number of participants with symptomatic UTI Show forest plot | 1 | Risk Ratio (M‐H, Fixed, 95% CI) | Totals not selected | |
| 1.1 citric acid verus saline | 1 | Risk Ratio (M‐H, Fixed, 95% CI) | 0.0 [0.0, 0.0] | |
| 2 weeks to first catheter change Show forest plot | 1 | Mean Difference (IV, Fixed, 95% CI) | Totals not selected | |
| 2.1 citric acid verus saline | 1 | Mean Difference (IV, Fixed, 95% CI) | 0.0 [0.0, 0.0] | |