Tratamiento con inyección uretral para la incontinencia urinaria en mujeres
Información
- DOI:
- https://doi.org/10.1002/14651858.CD003881.pub4Copiar DOI

- Base de datos:
-
- Cochrane Database of Systematic Reviews
- Versión publicada:
-
- 25 julio 2017see what's new
- Tipo:
-
- Intervention
- Etapa:
-
- Review
- Grupo Editorial Cochrane:
-
Grupo Cochrane de Incontinencia
- Copyright:
-
- Copyright © 2017 The Cochrane Collaboration. Published by John Wiley & Sons, Ltd.
Cifras del artículo
Altmetric:
Citado por:
Autores
Contributions of authors
BECs update ‐ July 2017
For the July 2017 addition of the BECs to this review ‐ Patricia Aluko was responsible for the entire BECs‐related work on this review i.e. she ran the search for studies, screened the searches, extracted data from relevant studies, revised any existing economics‐related text, added the BECs‐related text, and responded to any peer referee comments. All authors had the opportunity to comment on the revised review.
Second update
Vivienne Kirchin and Tobias Page selected trials for inclusion; abstracted data; wrote up the results, discussion and conclusions.
First update
Phil Keegan and Kofi Atiemo selected trials for inclusion; abstracted data; wrote up the results, discussion and conclusions. Rob Pickard helped with interpretation of the data and the writing of the discussion. Sam McClinton helped with the development and writing of the protocol and review.
Original review
Rob Pickard helped with interpretation of the data and the writing of the discussion. Jackie Reaper and Laura Wyness performed double‐data abstraction. James N'Dow and Sam McClinton helped with the development and writing of the protocol and review. June Cody and James N'Dow helped with data abstraction and interpretation.
Sources of support
Internal sources
-
University of Aberdeen, UK.
External sources
-
NHS Executive Research and Development Programme, UK.
-
National Institute for Health Research, UK.
This project was supported by the National Institute for Health Research, via Cochrane Infrastructure funding to the Cochrane Incontinence Group. The views and opinions expressed therein are those of the authors and do not necessarily reflect those of the Systematic Reviews Programme, NIHR, NHS or the Department of Health. The NIHR is the largest single funder of the Cochrane Incontinence Group.
-
National Institute for Health Research, UK.
This project, to add Brief Economic Commentaries to our surgery for UI in women reviews, was supported by the National Institute for Health Research (NIHR), via the Cochrane Review Incentive Scheme 2016, to the Cochrane Incontinence Group. The views and opinions expressed therein are those of the authors and do not necessarily reflect those of the Systematic Reviews Programme, NIHR, NHS or the Department of Health.
Declarations of interest
Vivienne Kirchin: 2012 version ‐ None known. July 2017 BECs version ‐ I have experience of using three intraurethral bulking agents (Macroplastique™, Zuidex™ and Bulkamid) but have no financial relationship with or other interest in either product that would represent a conflict of interest.
Tobias Page: 2012 version ‐ None known. July 2017 BECs version ‐ None of the companies who have supported me in the past have promoted a urethral bulking agent to me and neither is actively marketing a urethral bulking agent at this time to my knowledge.
Phil E Keegan: 2012 version ‐ None known. July 2017 BECs version ‐ I have received speaker fees and travel grants from Ipsen and Astellas.
Kofi OM Atiemo: 2012 version ‐ None known. July 2017 BECs version ‐ None known
June D Cody: 2012 version ‐ None known. July 2017 BECs version ‐ None known
Samuel McClinton: 2012 version ‐ None known. July 2017 BECs version ‐ None known
Patricia Aluko: 2012 version ‐ None known. July 2017 BECs version ‐ None known
Acknowledgements
Thanks to Sheila Wallace for help with searching and content editing of the review.
Version history
| Published | Title | Stage | Authors | Version |
| 2017 Jul 25 | Urethral injection therapy for urinary incontinence in women | Review | Vivienne Kirchin, Tobias Page, Phil E Keegan, Kofi OM Atiemo, June D Cody, Samuel McClinton, Patricia Aluko | |
| 2012 Feb 15 | Urethral injection therapy for urinary incontinence in women | Review | Vivienne Kirchin, Tobias Page, Phil E Keegan, Kofi Atiemo, June D Cody, Samuel McClinton | |
| 2007 Jul 18 | Periurethral injection therapy for urinary incontinence in women | Review | Phil E Keegan, Kofi Atiemo, June D Cody, Samuel McClinton, Robert Pickard | |
| 2003 Apr 22 | Periurethral injection therapy for urinary incontinence in women | Review | Rob Pickard, Jacqueline Reaper, Laura Wyness, D J Cody, Sam McClinton, James M.O. N'Dow, June D Cody | |
Differences between protocol and review
2012 version ‐ A new comparison, one route of injection versus another, was added in this update.
July 2017 update – Brief Economic Commentaries (BECs) have been added to all of our surgery for urinary incontinence in women in Cochrane reviews. The economic elements throughout the review have been revised – if incorrect they have been stripped out. New economics‐related text has been added. This involved revisions to the Background section, Methods section e.g. search section referring to the added Appendix 2, Discussion section, Abstract and Plain language summary. An appendix (Appendix 2) has been added with details of the economics searches. The Conclusions section of the review has not changed. The rest of the review has not changed.
Notes
Please note that dextranomer‐hyaluronic acid combination (Zuidex™) and ethylene vinyl alcohol copolymer (EVOH) have been withdrawn by the manufacturers and are no longer marketed for the treatment of female stress incontinence.
Keywords
MeSH
Medical Subject Headings (MeSH) Keywords
- Adipose Tissue [transplantation];
- Biocompatible Materials [*administration & dosage, adverse effects];
- Calcium Compounds [administration & dosage];
- Collagen [administration & dosage];
- Dextrans [administration & dosage];
- Dimethylpolysiloxanes [administration & dosage];
- Durapatite [administration & dosage];
- Glucans [administration & dosage];
- Hyaluronic Acid [administration & dosage];
- Injections [methods];
- Polytetrafluoroethylene [administration & dosage];
- Polyvinyls [administration & dosage];
- Quality of Life;
- Randomized Controlled Trials as Topic;
- Urethra;
- Urinary Incontinence, Stress [*therapy];
- Zirconium [administration & dosage];
Medical Subject Headings Check Words
Female; Humans;
PICO

PRISMA Study flow diagram ‐ showing the flow of literature through the review process
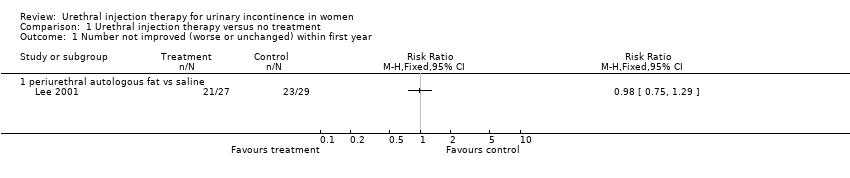
Comparison 1 Urethral injection therapy versus no treatment, Outcome 1 Number not improved (worse or unchanged) within first year.

Comparison 1 Urethral injection therapy versus no treatment, Outcome 2 Pad weight test.

Comparison 1 Urethral injection therapy versus no treatment, Outcome 3 Disease‐specific measures.

Comparison 1 Urethral injection therapy versus no treatment, Outcome 4 Number of patients requiring more than 1 treatment to achieve maximum benefit.

Comparison 1 Urethral injection therapy versus no treatment, Outcome 5 Peri‐ and postoperative complication.
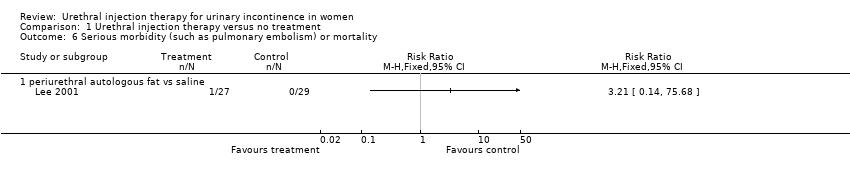
Comparison 1 Urethral injection therapy versus no treatment, Outcome 6 Serious morbidity (such as pulmonary embolism) or mortality.

Comparison 2 Urethral injection therapy versus conservative management, Outcome 1 Number not cured (worse, unchanged or improved) at 3 months.

Comparison 2 Urethral injection therapy versus conservative management, Outcome 2 Number not improved (worse or unchanged) at 3 months.
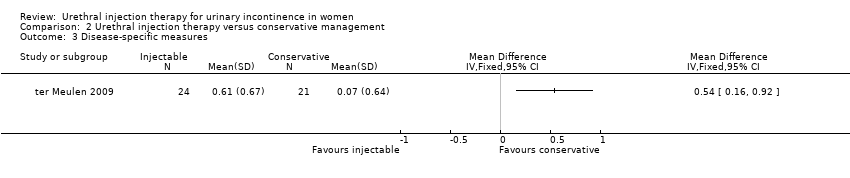
Comparison 2 Urethral injection therapy versus conservative management, Outcome 3 Disease‐specific measures.

Comparison 2 Urethral injection therapy versus conservative management, Outcome 4 Peri‐ and postoperative complication.
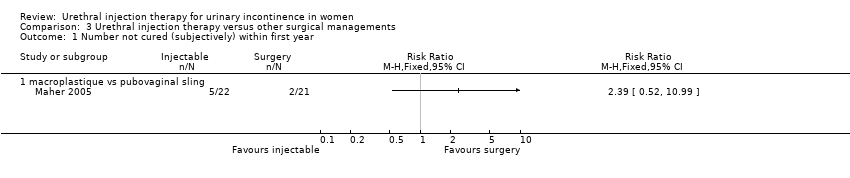
Comparison 3 Urethral injection therapy versus other surgical managements, Outcome 1 Number not cured (subjectively) within first year.
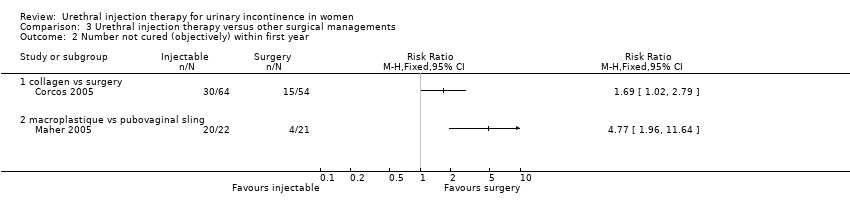
Comparison 3 Urethral injection therapy versus other surgical managements, Outcome 2 Number not cured (objectively) within first year.

Comparison 3 Urethral injection therapy versus other surgical managements, Outcome 3 Presence of urinary urgency and urge incontinence.

Comparison 3 Urethral injection therapy versus other surgical managements, Outcome 4 Disease‐specific measures.
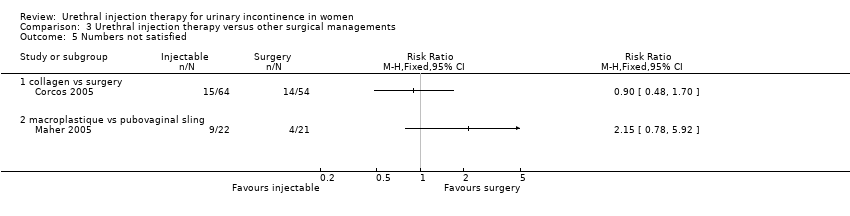
Comparison 3 Urethral injection therapy versus other surgical managements, Outcome 5 Numbers not satisfied.

Comparison 4 One material for injectable treatment versus another material for injectable treatment, Outcome 1 Number not cured (worse, unchanged ) within first year.
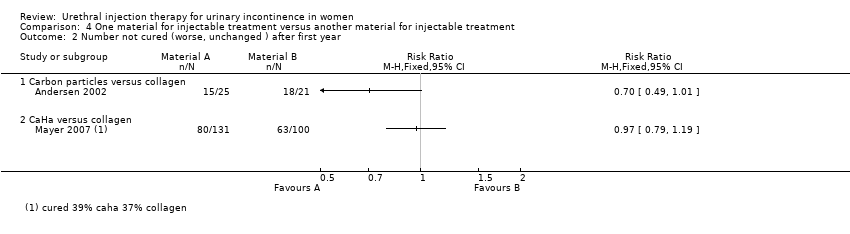
Comparison 4 One material for injectable treatment versus another material for injectable treatment, Outcome 2 Number not cured (worse, unchanged ) after first year.
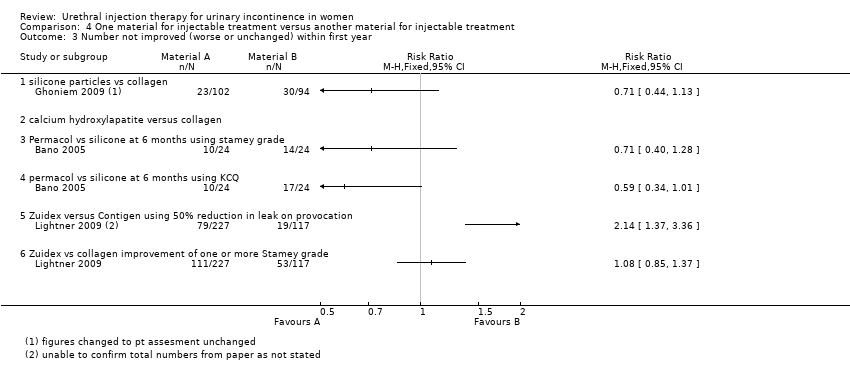
Comparison 4 One material for injectable treatment versus another material for injectable treatment, Outcome 3 Number not improved (worse or unchanged) within first year.
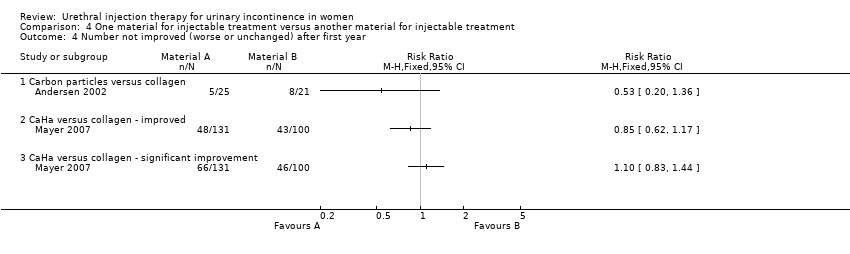
Comparison 4 One material for injectable treatment versus another material for injectable treatment, Outcome 4 Number not improved (worse or unchanged) after first year.

Comparison 4 One material for injectable treatment versus another material for injectable treatment, Outcome 5 Presence of urge incontinence.

Comparison 4 One material for injectable treatment versus another material for injectable treatment, Outcome 6 Pad weight test.

Comparison 4 One material for injectable treatment versus another material for injectable treatment, Outcome 7 Number of treatment required to achieve maximum benefit.

Comparison 4 One material for injectable treatment versus another material for injectable treatment, Outcome 8 Number of patients requiring more than 1 treatment to achieve maximum benefit.
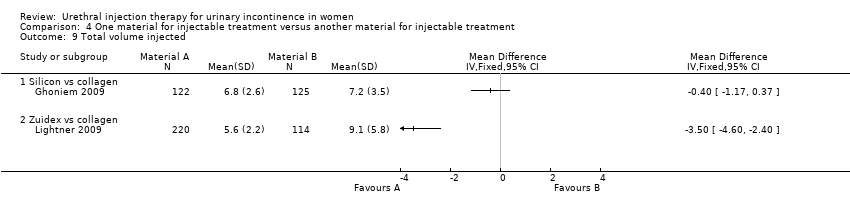
Comparison 4 One material for injectable treatment versus another material for injectable treatment, Outcome 9 Total volume injected.
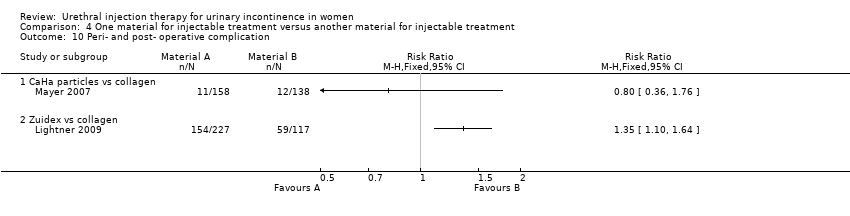
Comparison 4 One material for injectable treatment versus another material for injectable treatment, Outcome 10 Peri‐ and post‐ operative complication.

Comparison 4 One material for injectable treatment versus another material for injectable treatment, Outcome 11 Voiding difficulties postoperatively and long‐term (hypercontinence).
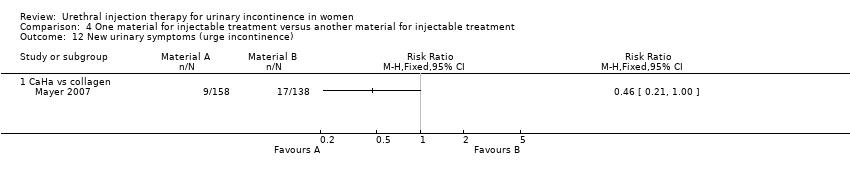
Comparison 4 One material for injectable treatment versus another material for injectable treatment, Outcome 12 New urinary symptoms (urge incontinence).

Comparison 4 One material for injectable treatment versus another material for injectable treatment, Outcome 13 Injection site complications.

Comparison 5 One route of injection versus another route of injection, Outcome 1 Number not cured (worse, unchanged or improved) within first year.

Comparison 5 One route of injection versus another route of injection, Outcome 2 Urinary retention.
| Outcome or subgroup title | No. of studies | No. of participants | Statistical method | Effect size |
| 1 Number not improved (worse or unchanged) within first year Show forest plot | 1 | Risk Ratio (M‐H, Fixed, 95% CI) | Totals not selected | |
| 1.1 periurethral autologous fat vs saline | 1 | Risk Ratio (M‐H, Fixed, 95% CI) | 0.0 [0.0, 0.0] | |
| 2 Pad weight test Show forest plot | 1 | Mean Difference (IV, Fixed, 95% CI) | Totals not selected | |
| 2.1 periurethral autologous fat vs saline | 1 | Mean Difference (IV, Fixed, 95% CI) | 0.0 [0.0, 0.0] | |
| 3 Disease‐specific measures Show forest plot | 1 | Mean Difference (IV, Fixed, 95% CI) | Totals not selected | |
| 3.1 periurethral autologous fat vs saline | 1 | Mean Difference (IV, Fixed, 95% CI) | 0.0 [0.0, 0.0] | |
| 4 Number of patients requiring more than 1 treatment to achieve maximum benefit Show forest plot | 1 | Risk Ratio (M‐H, Fixed, 95% CI) | Totals not selected | |
| 4.1 periurethral autologous fat vs saline | 1 | Risk Ratio (M‐H, Fixed, 95% CI) | 0.0 [0.0, 0.0] | |
| 5 Peri‐ and postoperative complication Show forest plot | 1 | Risk Ratio (M‐H, Fixed, 95% CI) | Totals not selected | |
| 5.1 periurethral autologous fat vs saline | 1 | Risk Ratio (M‐H, Fixed, 95% CI) | 0.0 [0.0, 0.0] | |
| 6 Serious morbidity (such as pulmonary embolism) or mortality Show forest plot | 1 | Risk Ratio (M‐H, Fixed, 95% CI) | Totals not selected | |
| 6.1 periurethral autologous fat vs saline | 1 | Risk Ratio (M‐H, Fixed, 95% CI) | 0.0 [0.0, 0.0] | |
| Outcome or subgroup title | No. of studies | No. of participants | Statistical method | Effect size |
| 1 Number not cured (worse, unchanged or improved) at 3 months Show forest plot | 1 | Risk Ratio (M‐H, Fixed, 95% CI) | Totals not selected | |
| 2 Number not improved (worse or unchanged) at 3 months Show forest plot | 1 | Risk Ratio (M‐H, Fixed, 95% CI) | Totals not selected | |
| 3 Disease‐specific measures Show forest plot | 1 | Mean Difference (IV, Fixed, 95% CI) | Totals not selected | |
| 4 Peri‐ and postoperative complication Show forest plot | 1 | Risk Ratio (M‐H, Fixed, 95% CI) | Totals not selected | |
| 4.1 retention | 1 | Risk Ratio (M‐H, Fixed, 95% CI) | 0.0 [0.0, 0.0] | |
| Outcome or subgroup title | No. of studies | No. of participants | Statistical method | Effect size |
| 1 Number not cured (subjectively) within first year Show forest plot | 1 | Risk Ratio (M‐H, Fixed, 95% CI) | Totals not selected | |
| 1.1 macroplastique vs pubovaginal sling | 1 | Risk Ratio (M‐H, Fixed, 95% CI) | 0.0 [0.0, 0.0] | |
| 2 Number not cured (objectively) within first year Show forest plot | 2 | Risk Ratio (M‐H, Fixed, 95% CI) | Totals not selected | |
| 2.1 collagen vs surgery | 1 | Risk Ratio (M‐H, Fixed, 95% CI) | 0.0 [0.0, 0.0] | |
| 2.2 macroplastique vs pubovaginal sling | 1 | Risk Ratio (M‐H, Fixed, 95% CI) | 0.0 [0.0, 0.0] | |
| 3 Presence of urinary urgency and urge incontinence Show forest plot | 1 | Risk Ratio (M‐H, Fixed, 95% CI) | Totals not selected | |
| 3.1 collagen vs surgery | 1 | Risk Ratio (M‐H, Fixed, 95% CI) | 0.0 [0.0, 0.0] | |
| 4 Disease‐specific measures Show forest plot | 1 | Mean Difference (IV, Fixed, 95% CI) | Totals not selected | |
| 4.1 collagen vs surgery | 1 | Mean Difference (IV, Fixed, 95% CI) | 0.0 [0.0, 0.0] | |
| 5 Numbers not satisfied Show forest plot | 2 | Risk Ratio (M‐H, Fixed, 95% CI) | Totals not selected | |
| 5.1 collagen vs surgery | 1 | Risk Ratio (M‐H, Fixed, 95% CI) | 0.0 [0.0, 0.0] | |
| 5.2 macroplastique vs pubovaginal sling | 1 | Risk Ratio (M‐H, Fixed, 95% CI) | 0.0 [0.0, 0.0] | |
| Outcome or subgroup title | No. of studies | No. of participants | Statistical method | Effect size |
| 1 Number not cured (worse, unchanged ) within first year Show forest plot | 5 | Risk Ratio (M‐H, Fixed, 95% CI) | Totals not selected | |
| 1.1 carbon particles vs collagen | 1 | Risk Ratio (M‐H, Fixed, 95% CI) | 0.0 [0.0, 0.0] | |
| 1.2 Silicone particles vs collagen | 1 | Risk Ratio (M‐H, Fixed, 95% CI) | 0.0 [0.0, 0.0] | |
| 1.3 Ethylene vinyl alcohol copolymer vs collagen | 1 | Risk Ratio (M‐H, Fixed, 95% CI) | 0.0 [0.0, 0.0] | |
| 1.4 Permacol vs silicone particles | 1 | Risk Ratio (M‐H, Fixed, 95% CI) | 0.0 [0.0, 0.0] | |
| 1.5 Dextranomer/hyaluronic acid versus collagen <2g leakage on pad test | 1 | Risk Ratio (M‐H, Fixed, 95% CI) | 0.0 [0.0, 0.0] | |
| 2 Number not cured (worse, unchanged ) after first year Show forest plot | 2 | Risk Ratio (M‐H, Fixed, 95% CI) | Totals not selected | |
| 2.1 Carbon particles versus collagen | 1 | Risk Ratio (M‐H, Fixed, 95% CI) | 0.0 [0.0, 0.0] | |
| 2.2 CaHa versus collagen | 1 | Risk Ratio (M‐H, Fixed, 95% CI) | 0.0 [0.0, 0.0] | |
| 3 Number not improved (worse or unchanged) within first year Show forest plot | 3 | Risk Ratio (M‐H, Fixed, 95% CI) | Totals not selected | |
| 3.1 silicone particles vs collagen | 1 | Risk Ratio (M‐H, Fixed, 95% CI) | 0.0 [0.0, 0.0] | |
| 3.2 calcium hydroxylapatite versus collagen | 0 | Risk Ratio (M‐H, Fixed, 95% CI) | 0.0 [0.0, 0.0] | |
| 3.3 Permacol vs silicone at 6 months using stamey grade | 1 | Risk Ratio (M‐H, Fixed, 95% CI) | 0.0 [0.0, 0.0] | |
| 3.4 permacol vs silicone at 6 months using KCQ | 1 | Risk Ratio (M‐H, Fixed, 95% CI) | 0.0 [0.0, 0.0] | |
| 3.5 Zuidex versus Contigen using 50% reduction in leak on provocation | 1 | Risk Ratio (M‐H, Fixed, 95% CI) | 0.0 [0.0, 0.0] | |
| 3.6 Zuidex vs collagen improvement of one or more Stamey grade | 1 | Risk Ratio (M‐H, Fixed, 95% CI) | 0.0 [0.0, 0.0] | |
| 4 Number not improved (worse or unchanged) after first year Show forest plot | 2 | Risk Ratio (M‐H, Fixed, 95% CI) | Totals not selected | |
| 4.1 Carbon particles versus collagen | 1 | Risk Ratio (M‐H, Fixed, 95% CI) | 0.0 [0.0, 0.0] | |
| 4.2 CaHa versus collagen ‐ improved | 1 | Risk Ratio (M‐H, Fixed, 95% CI) | 0.0 [0.0, 0.0] | |
| 4.3 CaHa versus collagen ‐ significant improvement | 1 | Risk Ratio (M‐H, Fixed, 95% CI) | 0.0 [0.0, 0.0] | |
| 5 Presence of urge incontinence Show forest plot | 1 | Risk Ratio (M‐H, Fixed, 95% CI) | Totals not selected | |
| 5.1 Permacol vs silicone particles | 1 | Risk Ratio (M‐H, Fixed, 95% CI) | 0.0 [0.0, 0.0] | |
| 6 Pad weight test Show forest plot | 4 | Mean Difference (IV, Fixed, 95% CI) | Totals not selected | |
| 6.1 carbon particles vs collagen | 1 | Mean Difference (IV, Fixed, 95% CI) | 0.0 [0.0, 0.0] | |
| 6.2 CaHa versus collagen | 1 | Mean Difference (IV, Fixed, 95% CI) | 0.0 [0.0, 0.0] | |
| 6.3 Silicone particles vs collagen | 1 | Mean Difference (IV, Fixed, 95% CI) | 0.0 [0.0, 0.0] | |
| 6.4 Dexranomer/hyaluronic acid versus collagen | 1 | Mean Difference (IV, Fixed, 95% CI) | 0.0 [0.0, 0.0] | |
| 7 Number of treatment required to achieve maximum benefit Show forest plot | 2 | 699 | Mean Difference (IV, Fixed, 95% CI) | 0.0 [0.0, 0.0] |
| 7.1 carbon particles vs collagen | 1 | 355 | Mean Difference (IV, Fixed, 95% CI) | 0.0 [0.0, 0.0] |
| 7.2 Zuidex vs collagen | 1 | 344 | Mean Difference (IV, Fixed, 95% CI) | 0.0 [0.0, 0.0] |
| 8 Number of patients requiring more than 1 treatment to achieve maximum benefit Show forest plot | 2 | Risk Ratio (M‐H, Fixed, 95% CI) | Totals not selected | |
| 8.1 silicone particles vs collagen | 1 | Risk Ratio (M‐H, Fixed, 95% CI) | 0.0 [0.0, 0.0] | |
| 8.2 Zuidex versus collagen | 1 | Risk Ratio (M‐H, Fixed, 95% CI) | 0.0 [0.0, 0.0] | |
| 9 Total volume injected Show forest plot | 2 | Mean Difference (IV, Fixed, 95% CI) | Totals not selected | |
| 9.1 Silicon vs collagen | 1 | Mean Difference (IV, Fixed, 95% CI) | 0.0 [0.0, 0.0] | |
| 9.2 Zuidex vs collagen | 1 | Mean Difference (IV, Fixed, 95% CI) | 0.0 [0.0, 0.0] | |
| 10 Peri‐ and post‐ operative complication Show forest plot | 2 | Risk Ratio (M‐H, Fixed, 95% CI) | Totals not selected | |
| 10.1 CaHa particles vs collagen | 1 | Risk Ratio (M‐H, Fixed, 95% CI) | 0.0 [0.0, 0.0] | |
| 10.2 Zuidex vs collagen | 1 | Risk Ratio (M‐H, Fixed, 95% CI) | 0.0 [0.0, 0.0] | |
| 11 Voiding difficulties postoperatively and long‐term (hypercontinence) Show forest plot | 2 | Risk Ratio (M‐H, Fixed, 95% CI) | Totals not selected | |
| 11.1 CaHa versus collagen | 1 | Risk Ratio (M‐H, Fixed, 95% CI) | 0.0 [0.0, 0.0] | |
| 11.2 permacol vs silicone particles | 1 | Risk Ratio (M‐H, Fixed, 95% CI) | 0.0 [0.0, 0.0] | |
| 12 New urinary symptoms (urge incontinence) Show forest plot | 1 | Risk Ratio (M‐H, Fixed, 95% CI) | Totals not selected | |
| 12.1 CaHa vs collagen | 1 | Risk Ratio (M‐H, Fixed, 95% CI) | 0.0 [0.0, 0.0] | |
| 13 Injection site complications Show forest plot | 1 | Risk Ratio (M‐H, Fixed, 95% CI) | Totals not selected | |
| 13.1 Zuidex versus collagen | 1 | Risk Ratio (M‐H, Fixed, 95% CI) | 0.0 [0.0, 0.0] | |
| Outcome or subgroup title | No. of studies | No. of participants | Statistical method | Effect size |
| 1 Number not cured (worse, unchanged or improved) within first year Show forest plot | 2 | Risk Ratio (M‐H, Fixed, 95% CI) | Totals not selected | |
| 1.1 periurethral injection vs transurethral injection | 1 | Risk Ratio (M‐H, Fixed, 95% CI) | 0.0 [0.0, 0.0] | |
| 1.2 bladder neck versus mid‐urethral | 1 | Risk Ratio (M‐H, Fixed, 95% CI) | 0.0 [0.0, 0.0] | |
| 2 Urinary retention Show forest plot | 2 | Risk Ratio (M‐H, Random, 95% CI) | Totals not selected | |
| 2.1 periurethral vs transurethral injection | 1 | Risk Ratio (M‐H, Random, 95% CI) | 0.0 [0.0, 0.0] | |
| 2.2 bladder neck vs mid‐urethral | 1 | Risk Ratio (M‐H, Random, 95% CI) | 0.0 [0.0, 0.0] | |