| 1 Number not cured (worse, unchanged ) within first year Show forest plot | 5 | | Risk Ratio (M‐H, Fixed, 95% CI) | Totals not selected |
|
| 1.1 carbon particles vs collagen | 1 | | Risk Ratio (M‐H, Fixed, 95% CI) | 0.0 [0.0, 0.0] |
| 1.2 Silicone particles vs collagen | 1 | | Risk Ratio (M‐H, Fixed, 95% CI) | 0.0 [0.0, 0.0] |
| 1.3 Ethylene vinyl alcohol copolymer vs collagen | 1 | | Risk Ratio (M‐H, Fixed, 95% CI) | 0.0 [0.0, 0.0] |
| 1.4 Permacol vs silicone particles | 1 | | Risk Ratio (M‐H, Fixed, 95% CI) | 0.0 [0.0, 0.0] |
| 1.5 Dextranomer/hyaluronic acid versus collagen <2g leakage on pad test | 1 | | Risk Ratio (M‐H, Fixed, 95% CI) | 0.0 [0.0, 0.0] |
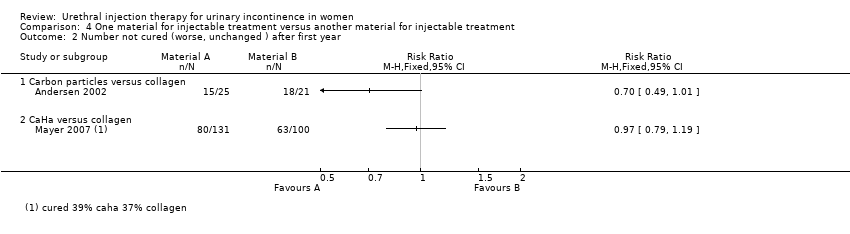
| 2 Number not cured (worse, unchanged ) after first year Show forest plot | 2 | | Risk Ratio (M‐H, Fixed, 95% CI) | Totals not selected |
|
| 2.1 Carbon particles versus collagen | 1 | | Risk Ratio (M‐H, Fixed, 95% CI) | 0.0 [0.0, 0.0] |
| 2.2 CaHa versus collagen | 1 | | Risk Ratio (M‐H, Fixed, 95% CI) | 0.0 [0.0, 0.0] |
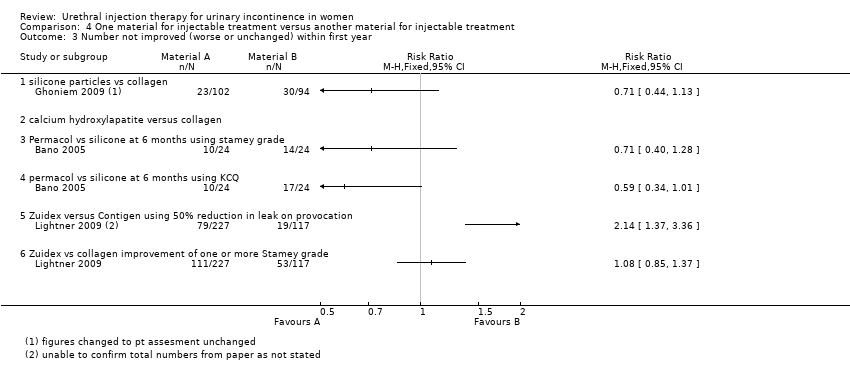
| 3 Number not improved (worse or unchanged) within first year Show forest plot | 3 | | Risk Ratio (M‐H, Fixed, 95% CI) | Totals not selected |
|
| 3.1 silicone particles vs collagen | 1 | | Risk Ratio (M‐H, Fixed, 95% CI) | 0.0 [0.0, 0.0] |
| 3.2 calcium hydroxylapatite versus collagen | 0 | | Risk Ratio (M‐H, Fixed, 95% CI) | 0.0 [0.0, 0.0] |
| 3.3 Permacol vs silicone at 6 months using stamey grade | 1 | | Risk Ratio (M‐H, Fixed, 95% CI) | 0.0 [0.0, 0.0] |
| 3.4 permacol vs silicone at 6 months using KCQ | 1 | | Risk Ratio (M‐H, Fixed, 95% CI) | 0.0 [0.0, 0.0] |
| 3.5 Zuidex versus Contigen using 50% reduction in leak on provocation | 1 | | Risk Ratio (M‐H, Fixed, 95% CI) | 0.0 [0.0, 0.0] |
| 3.6 Zuidex vs collagen improvement of one or more Stamey grade | 1 | | Risk Ratio (M‐H, Fixed, 95% CI) | 0.0 [0.0, 0.0] |
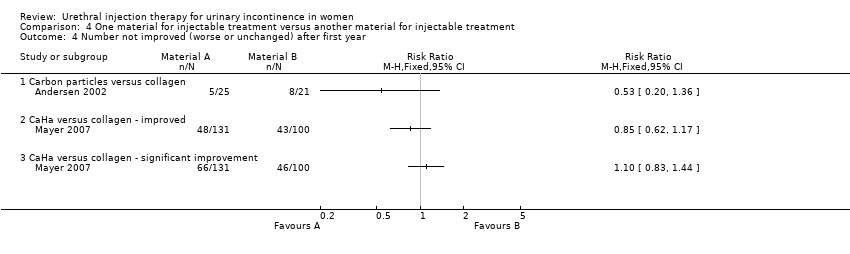
| 4 Number not improved (worse or unchanged) after first year Show forest plot | 2 | | Risk Ratio (M‐H, Fixed, 95% CI) | Totals not selected |
|
| 4.1 Carbon particles versus collagen | 1 | | Risk Ratio (M‐H, Fixed, 95% CI) | 0.0 [0.0, 0.0] |
| 4.2 CaHa versus collagen ‐ improved | 1 | | Risk Ratio (M‐H, Fixed, 95% CI) | 0.0 [0.0, 0.0] |
| 4.3 CaHa versus collagen ‐ significant improvement | 1 | | Risk Ratio (M‐H, Fixed, 95% CI) | 0.0 [0.0, 0.0] |
| 5 Presence of urge incontinence Show forest plot | 1 | | Risk Ratio (M‐H, Fixed, 95% CI) | Totals not selected |
|
| 5.1 Permacol vs silicone particles | 1 | | Risk Ratio (M‐H, Fixed, 95% CI) | 0.0 [0.0, 0.0] |
| 6 Pad weight test Show forest plot | 4 | | Mean Difference (IV, Fixed, 95% CI) | Totals not selected |
|
| 6.1 carbon particles vs collagen | 1 | | Mean Difference (IV, Fixed, 95% CI) | 0.0 [0.0, 0.0] |
| 6.2 CaHa versus collagen | 1 | | Mean Difference (IV, Fixed, 95% CI) | 0.0 [0.0, 0.0] |
| 6.3 Silicone particles vs collagen | 1 | | Mean Difference (IV, Fixed, 95% CI) | 0.0 [0.0, 0.0] |
| 6.4 Dexranomer/hyaluronic acid versus collagen | 1 | | Mean Difference (IV, Fixed, 95% CI) | 0.0 [0.0, 0.0] |
| 7 Number of treatment required to achieve maximum benefit Show forest plot | 2 | 699 | Mean Difference (IV, Fixed, 95% CI) | 0.0 [0.0, 0.0] |
|
| 7.1 carbon particles vs collagen | 1 | 355 | Mean Difference (IV, Fixed, 95% CI) | 0.0 [0.0, 0.0] |
| 7.2 Zuidex vs collagen | 1 | 344 | Mean Difference (IV, Fixed, 95% CI) | 0.0 [0.0, 0.0] |
| 8 Number of patients requiring more than 1 treatment to achieve maximum benefit Show forest plot | 2 | | Risk Ratio (M‐H, Fixed, 95% CI) | Totals not selected |
|
| 8.1 silicone particles vs collagen | 1 | | Risk Ratio (M‐H, Fixed, 95% CI) | 0.0 [0.0, 0.0] |
| 8.2 Zuidex versus collagen | 1 | | Risk Ratio (M‐H, Fixed, 95% CI) | 0.0 [0.0, 0.0] |
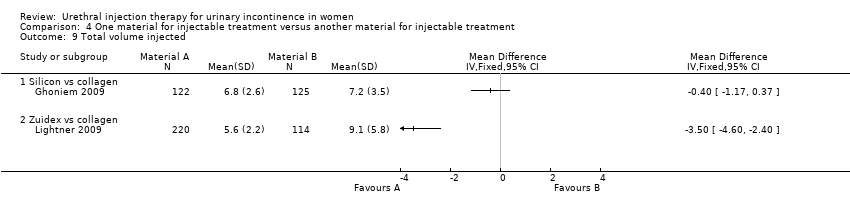
| 9 Total volume injected Show forest plot | 2 | | Mean Difference (IV, Fixed, 95% CI) | Totals not selected |
|
| 9.1 Silicon vs collagen | 1 | | Mean Difference (IV, Fixed, 95% CI) | 0.0 [0.0, 0.0] |
| 9.2 Zuidex vs collagen | 1 | | Mean Difference (IV, Fixed, 95% CI) | 0.0 [0.0, 0.0] |
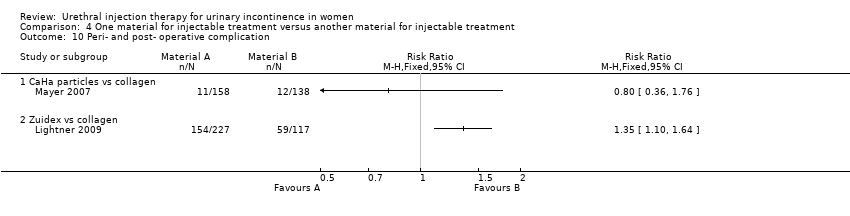
| 10 Peri‐ and post‐ operative complication Show forest plot | 2 | | Risk Ratio (M‐H, Fixed, 95% CI) | Totals not selected |
|
| 10.1 CaHa particles vs collagen | 1 | | Risk Ratio (M‐H, Fixed, 95% CI) | 0.0 [0.0, 0.0] |
| 10.2 Zuidex vs collagen | 1 | | Risk Ratio (M‐H, Fixed, 95% CI) | 0.0 [0.0, 0.0] |
| 11 Voiding difficulties postoperatively and long‐term (hypercontinence) Show forest plot | 2 | | Risk Ratio (M‐H, Fixed, 95% CI) | Totals not selected |
|
| 11.1 CaHa versus collagen | 1 | | Risk Ratio (M‐H, Fixed, 95% CI) | 0.0 [0.0, 0.0] |
| 11.2 permacol vs silicone particles | 1 | | Risk Ratio (M‐H, Fixed, 95% CI) | 0.0 [0.0, 0.0] |
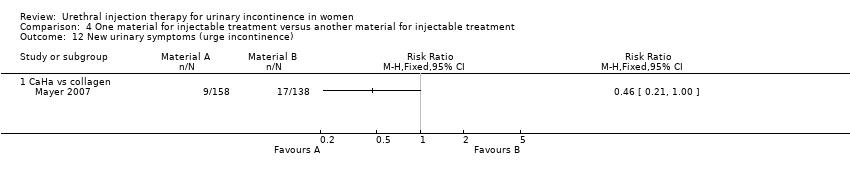
| 12 New urinary symptoms (urge incontinence) Show forest plot | 1 | | Risk Ratio (M‐H, Fixed, 95% CI) | Totals not selected |
|
| 12.1 CaHa vs collagen | 1 | | Risk Ratio (M‐H, Fixed, 95% CI) | 0.0 [0.0, 0.0] |
| 13 Injection site complications Show forest plot | 1 | | Risk Ratio (M‐H, Fixed, 95% CI) | Totals not selected |
|
| 13.1 Zuidex versus collagen | 1 | | Risk Ratio (M‐H, Fixed, 95% CI) | 0.0 [0.0, 0.0] |