Efecto del tratamiento de la diabetes tipo 2 sobre el desarrollo del deterioro cognoscitivo y la demencia
Información
- DOI:
- https://doi.org/10.1002/14651858.CD003804.pub2Copiar DOI

- Base de datos:
-
- Cochrane Database of Systematic Reviews
- Versión publicada:
-
- 15 junio 2017see what's new
- Tipo:
-
- Intervention
- Etapa:
-
- Review
- Grupo Editorial Cochrane:
-
Grupo Cochrane de Demencia y trastornos cognitivos
- Copyright:
-
- Copyright © 2017 The Cochrane Collaboration. Published by John Wiley & Sons, Ltd.
Cifras del artículo
Altmetric:
Citado por:
Autores
Contributions of authors
AAS: conceived the review, conducted trial selection, participated in completion of the report and writing the final draft.
MCH: conducted trial selection.
RV: coordinated the review process, data extraction, risk of bias assessment, analyses, GRADE assessment, 'Summary of findings' table construction, interpretation of results, participated in completion of the report and writing the final draft.
GM: coordinated the review process, data extraction, risk of bias assessment, analyses, GRADE assessment, 'Summary of findings' table construction, interpretation of results, participated in completion of the report and writing the final draft.
Sources of support
Internal sources
-
No sources of support supplied
External sources
-
NIHR, UK.
This update was supported by the National Institute for Health Research (NIHR), via a Cochrane Programme Grant to the Cochrane Dementia and Cognitive Improvement group. The views and opinions expressed therein are those of the authors and do not necessarily reflect those of the Systematic Reviews Programme, NIHR, National Health Service or the Department of Health
Declarations of interest
None known.
Acknowledgements
The authors would like to thank Anna Noel‐Storr, Trials Search Co‐ordinator of the Cochrane Dementia and Cognitive Improvement Group, for her assistance with the design of the search strategy.
Version history
| Published | Title | Stage | Authors | Version |
| 2017 Jun 15 | Effect of the treatment of Type 2 diabetes mellitus on the development of cognitive impairment and dementia | Review | Almudena Areosa Sastre, Robin WM Vernooij, Magali González‐Colaço Harmand, Gabriel Martínez | |
| 2003 Jan 20 | Effect of the treatment of Type II diabetes mellitus on the development of cognitive impairment and dementia | Review | John Grimley Evans, Almudena Areosa Sastre | |
Differences between protocol and review
-
We have updated the methods in the review since the original review in accordance with current Cochrane and Cochrane Dementia and Cognitive Improvement Group guidelines.
-
We included 'Summary of findings' tables and a methodological assessment of the quality of evidence with the GRADE methodology.
-
We separated blinding of participants and personnel from blinding of outcome assessment.
-
We added two new inclusion criteria: we included only trials that assessed a treatment for Type 2 diabetes that was approved by international guidelines; and we required a minimum intervention duration of 12 weeks.
-
We specified a method for selecting among multiple scales used in a study to measure the same cognitive domain.
-
The authors of the review have changed.
Keywords
MeSH
Medical Subject Headings (MeSH) Keywords
- Carbamates [therapeutic use];
- Cause of Death;
- Cognition Disorders [etiology, mortality, *prevention & control];
- Diabetes Mellitus, Type 2 [complications, *drug therapy, mortality];
- Glyburide [therapeutic use];
- Hypoglycemic Agents [*therapeutic use];
- Memory Disorders [etiology, prevention & control];
- Metformin [therapeutic use];
- Piperidines [therapeutic use];
- Randomized Controlled Trials as Topic;
- Rosiglitazone;
- Thiazolidinediones [therapeutic use];
Medical Subject Headings Check Words
Humans;
PICO
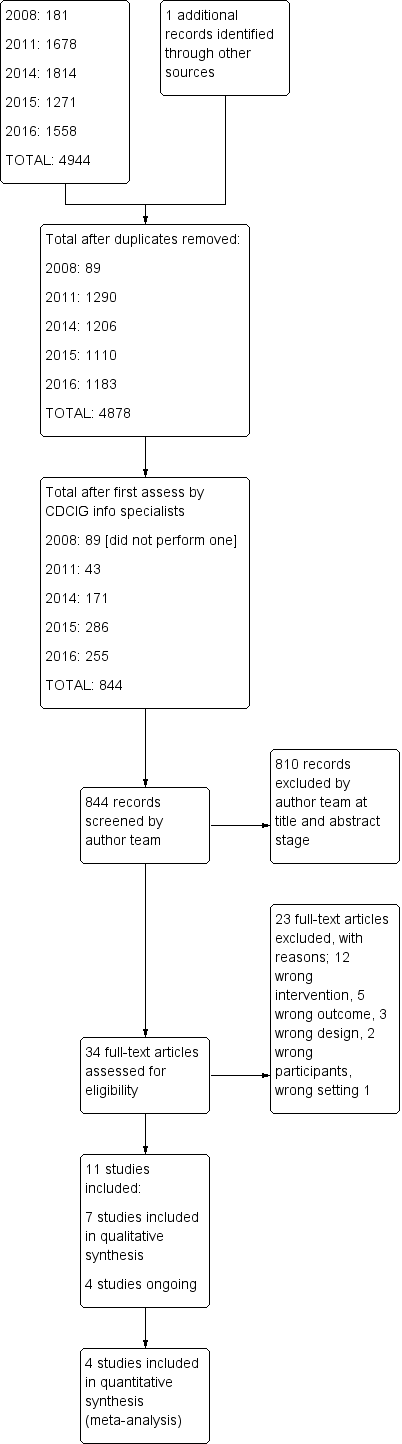
Study flow diagram.
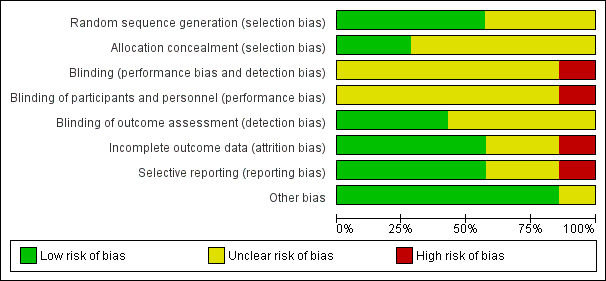
Risk of bias graph: review authors' judgements about each risk of bias item presented as percentages across all included studies.
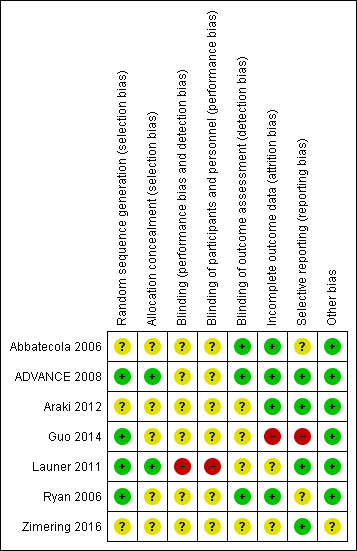
Risk of bias summary: review authors' judgements about each risk of bias item for each included study.
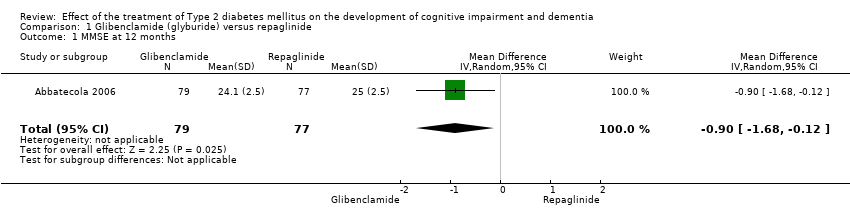
Comparison 1 Glibenclamide (glyburide) versus repaglinide, Outcome 1 MMSE at 12 months.

Comparison 1 Glibenclamide (glyburide) versus repaglinide, Outcome 2 Cognition composite score at 12 months.

Comparison 2 Intense glycaemic control versus standard glycaemic control, Outcome 1 Global cognitive function measured by MMSE 40 months.
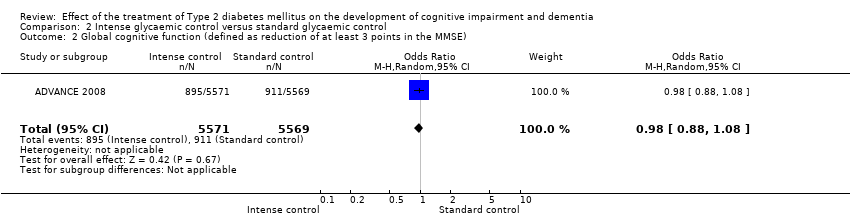
Comparison 2 Intense glycaemic control versus standard glycaemic control, Outcome 2 Global cognitive function (defined as reduction of at least 3 points in the MMSE).
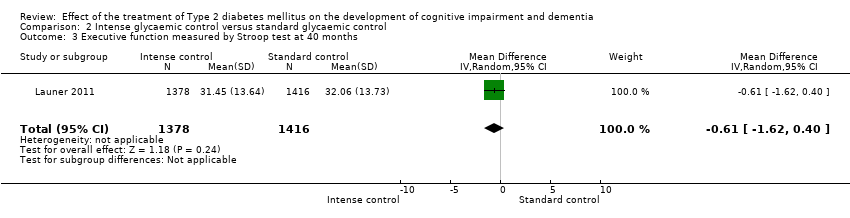
Comparison 2 Intense glycaemic control versus standard glycaemic control, Outcome 3 Executive function measured by Stroop test at 40 months.
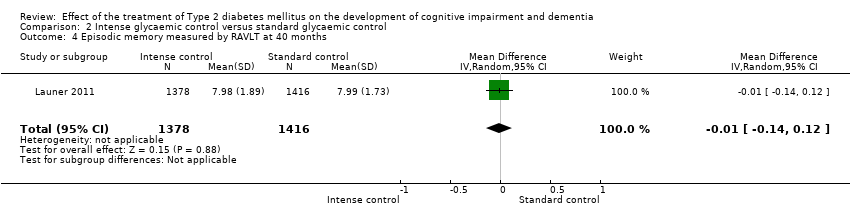
Comparison 2 Intense glycaemic control versus standard glycaemic control, Outcome 4 Episodic memory measured by RAVLT at 40 months.

Comparison 2 Intense glycaemic control versus standard glycaemic control, Outcome 5 Speed measured by DDST at 40 months.

Comparison 2 Intense glycaemic control versus standard glycaemic control, Outcome 6 Incidence of dementia (defined as dementia according to DSM‐IV).

Comparison 2 Intense glycaemic control versus standard glycaemic control, Outcome 7 Hypoglycaemia.

Comparison 2 Intense glycaemic control versus standard glycaemic control, Outcome 8 All cause mortality.
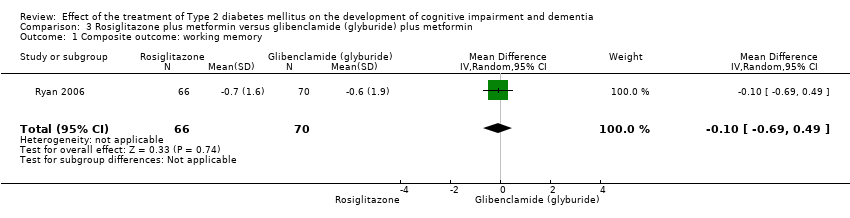
Comparison 3 Rosiglitazone plus metformin versus glibenclamide (glyburide) plus metformin, Outcome 1 Composite outcome: working memory.

Comparison 3 Rosiglitazone plus metformin versus glibenclamide (glyburide) plus metformin, Outcome 2 Composite outcome: learning ability.

Comparison 3 Rosiglitazone plus metformin versus glibenclamide (glyburide) plus metformin, Outcome 3 Composite outcome: cognitive efficiency.

Comparison 3 Rosiglitazone plus metformin versus glibenclamide (glyburide) plus metformin, Outcome 4 CANTAB Paired AssociatesLearning (PAL) test.
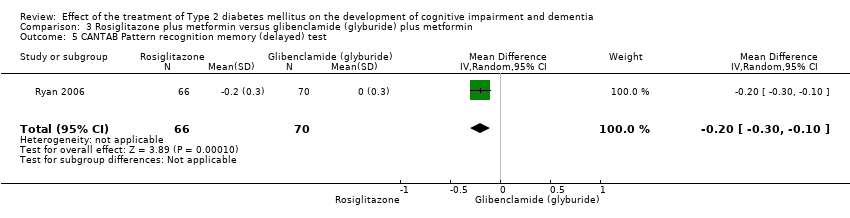
Comparison 3 Rosiglitazone plus metformin versus glibenclamide (glyburide) plus metformin, Outcome 5 CANTAB Pattern recognition memory (delayed) test.

Comparison 3 Rosiglitazone plus metformin versus glibenclamide (glyburide) plus metformin, Outcome 6 Working memory measured by Spatial working memory test.

Comparison 3 Rosiglitazone plus metformin versus glibenclamide (glyburide) plus metformin, Outcome 7 CANTAB Rapid visual information processing test.

Comparison 3 Rosiglitazone plus metformin versus glibenclamide (glyburide) plus metformin, Outcome 8 CANTAB Reaction time test.
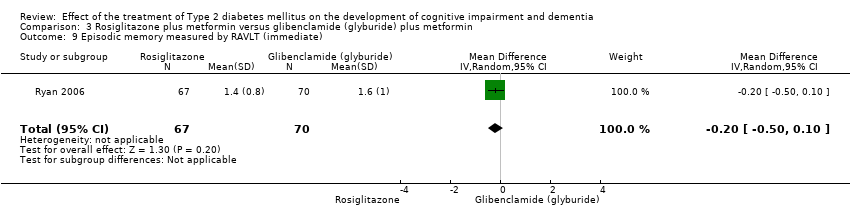
Comparison 3 Rosiglitazone plus metformin versus glibenclamide (glyburide) plus metformin, Outcome 9 Episodic memory measured by RAVLT (immediate).

Comparison 3 Rosiglitazone plus metformin versus glibenclamide (glyburide) plus metformin, Outcome 10 Speed measured by DSST.

Comparison 3 Rosiglitazone plus metformin versus glibenclamide (glyburide) plus metformin, Outcome 11 Working memory measured by Spatial working memory test.
| Glibenclamide (glyburide) compared to Repaglinide for Type 2 diabetes | ||||||
| Patient or population: patients with Type 2 diabetes | ||||||
| Outcomes | Illustrative comparative risks* (95% CI) | Relative effect | No. of Participants | Quality of the evidence | Comments | |
| Assumed risk | Corresponding risk | |||||
| Repaglinide | Glibenclamide (glyburide) | |||||
| Global cognitive function measured by MMSE at 12 months | The mean MMSE at 12 months in the intervention groups was | ‐ | 156 | ⊕⊕⊝⊝ | Evidence of a small effect on the MMSE favouring glibenclamide (glyburide) at 12 months. | |
| Incidence of MCI | No evidence identified. | |||||
| Incidence of dementia | No evidence identified. | |||||
| Adverse events (Hypoglycaemia) | No evidence identified. | |||||
| Mortality | No evidence identified. | |||||
| *The basis for the assumed risk (e.g. the median control group risk across studies) is provided in footnotes. The corresponding risk (and its 95% CI) is based on the assumed risk in the comparison group and the relative effect of the intervention (and its 95% CI). | ||||||
| GRADE Working Group grades of evidence | ||||||
| 1 Abbatecola et al (2006) has an unclear risk of bias due to no description on the random sequence generation, allocation concealment, blinding of participants and personnel, and selective reporting. | ||||||
| Intense glycaemic control compared to standard glycaemic control for Type 2 diabetes | ||||||
| Patient or population: patients with Type 2 diabetes | ||||||
| Outcomes | Illustrative comparative risks* (95% CI) | Relative effect | No of Participants | Quality of the evidence | Comments | |
| Assumed risk | Corresponding risk | |||||
| Standard glycaemic control | Intense glycaemic control | |||||
| Global cognitive function (defined as reduction of at least 3 points in MMSE) | 164 per 1000 | 160 per 1000 | RR 0.98 | 11,140 | ⊕⊕⊕⊝ | Evidence of no significant difference between intensive and standard glycaemic control. |
| Global cognitive function measured by MMSE at 40 months | The mean general cognitive function measured by MMSE at 40 months in the intervention groups was | ‐ | 2794 | ⊕⊕⊕⊝ | Evidence of no significant difference between intensive and standard glycaemic control. | |
| Incidence of MCI | No evidence identified. | |||||
| Incidence of dementia (defined as dementia according to DSM‐IV) | 9 per 1000 | 11 per 1000 | RR 1.27 | 11,140 | ⊕⊕⊝⊝ | Evidence of no significant difference between intensive and standard glycaemic control. |
| Adverse events (Hypoglycaemia) | 17 per 1000 | 36 per 1000 (25 to 52) | RR 2.18 (1.52 to 3.14) | 12,931 (2 studies) | ⊕⊕⊝⊝ | Evidence of a significantly higher incidence of hypoglycaemic events for intensive glycaemic control compared with standard glycaemic control. |
| Mortality | 81 per 1000 | 81 per 1000 | RR 1.0 | 15,888 | ⊕⊕⊕⊝ | Evidence of no significant difference between intensive and standard glycaemic control. |
| *The basis for the assumed risk (e.g. the median control group risk across studies) is provided in footnotes. The corresponding risk (and its 95% CI) is based on the assumed risk in the comparison group and the relative effect of the intervention (and its 95% CI). | ||||||
| GRADE Working Group grades of evidence | ||||||
| 1 The ADVANCE study has an unclear risk of bias due to no description in the random sequence generation, allocation concealment, and blinding of participants and personnel. 2 Launer et al has a high risk of bias in the blinding of participants and personnel and an unclear risk of bias due to no description in the blinding of outcome assessors and incomplete outcome data. 4 Wide 95% confidence interval around the pooled estimate of effect. | ||||||
| Rosiglitazone plus metformin compared to glibenclamide (glyburide) plus metformin for Type 2 diabetes | ||||||
| Patient or population: patients with Type 2 diabetes | ||||||
| Outcomes | Illustrative comparative risks* (95% CI) | Relative effect | No of Participants | Quality of the evidence | Comments | |
| Assumed risk | Corresponding risk | |||||
| Glibenclamide (glyburide) plus metformin | Rosiglitazone plus metformin | |||||
| Global cognitive function | No evidence identified. | |||||
| Incidence of MCI | No evidence identified. | |||||
| Incidence of dementia | No evidence identified. | |||||
| Adverse events (Hypoglycaemia) | No evidence identified. | |||||
| Mortality | No evidence identified. | |||||
| *The basis for the assumed risk (e.g. the median control group risk across studies) is provided in footnotes. The corresponding risk (and its 95% CI) is based on the assumed risk in the comparison group and the relative effect of the intervention (and its 95% CI). | ||||||
| GRADE Working Group grades of evidence | ||||||
| Outcome or subgroup title | No. of studies | No. of participants | Statistical method | Effect size |
| 1 MMSE at 12 months Show forest plot | 1 | 156 | Mean Difference (IV, Random, 95% CI) | ‐0.90 [‐1.68, ‐0.12] |
| 2 Cognition composite score at 12 months Show forest plot | 1 | 156 | Mean Difference (IV, Random, 95% CI) | ‐0.00 [‐0.01, 0.01] |
| Outcome or subgroup title | No. of studies | No. of participants | Statistical method | Effect size |
| 1 Global cognitive function measured by MMSE 40 months Show forest plot | 1 | 2794 | Std. Mean Difference (IV, Random, 95% CI) | ‐0.00 [‐0.08, 0.07] |
| 2 Global cognitive function (defined as reduction of at least 3 points in the MMSE) Show forest plot | 1 | 11140 | Odds Ratio (M‐H, Random, 95% CI) | 0.98 [0.88, 1.08] |
| 3 Executive function measured by Stroop test at 40 months Show forest plot | 1 | 2794 | Mean Difference (IV, Random, 95% CI) | ‐0.61 [‐1.62, 0.40] |
| 4 Episodic memory measured by RAVLT at 40 months Show forest plot | 1 | 2794 | Mean Difference (IV, Random, 95% CI) | ‐0.01 [‐0.14, 0.12] |
| 5 Speed measured by DDST at 40 months Show forest plot | 1 | 2794 | Mean Difference (IV, Random, 95% CI) | 0.32 [‐0.28, 0.92] |
| 6 Incidence of dementia (defined as dementia according to DSM‐IV) Show forest plot | 1 | 11140 | Risk Ratio (M‐H, Random, 95% CI) | 1.27 [0.87, 1.85] |
| 7 Hypoglycaemia Show forest plot | 2 | 12931 | Risk Ratio (M‐H, Random, 95% CI) | 2.18 [1.52, 3.14] |
| 8 All cause mortality Show forest plot | 3 | 15888 | Risk Ratio (M‐H, Random, 95% CI) | 0.99 [0.87, 1.13] |
| Outcome or subgroup title | No. of studies | No. of participants | Statistical method | Effect size |
| 1 Composite outcome: working memory Show forest plot | 1 | 136 | Mean Difference (IV, Random, 95% CI) | ‐0.10 [‐0.69, 0.49] |
| 2 Composite outcome: learning ability Show forest plot | 1 | 136 | Mean Difference (IV, Random, 95% CI) | 0.0 [‐0.54, 0.54] |
| 3 Composite outcome: cognitive efficiency Show forest plot | 1 | 136 | Mean Difference (IV, Random, 95% CI) | ‐0.1 [‐0.64, 0.44] |
| 4 CANTAB Paired AssociatesLearning (PAL) test Show forest plot | 1 | 136 | Mean Difference (IV, Random, 95% CI) | ‐3.10 [‐3.71, ‐2.49] |
| 5 CANTAB Pattern recognition memory (delayed) test Show forest plot | 1 | 136 | Mean Difference (IV, Random, 95% CI) | ‐0.2 [‐0.30, ‐0.10] |
| 6 Working memory measured by Spatial working memory test Show forest plot | 1 | 136 | Mean Difference (IV, Random, 95% CI) | 0.4 [‐0.24, 1.04] |
| 7 CANTAB Rapid visual information processing test Show forest plot | 1 | 136 | Mean Difference (IV, Random, 95% CI) | ‐11.7 [‐15.71, ‐7.69] |
| 8 CANTAB Reaction time test Show forest plot | 1 | 136 | Mean Difference (IV, Random, 95% CI) | 9.3 [6.76, 11.84] |
| 9 Episodic memory measured by RAVLT (immediate) Show forest plot | 1 | 137 | Mean Difference (IV, Random, 95% CI) | ‐0.20 [‐0.50, 0.10] |
| 10 Speed measured by DSST Show forest plot | 1 | 136 | Mean Difference (IV, Random, 95% CI) | ‐1.4 [‐1.70, ‐1.10] |
| 11 Working memory measured by Spatial working memory test Show forest plot | 1 | 136 | Mean Difference (IV, Random, 95% CI) | 0.4 [‐0.24, 1.04] |