Efecto del tratamiento de la diabetes tipo 2 sobre el desarrollo del deterioro cognoscitivo y la demencia
Appendices
Appendix 1. Update searches from May 2011 to November 2015
| Source
| Search strategy | Hits retrieved |
| 1. ALOIS (www.medicine.ox.ac.uk/alois) [Last searched for this review on 15 October 2016] | Keyword search: diabetic OR diabetes OR “type 2” OR “type II” | May 2011: 87 Oct 2014: 5 Nov 2015: 9 October 2016: 3 |
| 2. MEDLINE In‐process and other non‐indexed citations and MEDLINE 1950‐present (Ovid SP) [Last searched for this review on 15 October 2016] | 1. exp Diabetes Mellitus, Type 2/ 2. (diabet* adj2 ("2" or "type II")).ti,ab. 3. (DM2 or NIDDM or IIDM).ti,ab. 4. or/1‐3 5. (cognit* or memor* or QOL or "quality of life").ti,ab. 6. 4 and 5 7. randomized controlled trial.pt. 8. controlled clinical trial.pt. 9. randomized.ab. 10. placebo.ab. 11. drug therapy.fs. 12. randomly.ab. 13. trial.ab. 14. groups.ab. 15. or/7‐14 16. (animals not (humans and animals)).sh. 17. 15 not 16 18. 6 and 17 19. (2008* or 2009* or 2010* or 2011*).ed. 20. 18 and 19
| May 2011: 470 Oct 2014: 803 Nov 2015: 294 October 2016: 481 |
| 3. Embase 1980 to 2011 week 20 (Ovid SP) [Last searched for this review on 15 October 2016] | 1. exp *non insulin dependent diabetes mellitus/ 2. diabetic obesity/ 3. (diabet* adj2 ("type II" or diabetic obesity)).ti,ab. 4. (DM2 or NIDDM or IIDM).ti,ab. 5. "diabetes mellitus".ti,ab. 6. or/1‐5 7. (cogni* or dement* or alzheimer* or memor* or QOL or "quality of life").ti,ab. 8. 6 and 7 9. clinical trial/ 10. double blind procedure/ 11. single blind procedure/ 12. (random* adj3 (assign* or alloc*)).ti,ab. 13. ((singl* or double* or trebl* or tripl*) and (blind* or mask*)).ti,ab. 14. or/9‐13 15. 8 and 14 16. (2008* or 2009* or 2010* or 2011*).em. 17. 15 and 16
| May 2011: 358 Oct 2014: 417 Nov 2015: 147 October 2016: 260 |
| 4. PsycINFO 1806 to May week 3 2011 (Ovid SP) [Last searched for this review on 15 October 2016] | 1. *Diabetes Mellitus/ 2. ("type 2" or "type II").ti,ab. 3. 1 and 2 4. (DM2 or NIDDM ir IIDM).ti,ab. 5. ("diabetes mellitus" and "type 2").ti,ab. 6. ("diabetes mellitus" and "type II").ti,ab. 7. ("type 2 diabet*" or "type II diabet*").ti,ab. 8. or/3‐7 9. (cogn* or dement* or alzheimer* or QOL or "quality of life").ti,ab. 10. 8 and 9 11. (random* and (alloc* or assign*)).ti,ab. 12. ((doubl* or singl* or trebl* or tripl*) adj2 (blind* or mask*)).ti,ab. 13. randomi?ed.ti,ab. 14. "controlled trial*".ti,ab. 15. placebo*.ti,ab. 16. or/11‐15 17. 10 and 16
| May 2011: 53 Oct 2014: 59 Nov 2015: 13 October 2016: 21 |
| 5. CINAHL (EBSCOhost) [Last searched for this review on 15 October 2016] | S1 (MM "Diabetes Mellitus, Non‐Insulin‐Dependent") S2 TX DM2 OR NIDDM OR IIDM S3 TX "diabetes mellitus type 2" S4 TX "diabetes mellitus type II" S5 TX "type 2 diabet*" OR "typ II diabet*" S6 S1 or S2 or S3 or S4 or S5 S7 TX cogni* OR dement* OR alzheimer* OR memor* OR QOL OR "quality of life" S8 S6 and S7 S9 EM 2008 S10 EM 2009 S11 EM 2010 S12 EM 2011 S13 S9 or S10 or S11 or S12 S14 S8 and S13 S15 TX random* alloc* S16 TX placebo* S17 (MH "Clinical Trials") OR (MH "Randomized Controlled Trials") S18 TX trial OR RCT S19 S15 or S16 or S17 or S18 S20 S14 and S19 | May 2011: 119 Oct 2014: 140 Nov 2015: 123 October 2016: 61 |
| 6. Web of Science (1945 to present); plus conference proceedings [Last searched for this review on 15 October 2016] | Topic=(diabet* OR DM2) AND Topic=(cognit* OR dement*) AND Topic=(random* OR trial OR placebo OR "double‐blind*" OR RCT) AND Year Published=(2008‐2011) Timespan=All Years.
| May 2011:367 Oct 2014: 89 Nov 2015: 502 October 2016: 508 |
| 7. LILACS (BIREME) [Last searched for this review on 15 October 2016] | diabet$ [Words] and demen$ OR memor$ OR alzheimer$ OR cogn$ [Words] and random$ OR trial OR placebo OR blind$ OR mask$ [Words] | May 2011: 17 Oct 2014: 0 Nov 2015: 0 October 2016: 4 |
| 8. CENTRAL (the Cochrane Library) [Last searched for this review on 15 October 2016] | #1 diabet* #2 MeSH descriptor Diabetes Mellitus, Type 2, this term only #3 NIDDM OR “II DM” OR DM2 #4 #1 OR #2 OR #3 #5 dement* OR alzheim* OR cognit* OR memor* #6 (#4 AND #5), from 2008 to 2011 | May 2011: 111 Oct 2014: 253 Nov 2015: 153 October 2016: 167 |
| 9. Clinicaltrials.gov (www.clinicaltrials.gov) [Last searched for this review on 15 October 2016] | cognition OR cognitive OR memory OR dementia OR alzheimers OR alzheimer | Interventional Studies | diabetes OR DMII OR DM2 OR diabetic | Adult, Senior | received from 01/01/2008 to 06/01/2011 | May 2011: 54 Oct 2014: 22 Nov 2015: 6 October 2016: 48 |
| 10. ICTRP Search Portal (http://apps.who.int/trialsearch) [includes: Australian New Zealand Clinical Trials Registry; ClinicalTrilas.gov; ISRCTN; Chinese Clinical Trial Registry; Clinical Trials Registry – India; Clinical Research Information Service – Republic of Korea; German Clinical Trials Register; Iranian Registry of Clinical Trials; Japan Primary Registries Network; Pan African Clinical Trial Registry; Sri Lanka Clinical Trials Registry; The Netherlands National Trial Register] [Last searched for this review on 15 October 2016] | #1 Diabetes AND dementia = 4 #2 diabetes AND cognition = 29 #3 diabetes AND memory = 9 | May 2011: 42 Oct 2014: 26 Nov 2015: 24 October 2016: 5 |
| TOTAL before de‐duplication | May 2011: 1678 Oct 2014: 1206 Nov 2015: 1271 October 2016: 1558 | |
| TOTAL after de‐dupe and first‐assess | May 2011:43 Oct 2014: 171 Nov 2015: 286 October 2016: 255 | |
Appendix 2. Original search: 2008
On 20 January 2008 the following databases were searched:
CENTRAL (the Cochrane Library): issue 4/2007
Search strategy:
1 DIABETES‐MELLITUS‐NON‐INSULIN‐DEPENDENT*:ME
2 OBESITY‐IN‐DIABETES*:ME
3 ((NIDDM or II DM) or DM2)
4 ((#1 or #2 or #3)
5 (COGN* or DEMENT* or MEMOR*)
6 (#4 and #5)
MEDLINE: 1966‐2008/01
Search strategy:
1 explode "Diabetes‐Mellitus‐Type‐2"/ all subheadings
2 diabet* near ("2" or "type II")
3 DM2 or NIDDM or IIDM
4 #1 or #2 or #3
5 cognit* or memor* or QOL or "quality of life"
6 #4 and #5
7 (randomized‐controlled‐trial in PT) or (controlled‐trial in PT)
8 "Randomized‐Controlled‐Trials"/ all subheadings
9 random* and (allocat* or assign*)
10 (doubl* or singl* or trebl* or tripl*) near (blind* or mask*)
11 placebo*
12 "Double‐Blind‐Method" in MIME,MJME
13 cross‐over or crossover
14 #7 or #8 or #9 or #10 or #11 or #12 or #13
* 15 #6 and #14
Embase: 1985‐2008/01 week 3
Search strategy:
1 "non‐insulin‐dependent‐diabetes‐mellitus"/ all subheadings
2 "diabetic‐obesity"/ all subheadings
3 "diabetes mellitus" and ("type 2" or "type II")
4 DM2 or NIDDM or IIDM
5 (typ* "2" or typ* "II") near (diabet* or DM)
6 "diabetes type 2" or "diabetes type II"
7 #1 or #2 or #3 or #4 or #5 or #6
8 cogn* or dement* or alzheimer* or memor* or QOL or "quality of life"
9 #7 and #8
10 explode "clinical‐trial"/ all subheadings
11 "double‐blind‐procedure"/ all subheadings
12 "single‐blind‐procedure"/ all subheadings
13 alloc*
14 random* and (assign* or alloc*)
15 (singl* or double* or trebl* or tripl*) and (blind* or mask*)
16 #10 or #11 or #12 or #13 or #14 or #15
17 #9 and #16
PsycINFO: 1872‐2008/01 week 2
search strategy:
1 "Diabetes‐Mellitus" in DE
2 #1 and ("type 2" or "type II")
3 DM2 or NIDDM ir IIDM
4 "diabetes mellitus type 2"
5 "diabetes mellitus type II"
6 ("type 2" or "type II") near (diab* or DM)
7 "diabetes type 2" or "diabetes type II"
8 #2 or #3 or #4 or #5 or #6 or #7
9 cogn* or dement* or alzheimer* or QOL or "quality of life"
10 #8 and #9
11 random* and (alloc* or assign*)
12 (doubl* or singl* or trebl* or tripl*) near (blind* or mask*)
13 randomi?ed
14 "controlled trial*"
15 placebo*
16 #11 or #12 or #13 or #14 or #15
17 #10 and #16
CINAHL: 1982‐2007/12 week 1
Search strategy:
1 "Diabetes‐Mellitus‐Non‐Insulin‐Dependent"/ all topical subheadings / all age subheadings
2 DM2 or NIDDM or IIDM
3 "diabetes mellitus type 2" or "diabetes mellitus type II"
4 "diabetes type 2" or "diabetes type II"
5 ("type 2" or "type II") near (diab* or DM)
6 #1 or #2 or #3 or #4 or #5
7 cogn* or dement* or alzheimer* or memor* or QOL or "quality of life"
8 #6 and #7
9 random* near (assign* or alloc*)
10 randomi?ed
11(singl* or doubl* or trebl* or tripl*) near (blind* or mask*)
12 placebo*
13 "controlled trial"
14 #9 or #10 or #11 or #12 or #13
15 #8 and #14
Appendix 3. Hierarchy used to select from instruments measuring the same outcome
Hierarchy used to select from instruments measuring the same outcome
For each outcome described in the protocol, we will apply an outcome specific hierarchy.
For example, if a given study reports 3 different instruments to measure executive function, we will apply the hierarchy to choose the single instrument of which we would extract / pool outcome data. For example, if a study reports data on Stroop Color and Word Test, Raven’s Progressive Matrices and the Hong Kong list learning test, we will only extract the data from the Stroop Color and Word Test, which is highest on our hierarchy on executive function. Validated versions of a test in alternative languages will be treated as the same test.
We recognise that the outcomes of interest may be measured with multiple other instruments. Instruments which do not appear on the list were not identified more than once in the sample papers. Data from other instruments will be extracted if no instrument from the list is used in a study. If a study uses more than one such instrument, then we have no a priori preference and reviewers’ judgment will be used.
Primary outcome: Global cognitive function
Explanation: the hierarchy is based on the frequencies found below.
| Hierarchy | Instruments | Frequency of use in sample papers |
| 1 | MMSE or modified MMSE | 24 |
| 2 | modified Telephone Interview for Cognitive Status (TICS‐m) | 8 |
| 3 | ADAS‐Cog | 4 |
| 4 | Clinical Dementia Rating (CDR) or Clinical Dementia Rating sum of boxes (CDR‐SOB) | 3 |
| 5 | Hasegawa’s dementia scale (HDS‐R) / modified HDS | 3 |
Secondary outcome: Executive function
| Hierarchy | Instruments | Frequency of use in sample papers |
| 1 | Stroop Color and Word Test, referred to as:· Modified Stroop test· Victoria version of Stroop Test· California Older Adult Stroop Test (COAST)· Stroop Color and Word Test | 24 |
| 2 | Trail Making Test B | 22 |
| 3 | WAIS‐III Similarities task (WAIS = Wechsler Adult Intelligence Scale) | 4 |
| 4 | WAIS‐III Matrices or Matrix Reasoning task | 3 |
| 4 | Task Switching | 3 |
| 5 | Raven’s Progressive Matrices | 2 |
Secondary outcome: Speed
| Hierarchy | Instruments | Frequency of use in sample papers |
| 1 | Trail Making Test, A | 20 |
| 2 | Digit symbol substitution test (DSST) | 8 |
| 3 | WAIS‐R referred to as (for example):· the Digit Symbol Subtest of the WAIS‐R· Digit Symbol and Similarities in Wechsler Adult Intelligence Scale 3rd edition· composite score of the Digit‐Symbol Coding subtest of the WAIS‐III· Symbol Search subtest of WAIS‐III | 5 |
| 4 | Symbol Digit Modalities Test (SDMT) | 4 |
| 5 | Choice reaction time | 3 |
| 5 | Cancellation test | 3 |
| 5 | Finger Tapping Test | 3 |
| 6 | 2‐choice reaction time test | 2 |
| 6 | a subtest of the Leistungs‐Prüf‐System 50 | 2 |
| 6 | Simple Reaction Time | 2 |
Secondary outcome: Episodic memory
If instruments occurred with the same frequency, then we preferred verbal over visual memory tests. If an instrument includes several episodic memory outcomes, then we preferred recall over recognition and delayed over immediate recall.
| Hierarchy | Instruments | Frequency of use in sample papers |
| 1 | Rey Auditory Verbal Learning Test (RAVLT) | 9 |
| 4 | Logical Memory subtest of the Wechsler Memory Scale 3rd Edition (WMS‐III) | 5 |
| 5 | Visual Reproduction II from Wechsler Memory Scale–Revised (WMS‐R) | 4 |
| 5 | Benton Visual Retention Test‐Revised 5th Edition (BVRT‐R) | 4 |
| 6 | delayed recall of the TICS 10‐word list | 3 |
| 6 | California Verbal Learning Test | 3 |
| 6 | Visual Reproduction I from Wechsler Memory Scale–Revised (WMS‐R) | 3 |
| 7 | RivermeadBehavioural Memory Test (RBMT) | 2 |
| 7 | Hopkins Verbal Learning Test | 2 |
| 7 | Buschke Selective Reminding test | 2 |
| 7 | Paragraph Recall Test | 2 |
| 7 | Rey Complex Figure Test (RCFT ) | 2 |
Secondary outcome: Working memory
| Hierarchy | Instruments | Frequency of use in sample papers |
| 1* | Digit Span Test of WAIS‐III (composite score calculated as difference betweenForward and Backward) | 2 |
| 2 | Digit Span Test of WAIS‐III (Backward Component) | 16 |
| 3 | Digit Span Test of WAIS‐III (Forward Component) | 14 |
| 4 | “d2” ‐ Test of Attention | 2 |
| 4 | Self Ordered Pointing Test (SOPT) | 2 |
| 4 | Letter Number Sequencing (LNS) test | 2 |
* The WAIS –III composite instrument is preferred over the single components
Secondary outcome: Verbal fluency
| Hierarchy | Instruments | Frequency of use in sample papers |
| 1 | Verbal fluency test | 27 |
| 2 | COWAT (Controlled Oral Word Association) | 3 |
Secondary outcome: Semantic memory
| Hierarchy | Instruments | Frequency of use in sample papers |
| 1 | Boston naming Test | 7 |
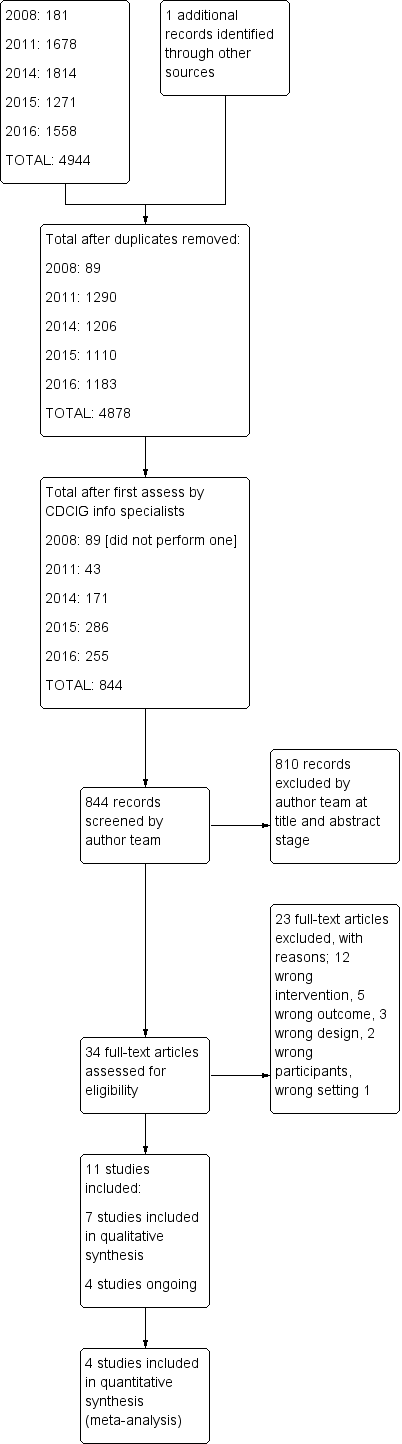
Study flow diagram.
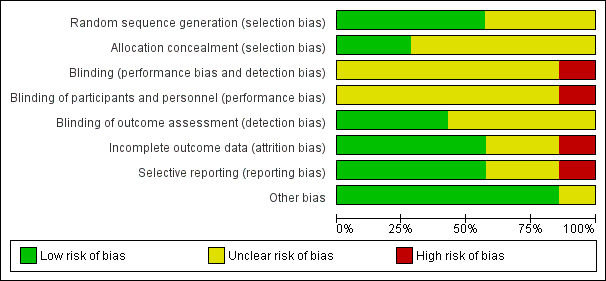
Risk of bias graph: review authors' judgements about each risk of bias item presented as percentages across all included studies.
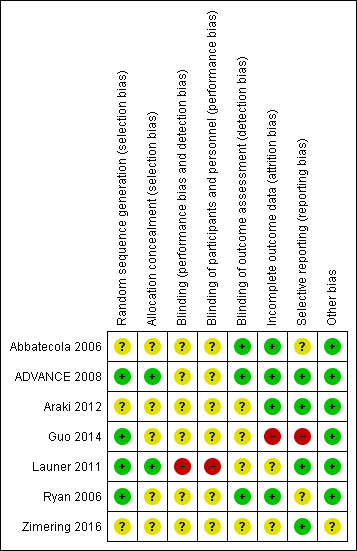
Risk of bias summary: review authors' judgements about each risk of bias item for each included study.
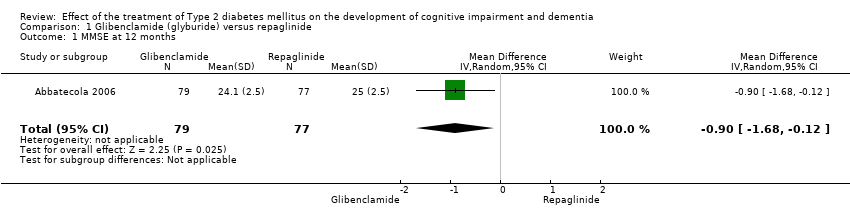
Comparison 1 Glibenclamide (glyburide) versus repaglinide, Outcome 1 MMSE at 12 months.

Comparison 1 Glibenclamide (glyburide) versus repaglinide, Outcome 2 Cognition composite score at 12 months.

Comparison 2 Intense glycaemic control versus standard glycaemic control, Outcome 1 Global cognitive function measured by MMSE 40 months.
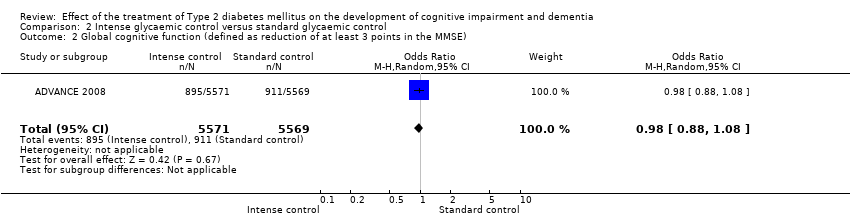
Comparison 2 Intense glycaemic control versus standard glycaemic control, Outcome 2 Global cognitive function (defined as reduction of at least 3 points in the MMSE).
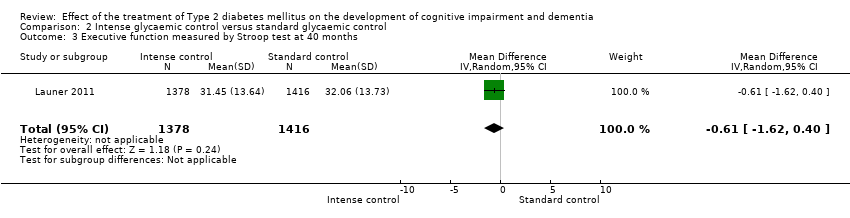
Comparison 2 Intense glycaemic control versus standard glycaemic control, Outcome 3 Executive function measured by Stroop test at 40 months.
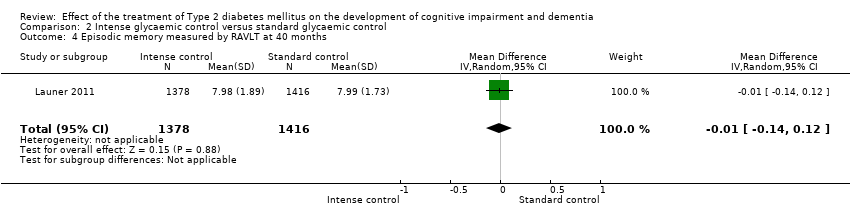
Comparison 2 Intense glycaemic control versus standard glycaemic control, Outcome 4 Episodic memory measured by RAVLT at 40 months.

Comparison 2 Intense glycaemic control versus standard glycaemic control, Outcome 5 Speed measured by DDST at 40 months.

Comparison 2 Intense glycaemic control versus standard glycaemic control, Outcome 6 Incidence of dementia (defined as dementia according to DSM‐IV).

Comparison 2 Intense glycaemic control versus standard glycaemic control, Outcome 7 Hypoglycaemia.

Comparison 2 Intense glycaemic control versus standard glycaemic control, Outcome 8 All cause mortality.
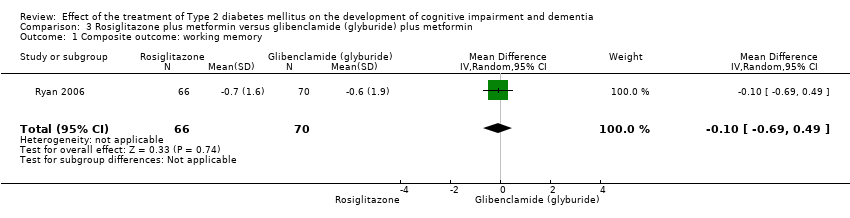
Comparison 3 Rosiglitazone plus metformin versus glibenclamide (glyburide) plus metformin, Outcome 1 Composite outcome: working memory.

Comparison 3 Rosiglitazone plus metformin versus glibenclamide (glyburide) plus metformin, Outcome 2 Composite outcome: learning ability.

Comparison 3 Rosiglitazone plus metformin versus glibenclamide (glyburide) plus metformin, Outcome 3 Composite outcome: cognitive efficiency.

Comparison 3 Rosiglitazone plus metformin versus glibenclamide (glyburide) plus metformin, Outcome 4 CANTAB Paired AssociatesLearning (PAL) test.
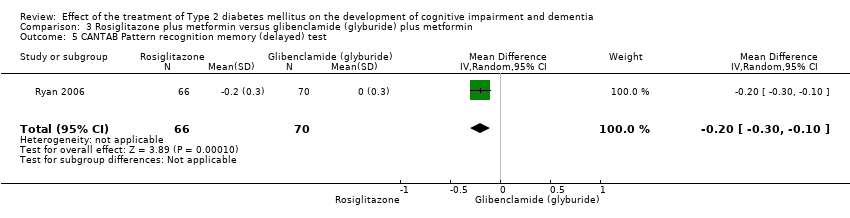
Comparison 3 Rosiglitazone plus metformin versus glibenclamide (glyburide) plus metformin, Outcome 5 CANTAB Pattern recognition memory (delayed) test.

Comparison 3 Rosiglitazone plus metformin versus glibenclamide (glyburide) plus metformin, Outcome 6 Working memory measured by Spatial working memory test.

Comparison 3 Rosiglitazone plus metformin versus glibenclamide (glyburide) plus metformin, Outcome 7 CANTAB Rapid visual information processing test.

Comparison 3 Rosiglitazone plus metformin versus glibenclamide (glyburide) plus metformin, Outcome 8 CANTAB Reaction time test.
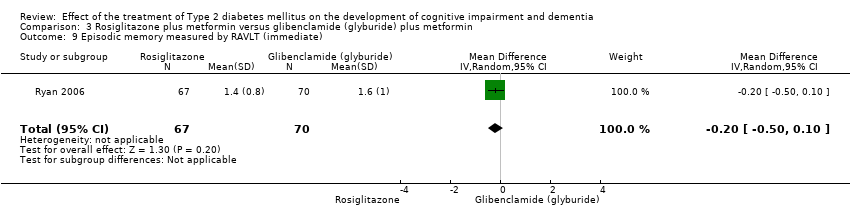
Comparison 3 Rosiglitazone plus metformin versus glibenclamide (glyburide) plus metformin, Outcome 9 Episodic memory measured by RAVLT (immediate).

Comparison 3 Rosiglitazone plus metformin versus glibenclamide (glyburide) plus metformin, Outcome 10 Speed measured by DSST.

Comparison 3 Rosiglitazone plus metformin versus glibenclamide (glyburide) plus metformin, Outcome 11 Working memory measured by Spatial working memory test.
| Glibenclamide (glyburide) compared to Repaglinide for Type 2 diabetes | ||||||
| Patient or population: patients with Type 2 diabetes | ||||||
| Outcomes | Illustrative comparative risks* (95% CI) | Relative effect | No. of Participants | Quality of the evidence | Comments | |
| Assumed risk | Corresponding risk | |||||
| Repaglinide | Glibenclamide (glyburide) | |||||
| Global cognitive function measured by MMSE at 12 months | The mean MMSE at 12 months in the intervention groups was | ‐ | 156 | ⊕⊕⊝⊝ | Evidence of a small effect on the MMSE favouring glibenclamide (glyburide) at 12 months. | |
| Incidence of MCI | No evidence identified. | |||||
| Incidence of dementia | No evidence identified. | |||||
| Adverse events (Hypoglycaemia) | No evidence identified. | |||||
| Mortality | No evidence identified. | |||||
| *The basis for the assumed risk (e.g. the median control group risk across studies) is provided in footnotes. The corresponding risk (and its 95% CI) is based on the assumed risk in the comparison group and the relative effect of the intervention (and its 95% CI). | ||||||
| GRADE Working Group grades of evidence | ||||||
| 1 Abbatecola et al (2006) has an unclear risk of bias due to no description on the random sequence generation, allocation concealment, blinding of participants and personnel, and selective reporting. | ||||||
| Intense glycaemic control compared to standard glycaemic control for Type 2 diabetes | ||||||
| Patient or population: patients with Type 2 diabetes | ||||||
| Outcomes | Illustrative comparative risks* (95% CI) | Relative effect | No of Participants | Quality of the evidence | Comments | |
| Assumed risk | Corresponding risk | |||||
| Standard glycaemic control | Intense glycaemic control | |||||
| Global cognitive function (defined as reduction of at least 3 points in MMSE) | 164 per 1000 | 160 per 1000 | RR 0.98 | 11,140 | ⊕⊕⊕⊝ | Evidence of no significant difference between intensive and standard glycaemic control. |
| Global cognitive function measured by MMSE at 40 months | The mean general cognitive function measured by MMSE at 40 months in the intervention groups was | ‐ | 2794 | ⊕⊕⊕⊝ | Evidence of no significant difference between intensive and standard glycaemic control. | |
| Incidence of MCI | No evidence identified. | |||||
| Incidence of dementia (defined as dementia according to DSM‐IV) | 9 per 1000 | 11 per 1000 | RR 1.27 | 11,140 | ⊕⊕⊝⊝ | Evidence of no significant difference between intensive and standard glycaemic control. |
| Adverse events (Hypoglycaemia) | 17 per 1000 | 36 per 1000 (25 to 52) | RR 2.18 (1.52 to 3.14) | 12,931 (2 studies) | ⊕⊕⊝⊝ | Evidence of a significantly higher incidence of hypoglycaemic events for intensive glycaemic control compared with standard glycaemic control. |
| Mortality | 81 per 1000 | 81 per 1000 | RR 1.0 | 15,888 | ⊕⊕⊕⊝ | Evidence of no significant difference between intensive and standard glycaemic control. |
| *The basis for the assumed risk (e.g. the median control group risk across studies) is provided in footnotes. The corresponding risk (and its 95% CI) is based on the assumed risk in the comparison group and the relative effect of the intervention (and its 95% CI). | ||||||
| GRADE Working Group grades of evidence | ||||||
| 1 The ADVANCE study has an unclear risk of bias due to no description in the random sequence generation, allocation concealment, and blinding of participants and personnel. 2 Launer et al has a high risk of bias in the blinding of participants and personnel and an unclear risk of bias due to no description in the blinding of outcome assessors and incomplete outcome data. 4 Wide 95% confidence interval around the pooled estimate of effect. | ||||||
| Rosiglitazone plus metformin compared to glibenclamide (glyburide) plus metformin for Type 2 diabetes | ||||||
| Patient or population: patients with Type 2 diabetes | ||||||
| Outcomes | Illustrative comparative risks* (95% CI) | Relative effect | No of Participants | Quality of the evidence | Comments | |
| Assumed risk | Corresponding risk | |||||
| Glibenclamide (glyburide) plus metformin | Rosiglitazone plus metformin | |||||
| Global cognitive function | No evidence identified. | |||||
| Incidence of MCI | No evidence identified. | |||||
| Incidence of dementia | No evidence identified. | |||||
| Adverse events (Hypoglycaemia) | No evidence identified. | |||||
| Mortality | No evidence identified. | |||||
| *The basis for the assumed risk (e.g. the median control group risk across studies) is provided in footnotes. The corresponding risk (and its 95% CI) is based on the assumed risk in the comparison group and the relative effect of the intervention (and its 95% CI). | ||||||
| GRADE Working Group grades of evidence | ||||||
| Outcome or subgroup title | No. of studies | No. of participants | Statistical method | Effect size |
| 1 MMSE at 12 months Show forest plot | 1 | 156 | Mean Difference (IV, Random, 95% CI) | ‐0.90 [‐1.68, ‐0.12] |
| 2 Cognition composite score at 12 months Show forest plot | 1 | 156 | Mean Difference (IV, Random, 95% CI) | ‐0.00 [‐0.01, 0.01] |
| Outcome or subgroup title | No. of studies | No. of participants | Statistical method | Effect size |
| 1 Global cognitive function measured by MMSE 40 months Show forest plot | 1 | 2794 | Std. Mean Difference (IV, Random, 95% CI) | ‐0.00 [‐0.08, 0.07] |
| 2 Global cognitive function (defined as reduction of at least 3 points in the MMSE) Show forest plot | 1 | 11140 | Odds Ratio (M‐H, Random, 95% CI) | 0.98 [0.88, 1.08] |
| 3 Executive function measured by Stroop test at 40 months Show forest plot | 1 | 2794 | Mean Difference (IV, Random, 95% CI) | ‐0.61 [‐1.62, 0.40] |
| 4 Episodic memory measured by RAVLT at 40 months Show forest plot | 1 | 2794 | Mean Difference (IV, Random, 95% CI) | ‐0.01 [‐0.14, 0.12] |
| 5 Speed measured by DDST at 40 months Show forest plot | 1 | 2794 | Mean Difference (IV, Random, 95% CI) | 0.32 [‐0.28, 0.92] |
| 6 Incidence of dementia (defined as dementia according to DSM‐IV) Show forest plot | 1 | 11140 | Risk Ratio (M‐H, Random, 95% CI) | 1.27 [0.87, 1.85] |
| 7 Hypoglycaemia Show forest plot | 2 | 12931 | Risk Ratio (M‐H, Random, 95% CI) | 2.18 [1.52, 3.14] |
| 8 All cause mortality Show forest plot | 3 | 15888 | Risk Ratio (M‐H, Random, 95% CI) | 0.99 [0.87, 1.13] |
| Outcome or subgroup title | No. of studies | No. of participants | Statistical method | Effect size |
| 1 Composite outcome: working memory Show forest plot | 1 | 136 | Mean Difference (IV, Random, 95% CI) | ‐0.10 [‐0.69, 0.49] |
| 2 Composite outcome: learning ability Show forest plot | 1 | 136 | Mean Difference (IV, Random, 95% CI) | 0.0 [‐0.54, 0.54] |
| 3 Composite outcome: cognitive efficiency Show forest plot | 1 | 136 | Mean Difference (IV, Random, 95% CI) | ‐0.1 [‐0.64, 0.44] |
| 4 CANTAB Paired AssociatesLearning (PAL) test Show forest plot | 1 | 136 | Mean Difference (IV, Random, 95% CI) | ‐3.10 [‐3.71, ‐2.49] |
| 5 CANTAB Pattern recognition memory (delayed) test Show forest plot | 1 | 136 | Mean Difference (IV, Random, 95% CI) | ‐0.2 [‐0.30, ‐0.10] |
| 6 Working memory measured by Spatial working memory test Show forest plot | 1 | 136 | Mean Difference (IV, Random, 95% CI) | 0.4 [‐0.24, 1.04] |
| 7 CANTAB Rapid visual information processing test Show forest plot | 1 | 136 | Mean Difference (IV, Random, 95% CI) | ‐11.7 [‐15.71, ‐7.69] |
| 8 CANTAB Reaction time test Show forest plot | 1 | 136 | Mean Difference (IV, Random, 95% CI) | 9.3 [6.76, 11.84] |
| 9 Episodic memory measured by RAVLT (immediate) Show forest plot | 1 | 137 | Mean Difference (IV, Random, 95% CI) | ‐0.20 [‐0.50, 0.10] |
| 10 Speed measured by DSST Show forest plot | 1 | 136 | Mean Difference (IV, Random, 95% CI) | ‐1.4 [‐1.70, ‐1.10] |
| 11 Working memory measured by Spatial working memory test Show forest plot | 1 | 136 | Mean Difference (IV, Random, 95% CI) | 0.4 [‐0.24, 1.04] |