Scolaris Content Display Scolaris Content Display

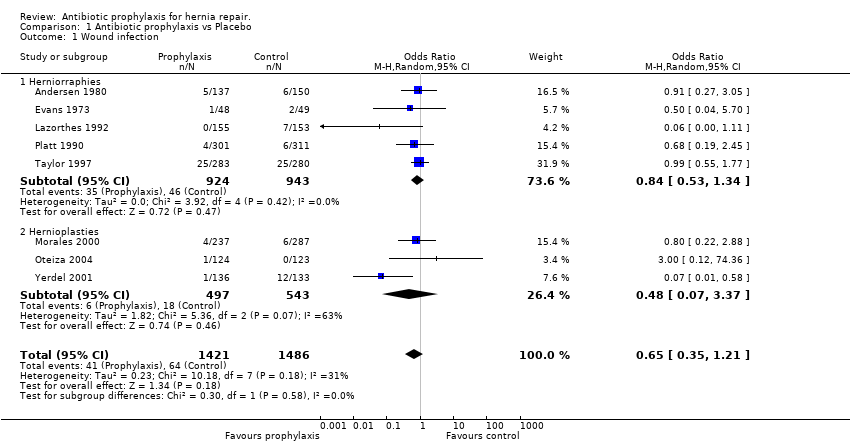
Comparison 1 Antibiotic prophylaxis vs Placebo, Outcome 1 Wound infection.
Figuras y tablas -
Analysis 1.1

Comparison 1 Antibiotic prophylaxis vs Placebo, Outcome 1 Wound infection.

Table 1. Data form

Parameter

Score

ANDERSEN

EVANS

LAZORTHES

PLATT

TAYLOR

MORALES

YERDEL

OTEIZA

(A) Random allocation

1 = explained 0 = not explained

0

1

0

1

1

1

1

1

(B) Blinded study

1 = yes 0 = no

1

0

0

1

1

1

1

0

(C) Groups of patients are homogeneous

1 = comparable in technique used, age, sex and comorbid factors 0,5 = one factor differs significantly 0 = more than one factor differs significantly or comparability not specified

0.5

0

1

1

1

1

1

1

(D) Statistical method adequate

1 = yes 0 = no

1

0

0

1

1

1

1

1

(E) Incisional surgical site infection was definied

1 = yes 0 = no

1

1

0

1

1

1

1

1

(F) Number of antibiotics

1 = uses only one antibiotic 0,5 = uses more than one antibiotic

1

1

1

1

1

1

1

1

(G) Outcome assesment

1 = by personel no related to study 0,5 = by study personel 0 = not specified

0

0.5

0.5

0.5

1

0.5

1

0.5

(H) Route of administration

1 = especified 0 = not especified

1

1

1

1

1

1

1

1

(I) Number of doses

1 = especified 0= not especified

1

1

1

1

1

1

1

1

(J) Timing of administration

1 = especified 0 = not especified

1

1

1

1

1

1

1

1

SCORE (%)

7,5 (75%)

6,5 (65%)

5,5 (55%)

9,5 (95%)

10 (100%)

9,5 (95%)

10 (100%)

8,5 (85%)

Figuras y tablas -
Table 1. Data form
Table 2. Comparative and controlled studies

AUTHOR/YEAR

PROPHYLAXIS n/N (%)

CONTROL n/N (%)

OR (95% CI Random)

Andersen 1980

5/137 (3,6%)

6/150 (4%)

0.91 (0.27,3.05)

Escartín 1999

0/14 (0%)

13/184 (7%)

0.44 (0.02,7.75)

Evans 1973

1/48 (2%)

2/49 (4%)

0.50 (0.04,5.70)

Lazorthes 1992

0/155 (0%)

7/153 (4,5%)

0.06 (0.00,1.11)

Platt 1990

4/301 (1,3%)

6/311 (1,9%)

0.68 (0.19,2.45)

Platt 1992

2/239 (0,8%)

15/982 (1,5%)

0.54 (0.12,2.40)

Reggiori 1996

0/123 (0%)

8/106 (7,5%)

0.05 (0.00,0.82)

Ryan 1967

2/1183 (0,1%)

82/5335 (1,5%)

0.11(0.03,0.44)

Taylor 1997

25/283 (8,8%)

25/280 (8,9%)

0.99 (0.55,1.77)

SUBTOTAL HERNIORRAPHIES (heterogeneity chi‐square=16.93 df=8 p=0.031)

39/2483 (1,5%)

164/7550 (2,1%)

0.34 (0.20,0.91)

Barreca 2000

0/63 (0%)

0/84 (0%)

Not Estimable

Escartín 1999

3/144 (2%)

10/133 (7,5%)

0.26 (0.07,0.97)

Gilbert 1993

10/1150 (0,8%)

4/684 (0,6%)

1.49 (0.47,4.77)

Morales 2000

4/237 (1,6%)

6/287 (2,1%)

0.80 (0.22,2.88)

Musella 2001

1/293 (0,3%)

6/284 (2,1%)

0.16(0.02,1.33)

Vara 1993

2/141 (1,4%)

9/137 (6,5%)

0.20 (0.04,0.97)

Yerdel 2001

1/136 (0,7%)

12/133 (9%)

0.07 (0.01,0.58)

Otaiza 2004

1/124 (0,8%)

0/123 (0%)

Not Estimable

SUBTOTAL HERNIOPLASTIES (heterogeneity chi‐square=10.61 df=5 p=0.06)

22/2288 (0,9%)

47/1865 (2,5%)

0.37 (0.15,0.90)

T O T A L (heterogeneity chi‐square=28.21 df=14 p=0.013)

61/4771 (1,3%)

211/9415 (2,2%)

0.41 (0.24,0.71)

Figuras y tablas -
Table 2. Comparative and controlled studies
Comparison 1. Antibiotic prophylaxis vs Placebo

Outcome or subgroup title

No. of studies

No. of participants

Statistical method

Effect size

1 Wound infection Show forest plot

8

2907

Odds Ratio (M‐H, Random, 95% CI)

0.65 [0.35, 1.21]

1.1 Herniorraphies

5

1867

Odds Ratio (M‐H, Random, 95% CI)

0.84 [0.53, 1.34]

1.2 Hernioplasties

3

1040

Odds Ratio (M‐H, Random, 95% CI)

0.48 [0.07, 3.37]

Figuras y tablas -
Comparison 1. Antibiotic prophylaxis vs Placebo