Gonadotrofina recombinante versus gonadotrofina coriónica humana urinaria para desencadenar la maduración final de los ovocitos en los ciclos de FIV e ICSI
Resumen
Antecedentes
Durante las últimas décadas, la gonadotrofina coriónica humana urinaria (uhCG) se ha utilizado para desencadenar la maduración final de los ovocitos en ciclos de fertilización in vitro (FIV) e inyección intracitoplasmática de esperma (ICSI). La tecnología recombinante ha permitido la producción de dos fármacos, la gonadotrofina coriónica humana recombinante (rhCG) y la hormona luteinizante recombinante (rLH), que se pueden utilizar con el mismo fin, imitar el aumento de la hormona luteinizante endógena (LH). Este hecho permite a los fabricantes comerciales ajustar la producción según las exigencias del mercado y eliminar todos los contaminantes urinarios, y a la vez facilitar la administración subcutánea segura de un compuesto con menos variación de un lote a otro. Sin embargo, antes de un cambio en la práctica, es necesario comparar la efectividad de los fármacos recombinantes con la gonadotrofina coriónica humana urinaria (uhCG) que se utiliza actualmente.
Objetivos
Evaluar los efectos de la rhCG subcutánea y las dosis altas de rLH versus la uhCG para inducir la maduración final de los ovocitos en mujeres subfértiles que se someten a ciclos de FIV e ICSI.
Métodos de búsqueda
Se realizaron búsquedas en el registro de ensayos del Grupo Cochrane de Trastornos Menstruales y Subfertilidad (Cochrane Menstrual Disorders and Subfertility Group) (abril 2015), en el Registro Cochrane Central de Ensayos Controlados (Cochrane Central Register of Controlled Trials, CENTRAL) (2015, Número 3), en MEDLINE (1946 a abril 2015), en EMBASE (1980 a abril 2015) y en PsycINFO (1806 a abril 2015), así como en los registros de ensayos ClinicalTrials.gov el 13 de mayo 2015 y en el portal de búsqueda de la World Health Organization International Clinical Trials Registry Platform (WHO ICTRP) el 14 de mayo 2015.
Criterios de selección
Dos autores de la revisión de forma independiente examinaron los títulos y resúmenes y seleccionaron los que parecieron pertinentes para obtener el documento completo. Se incluyeron los ensayos controlados aleatorizados que compararon la rhCG y la rLH con la hCG urinaria para el desencadenamiento de la maduración final de los ovocitos en los ciclos de FIV e ICSI, para el tratamiento de la infertilidad en mujeres normogonadotrópicas.
Obtención y análisis de los datos
Dos autores de la revisión de forma independiente evaluaron los artículos para la inclusión o exclusión, evaluaron la calidad y extrajeron los datos. Cualquier discrepancia se discutió en presencia de un tercer autor de la revisión para llegar a un consenso. Los resultados primarios de la revisión fueron el embarazo en curso/nacido vivo y la incidencia del síndrome de hiperestimulación ovárica (SHEO). El embarazo clínico, la tasa de abortos, el número de ovocitos recuperados y los eventos adversos fueron resultados secundarios. Los datos se combinaron para calcular los odds ratios (OR) y los intervalos de confianza (IC) del 95% y la heterogeneidad estadística se evaluó mediante la estadística I2 . La calidad general de la evidencia para las comparaciones principales se evaluó mediante los criterios GRADE.
Resultados principales
Se incluyeron 18 ECA con 2952 participantes; 15 compararon rhCG con uhCG, y tres compararon rhLH con uhCG. La calidad de la evidencia de las diferentes comparaciones varió de muy baja a alta: las limitaciones fueron el informe deficiente sobre los métodos de estudio y la imprecisión. Las empresas farmacéuticas financiaron nueve de los 18 estudios, y cinco estudios no informaron claramente de la fuente de financiación.
Embarazo en curso/nacido vivo
No hubo evidencia concluyente de una diferencia entre rhCG y uhCG (OR 1,15; IC del 95%: 0,89 a 1,49; siete ECA, n = 1136, I2 0%, evidencia de calidad moderada) o entre rhLH y uhCG (OR 0,95; IC del 95%: 0,51 a 1,78; dos, n 289, I2 = 0%, evidencia de calidad muy baja) para las tasas de embarazos en curso/nacidos vivos.
SHEO
No hubo evidencia de una diferencia entre la rhCG y la uhCG en la incidencia de SHEO: SHEO moderado a grave (OR 1,76; IC del 95%: 0,37 a 8,45; tres ECA, n = 417, I2 =0%, evidencia de calidad baja), SHEO moderado (OR 0,78; IC del 95%: 0,27 a 2.27; un ECA, n = 243, I2 0%, evidencia de calidad baja), SHEO leve a moderado (OR 1,00; IC del 95%: 0,42 a 2,38; dos ECA, n = 320, I2 = 0%, evidencia de calidad baja) o SHEO indefinido (OR 1,18; IC del 95%: 0,50 a 2,78; tres ECA, n = 495, I2 = 0%, evidencia de calidad baja). Asimismo, no hubo evidencia de una diferencia entre rhLH y uhCG en las tasas de SHEO moderado (OR 0,82, IC del 95%: 0,39 a 1,69, dos ECA, n = 280, I2 = 5%, evidencia de calidad muy baja).
Otros eventos adversos
No hubo evidencia de una diferencia en las tasas de aborto espontáneo entre rhCG y uhCG (OR 0,72, IC del 95%: 0,41 a 1,25; ocho ECA, n = 1196, I2 = 0%, evidencia de calidad baja) o entre rhLH y uhCG (OR 0,95, IC del 95%: 0,38 a 2,40; dos ECA, n = 289, I2 = 0%, evidencia de calidad muy baja). Para otros efectos adversos (con mayor frecuencia reacciones en el lugar de la inyección) la rhCG se asoció con un número menor de eventos adversos que la uhCG (OR 0,52, IC del 95%: 0,35 a 0,76; cinco ECA, n = 561; I2 = 67%, evidencia de calidad moderada). Sin embargo, cuando se utilizó un modelo de efectos aleatorios debido a la considerable heterogeneidad estadística, no hubo evidencia de diferencias entre los grupos (OR 0,56; IC del 95%: 0,27 a 1,13). Solo un estudio que comparó la rLH y la uhCG informó de otros eventos adversos, y no fue posible establecer conclusiones.
Conclusiones de los autores
Se concluye que no hay evidencia de una diferencia entre rhCG o rhLH y uhCG para las tasas de nacidos vivos o embarazos en curso, ni para las tasas de SHEO.
PICO
Resumen en términos sencillos
Gonadotrofina recombinante versus gonadotrofina coriónica humana urinaria para la inducción de la ovulación en la reproducción asistida
Pregunta de la revisión
Los investigadores Cochrane examinaron la evidencia sobre los efectos de dos fármacos que reproducen artificialmente las hormonas necesarias para la concepción fetal: la gonadotrofina coriónica humana recombinante (rhCG) y la hormona luteinizante humana recombinante (rhLH), y las compararon con la gonadotrofina coriónica humana urinaria (uhCG) para parejas con subfertilidad que se someten a ciclos de fecundación in vitro (FIV) o de inyección intracitoplasmática de espermatozoides (ICSI).
Antecedentes
Durante las últimas décadas, el uhCG se ha utilizado para desencadenar la maduración final de los ovocitos en los ciclos de FIV e ICSI. La tecnología recombinante ha permitido la producción de dos fármacos que se pueden utilizar con el mismo propósito, imitar el aumento natural de la hormona luteinizante (LH). Este hecho a los fabricantes comerciales ajustar la producción a los requisitos del mercado y eliminar todos los contaminantes urinarios, y a la vez facilitar la seguridad de los pacientes durante la administración de los medicamentos, así como normalizar los lotes de medicamentos. Sin embargo, antes de un cambio en la práctica, es necesario comparar la efectividad de los fármacos recombinantes con la uhCG que se utiliza actualmente. Los resultados primarios de la revisión fueron nacidos vivos o embarazo en curso, así como la incidencia del síndrome de hiperestimulación ovárica (SHEO).
Características de los estudios
Se encontraron 18 estudios con 2952 mujeres sometidas a FIV o ICSI. Quince ensayos con 2473 mujeres compararon rhCG con uhCG, y tres ensayos con 479 mujeres compararon rLH con uhCG.
Las mujeres en los estudios tenían entre 18 y 45 años, con ciclos menstruales regulares y sin antecedentes de SHEO. Los tipos de subfertilidad incluyeron enfermedades de las trompas, endometriosis, infertilidad inexplicable e infertilidad por factor masculino.
Las empresas farmacéuticas financiaron nueve de los 18 estudios; cuatro estudios no recibieron financiación comercial y los cinco restantes no indicaron claramente una fuente de financiación. La evidencia está actualizada hasta abril 2015.
Resultados clave
No hubo evidencia de una diferencia entre rhCG y uhCG o entre RhLH y uhCG en las tasas de nacidos vivos/embarazos en curso, ni en el SHEO.
Los estudios no informaron mucha evidencia sobre los eventos adversos aparte del SHEO, y la evidencia que se informó no fue concluyente.
Calidad de la evidencia
Para la comparación "rhCG versus uhCG", la evidencia fue de calidad moderada para la tasa de embarazo en curso/nacido vivo y de calidad baja para la incidencia del SHEO. La principal limitación de la evidencia fue la falta de precisión (es decir, el tamaño del estudio fue demasiado pequeño para descartar el papel del azar). Para la comparación "rLH versus uhCG", la evidencia fue de calidad muy baja para la tasa de embarazo en curso/nacido vivo y para la incidencia de SHEO. Las principales limitaciones de la evidencia fueron la falta de precisión y el informe deficiente sobre los métodos de estudio.
Authors' conclusions
Summary of findings
| RhCG compared to uhCG for final oocyte maturation triggering in IVF and ICSI cycles | ||||||
| Population: women undergoing final oocyte maturation triggering in IVF and ICSI cycles | ||||||
| Outcomes | Illustrative comparative risks* (95% CI) | Relative effect | No of participants | Quality of the evidence | Comments | |
| Assumed risk | Corresponding risk | |||||
| UhCG | RhCG | |||||
| Ongoing pregnancy/live birth rate per woman | 367 per 1000 | 396 per 1000 | OR 1.15 | 1136 | ⊕⊕⊕⊝ | — |
| OHSS per woman ‐ moderate to severe OHSS | 10 per 1000 | 17 per 1000 | OR 1.76 | 417 | ⊕⊕⊝⊝ | — |
| Clinical pregnancy rate per woman | 330 per 1000 | 343 per 1000 | OR 1.06 | 1806 | ⊕⊕⊕⊝ | — |
| Miscarriage rate per woman | 51 per 1000 | 37 per 1000 | OR 0.72 | 1347 | ⊕⊕⊝⊝ | — |
| Adverse events per woman | 331 per 1000 | 179 per 1000 | OR 0.52 | 561 | ⊕⊕⊕⊝ | Adverse events included: injection site pain, reaction, inflammation, nausea, vomiting, abdominal pain |
| *The basis for the assumed risk (e.g. the median control group risk across studies) is provided in footnotes. The corresponding risk (and its 95% confidence interval) is based on the assumed risk in the comparison group and the relative effect of the intervention (and its 95% CI). | ||||||
| GRADE Working Group grades of evidence | ||||||
| aThe pooled effect included both the line of no effect and appreciable benefit or harm. | ||||||
| RhLH compared to uhCG for final oocyte maturation triggering in IVF and ICSI cycles | |||||
| Population: women undergoing final oocyte maturation triggering in IVF and ICSI cycles | |||||
| Outcomes | Illustrative comparative risks* (95% CI) | Relative effect | No of participants | Quality of the evidence | |
| Assumed risk | Corresponding risk | ||||
| UhCG | RhLH | ||||
| Ongoing pregnancy/live birth rate per woman | 371 per 1000 | 359 per 1000 | OR 0.95 | 289 | ⊕⊝⊝⊝ |
| OHSS per woman ‐ Moderate OHSS | 126 per 1000 | 107 per 1000 | OR 0.83 | 289 | ⊕⊝⊝⊝ |
| Clinical pregnancy rate per woman | 407 per 1000 | 392 per 1000 | OR 0.94 | 289 | ⊕⊝⊝⊝ |
| Miscarriage rate per woman | 36 per 1000 | 34 per 1000 | OR 0.95 | 280 | ⊕⊝⊝⊝ |
| Adverse events per woman | 1 study reported this outcome in this comparison; event numbers were similar in both groups. | 259 | — | ||
| *The basis for the assumed risk (e.g. the median control group risk across studies) is provided in footnotes. The corresponding risk (and its 95% confidence interval) is based on the assumed risk in the comparison group and the relative effect of the intervention (and its 95% CI). | |||||
| GRADE Working Group grades of evidence | |||||
| aThe pooled effect included both the line of no effect and appreciable benefit or harm. | |||||
Background
Description of the condition
A luteinising hormone (LH) surge is essential in the final stages of oocyte maturation and to trigger follicle rupture, which expels the oocyte from the follicle and precipitates its capture by the fallopian tube. In addition, the LH surge promotes luteinisation, or the formation of an active corpus luteum. These effects of LH are essential in order for conception to occur in both natural and IVF cycles.
Description of the intervention
In assisted conception, human chorionic gonadotrophin (hCG) from urine has traditionally been used to trigger final oocyte maturation. There are considerable structural similarities between hCG and human LH (hLH), and both hormones stimulate the same receptor (Fatemi 2012; Leao 2014; Pierce 1981). HCG is readily available in the urine of pregnant women, whereas only low concentrations of LH are found in the urine of postmenopausal women.
Urinary preparations are, however, associated with a number of disadvantages that include being an uncontrolled source, lack of purity, and batch‐to‐batch variation in activity leading to variable clinical results (Leao 2014; Zegers‐Hochschild 1996). In addition, administration of hCG leads to a higher and more prolonged biological signal than one induced by natural LH. Evidence suggests that this could be a possible contributing factor to the development of ovarian hyperstimulation syndrome (Emperaire 1991, Fatemi 2012; Nastri 2015).
Recombinant hCG (rhCG) and recombinant LH (rLH) preparations are derived from genetically engineered Chinese hamster ovary cells through recombinant DNA technology. The production process begins after growth and expression of the cells from a well‐characterised cell bank. The hCG is secreted into the culture medium and harvested over 30 days. The product is purified by repeated chromatographic steps to yield a product with a high specific activity. The high purity of this product facilitates characterisation and quantitation by physicochemical means, thus reducing the need for animal bioassays. This makes the drug suitable for subcutaneous injection and hence self administration (Chang 2001, Fatemi 2012; Leao 2014).
The pharmacokinetic profile of rhCG is comparable to that of uhCG with linearity over a dose range of 500 IU to 20,000 IU and a terminal elimination half life of approximately 30 h (Trinchard‐Lugan 2002).
Moderate or severe OHSS affects about 3% to 10% of all ART cycles (Nastri 2015). OHSS is characterised by growth of multiple, large follicles with a massive extravascular protein rich fluid shift. This may cause serious complications related to hypovolaemia, haemoconcentration, oliguria, and electrolyte disturbance (Aboulghar 1998).
How the intervention might work
In assisted conception, both urinary human chorionic gonadotrophin (hCG) and recombinant preparations trigger final oocyte maturation by mimicking the endogenous LH surge by reinitiating and completing the first meiotic division from the germinal vesicle stage (prophase) to metaphase II, prompting an accompanying cytoplasmic maturation for fertilisation and early embryonic development (Cha 1998).
Why it is important to do this review
We wanted to assess the safety and efficacy of recombinant hCG and recombinant LH compared to urinary hCG (whose use is well established) for induction of final oocyte maturation and luteinisation in women undergoing IVF and ICSI cycles.
Objectives
To assess the effects of subcutaneous rhCG and high dose rLH versus uhCG for inducing final oocyte maturation in subfertile women undergoing IVF and ICSI cycles.
Methods
Criteria for considering studies for this review
Types of studies
We included randomised controlled trials (RCTs). We excluded non‐randomised studies as they are associated with a high risk of bias.
Types of participants
Subfertile couples undergoing final oocyte maturation triggering as part of IVF or ICSI cycles using either recombinant human chorionic gonadotrophin (rhCG) or a recombinant LH (rLH) preparation versus urinary human chorionic gonadotrophin (uhCG).
Types of interventions
Recombinant human chorionic gonadotrophin (rhCG) or recombinant LH preparation (rLH) versus urinary human chorionic gonadotrophin (uhCG) for final oocyte maturation triggering.
Types of outcome measures
Primary outcomes
-
Live birth rate per woman randomised (defined as the number of deliveries that resulted in a live birth). If studies did not report live birth rates, then we used the ongoing pregnancy rate per woman or per couple (defined as pregnancy beyond 12 weeks gestation)
-
Incidence of ovarian hyperstimulation syndrome (OHSS) per woman randomised, or cancelled cycles as a result of high perceived risk of OHSS (as detected by clinical grading of OHSS, laboratory investigations such as haematocrit, haemoglobin, renal function, and imaging techniques such as ovarian and abdominal ultrasound or chest X‐ray)
Secondary outcomes
-
Clinical pregnancy rate per woman randomised. Clinical pregnancy was defined by: foetal heart activity on ultrasound assessment, trophoblastic tissue on pathologic examination at time of miscarriage or surgery for ectopic pregnancy
-
Miscarriage rate per woman randomised (defined as a clinical pregnancy that ended in pregnancy loss prior to 20 weeks gestation)
-
Number of oocytes retrieved per woman randomised
-
Treatment‐related side effects (e.g. injection site reaction)
Search methods for identification of studies
We looked for all published and unpublished RCTs of rhCG or rLH versus uhCG for final oocyte maturation triggering using the search strategies described below and in the appendices, without language restriction and in consultation with the Menstrual Disorders and Subfertility Group (MDSG) Trials Search Co‐ordinator.
Electronic searches
We searched the following databases in consultation with the Gynaecology and Fertility Group (CGF) Trials Search Coordinator.
-
Cochrane Menstrual Disorders and Subfertility Group Specialised Register (inception to April 2015): Appendix 1.
-
Central Register of Controlled Trials (CENTRAL) (2015, Issue 3): Appendix 2.
-
MEDLINE (1946 to April 2015): Appendix 3.
-
EMBASE (1980 to April 2015): Appendix 4.
-
PsycINFO (1906 to April 2015): Appendix 5.
-
Trial registers for ongoing and registered trials
-
ClinicalTrials.gov (inception to April 2015): Appendix 6.
-
The World Health Organization International Clinical Trials Registry Platform search portal, http://apps.who.int/trialsearch/ (inception to April 2015): Appendix 7.
-
-
Citation indexes and conference abstracts on the ISI Web of Knowledge, http://wokinfo.com/ (inception to April 2015).
-
PubMed, www.ncbi.nlm.nih.gov/pubmed/ (inception to April 2015).
For MEDLINE and EMBASE, we used search strategies with different filters for identifying randomised trials. We combined the MEDLINE search with the Cochrane highly sensitive search strategy for identifying randomised trials, as described in section 6.4.11 of the Cochrane Handbook for Systematic Reviews of Interventions (Higgins 2011). We combined the EMBASE and CINAHL searches with trial filters developed by the Scottish Intercollegiate Guidelines Network (SIGN) (www.sign.ac.uk/methodology/filters.html#random).
Searching other resources
We searched the reference lists of all known primary studies, review articles, citation lists of relevant publications, abstracts of major scientific meetings (for example the European Society of Human Reproduction and Embryology, ESHRE, and the American Society for Reproductive Medicine, ASRM).
We contacted experts and other professionals from our personal networks regarding any unpublished material, and we also reached out to pharmaceutical manufacturers to enquire about unpublished trials. When important information was lacking from the original publications, we followed up by contacting the authors or pharmaceutical companies.
Data collection and analysis
Selection of studies
Two review authors (MY, WSL) were responsible for selecting studies, and a third author (MA or HA) helped to resolve disagreements. We first reviewed the titles and abstracts of studies using pre‐specified criteria for inclusion. We obtained the full texts of studies for the records considered potentially eligible for inclusion. We contacted authors when papers contained insufficient information to make a decision about eligibility (Abdelmassih 2005; Farrag 2008; Kovacs 2008; Manau 2002; Study 21447). Subsequently, we constructed a detailed Characteristics of excluded studies table for those studies that did not satisfy the inclusion criteria. We also created a similar Characteristics of included studies table for studies considered suitable for inclusion. We documented the selection process with a PRISMA flow chart (Figure 1).
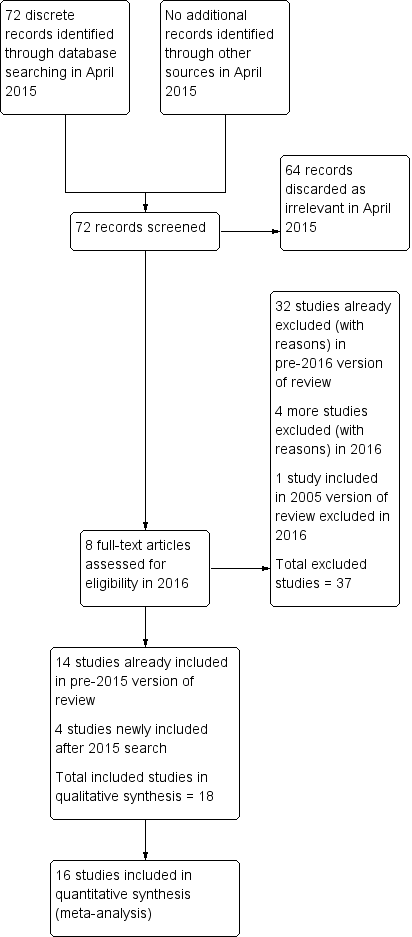
Study flow diagram.
Data extraction and management
We developed and piloted a standardised data extraction form for consistency and completeness. Two review authors (MY, WSL) independently extracted data and then compared the two sets of extracted data in order to resolve discrepancies. Where studies had multiple publications, we collated reports of the same study, so that each study rather than each report was the unit of interest in the review. These studies have a single study ID with multiple references. When required, we requested additional information about the methodological quality of studies from study authors. We received some data about methodology and clinical outcomes from the authors of the following studies: Kovacs 2008, Madani 2013, Manau 2002, and Study 21447.
Assessment of risk of bias in included studies
Two review authors (MY, WSL) independently assessed the included studies for risk of bias using the Cochrane 'Risk of bias' assessment tool (Higgins 2011). This tool assessed: allocation (random sequence generation and allocation concealment); blinding of participants, personnel and outcome assessors; incomplete outcome data; selective reporting; and other bias. We assigned a 'low', 'high' or 'unclear' risk to each domain and for every study. Below, we discuss the conditions necessary to merit a low risk assessment; when studies reported methods that differed meaningfully from these criteria, we assigned a high risk for that domain. When studies did not describe their methods in enough detail to permit a judgement, we assigned an unclear risk. We resolved disagreements by discussion and, when necessary, by arbitration from a third review author. We described all judgements fully and have presented the conclusions in the 'Risk of bias' table (Characteristics of included studies).The risks of bias were incorporated into the interpretation of the review findings by means of sensitivity analyses (Sensitivity analysis).
Sequence generation
We allocated a low risk of bias if the investigators described a random component in the sequence generation such as:
-
using a computerised random number generator;
-
using a random numbers table.
Allocation concealment
We allocated a low risk of bias if the participants and investigators enrolling participants could not foresee assignment because one of the following, or an equivalent method, was used to conceal allocation:
-
central computer randomisation;
-
serially numbered, sealed opaque envelopes.
Blinding
We allocated a low risk of bias if investigators ensured blinding of participants, scientists and clinicians or nurses.
Completeness of outcome data
We allocated a low risk of bias if there were no missing data and investigators carried out an intention‐to‐treat analysis.
Selective outcome reporting
We assessed within‐trial selective reporting, for example trials failing to report obvious outcomes, or reporting them in insufficient detail to allow inclusion. We sought published protocols and compared outcomes of the protocol with the final published study. Where identified studies failed to report the primary outcome of live birth, but reported interim outcomes such as pregnancy, we informally assessed whether the interim values (e.g. pregnancy rates) were similar to those reported in studies that also reported live birth, as a discrepancy might be indicative of selective outcome reporting.
We allocated a low risk of bias if the study pre‐specified all primary, secondary, and additional outcomes of interest to the review. We considered that reporting fewer outcome measures than planned to be a source of bias.
Other potential sources of bias
We considered baseline equality and use of randomisation before starting fertility treatment, as this can lead to participant loss.
Measures of treatment effect
For dichotomous data, we generated 2 x 2 tables for each trial and expressed the measure of effect as a Mantel‐Haenszel odds ratio (OR) with 95% confidence interval (CI). For continuous data, we calculated the mean difference (MD) between groups for all outcomes.
Unit of analysis issues
The primary analysis was per woman randomised (for example, ongoing pregnancy rate per randomised woman: defined as the number of women who were pregnant for more than 12 weeks divided by the number of women who received the intervention). We counted multiple live births (e.g. twins or triplets) as one live birth event.
Dealing with missing data
Where data were missing, we planned to impute individual values for the primary outcome only. We assumed that live births did not occur in participants without a reported outcome. For other outcomes, we only analysed the available data. We planned to subject any imputation to a sensitivity analysis (Sensitivity analysis).
Assessment of heterogeneity
We considered whether the clinical and methodological characteristics of the included studies were sufficiently similar for meta‐analysis to provide a clinically meaningful summary. We assessed statistical heterogeneity using the I2 statistic. We interpreted an I2 value greater than 50% to indicate substantial heterogeneity (Higgins 2003; Higgins 2011). In that case, we planned to explore possible explanations in sensitivity analyses. We took any statistical heterogeneity into account when interpreting the results, especially if there were any variation in the direction of effect.
Assessment of reporting biases
In view of the difficulty of detecting and correcting for publication bias and other reporting biases, the authors aimed to minimise their potential impact by ensuring a comprehensive search for eligible studies and by being alert for duplication of data. If there were 10 or more studies in an analysis, we planned to use a funnel plot to explore the possibility of small study effects (a tendency for estimates of the intervention effect to be more beneficial in smaller studies).
Data synthesis
We combined the data from primary studies using the fixed‐effect model in the following comparisons.
-
Recombinant human chorionic gonadotrophin (rhCG) versus urinary human chorionic gonadotrophin (uhCG).
-
Recombinant human luteinising hormone (hLH) versus urinary human chorionic gonadotrophin (uhCG).
We stratified OHSS into four different severity subgroups: moderate to severe, moderate, mild to moderate, and undefined.
We combined odds ratios (OR) for meta‐analysis with Review Manager (RevMan) 5 software using the Peto‐modified Mantel‐Haenszel method (RevMan 2014). Where possible, we extracted data to allow for an intention‐to‐treat analysis, defined as including all randomised participants in the denominator.
In the graphical display of the meta‐analyses, we considered rhCG to be the experimental treatment. An increase in the odds of an outcome with rhCG is displayed graphically to the right of the centre line. For an outcome such as pregnancy, an increase in odds is considered a benefit of the intervention, thus a benefit would be displayed to the right of the centre line. For an outcome such as OHSS, an increase in the odds is a detrimental effect of the intervention, and this is also displayed to the right of the centre line. Readers should keep this in mind when examining the summary graphs to assess the relative beneficial and detrimental effects of each intervention.
Subgroup analysis and investigation of heterogeneity
We planned to conduct subgroup analyses according to the IVF protocol utilised.
-
Long gonadotrophin‐releasing hormone (GnRH) agonist protocol.
-
GnRH antagonist protocol.
If we detected substantial heterogeneity, we planned to use subgroup analyses to explore any clinical differences between the studies. We planned to take any substantial statistical heterogeneity into account when interpreting the results, especially if there were any variation in the direction of effect.
Sensitivity analysis
We conducted sensitivity analyses for the primary outcomes to determine whether the conclusions were robust to arbitrary decisions made regarding eligibility and analysis. These analyses included consideration of whether conclusions would have differed if we had:
-
excluded studies at high risk of bias;
-
adopted a random‐effects model;
-
used alternative imputation strategies.
Summary of findings table
We prepared 'Summary of findings' tables using GRADEpro software (GRADEpro). This allows evaluation of the overall quality of the body of evidence for the main review outcomes (live birth rate/ongoing pregnancy rate, OHSS rate, miscarriage, adverse effects), using GRADE criteria. These consider study limitations (i.e. risk of bias), consistency of effect, imprecision, indirectness and publication bias. We justified and documented our judgements about evidence quality (high, moderate or low) and incorporated them into reporting of results for each outcome.
Results
Description of studies
Results of the search
Searches prior to 2015
Prior to the searches in 2015, we identified and critically appraised 52 studies that used rhCG or rLH to trigger final oocyte maturation. We included 14 studies and excluded 38.
April 2015 searches
We retrieved 72 discrete articles during the search in April 2015. After screening, we discarded 64 as clearly irrelevant. We assessed the full text of the other eight articles, finally including and excluding four each.
This update of the review therefore includes 18 eligible studies in total. We excluded 36 studies (Excluded studies).
See Figure 1 for the PRISMA flow chart.
Included studies
Study characteristics
We included 18 parallel‐group RCTs involving 2952 randomised women: 15 RCTs compared rhCG with uhCG (N = 2473), and 3 compared rLH with uhCG (N = 479). Details of each study are provided in Characteristics of included studies. Publication dates ranged from 2000 to 2013, and sample size varied between 30 in Manau 2002 to 310 in Schoolcraft 2002.
Twelve trials were published as full papers (Abdelmassih 2005; Bellavia 2013; Chang 2001; Driscoll 2000; Eftekhar 2012; ERHCG Group 2000; ERLH Group 2001; Farrag 2008; Kovacs 2008; Madani 2013; Manau 2002; Papanikolaou 2010). One study was unpublished (Study 21447), and five studies appeared as abstracts (Borges 2004; Goswami 2007; Jie 2005; Schoolcraft 2002; Vidal 2005).
Seven trials were multicentre trials (Bellavia 2013; ERHCG Group 2000; ERLH Group 2001; Chang 2001; Driscoll 2000; Jie 2005; Study 21447), while 11 trials took place in a single centre (Abdelmassih 2005; Borges 2004; Eftekhar 2012; Farrag 2008; Goswami 2007; Kovacs 2008; Madani 2013; Manau 2002; Papanikolaou 2010; Schoolcraft 2002; Vidal 2005).
All trials were designed as non‐inferiority trials to show that the efficacy of recombinant drug is not clinically inferior to the current care, which is urinary gonadotrophins.
Pharmaceutical companies funded nine studies (Abdelmassih 2005; Bellavia 2013; Chang 2001; Driscoll 2000; ERHCG Group 2000; ERLH Group 2001; Jie 2005; Manau 2002; Study 21447). Investigators reported four studies as being free of commercial funding (Borges 2004; Goswami 2007; Kovacs 2008; Vidal 2005). The other studies did not report funding sources clearly.
Six studies reported performing an a priori power calculation to determine sample size (Bellavia 2013; Chang 2001; Driscoll 2000; ERHCG Group 2000; Madani 2013; Papanikolaou 2010). Three studies did not describe any sample size calculation (Abdelmassih 2005; Borges 2004; Kovacs 2008), and the rest made no clear statement in that respect.
Participants
All trials included healthy female partners from subfertile couples, and the inclusion and exclusion criteria were very similar. The main common inclusion criteria were: aged 18 to 45 years, regular menstrual cycles ranging from 24 to 35 days, follicle stimulating hormone (FSH) < 12 IU/L during the early follicular phase, and no prior history of OHSS. All trials involved IVF and ICSI cycles (see Characteristics of included studies).
The categories of infertility usually included tubal disease, endometriosis, unexplained infertility and male factor infertility.
One study included donor women (Vidal 2005).
Heterogeneity could stem from differences between the studies in ICSI use, means of GnRH agonist administration (nasal or by injection), and reason for infertility. However, subgroup analysis comparing the outcomes within the various categories of subfertility was not possible because sufficiently detailed data were not available.
Interventions
All trials performed pituitary down regulation using a long protocol of GnRH agonist administration, except Papanikolaou 2010, which used a GnRH antagonist protocol. GnRH agonist was started in the mid‐luteal phase (cycle day 21 to 24) by either daily intranasal or subcutaneous administration, except in Madani 2013 where GnRH agonist was started on cycle day 17 to 19. Ovarian stimulation was started after two weeks if pituitary down regulation was established (serum estradiol level < 50 pg/mL). Both treatment groups started ovarian stimulation with a daily dose of 75 to 450 IU recombinant FSH (follitrophin alpha, or Gonal‐f Serono) or highly purified FSH for the first five stimulation days. Thereafter, physicians adapted the dose of gonadotrophin to the ovarian response as monitored via ultrasonography.
Nine trials used recombinant FSH (follitrophin alpha) (Abdelmassih 2005; Borges 2004; Driscoll 2000; Eftekhar 2012; ERHCG Group 2000; Jie 2005; Madani 2013; Manau 2002; Papanikolaou 2010). Two trials used highly purified FSH (Bellavia 2013; Chang 2001), and it was unclear what type of rFSH was used in six trials (Farrag 2008; Goswami 2007; Kovacs 2008; Schoolcraft 2002; Study 21447; Vidal 2005).
Fifteen trials used rhCG (Abdelmassih 2005; Bellavia 2013; Borges 2004; Chang 2001; Driscoll 2000; Eftekhar 2012; ERHCG Group 2000; Farrag 2008; Goswami 2007; Jie 2005; Kovacs 2008; Madani 2013; Papanikolaou 2010; Schoolcraft 2002; Vidal 2005), and three trials used rhLH (ERLH Group 2001; Manau 2002; Study 21447).
Women were randomised to receive either 250 µg rhCG or 10,000 IU uhCG in Abdelmassih 2005, Bellavia 2013, Borges 2004, Chang 2001, Eftekhar 2012, Farrag 2008, Goswami 2007, Jie 2005, Madani 2013, Papanikolaou 2010, Schoolcraft 2002 and Vidal 2005; 7500 IU in Kovacs 2008; or 5000 IU in Driscoll 2000, ERHCG Group 2000, ERLH Group 2001 and Manau 2002. It was unclear what dose was used in Study 21447.
The urinary hCG used was Profasi in Abdelmassih 2005,Borges 2004,Chang 2001, Driscoll 2000, ERHCG Group 2000, and Manau 2002; Choriomon in Bellavia 2013 and Madani 2013; Pregnyl in Eftekhar 2012 and Papanikolaou 2010; and Choragon in Farrag 2008. It was unclear what three trials used (Kovacs 2008; Study 21447; Vidal 2005). The rhCG used in Abdelmassih 2005, Bellavia 2013, Borges 2004, Chang 2001, Driscoll 2000, Eftekhar 2012, ERHCG Group 2000, Jie 2005 and Schoolcraft 2002 was Ovidrel, while Madani 2013 and Papanikolaou 2010 used Ovitrelle. It was unclear what the other studies used.
All trials performed oocyte pick‐up 30 to 38 hours after triggering, followed by IVF or ICSI, with no more than three embryos being replaced two to five days thereafter.
Participants started luteal‐phase support no later than the day after embryo transfer, as per the clinic's routine practice.
Physicians performed a pregnancy test 15 to 21 days after hCG if no menstruation had occurred, then ultrasound was done on day 42.
There was no indication of co‐intervention in any of the trials (i.e. no study used a combination of uhCG + rhCG or rhLH).
Outcomes
Three studies reported live birth rate (Bellavia 2013; Chang 2001; Papanikolaou 2010), and six reported ongoing pregnancy (Abdelmassih 2005; Driscoll 2000; ERHCG Group 2000; ERLH Group 2001; Manau 2002; Schoolcraft 2002).
Ten studies reported incidence of ovarian hyperstimulation syndrome (OHSS), with three studies reporting moderate to severe OHSS (Bellavia 2013; Chang 2001; Driscoll 2000), three studies reporting moderate OHSS (ERLH Group 2001; Goswami 2007; Manau 2002), two studies reporting mild to moderate OHSS (Eftekhar 2012; Madani 2013), and three studies reporting undefined OHSS (Chang 2001; ERHCG Group 2000; Papanikolaou 2010).
Fourteen trials reported clinical pregnancy rates for rhCG versus uhCG (Abdelmassih 2005; Bellavia 2013; Borges 2004; Chang 2001; Driscoll 2000; Eftekhar 2012; ERHCG Group 2000; Farrag 2008; Goswami 2007; Jie 2005; Kovacs 2008; Madani 2013; Papanikolaou 2010; Vidal 2005) and two studies for rhLH versus uhCG (ERLH Group 2001; Manau 2002).
Nine trials reported the miscarriage rate for rhCG versus uhCG (Abdelmassih 2005; Borges 2004; Chang 2001; Driscoll 2000; Eftekhar 2012; ERHCG Group 2000; Farrag 2008; Jie 2005; Papanikolaou 2010) and two studies for rhLH versus uhCG (ERLH Group 2001; Manau 2002).
Thirteen studies reported the number of oocytes retrieved for rhCG versus uhCG (Bellavia 2013; Borges 2004; Chang 2001; Driscoll 2000; Eftekhar 2012; ERHCG Group 2000; ERLH Group 2001; Farrag 2008; Jie 2005; Kovacs 2008; Madani 2013; Manau 2002; Papanikolaou 2010; Schoolcraft 2002; Vidal 2005) and two studies for rhLH versus uhCG (ERLH Group 2001; Manau 2002).
Side effects were reported in seven studies: injection site pain, reaction, inflammation, nausea, vomiting, abdominal pain (Abdelmassih 2005; Bellavia 2013; Chang 2001; Driscoll 2000; ERHCG Group 2000; ERLH Group 2001; Vidal 2005). Five studies did not report on adverse events (Borges 2004; Eftekhar 2012; Kovacs 2008; Madani 2013; Papanikolaou 2010), and six studies did not report them clearly (Farrag 2008; Goswami 2007; Jie 2005; Manau 2002; Schoolcraft 2002; Study 21447).
Excluded studies
We excluded 37 studies from the analysis as they did not meet our inclusion criteria. We list our reasons for excluding these studies in Characteristics of excluded studies.
Risk of bias in included studies
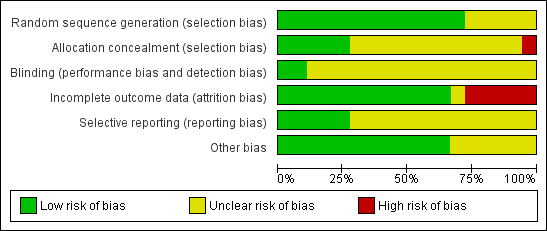
Methodological quality graph: review authors' judgements about each methodological quality item presented as percentages across all included studies.
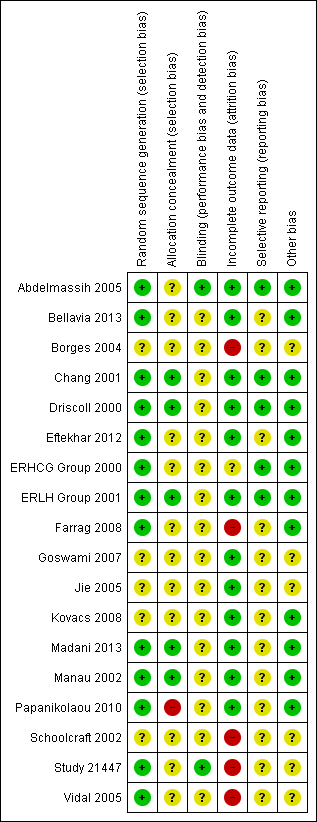
Methodological quality summary: review authors' judgements about each methodological quality item for each included study.
Allocation
Sequence generation
We assigned a low risk of bias for sequence generation to 11 trials that used a computer‐generated randomisation list to allocate participants (Abdelmassih 2005; Bellavia 2013; Chang 2001; Driscoll 2000; Eftekhar 2012; ERHCG Group 2000; ERLH Group 2001; Farrag 2008; Manau 2002; Papanikolaou 2010; Study 21447). We rated two other studies as having a low risk of bias for this domain as well: Madani 2013 used a permuted block method generated by a statistician for randomisation, and Vidal 2005 used a random numbers table. Kovacs 2008 used block randomisation (blocks of 2) for allocation; however, investigators did not report the method of sequence generation, so we rated it as being at an unclear risk of bias. In three trials the participants were randomised, but authors did not report the method of randomisation and so were at unclear risk of this bias (Goswami 2007; Jie 2005; Schoolcraft 2002).
Allocation concealment
Allocation concealment refers to whether the randomisation sequence was adequately concealed from participants, operators and investigators until interventions were assigned. Among the 11 trials that used a central computer to generate randomisation, allocation concealment appeared to be adequate in 5 (Chang 2001; Driscoll 2000; ERLH Group 2001; Manau 2002; Study 21447). We detected a high risk of selection bias related to concealment in Papanikolaou 2010 since there was no concealment. In the remaining trials there was not enough information to determine whether allocation concealment was adequate, hence they were at unclear risk of bias.
Blinding
We did not consider that blinding was likely to influence findings for the primary review outcomes (live birth rate/ongoing pregnancy rate and incidence of OHSS).
Five trials used double blinding (Driscoll 2000; ERHCG Group 2000; ERLH Group 2001; Study 21447; Vidal 2005), and three trials used single blinding: Abdelmassih 2005 for participants, and Bellavia 2013 and Papanikolaou 2010 for investigators. Two trials were open (Chang 2001; Madani 2013), and the remaining trials did not clearly report on blinding (Borges 2004; Eftekhar 2012; Farrag 2008; Goswami 2007; Jie 2005; Kovacs 2008; Manau 2002; Schoolcraft 2002).
Incomplete outcome data
Twelve studies analysed all or most (> 90%) of the women randomised, and we judged them to be at low risk of attrition bias (Abdelmassih 2005; Bellavia 2013; Chang 2001; Driscoll 2000; Eftekhar 2012; ERLH Group 2001; Goswami 2007; Jie 2005; Kovacs 2008; Madani 2013; Manau 2002; Papanikolaou 2010). Five studies were at high risk of attrition bias: studies either did not clearly report the number of women randomised (Borges 2004; Schoolcraft 2002), did not clearly report the number of women analysed (Vidal 2005), or both (Study 21447); in addition, Farrag 2008 only analysed 89% of randomised women. We judged ERHCG Group 2000 to be at unclear risk of bias since randomisation was done before starting fertility treatment.
Six studies performed an intention‐to‐treat analysis (Bellavia 2013; Chang 2001; Driscoll 2000; Kovacs 2008; Manau 2002; Papanikolaou 2010), while six others did not (Abdelmassih 2005; ERHCG Group 2000; ERLH Group 2001; Farrag 2008; Goswami 2007; Jie 2005). The rest of the studies did not specify one way or the other. Borges 2004 performed analyses per cycle, and we could not obtain per woman data. We contacted investigators of the following studies via email for additional information about study methodology and in order to perform analyses on an intention‐to‐treat basis: Abdelmassih 2005, Borges 2004, Farrag 2008, Goswami 2007, Kovacs 2008, Manau 2002 and Study 21447.
In Bellavia 2013, 147 women were randomised. Investigators excluded nine participants due to poor ovarian response, two due to study medication being out of stock and one due to poor estradiol increment. Physicians also withdrew two participants due to risk of OHSS.
Farrag 2008 excluded eight protocol violators in group 1 (rhCG) and three in group 2 (uhCG). Thus, there were 89 women in the overall patient population, with 42 and 47 participants in the rhCG and uhCG groups, respectively.
In Chang 2001, 275 participants were randomised: investigators excluded 16 due to poor ovarian response, and 5 women withdrew before randomisation.
In ERLH Group 2001, 259 participants were enrolled and randomised. Of these, 258 entered the clinical phase of the study and underwent ovarian stimulation treatment, and 250 received rhLH (129 participants) or uhCG (121 participants). Nine participants did not receive rhLH or uhCG treatment: one was discontinued before starting rhFSH treatment because she was found to be pregnant, five presented a risk of OHSS, and three failed to develop a follicle with a mean diameter of at least 17 mm. These participants were equally distributed over the different rhLH groups as well as over the control groups. Of the 250 participants who received rhLH or uhCG treatment, 231 had at least one embryo transferred, and 243 completed the mid‐luteal phase assessment.
In ERHCG Group 2000, 205 participants were randomised to receive rFSH and hCG. Following treatment with rFSH, 190 women received hCG (97 rhCG; 93 uhCG) ('all participants population'). Fifteen participants did not receive hCG. The most common reason for not receiving hCG was poor response to ovarian stimulation (four rhCG; two uhCG). After elimination of major protocol violators, 172 participants who received hCG constituted the 'evaluable participants population' (88 rhCG; 84 uhCG).
Selective reporting
The protocols were not available for all of the studies, but it was clear that the published reports included all expected outcomes, and we considered these studies to be at low risk of bias. Five studies were at a low risk of selective reporting bias because outcome measures were reported in a pre‐specified manner (Abdelmassih 2005; Chang 2001; Driscoll 2000; ERHCG Group 2000; ERLH Group 2001). The remaining studies were at unclear risk of reporting bias even though outcomes were reported as pre‐specified, since they did not report several important outcomes. Nine studies did not clearly report live birth/ongoing pregnancy (Borges 2004; Eftekhar 2012; Farrag 2008; Goswami 2007; Jie 2005; Kovacs 2008; Madani 2013; Study 21447; Vidal 2005), and 12 did not report adverse events (Bellavia 2013; Borges 2004; Eftekhar 2012; Farrag 2008; Goswami 2007; Jie 2005; Kovacs 2008; Madani 2013; Manau 2002; Papanikolaou 2010; Schoolcraft 2002; Study 21447).
Other potential sources of bias
Six studies were at unclear risk of other bias due to lack of detail on the methods and study conduct. Study 21447 was unpublished, and five other studies were only available as abstracts (Borges 2004; Goswami 2007; Jie 2005; Schoolcraft 2002; Vidal 2005).
Effects of interventions
See: Summary of findings for the main comparison RhCG compared to uhCG for final oocyte maturation triggering in IVF and ICSI cycles; Summary of findings 2 RhLH compared to uhCG for final oocyte maturation triggering in IVF and ICSI cycles
1. Recombinant hCG versus urinary hCG
1.1 Ongoing pregnancy/live birth rate per woman randomised
There was no evidence of a difference in live birth rate/ongoing pregnancy rate between the groups (OR 1.15, 95% CI 0.89 to 1.49; 7 RCTs, N = 1136, I2 = 0%, moderate quality evidence) (Analysis 1.1; Figure 4).
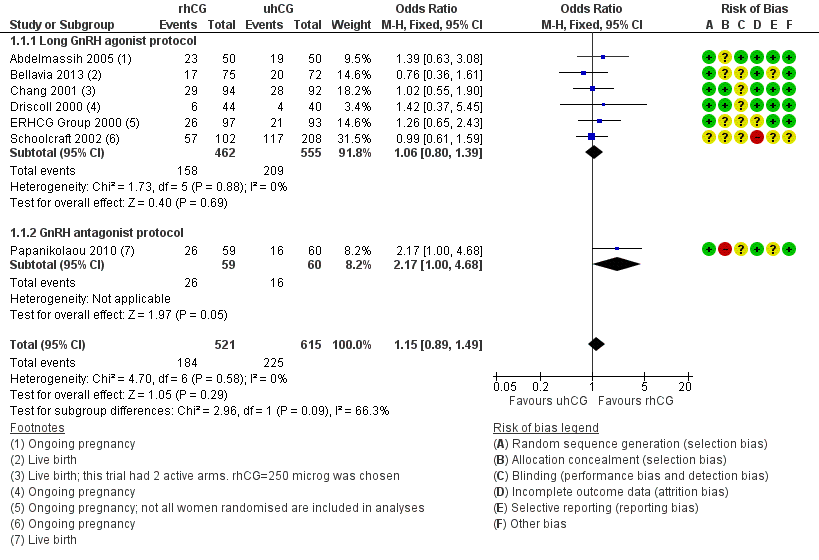
Forest plot of comparison: 1 rhCG versus uhCG for triggering ovulation, outcome: 1.1 Ongoing pregnancy/live birth rate per woman.
1.1.1 Long GnRH agonist protocol
There was no evidence of a difference between the groups with the long GnRH agonist protocol in live birth rate/ongoing pregnancy rates (OR 1.06, 95% CI 0.80 to 1.39; 6 RCTs, N = 1017; I2 = 0%; Analysis 1.1; Figure 4).
1.1.2 GnRH antagonist protocol
Papanikolaou 2010 reported both live birth rate (named as delivery rate in the study) and ongoing pregnancy rate; we reported the data for live birth rate. There was a higher live birth rate in the rhCG group (OR 2.17, 95% CI 1.00 to 4.68, 1 RCT, N = 119; Analysis 1.1; Figure 4).
1.2 Ovarian hyperstimulation syndrome (OHSS) incidence per woman randomised
1.2.1 Moderate to severe OHSS
Pooling the results from three trials showed no evidence of a difference between the groups (OR 1.76, 95% CI 0.37 to 8.45; 3 RCTs, N = 417, I2 = 0%, low quality evidence; Analysis 1.2; Figure 5).

Forest plot of comparison: 1 rhCG versus uhCG for triggering ovulation, outcome: 1.2 OHSS per woman.
1.2.2 Moderate OHSS
One trial reported moderate OHSS (Goswami 2007). There was no evidence of a difference between the groups (OR 0.78, 95% CI 0.27 to 2.27, 1 RCT, N = 243; Analysis 1.2; Figure 5).
1.2.3 Mild to moderate OHSS
Pooling the results from two trials showed no evidence of a difference between the groups (OR 1.00, 95% CI 0.42 to 2.38; 2 RCTs, N = 320, I2 = 0%, low quality evidence; Analysis 1.2; Figure 5).
1.2.4 Undefined OHSS
Pooling the results from three trials showed no evidence of a difference between the groups (OR 1.18, 95% CI 0.50 to 2.78; 3 RCTs, N = 495, I2 = 0%, low quality evidence; Analysis 1.2; Figure 5)
1.3 Clinical pregnancy rates
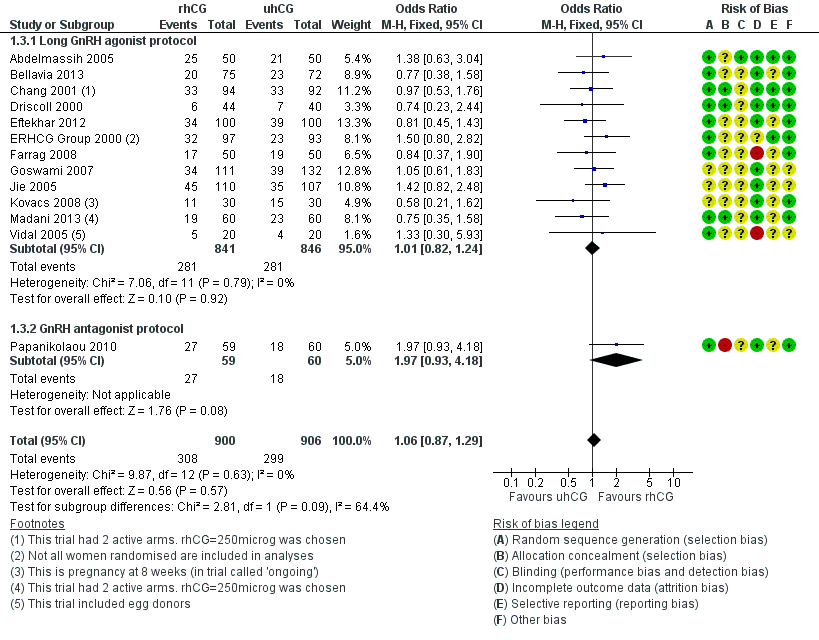
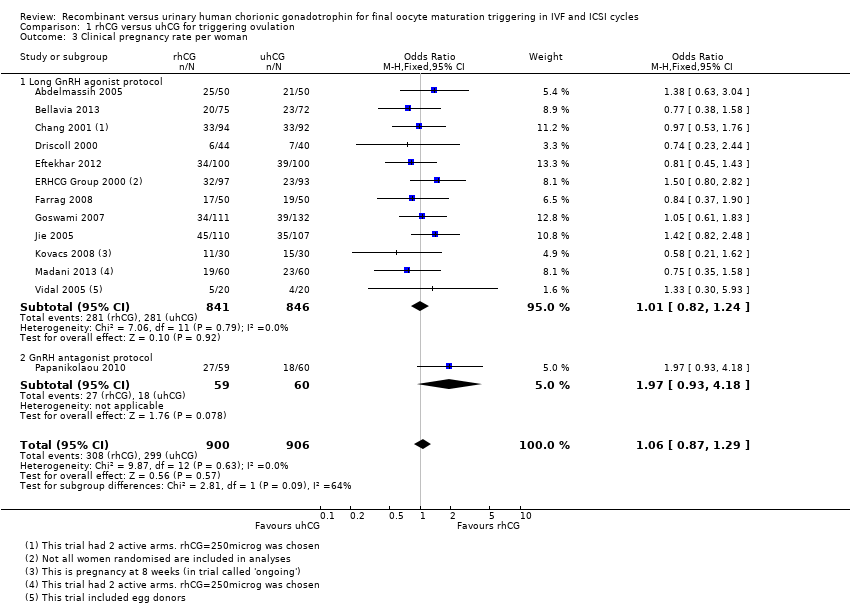
There was no evidence of a difference between the groups in clinical pregnancy rates (OR 1.06, 95% CI 0.87 to 1.29, 13 RCTs, N = 1806, I2 = 0%, moderate quality evidence; Analysis 1.3; Figure 6).

Forest plot of comparison: 1 rhCG versus uhCG for triggering ovulation, outcome: 1.3 Clinical pregnancy rate per woman.
1.3.1 Long GnRH agonist protocol
There was no evidence of a difference between the groups in clinical pregnancy rates (OR 1.01, 95% CI 0.82 to 1.24, 12 RCTs, N = 1687, I2 = 0%; Analysis 1.3; Figure 6).
1.3.2 GnRH antagonist protocol
Papanikolaou 2010 found no evidence of a difference between the groups in clinical pregnancy rates (OR 1.97, 95% CI 0.93 to 4.18, 1 RCT, N = 119; Analysis 1.3; Figure 6). Two women from the uhCG group had clinical pregnancies but not ongoing pregnancies owing to first trimester miscarriage.
1.4 Miscarriage
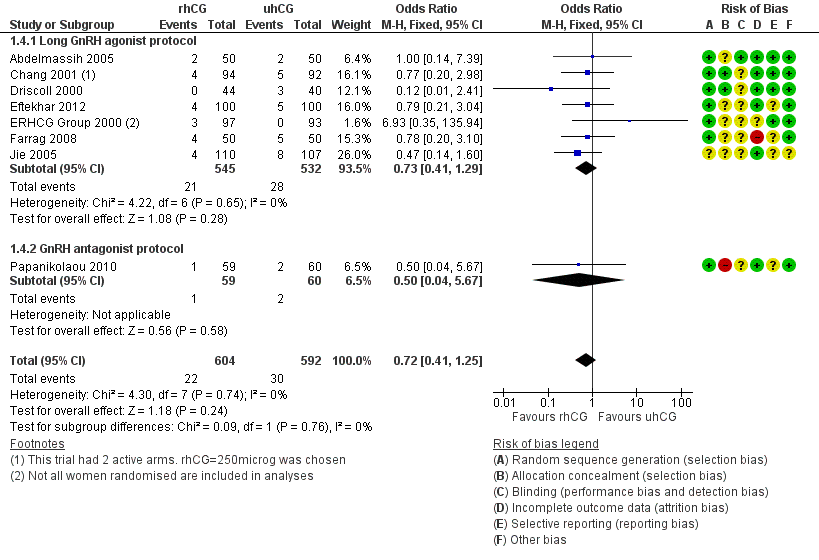
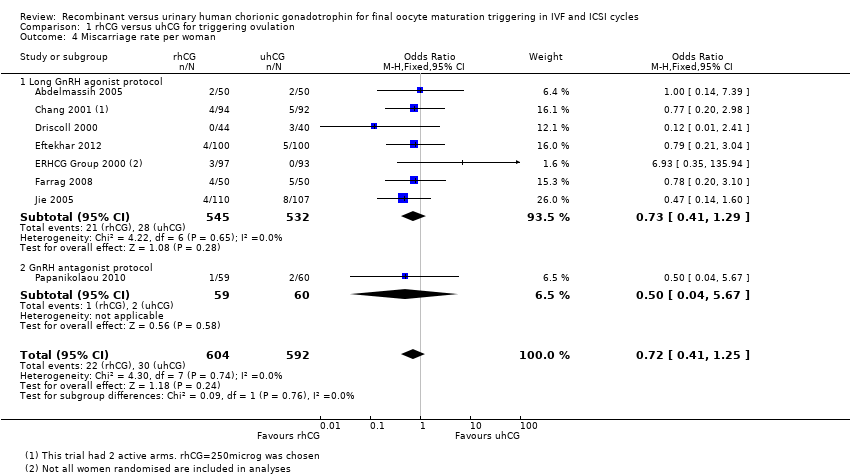
There was no evidence of a difference between the groups in the miscarriage rate (OR 0.72, 95% CI 0.41 to 1.25, 8 RCTs, N = 1196, I2 = 0%, low quality evidence; Analysis 1.4; Figure 7).

Forest plot of comparison: 1 rhCG versus uhCG for triggering ovulation, outcome: 1.4 Miscarriage rate per woman.
1.4.1 Long GnRH agonist protocol
Pooling results from seven trials showed no evidence of a difference in miscarriage rate between groups (OR 0.73, 95% CI 0.41 to 1.29; 7 RCTs; N = 1077; I2 = 0%; Analysis 1.4; Figure 7).
1.4.2 GnRH antagonist protocol
Papanikolaou 2010 found no evidence of a difference between the groups (OR 0.50, 95% CI 0.04 to 5.67, one RCT, N = 119; Analysis 1.4; Figure 7).
1.5 Number of oocytes
Pooling the results from 12 trials showed no evidence of a difference between the groups in number of retrieved oocytes (MD −0.11, 95% CI −0.70 to 0.47, 12 RCTs, N = 1744, I2 = 0%; Analysis 1.5).
1.5.1 Long GnRH agonist protocol
Pooling the results from 11 studies showed no evidence of a difference between the groups (MD −0.14, 95% CI −0.73 to 0.45, 11 RCTs; N = 1625; I2 = 0%; Analysis 1.5).
1.5.2 GnRH antagonist protocol
Papanikolaou 2010 found no evidence of a difference between the groups (MD 1.20, 95% CI −3.14 to 5.54, 1 RCT, N = 119; Analysis 1.5).
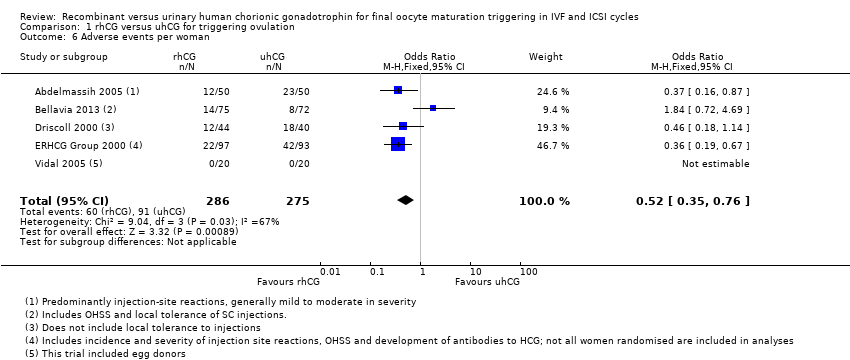
1.6 Adverse events
RhCG was associated with a lower number of adverse events than uhCG (OR 0.52, 95% CI 0.35 to 0.76; 5 RCTS, N = 561; I2 = 67%, moderate quality evidence; Analysis 1.6). The most commonly reported event was injection site reaction.
However, when we used a random‐effects model due to substantial statistical heterogeneity, there was no evidence of a difference between the groups (OR 0.56, 95% CI 0.27 to 1.13; 5 RCTs, N = 561, I2 = 67%; Analysis 1.6).
One trial recorded 12/44 mild or moderate adverse events (such as pain at the injection site) in the rhCG group compared to 17/40 in the uhCG group (Driscoll 2000). In another trial 22/97 women receiving rhCG reported adverse events compared to 42/93 in the uhCG group (ERHCG Group 2000). In a third trial 23% of women receiving rhCG reported adverse events compared to 45% in the uhCG group (Abdelmassih 2005).
Chang 2001, an open RCT, reported no evidence of a difference between drugs in terms of tolerability of the injections. Adverse events were reported by 46.3%, 57.3% and 38.5% of women in the 250 µg rhCG, 500 µg rhCG and 200 µg uhCG groups, respectively. Bellavia 2013 reported no evidence of differences in adverse events or reaction at the injection site between drugs. Adverse events were rare at 11.1% and 18.7% in the highly purified hCG and rhCG groups, respectively. Jie 2005 and Kovacs 2008 reported that the safety was good. Vidal 2005 reported that there were no adverse events for either drug group.
2. Recombinant hLH versus urinary hCG
2.1 Ongoing pregnancy/live birth rate
Pooling the data of the ongoing pregnancy/live birth rate from the two trials with available data showed no evidence of a difference between the groups (OR 0.95, 95% CI 0.51 to 1.78; 2 RCTs, N = 289, I2 = 0%, very low quality evidence; Analysis 2.1; Figure 8).
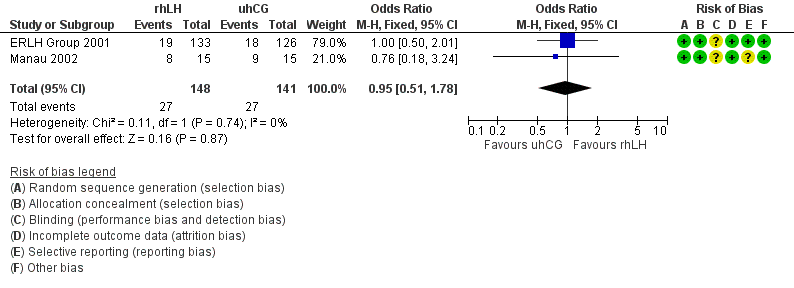
Forest plot of comparison: 2 rhLH versus uhCG for triggering ovulation, outcome: 2.1 Ongoing pregnancy/live birth rate per woman.
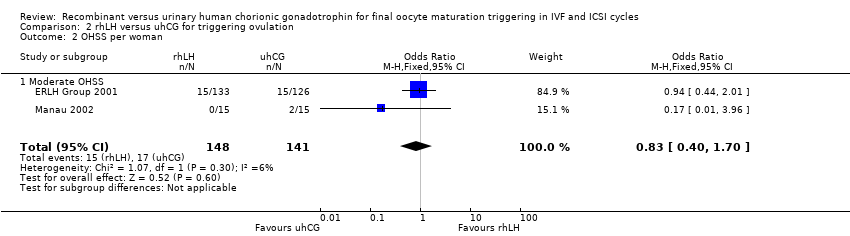
2.2 Moderate ovarian hyperstimulation syndrome (OHSS) incidence per woman randomised
Pooling the results from the two trials with available data showed no evidence of a difference between the groups (OR 0.83, 95% CI 0.40 to 1.70; 2 RCTs, N = 289, I2 = 6%, very low quality evidence; Analysis 2.2; Figure 9).

Forest plot of comparison: 2 rhLH versus uhCG for triggering ovulation, outcome: 2.2 OHSS per woman.
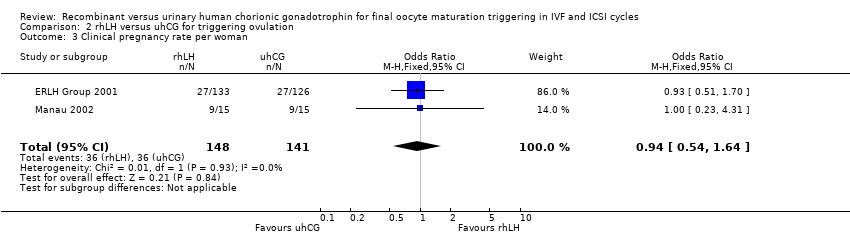
2.3 Clinical pregnancy rate
Pooling the results from the two trials with available data showed no evidence of a difference between the groups (OR 0.94, 95% CI 0.54 to 1.64; 2 RCTs, N = 2890, I2 = 0%, very low quality evidence; Analysis 2.3).
One of the studies comparing rhLH and uhCG reported that pregnancy rates and clinical pregnancy rates were significantly lower in the rhLH group than in the uhCG group (P = 0.018 and P = 0.023, respectively) (Study 21447). We received this information from the pharmaceutical company that was conducting the trial after contacting them for additional data.
2.4 Miscarriage
Pooling the results from the two trials with available data showed no evidence of a difference between the groups (OR 0.95, 95% CI 0.38 to 2.40; 2 RCTs, N = 289, I2 = 0%, very low quality evidence; Analysis 2.4).
2.5 Number of oocytes
Two studies reported the number of oocytes retrieved.
The number of retrieved oocytes was 10.23 ± 4.70 versus 11.74 ± 6.27 in participants receiving 5000 IU of rLH versus uhCG; 11.84 ± 7.53 versus 11.78 ± 6.75 in participants receiving 15,000 IU of rLH versus uhCG; and 12.62 ± 6.22 versus 10.82 ± 5.70 in participants receiving 30,000 IU of rLH versus uhCG (ERLH Group 2001). The mean number of oocytes retrieved was 11.56 in the rhCG group and 11.44 in the uhCG group.
The number of oocytes was 10.2 ± 4.64 in the uhCG group versus 9.1± 3.4 in the rLH group (Manau 2002).
Pooling the results of the arm using 5000 IU of rLH in ERLH Group 2001 with Manau 2002 showed no evidence of a difference between the groups (MD −1.33, 95% CI −3.26 to 0.60; 2 RCTs, N = 103, I2 = 0%, very low quality evidence; Analysis 2.5).
2.6 Adverse events
One trial reported tolerability (ERLH Group 2001). The most frequent non‐serious adverse events were abdominal enlargement (n = 29), abdominal pain (n = 19), injection site pain (n = 14), diarrhoea (n = 10), and nausea (n = 7). There was no evidence of a difference between the groups: over the trial, 158 events occurred in 71 women treated with rhLH (55%) and 171 events in 77 women treated with uhCG (63.6%) (OR 0.73, 95% CI 0.44 to 1.19; Analysis 2.6).
Three serious adverse events (excluding OHSS) requiring hospitalisation occurred in the uhCG treatment group: back pain, missed abortion and an ectopic pregnancy. In the rhLH group, six women experienced serious adverse events requiring hospitalisation: retention of foetal placenta, abdominal pain, suspected ovarian torsion, diarrhoea (two women), and pre‐eclampsia.
Discussion
Summary of main results
In subfertile women undergoing controlled ovarian hyperstimulation, the use of human chorionic gonadotrophins to trigger final oocyte maturation is well established. Urinary hCG (uhCG) has been used for more than 30 years, but recombinant technology allows for the production of recombinant hCG with high purity and batch‐to‐batch consistency.
This updated review includes 18 randomised controlled trials involving 2952 women.
There was no evidence of a difference between rhCG and uhCG regarding the ongoing pregnancy/live birth rate (moderate quality evidence), clinical pregnancy rate (high quality evidence), miscarriage (low quality evidence), or incidence of OHSS (low quality evidence); rhCG was associated with an increase in the number of retrieved oocytes (high quality evidence) and a reduction in the incidence of local site reactions and other minor adverse effects (moderate quality evidence).
There was no evidence of a difference between rLH and uhCG regarding ongoing pregnancy/live birth rates (very low quality evidence), clinical pregnancy rate (very low quality evidence), miscarriages (very low quality evidence), incidence of OHSS (very low quality evidence) or number of retrieved oocytes (very low quality evidence).
Overall completeness and applicability of evidence
All trials recruited relevant participants (i.e. healthy female partners from subfertile couples) using similar inclusion and exclusion criteria, and all studies involved IVF and ICSI cycles. Only one study included donor women (Vidal 2005). All studies utilised relevant interventions: 14 trials used recombinant hCG, and 3 trials used recombinant LH. All 18 studies used urinary hCG. One study performed the analysis per cycle, and we could not obtain per woman data to enter into meta‐analysis (Borges 2004). For another unpublished study, we had no data to analyse (Study 21447). Although we were able to analyse 16 studies comparing rhCG or rhLH versus uhCG, only 3 studies reported the primary outcome (live birth rate). However, data on the ongoing pregnancy rate were available for six trials providing additional evidence. Ten studies reported OHSS, also providing adequate evidence.
Abdelmassih 2005 reported the mean number of retrieved oocytes, but standard deviations were not available, so those data were not usable for the review. According to the study, there was no evidence of a difference in the mean number of retrieved oocytes between the groups (250 μg rhCG = 15.6 versus 10,000 IU uhCG = 17.3, P > 0.355). Chang 2001 reported adverse events, but the data were not usable since the number of women analysed included women before randomisation, and the data given in percentages might include women who suffered from more than one adverse event.
Quality of the evidence
The present systematic review update included seven randomised controlled trials with more or less similar inclusion and exclusion criteria, design and methodology. All were at unclear or high risk of bias in at least one of the domains assessed (Figure 2; Figure 3). Only 13 of the studies clearly reported using a proper method of random sequence generation, and only 6 trials out of these 13 described use of adequate allocation concealment. Only eight studies were blinded, and only two of these eight were at low risk of performance and detection bias due to proper methods of blinding. Just 6 trials performed sample size calculations, and the analysis was not by intention‐to‐treat in 12 of the included studies. Moreover, there were available data on the live birth rate in three studies only. Outcomes were reported in a pre‐specified manner in 14 studies. Nine trials had received commercial support from pharmaceutical companies.
The patient profiles in the trials included in this systematic review were relatively similar, and the IVF and ICSI procedures used were standard. Moreover, there was no difference in the type of gonadotrophin preparation administered. These factors have eliminated heterogeneity to a large extent, as seen in the graphs.
None of the individual trials demonstrated evidence of a difference in clinical outcomes between recombinant and urinary hCG, especially live birth or ongoing pregnancy rate and OHSS incidence, apart from Papanikolaou 2010, which suggested a better delivery rate in favour of rhCG. However, the authors admitted that adequately powered randomised controlled trials need to confirm whether this difference is true. Pooling the results of these trials showed similar outcomes, except that rhCG was associated with more retrieved oocytes (high quality evidence), and local injection site adverse effects were significantly less frequent with rhCG than with uhCG (moderate quality evidence).
We assessed quality of the evidence for all outcomes for the comparison 'rhCG versus uhCG'. The main limitation we found was imprecision. For ongoing pregnancy/live birth rate, evidence was of moderate quality since the 95% confidence interval around the pooled effect included both the line of no effect and line of appreciable benefit (relative risk reduction (RRR) > 25%). Thus, further research is likely to have an important impact on our confidence in the estimate of effect and may change the estimate. For incidence of OHSS, evidence was of low quality since the total number of events was less than 300 and the 95% confidence interval around the pooled effect included both the line of no effect and line of appreciable benefit (RRR > 25%) and harm (relative risk increase (RRI) > 25%). Thus, further research is very likely to have an important impact on our confidence in the estimate of effect and is likely to change the estimate. Evidence for clinical pregnancy rate and number of oocytes retrieved was of high quality since generally there was no risk of bias, inconsistency, indirectness, imprecision or publication bias identified. Hence, further research is very unlikely to change our confidence in the estimate of effect. Evidence for miscarriage rate was of low quality since the 95% confidence interval around the pooled effect included both the line of no effect and line of appreciable benefit (RRR > 25%), and the total number of events was less than 300. Thus, further research is very likely to have an important impact on our confidence in the estimate of effect and is likely to change the estimate. Evidence of adverse events was of moderate quality since there were less than 300 total events. Therefore, further research is likely to have an important impact on our confidence in the estimate of effect and may change the estimate.
We assessed quality of the evidence for all outcomes for the comparison 'rLH versus uhCG'. The main limitations found were poor reporting of study methods leading to risk of bias and imprecision. Evidence for all outcomes was of very low quality, mainly because there were too few studies. Thus we are very uncertain about the estimates. For all outcomes, we downgraded quality of evidence by two points due to the total number of events being less than 300, and one of the two included studies did not provide information about methods of randomisation, allocation concealment, or blinding. For ongoing pregnancy rate, miscarriage rate and incidence of OHSS, the pooled effect included both the line of no effect and appreciable benefit and harm. For the clinical pregnancy rate, the pooled effect included both the line of no effect and appreciable harm. For number of oocytes retrieved, the total population size was less than 400, and the pooled effect included both the line of no effect and minimal important difference (0.5 pooled standard deviation).
Potential biases in the review process
We identified all relevant studies but were unable to obtain all relevant data because Study 21447 was unpublished. Five other studies only appeared as abstracts, and not all authors responded to requests for additional information (Borges 2004; Goswami 2007; Jie 2005; Schoolcraft 2002; Vidal 2005).
Agreements and disagreements with other studies or reviews
There has been extensive research on the efficacy of rhCG and uhCG in IVF and intracytoplasmic sperm injection (ICSI) procedures (Al‐Inany 2005). Overall, we did not find any differences in these studies between the two drugs with regard to the number of oocytes retrieved and the pregnancy rate. Moreover, the dose of 250 µg rhCG has been shown to provide the optimal dose for final follicular maturation in treatment cycles for IVF/ICSI (Ludwig 2003). Results of one trial showed that increasing the dose of recombinant hCG (single 500 µg dose of rhCG) may lead to a higher rate of ovarian hyperstimulation syndrome compared with a 250 µg dose (this difference was not statistically significant, perhaps due to small sample size, but trial authors interpreted it as being clinically important) with no significant improvement in pregnancy rate. Accordingly, based on efficacy and safety data, the dose of 250 µg of rhCG seems to provide the optimal dose for final follicular maturation in treatment cycles for timed intercourse and intrauterine insemination (IUI), as well as IVF and ICSI.
Results of the two trials comparing rhLH and uhCG showed evidence of a difference in clinical outcomes. Due to the results of the unpublished trial (Study 21447), Serono (the pharmaceutical company producing rhLH) has decided not to register high dose recombinant LH for clinical use. The results of this trial demonstrated to the company that to prevent OHSS, the dose of recombinant drug needed to be increased to a level that resulted in a decrease in the pregnancy rate.
Our results are in agreement with other reviews. The first review included three trials that met the inclusion criteria and involved 460 randomised women (235 allocated to recombinant hCG and 225 to urinary hCG) (Daya 2002). There was no significant heterogeneity of treatment effect across the trials. The primary outcome event of interest was single pregnancy confirmed by ultrasonography. Secondary outcomes were rates of live birth and multiple pregnancy. The overall pregnancy rates were also calculated by crudely aggregating the data. The pooled results on live birth rate were 26.0% (61/235) versus 23.6% (53/225). Another review included three trials and randomised 447 enrolled women (Ludwig 2003). It concluded that a single 250 µg dose of rhCG was at least as effective as single doses of 5000 or 10,000 IU uhCG but offered the advantages associated with use of a recombinant product; local injection site adverse effects were significantly less with rhCG than with uhCG.
Recently, a large retrospective study has been published (Sneeringer 2008). The study enrolled 9328 assisted reproductive technology (ART) cycles and compared the efficacy of rhCG versus uhCG in triggering final oocyte maturation. The total number of oocytes retrieved (10.4 ± 6.7 versus 9.8 ± 6.2), metaphase II oocytes (83.5% versus 82.9%) and 2PN (6.1 ± 4.7 versus 5.8 ± 4.2) and a higher implantation rate (21.3% versus 19.6%) showed statistical differences in favour of rhCG; however, an equivalent clinical pregnancy rate was achieved in both groups.

Study flow diagram.

Methodological quality graph: review authors' judgements about each methodological quality item presented as percentages across all included studies.

Methodological quality summary: review authors' judgements about each methodological quality item for each included study.

Forest plot of comparison: 1 rhCG versus uhCG for triggering ovulation, outcome: 1.1 Ongoing pregnancy/live birth rate per woman.

Forest plot of comparison: 1 rhCG versus uhCG for triggering ovulation, outcome: 1.2 OHSS per woman.
Forest plot of comparison: 1 rhCG versus uhCG for triggering ovulation, outcome: 1.3 Clinical pregnancy rate per woman.
Forest plot of comparison: 1 rhCG versus uhCG for triggering ovulation, outcome: 1.4 Miscarriage rate per woman.

Forest plot of comparison: 2 rhLH versus uhCG for triggering ovulation, outcome: 2.1 Ongoing pregnancy/live birth rate per woman.

Forest plot of comparison: 2 rhLH versus uhCG for triggering ovulation, outcome: 2.2 OHSS per woman.

Comparison 1 rhCG versus uhCG for triggering ovulation, Outcome 1 Ongoing pregnancy/live birth rate per woman.

Comparison 1 rhCG versus uhCG for triggering ovulation, Outcome 2 OHSS per woman.
Comparison 1 rhCG versus uhCG for triggering ovulation, Outcome 3 Clinical pregnancy rate per woman.
Comparison 1 rhCG versus uhCG for triggering ovulation, Outcome 4 Miscarriage rate per woman.

Comparison 1 rhCG versus uhCG for triggering ovulation, Outcome 5 No of oocytes retrieved per woman.
Comparison 1 rhCG versus uhCG for triggering ovulation, Outcome 6 Adverse events per woman.

Comparison 2 rhLH versus uhCG for triggering ovulation, Outcome 1 Ongoing pregnancy/live birth rate per woman.
Comparison 2 rhLH versus uhCG for triggering ovulation, Outcome 2 OHSS per woman.
Comparison 2 rhLH versus uhCG for triggering ovulation, Outcome 3 Clinical pregnancy rate per woman.

Comparison 2 rhLH versus uhCG for triggering ovulation, Outcome 4 Miscarriage rate per woman.
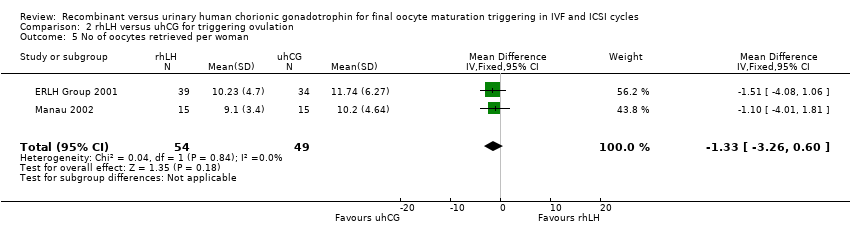
Comparison 2 rhLH versus uhCG for triggering ovulation, Outcome 5 No of oocytes retrieved per woman.

Comparison 2 rhLH versus uhCG for triggering ovulation, Outcome 6 Adverse events per woman.
| RhCG compared to uhCG for final oocyte maturation triggering in IVF and ICSI cycles | ||||||
| Population: women undergoing final oocyte maturation triggering in IVF and ICSI cycles | ||||||
| Outcomes | Illustrative comparative risks* (95% CI) | Relative effect | No of participants | Quality of the evidence | Comments | |
| Assumed risk | Corresponding risk | |||||
| UhCG | RhCG | |||||
| Ongoing pregnancy/live birth rate per woman | 367 per 1000 | 396 per 1000 | OR 1.15 | 1136 | ⊕⊕⊕⊝ | — |
| OHSS per woman ‐ moderate to severe OHSS | 10 per 1000 | 17 per 1000 | OR 1.76 | 417 | ⊕⊕⊝⊝ | — |
| Clinical pregnancy rate per woman | 330 per 1000 | 343 per 1000 | OR 1.06 | 1806 | ⊕⊕⊕⊝ | — |
| Miscarriage rate per woman | 51 per 1000 | 37 per 1000 | OR 0.72 | 1347 | ⊕⊕⊝⊝ | — |
| Adverse events per woman | 331 per 1000 | 179 per 1000 | OR 0.52 | 561 | ⊕⊕⊕⊝ | Adverse events included: injection site pain, reaction, inflammation, nausea, vomiting, abdominal pain |
| *The basis for the assumed risk (e.g. the median control group risk across studies) is provided in footnotes. The corresponding risk (and its 95% confidence interval) is based on the assumed risk in the comparison group and the relative effect of the intervention (and its 95% CI). | ||||||
| GRADE Working Group grades of evidence | ||||||
| aThe pooled effect included both the line of no effect and appreciable benefit or harm. | ||||||
| RhLH compared to uhCG for final oocyte maturation triggering in IVF and ICSI cycles | |||||
| Population: women undergoing final oocyte maturation triggering in IVF and ICSI cycles | |||||
| Outcomes | Illustrative comparative risks* (95% CI) | Relative effect | No of participants | Quality of the evidence | |
| Assumed risk | Corresponding risk | ||||
| UhCG | RhLH | ||||
| Ongoing pregnancy/live birth rate per woman | 371 per 1000 | 359 per 1000 | OR 0.95 | 289 | ⊕⊝⊝⊝ |
| OHSS per woman ‐ Moderate OHSS | 126 per 1000 | 107 per 1000 | OR 0.83 | 289 | ⊕⊝⊝⊝ |
| Clinical pregnancy rate per woman | 407 per 1000 | 392 per 1000 | OR 0.94 | 289 | ⊕⊝⊝⊝ |
| Miscarriage rate per woman | 36 per 1000 | 34 per 1000 | OR 0.95 | 280 | ⊕⊝⊝⊝ |
| Adverse events per woman | 1 study reported this outcome in this comparison; event numbers were similar in both groups. | 259 | — | ||
| *The basis for the assumed risk (e.g. the median control group risk across studies) is provided in footnotes. The corresponding risk (and its 95% confidence interval) is based on the assumed risk in the comparison group and the relative effect of the intervention (and its 95% CI). | |||||
| GRADE Working Group grades of evidence | |||||
| aThe pooled effect included both the line of no effect and appreciable benefit or harm. | |||||
| Outcome or subgroup title | No. of studies | No. of participants | Statistical method | Effect size |
| 1 Ongoing pregnancy/live birth rate per woman Show forest plot | 7 | 1136 | Odds Ratio (M‐H, Fixed, 95% CI) | 1.15 [0.89, 1.49] |
| 1.1 Long GnRH agonist protocol | 6 | 1017 | Odds Ratio (M‐H, Fixed, 95% CI) | 1.06 [0.80, 1.39] |
| 1.2 GnRH antagonist protocol | 1 | 119 | Odds Ratio (M‐H, Fixed, 95% CI) | 2.17 [1.00, 4.68] |
| 2 OHSS per woman Show forest plot | 8 | Odds Ratio (M‐H, Fixed, 95% CI) | Subtotals only | |
| 2.1 Moderate to severe OHSS | 3 | 417 | Odds Ratio (M‐H, Fixed, 95% CI) | 1.76 [0.37, 8.45] |
| 2.2 Moderate OHSS | 1 | 243 | Odds Ratio (M‐H, Fixed, 95% CI) | 0.78 [0.27, 2.27] |
| 2.3 Mild to moderate OHSS | 2 | 320 | Odds Ratio (M‐H, Fixed, 95% CI) | 1.0 [0.42, 2.38] |
| 2.4 Undefined OHSS | 3 | 495 | Odds Ratio (M‐H, Fixed, 95% CI) | 1.18 [0.50, 2.78] |
| 3 Clinical pregnancy rate per woman Show forest plot | 13 | 1806 | Odds Ratio (M‐H, Fixed, 95% CI) | 1.06 [0.87, 1.29] |
| 3.1 Long GnRH agonist protocol | 12 | 1687 | Odds Ratio (M‐H, Fixed, 95% CI) | 1.01 [0.82, 1.24] |
| 3.2 GnRH antagonist protocol | 1 | 119 | Odds Ratio (M‐H, Fixed, 95% CI) | 1.97 [0.93, 4.18] |
| 4 Miscarriage rate per woman Show forest plot | 8 | 1196 | Odds Ratio (M‐H, Fixed, 95% CI) | 0.72 [0.41, 1.25] |
| 4.1 Long GnRH agonist protocol | 7 | 1077 | Odds Ratio (M‐H, Fixed, 95% CI) | 0.73 [0.41, 1.29] |
| 4.2 GnRH antagonist protocol | 1 | 119 | Odds Ratio (M‐H, Fixed, 95% CI) | 0.5 [0.04, 5.67] |
| 5 No of oocytes retrieved per woman Show forest plot | 12 | 1744 | Mean Difference (IV, Fixed, 95% CI) | ‐0.11 [‐0.70, 0.47] |
| 5.1 Long GnRH agonist protocol | 11 | 1625 | Mean Difference (IV, Fixed, 95% CI) | ‐0.14 [‐0.73, 0.45] |
| 5.2 GnRH antagonist protocol | 1 | 119 | Mean Difference (IV, Fixed, 95% CI) | 1.20 [‐3.14, 5.54] |
| 6 Adverse events per woman Show forest plot | 5 | 561 | Odds Ratio (M‐H, Fixed, 95% CI) | 0.52 [0.35, 0.76] |
| Outcome or subgroup title | No. of studies | No. of participants | Statistical method | Effect size |
| 1 Ongoing pregnancy/live birth rate per woman Show forest plot | 2 | 289 | Odds Ratio (M‐H, Fixed, 95% CI) | 0.95 [0.51, 1.78] |
| 2 OHSS per woman Show forest plot | 2 | 289 | Odds Ratio (M‐H, Fixed, 95% CI) | 0.83 [0.40, 1.70] |
| 2.1 Moderate OHSS | 2 | 289 | Odds Ratio (M‐H, Fixed, 95% CI) | 0.83 [0.40, 1.70] |
| 3 Clinical pregnancy rate per woman Show forest plot | 2 | 289 | Odds Ratio (M‐H, Fixed, 95% CI) | 0.94 [0.54, 1.64] |
| 4 Miscarriage rate per woman Show forest plot | 2 | 289 | Odds Ratio (M‐H, Fixed, 95% CI) | 0.95 [0.38, 2.40] |
| 5 No of oocytes retrieved per woman Show forest plot | 2 | 103 | Mean Difference (IV, Fixed, 95% CI) | ‐1.33 [‐3.26, 0.60] |
| 6 Adverse events per woman Show forest plot | 1 | Odds Ratio (M‐H, Fixed, 95% CI) | Subtotals only | |