Gonadotrofina recombinante versus gonadotrofina coriónica humana urinaria para desencadenar la maduración final de los ovocitos en los ciclos de FIV e ICSI
Información
- DOI:
- https://doi.org/10.1002/14651858.CD003719.pub4Copiar DOI

- Base de datos:
-
- Cochrane Database of Systematic Reviews
- Versión publicada:
-
- 23 abril 2016see what's new
- Tipo:
-
- Intervention
- Etapa:
-
- Review
- Grupo Editorial Cochrane:
-
Grupo Cochrane de Ginecología y fertilidad
- Copyright:
-
- Copyright © 2016 The Cochrane Collaboration. Published by John Wiley & Sons, Ltd.
Cifras del artículo
Altmetric:
Citado por:
Autores
Contributions of authors
Mohamed AFM Youssef: performed data extraction and quality assessment of the included trials; was responsible for statistical analysis and interpretation of the data.
Ahmed M Abou‐Setta: contributed to drafts of the review.
Wai Sun Lam: screened and selected studies and entered data for the 2016 update and revised the draft text.
Sources of support
Internal sources
-
University of Auckland, New Zealand.
External sources
-
No sources of support supplied
Declarations of interest
Previous author Hesham Al‐Inany contributed to one of the trials included in this review (Study 21447).
No current author has any interest to declare.
Acknowledgements
We would like to thank Cindy Farquhar, Ruth Buist, and Sue Hall from the Cochrane Menstrual Disorders and Subfertility Group, University of Auckland, New Zealand for contributions to previous version of this review. We would also like to thank Ladan Mohammadi Yeganeh (Madani 2013); Beatrice DeMoustier (Study 21447); and the authors of Borges 2004 and Kovacs 2008 for supplying information. We would like to thank Michelle Proctor for her great efforts; she was an author on the first published version of this review.
The authors of the 2016 update thank Ragaa Mansour for contributions to previous versions of this review. They also thank Prof Hesham G Al‐Inany and Prof Mohamed Aboulghar for their contributions to all previous versions of this review.
Version history
| Published | Title | Stage | Authors | Version |
| 2016 Apr 23 | Recombinant versus urinary human chorionic gonadotrophin for final oocyte maturation triggering in IVF and ICSI cycles | Review | Mohamed A Youssef, Ahmed M Abou‐Setta, Wai Sun Lam | |
| 2011 Apr 13 | Recombinant versus urinary human chorionic gonadotrophin for final oocyte maturation triggering in IVF and ICSI cycles | Review | Mohamed AFM Youssef, Hesham G Al‐Inany, Mohamed Aboulghar, Ragaa Mansour, Ahmed M Abou‐Setta | |
| 2005 Apr 20 | Recombinant versus urinary human chorionic gonadotrophin for final oocyte maturation triggering in IVF and ICSI cycles | Review | Mohamed AFM Youssef, Hesham G Al‐Inany, Mohamed Aboulghar, Ragaa Mansour, Michelle Proctor | |
| 2002 Jul 22 | Recombinant versus urinary human chorionic gonadotrophin for ovulation induction in assisted conception | Protocol | Hesham G Al‐Inany, Mohamed Aboulghar, Ragaa Mansour | |
Differences between protocol and review
2016 update: We added mild to moderate OHSS, moderate OHSS and undefined OHSS as outcomes and severity as a subgroup. Subgroup analysis was conducted according to the IVF protocol utilised: long GnRH agonist protocol and GnRH antagonist protocol.
Keywords
MeSH
Medical Subject Headings (MeSH) Keywords
Medical Subject Headings Check Words
Female; Humans;
PICO
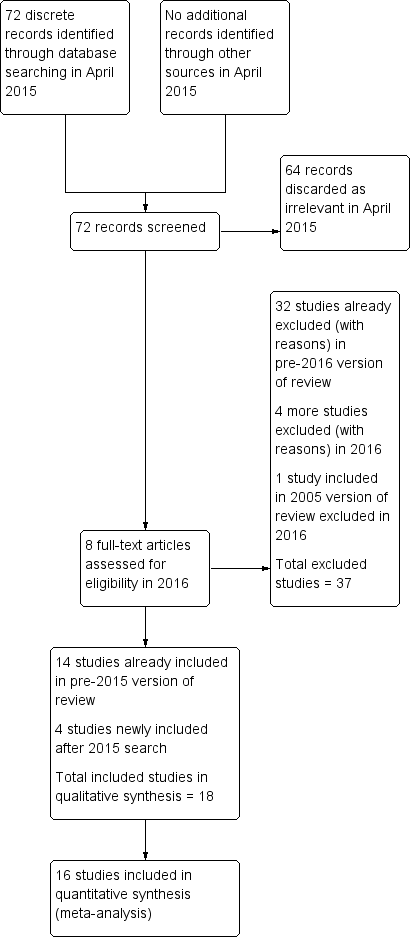
Study flow diagram.

Methodological quality graph: review authors' judgements about each methodological quality item presented as percentages across all included studies.

Methodological quality summary: review authors' judgements about each methodological quality item for each included study.

Forest plot of comparison: 1 rhCG versus uhCG for triggering ovulation, outcome: 1.1 Ongoing pregnancy/live birth rate per woman.

Forest plot of comparison: 1 rhCG versus uhCG for triggering ovulation, outcome: 1.2 OHSS per woman.
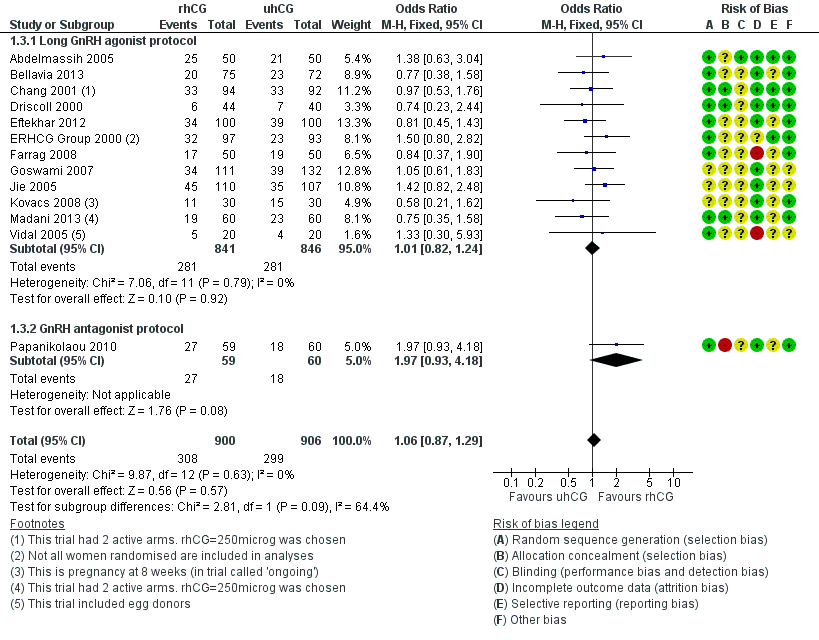
Forest plot of comparison: 1 rhCG versus uhCG for triggering ovulation, outcome: 1.3 Clinical pregnancy rate per woman.
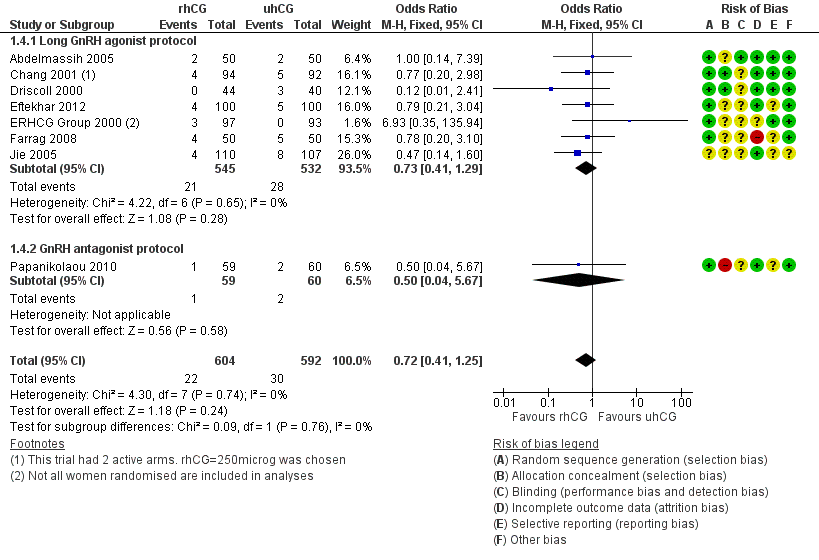
Forest plot of comparison: 1 rhCG versus uhCG for triggering ovulation, outcome: 1.4 Miscarriage rate per woman.

Forest plot of comparison: 2 rhLH versus uhCG for triggering ovulation, outcome: 2.1 Ongoing pregnancy/live birth rate per woman.

Forest plot of comparison: 2 rhLH versus uhCG for triggering ovulation, outcome: 2.2 OHSS per woman.

Comparison 1 rhCG versus uhCG for triggering ovulation, Outcome 1 Ongoing pregnancy/live birth rate per woman.

Comparison 1 rhCG versus uhCG for triggering ovulation, Outcome 2 OHSS per woman.
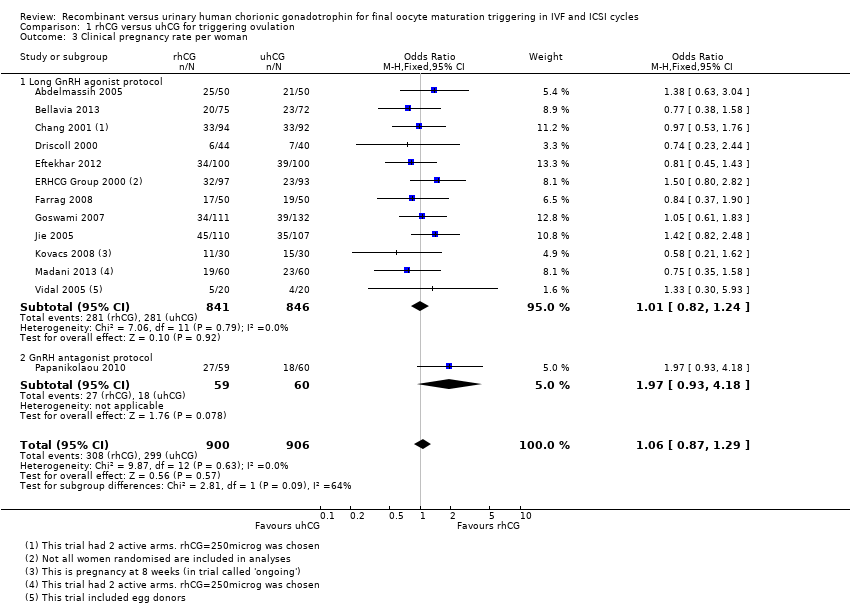
Comparison 1 rhCG versus uhCG for triggering ovulation, Outcome 3 Clinical pregnancy rate per woman.
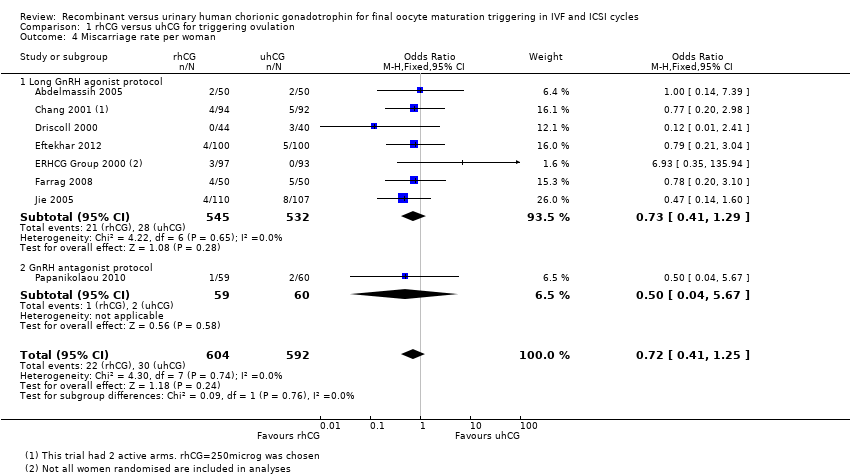
Comparison 1 rhCG versus uhCG for triggering ovulation, Outcome 4 Miscarriage rate per woman.

Comparison 1 rhCG versus uhCG for triggering ovulation, Outcome 5 No of oocytes retrieved per woman.
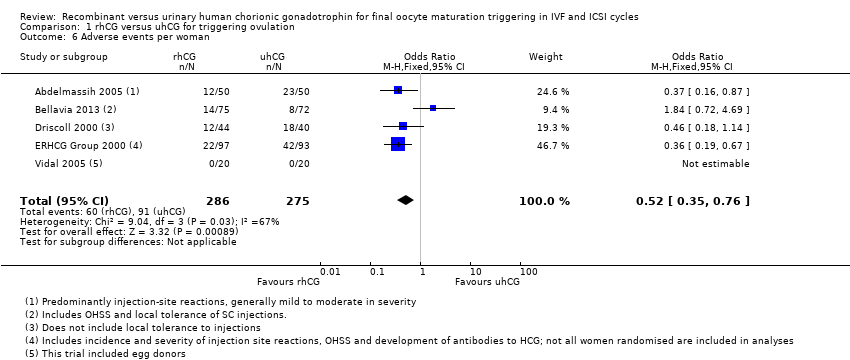
Comparison 1 rhCG versus uhCG for triggering ovulation, Outcome 6 Adverse events per woman.

Comparison 2 rhLH versus uhCG for triggering ovulation, Outcome 1 Ongoing pregnancy/live birth rate per woman.
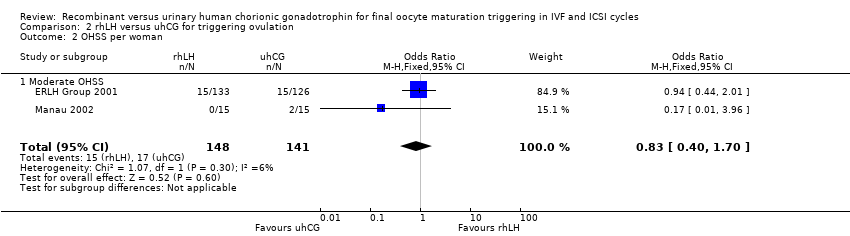
Comparison 2 rhLH versus uhCG for triggering ovulation, Outcome 2 OHSS per woman.
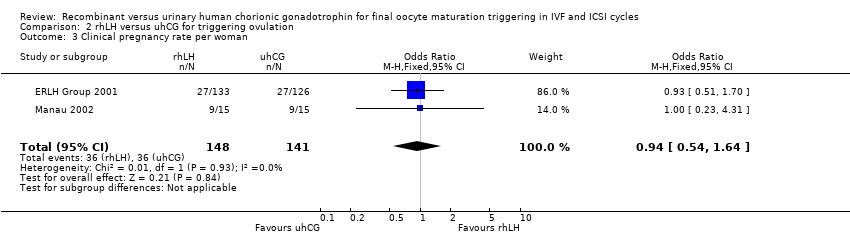
Comparison 2 rhLH versus uhCG for triggering ovulation, Outcome 3 Clinical pregnancy rate per woman.

Comparison 2 rhLH versus uhCG for triggering ovulation, Outcome 4 Miscarriage rate per woman.
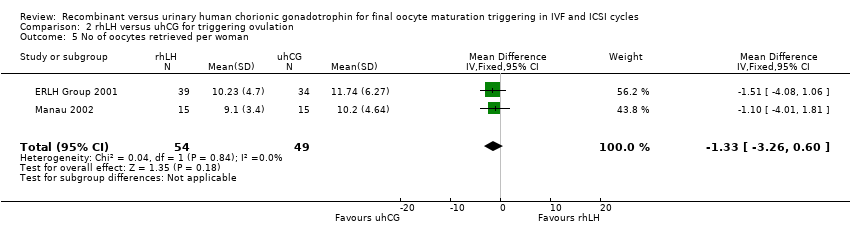
Comparison 2 rhLH versus uhCG for triggering ovulation, Outcome 5 No of oocytes retrieved per woman.

Comparison 2 rhLH versus uhCG for triggering ovulation, Outcome 6 Adverse events per woman.
| RhCG compared to uhCG for final oocyte maturation triggering in IVF and ICSI cycles | ||||||
| Population: women undergoing final oocyte maturation triggering in IVF and ICSI cycles | ||||||
| Outcomes | Illustrative comparative risks* (95% CI) | Relative effect | No of participants | Quality of the evidence | Comments | |
| Assumed risk | Corresponding risk | |||||
| UhCG | RhCG | |||||
| Ongoing pregnancy/live birth rate per woman | 367 per 1000 | 396 per 1000 | OR 1.15 | 1136 | ⊕⊕⊕⊝ | — |
| OHSS per woman ‐ moderate to severe OHSS | 10 per 1000 | 17 per 1000 | OR 1.76 | 417 | ⊕⊕⊝⊝ | — |
| Clinical pregnancy rate per woman | 330 per 1000 | 343 per 1000 | OR 1.06 | 1806 | ⊕⊕⊕⊝ | — |
| Miscarriage rate per woman | 51 per 1000 | 37 per 1000 | OR 0.72 | 1347 | ⊕⊕⊝⊝ | — |
| Adverse events per woman | 331 per 1000 | 179 per 1000 | OR 0.52 | 561 | ⊕⊕⊕⊝ | Adverse events included: injection site pain, reaction, inflammation, nausea, vomiting, abdominal pain |
| *The basis for the assumed risk (e.g. the median control group risk across studies) is provided in footnotes. The corresponding risk (and its 95% confidence interval) is based on the assumed risk in the comparison group and the relative effect of the intervention (and its 95% CI). | ||||||
| GRADE Working Group grades of evidence | ||||||
| aThe pooled effect included both the line of no effect and appreciable benefit or harm. | ||||||
| RhLH compared to uhCG for final oocyte maturation triggering in IVF and ICSI cycles | |||||
| Population: women undergoing final oocyte maturation triggering in IVF and ICSI cycles | |||||
| Outcomes | Illustrative comparative risks* (95% CI) | Relative effect | No of participants | Quality of the evidence | |
| Assumed risk | Corresponding risk | ||||
| UhCG | RhLH | ||||
| Ongoing pregnancy/live birth rate per woman | 371 per 1000 | 359 per 1000 | OR 0.95 | 289 | ⊕⊝⊝⊝ |
| OHSS per woman ‐ Moderate OHSS | 126 per 1000 | 107 per 1000 | OR 0.83 | 289 | ⊕⊝⊝⊝ |
| Clinical pregnancy rate per woman | 407 per 1000 | 392 per 1000 | OR 0.94 | 289 | ⊕⊝⊝⊝ |
| Miscarriage rate per woman | 36 per 1000 | 34 per 1000 | OR 0.95 | 280 | ⊕⊝⊝⊝ |
| Adverse events per woman | 1 study reported this outcome in this comparison; event numbers were similar in both groups. | 259 | — | ||
| *The basis for the assumed risk (e.g. the median control group risk across studies) is provided in footnotes. The corresponding risk (and its 95% confidence interval) is based on the assumed risk in the comparison group and the relative effect of the intervention (and its 95% CI). | |||||
| GRADE Working Group grades of evidence | |||||
| aThe pooled effect included both the line of no effect and appreciable benefit or harm. | |||||
| Outcome or subgroup title | No. of studies | No. of participants | Statistical method | Effect size |
| 1 Ongoing pregnancy/live birth rate per woman Show forest plot | 7 | 1136 | Odds Ratio (M‐H, Fixed, 95% CI) | 1.15 [0.89, 1.49] |
| 1.1 Long GnRH agonist protocol | 6 | 1017 | Odds Ratio (M‐H, Fixed, 95% CI) | 1.06 [0.80, 1.39] |
| 1.2 GnRH antagonist protocol | 1 | 119 | Odds Ratio (M‐H, Fixed, 95% CI) | 2.17 [1.00, 4.68] |
| 2 OHSS per woman Show forest plot | 8 | Odds Ratio (M‐H, Fixed, 95% CI) | Subtotals only | |
| 2.1 Moderate to severe OHSS | 3 | 417 | Odds Ratio (M‐H, Fixed, 95% CI) | 1.76 [0.37, 8.45] |
| 2.2 Moderate OHSS | 1 | 243 | Odds Ratio (M‐H, Fixed, 95% CI) | 0.78 [0.27, 2.27] |
| 2.3 Mild to moderate OHSS | 2 | 320 | Odds Ratio (M‐H, Fixed, 95% CI) | 1.0 [0.42, 2.38] |
| 2.4 Undefined OHSS | 3 | 495 | Odds Ratio (M‐H, Fixed, 95% CI) | 1.18 [0.50, 2.78] |
| 3 Clinical pregnancy rate per woman Show forest plot | 13 | 1806 | Odds Ratio (M‐H, Fixed, 95% CI) | 1.06 [0.87, 1.29] |
| 3.1 Long GnRH agonist protocol | 12 | 1687 | Odds Ratio (M‐H, Fixed, 95% CI) | 1.01 [0.82, 1.24] |
| 3.2 GnRH antagonist protocol | 1 | 119 | Odds Ratio (M‐H, Fixed, 95% CI) | 1.97 [0.93, 4.18] |
| 4 Miscarriage rate per woman Show forest plot | 8 | 1196 | Odds Ratio (M‐H, Fixed, 95% CI) | 0.72 [0.41, 1.25] |
| 4.1 Long GnRH agonist protocol | 7 | 1077 | Odds Ratio (M‐H, Fixed, 95% CI) | 0.73 [0.41, 1.29] |
| 4.2 GnRH antagonist protocol | 1 | 119 | Odds Ratio (M‐H, Fixed, 95% CI) | 0.5 [0.04, 5.67] |
| 5 No of oocytes retrieved per woman Show forest plot | 12 | 1744 | Mean Difference (IV, Fixed, 95% CI) | ‐0.11 [‐0.70, 0.47] |
| 5.1 Long GnRH agonist protocol | 11 | 1625 | Mean Difference (IV, Fixed, 95% CI) | ‐0.14 [‐0.73, 0.45] |
| 5.2 GnRH antagonist protocol | 1 | 119 | Mean Difference (IV, Fixed, 95% CI) | 1.20 [‐3.14, 5.54] |
| 6 Adverse events per woman Show forest plot | 5 | 561 | Odds Ratio (M‐H, Fixed, 95% CI) | 0.52 [0.35, 0.76] |
| Outcome or subgroup title | No. of studies | No. of participants | Statistical method | Effect size |
| 1 Ongoing pregnancy/live birth rate per woman Show forest plot | 2 | 289 | Odds Ratio (M‐H, Fixed, 95% CI) | 0.95 [0.51, 1.78] |
| 2 OHSS per woman Show forest plot | 2 | 289 | Odds Ratio (M‐H, Fixed, 95% CI) | 0.83 [0.40, 1.70] |
| 2.1 Moderate OHSS | 2 | 289 | Odds Ratio (M‐H, Fixed, 95% CI) | 0.83 [0.40, 1.70] |
| 3 Clinical pregnancy rate per woman Show forest plot | 2 | 289 | Odds Ratio (M‐H, Fixed, 95% CI) | 0.94 [0.54, 1.64] |
| 4 Miscarriage rate per woman Show forest plot | 2 | 289 | Odds Ratio (M‐H, Fixed, 95% CI) | 0.95 [0.38, 2.40] |
| 5 No of oocytes retrieved per woman Show forest plot | 2 | 103 | Mean Difference (IV, Fixed, 95% CI) | ‐1.33 [‐3.26, 0.60] |
| 6 Adverse events per woman Show forest plot | 1 | Odds Ratio (M‐H, Fixed, 95% CI) | Subtotals only | |