Scolaris Content Display Scolaris Content Display

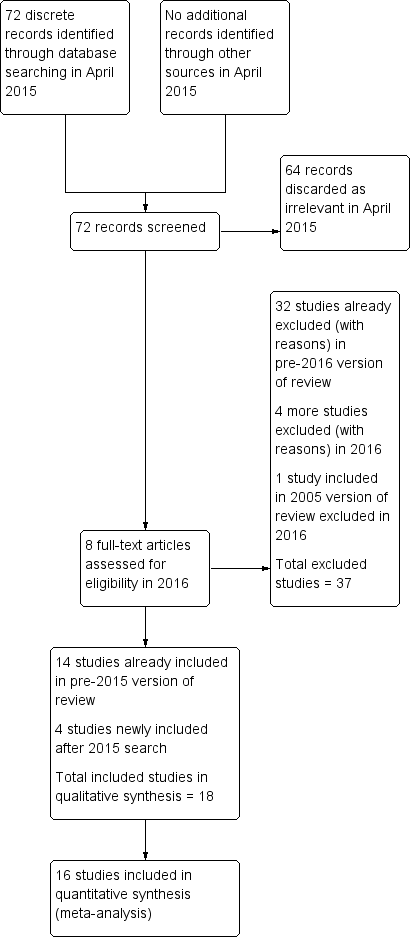
Study flow diagram.
Figuras y tablas -
Figure 1

Study flow diagram.

Methodological quality graph: review authors' judgements about each methodological quality item presented as percentages across all included studies.
Figuras y tablas -
Figure 2

Methodological quality graph: review authors' judgements about each methodological quality item presented as percentages across all included studies.

Methodological quality summary: review authors' judgements about each methodological quality item for each included study.
Figuras y tablas -
Figure 3

Methodological quality summary: review authors' judgements about each methodological quality item for each included study.

Forest plot of comparison: 1 rhCG versus uhCG for triggering ovulation, outcome: 1.1 Ongoing pregnancy/live birth rate per woman.
Figuras y tablas -
Figure 4

Forest plot of comparison: 1 rhCG versus uhCG for triggering ovulation, outcome: 1.1 Ongoing pregnancy/live birth rate per woman.

Forest plot of comparison: 1 rhCG versus uhCG for triggering ovulation, outcome: 1.2 OHSS per woman.
Figuras y tablas -
Figure 5

Forest plot of comparison: 1 rhCG versus uhCG for triggering ovulation, outcome: 1.2 OHSS per woman.

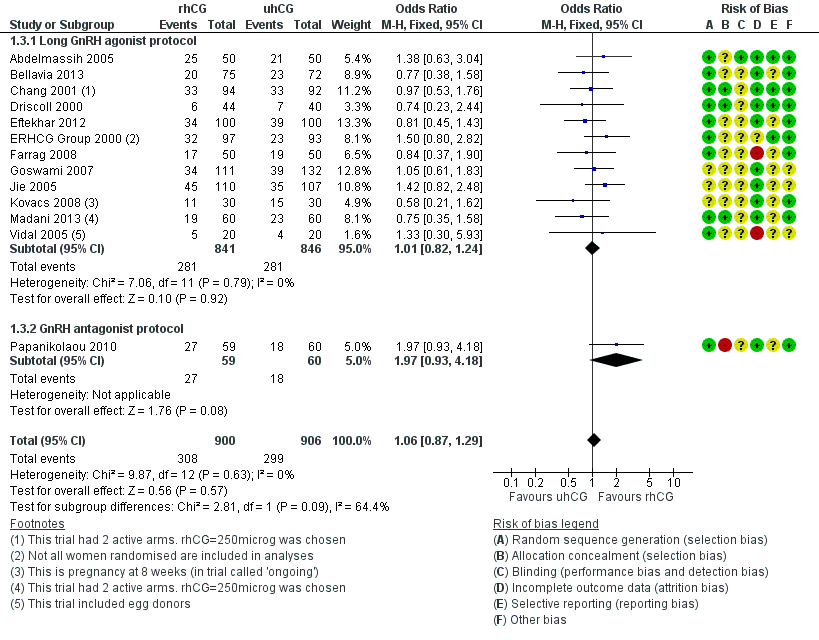
Forest plot of comparison: 1 rhCG versus uhCG for triggering ovulation, outcome: 1.3 Clinical pregnancy rate per woman.
Figuras y tablas -
Figure 6

Forest plot of comparison: 1 rhCG versus uhCG for triggering ovulation, outcome: 1.3 Clinical pregnancy rate per woman.

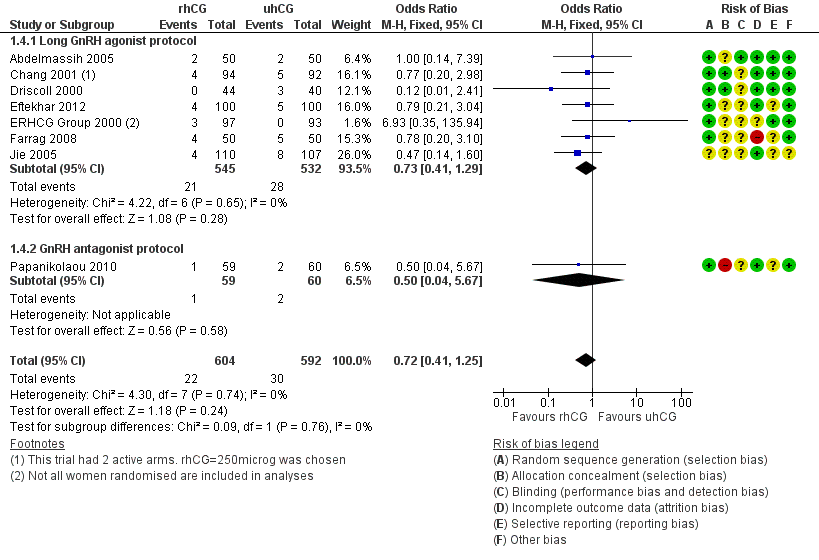
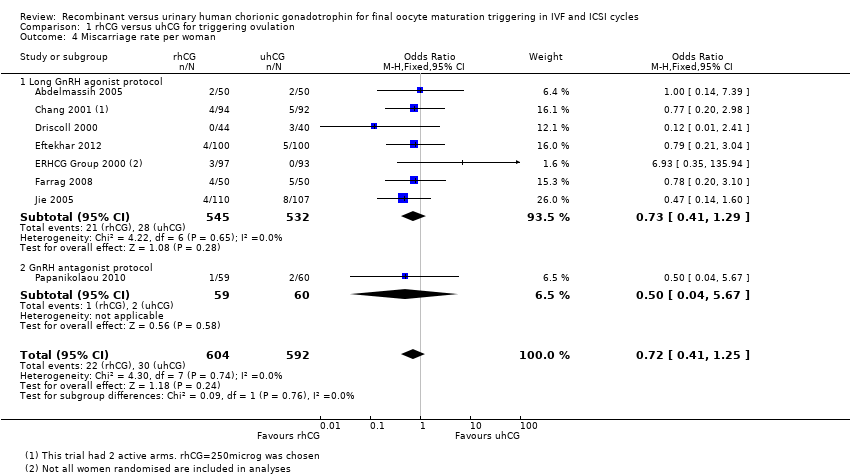
Forest plot of comparison: 1 rhCG versus uhCG for triggering ovulation, outcome: 1.4 Miscarriage rate per woman.
Figuras y tablas -
Figure 7

Forest plot of comparison: 1 rhCG versus uhCG for triggering ovulation, outcome: 1.4 Miscarriage rate per woman.

Forest plot of comparison: 2 rhLH versus uhCG for triggering ovulation, outcome: 2.1 Ongoing pregnancy/live birth rate per woman.
Figuras y tablas -
Figure 8

Forest plot of comparison: 2 rhLH versus uhCG for triggering ovulation, outcome: 2.1 Ongoing pregnancy/live birth rate per woman.

Forest plot of comparison: 2 rhLH versus uhCG for triggering ovulation, outcome: 2.2 OHSS per woman.
Figuras y tablas -
Figure 9

Forest plot of comparison: 2 rhLH versus uhCG for triggering ovulation, outcome: 2.2 OHSS per woman.

Comparison 1 rhCG versus uhCG for triggering ovulation, Outcome 1 Ongoing pregnancy/live birth rate per woman.
Figuras y tablas -
Analysis 1.1

Comparison 1 rhCG versus uhCG for triggering ovulation, Outcome 1 Ongoing pregnancy/live birth rate per woman.

Comparison 1 rhCG versus uhCG for triggering ovulation, Outcome 2 OHSS per woman.
Figuras y tablas -
Analysis 1.2

Comparison 1 rhCG versus uhCG for triggering ovulation, Outcome 2 OHSS per woman.

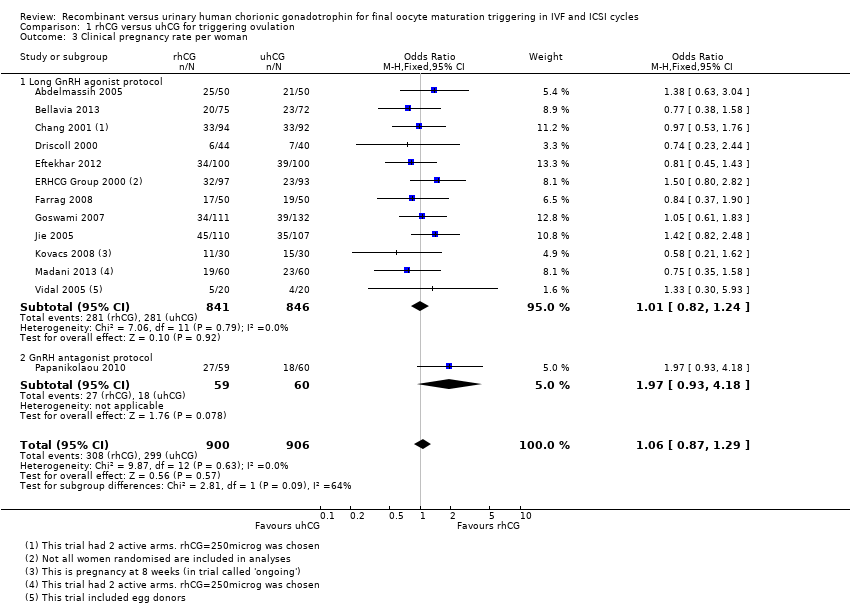
Comparison 1 rhCG versus uhCG for triggering ovulation, Outcome 3 Clinical pregnancy rate per woman.
Figuras y tablas -
Analysis 1.3

Comparison 1 rhCG versus uhCG for triggering ovulation, Outcome 3 Clinical pregnancy rate per woman.

Comparison 1 rhCG versus uhCG for triggering ovulation, Outcome 4 Miscarriage rate per woman.
Figuras y tablas -
Analysis 1.4

Comparison 1 rhCG versus uhCG for triggering ovulation, Outcome 4 Miscarriage rate per woman.

Comparison 1 rhCG versus uhCG for triggering ovulation, Outcome 5 No of oocytes retrieved per woman.
Figuras y tablas -
Analysis 1.5

Comparison 1 rhCG versus uhCG for triggering ovulation, Outcome 5 No of oocytes retrieved per woman.

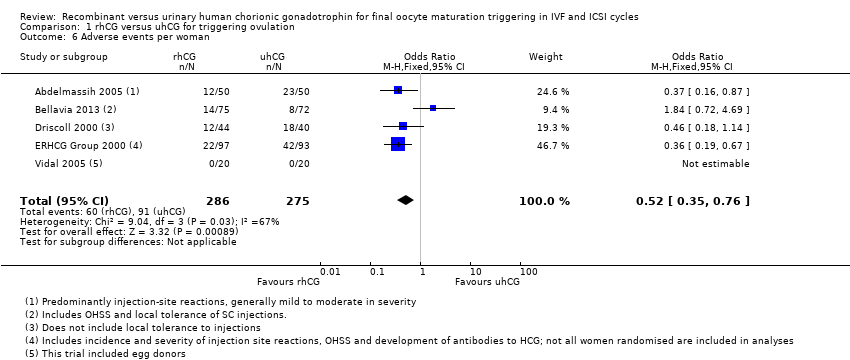
Comparison 1 rhCG versus uhCG for triggering ovulation, Outcome 6 Adverse events per woman.
Figuras y tablas -
Analysis 1.6

Comparison 1 rhCG versus uhCG for triggering ovulation, Outcome 6 Adverse events per woman.

Comparison 2 rhLH versus uhCG for triggering ovulation, Outcome 1 Ongoing pregnancy/live birth rate per woman.
Figuras y tablas -
Analysis 2.1

Comparison 2 rhLH versus uhCG for triggering ovulation, Outcome 1 Ongoing pregnancy/live birth rate per woman.

Comparison 2 rhLH versus uhCG for triggering ovulation, Outcome 2 OHSS per woman.
Figuras y tablas -
Analysis 2.2

Comparison 2 rhLH versus uhCG for triggering ovulation, Outcome 2 OHSS per woman.

Comparison 2 rhLH versus uhCG for triggering ovulation, Outcome 3 Clinical pregnancy rate per woman.
Figuras y tablas -
Analysis 2.3

Comparison 2 rhLH versus uhCG for triggering ovulation, Outcome 3 Clinical pregnancy rate per woman.

Comparison 2 rhLH versus uhCG for triggering ovulation, Outcome 4 Miscarriage rate per woman.
Figuras y tablas -
Analysis 2.4

Comparison 2 rhLH versus uhCG for triggering ovulation, Outcome 4 Miscarriage rate per woman.

Comparison 2 rhLH versus uhCG for triggering ovulation, Outcome 5 No of oocytes retrieved per woman.
Figuras y tablas -
Analysis 2.5

Comparison 2 rhLH versus uhCG for triggering ovulation, Outcome 5 No of oocytes retrieved per woman.

Comparison 2 rhLH versus uhCG for triggering ovulation, Outcome 6 Adverse events per woman.
Figuras y tablas -
Analysis 2.6

Comparison 2 rhLH versus uhCG for triggering ovulation, Outcome 6 Adverse events per woman.

Summary of findings for the main comparison. RhCG compared to uhCG for final oocyte maturation triggering in IVF and ICSI cycles

RhCG compared to uhCG for final oocyte maturation triggering in IVF and ICSI cycles

Population: women undergoing final oocyte maturation triggering in IVF and ICSI cycles
Setting: ART
Intervention: recombinant hCG (rhCG)
Comparison: urinary human chorionic gonadotrophin (uhCG)

Outcomes

Illustrative comparative risks* (95% CI)

Relative effect
(95% CI)

No of participants
(studies)

Quality of the evidence
(GRADE)

Comments

Assumed risk

Corresponding risk

UhCG

RhCG

Ongoing pregnancy/live birth rate per woman

367 per 1000

396 per 1000
(344 to 454)

OR 1.15
(0.89 to 1.49)

1136
(7 studies)

⊕⊕⊕⊝
Moderatea

OHSS per woman ‐ moderate to severe OHSS

10 per 1000

17 per 1000
(11 to 84)

OR 1.76
(0.37 to 8.45)

417
(3 studies)

⊕⊕⊝⊝
Lowb,c

Clinical pregnancy rate per woman

330 per 1000

343 per 1000
(300 to 388)

OR 1.06
(0.87 to 1.29)

1806
(13 studies)

⊕⊕⊕⊝
Moderatea

Miscarriage rate per woman

51 per 1000

37 per 1000
(21 to 63)

OR 0.72
(0.41 to 1.25)

1347
(9 studies)

⊕⊕⊝⊝
Lowa,b

Adverse events per woman

331 per 1000

179 per 1000
(112 to 406)

OR 0.52
(0.35 to 0.76)

561
(5 studies)

⊕⊕⊕⊝
Moderateb

Adverse events included: injection site pain, reaction, inflammation, nausea, vomiting, abdominal pain

*The basis for the assumed risk (e.g. the median control group risk across studies) is provided in footnotes. The corresponding risk (and its 95% confidence interval) is based on the assumed risk in the comparison group and the relative effect of the intervention (and its 95% CI).
ART: assisted reproduction therapy; CI: confidence interval; hCG: human chorionic gonadotrophin; ICSI: intracytoplasmic sperm injection; IVF: in vitro fertilisation; OR: odds ratio; rhCG: recombinant hCG; uhCG: urinary hCG

GRADE Working Group grades of evidence
High quality: Further research is very unlikely to change our confidence in the estimate of effect.
Moderate quality: Further research is likely to have an important impact on our confidence in the estimate of effect and may change the estimate.
Low quality: Further research is very likely to have an important impact on our confidence in the estimate of effect and is likely to change the estimate.
Very low quality: We are very uncertain about the estimate.

aThe pooled effect included both the line of no effect and appreciable benefit or harm.
bTotal number of events is less than 300.
cThe pooled effect included both the line of no effect and appreciable benefit and harm.

Figuras y tablas -
Summary of findings for the main comparison. RhCG compared to uhCG for final oocyte maturation triggering in IVF and ICSI cycles
Summary of findings 2. RhLH compared to uhCG for final oocyte maturation triggering in IVF and ICSI cycles

RhLH compared to uhCG for final oocyte maturation triggering in IVF and ICSI cycles

Population: women undergoing final oocyte maturation triggering in IVF and ICSI cycles
Setting: ART
Intervention: rhLH (recombinant luteinising hormone)
Comparison: urinary human chorionic gonadotrophin (uhCG)

Outcomes

Illustrative comparative risks* (95% CI)

Relative effect
(95% CI)

No of participants
(studies)

Quality of the evidence
(GRADE)

Assumed risk

Corresponding risk

UhCG

RhLH

Ongoing pregnancy/live birth rate per woman

371 per 1000

359 per 1000
(231 to 512)

OR 0.95
(0.51 to 1.78)

289
(2 studies)

⊕⊝⊝⊝
Very lowa,b,c

OHSS per woman ‐ Moderate OHSS

126 per 1000

107 per 1000
(55 to 197)

OR 0.83
(0.40 to 1.70)

289
(2 studies)

⊕⊝⊝⊝
Very lowa,b,c

Clinical pregnancy rate per woman

407 per 1000

392 per 1000
(270 to 530)

OR 0.94
(0.54 to 1.64)

289
(2 studies)

⊕⊝⊝⊝
Very lowa,b,c

Miscarriage rate per woman

36 per 1000

34 per 1000
(14 to 82)

OR 0.95
(0.38 to 2.40)

280
(2 studies)

⊕⊝⊝⊝
Very lowa,b,c

Adverse events per woman

1 study reported this outcome in this comparison; event numbers were similar in both groups.

259
(1 study)

*The basis for the assumed risk (e.g. the median control group risk across studies) is provided in footnotes. The corresponding risk (and its 95% confidence interval) is based on the assumed risk in the comparison group and the relative effect of the intervention (and its 95% CI).
ART: assisted reproduction therapy; CI: confidence interval; hCG: human chorionic gonadotrophin; ICSI: intracytoplasmic sperm injection; IVF: in vitro fertilisation; OR: odds ratio; rhLH: recombinant luteinising hormone; uhCG: urinary hCG.

GRADE Working Group grades of evidence
High quality: Further research is very unlikely to change our confidence in the estimate of effect.
Moderate quality: Further research is likely to have an important impact on our confidence in the estimate of effect and may change the estimate.
Low quality: Further research is very likely to have an important impact on our confidence in the estimate of effect and is likely to change the estimate.
Very low quality: We are very uncertain about the estimate.

aThe pooled effect included both the line of no effect and appreciable benefit or harm.
bTotal number of events is less than 300.
c1 of the 2 included studies did not provide information about methods of randomisation, allocation concealment or blinding.

Figuras y tablas -
Summary of findings 2. RhLH compared to uhCG for final oocyte maturation triggering in IVF and ICSI cycles
Comparison 1. rhCG versus uhCG for triggering ovulation

Outcome or subgroup title

No. of studies

No. of participants

Statistical method

Effect size

1 Ongoing pregnancy/live birth rate per woman Show forest plot

7

1136

Odds Ratio (M‐H, Fixed, 95% CI)

1.15 [0.89, 1.49]

1.1 Long GnRH agonist protocol

6

1017

Odds Ratio (M‐H, Fixed, 95% CI)

1.06 [0.80, 1.39]

1.2 GnRH antagonist protocol

1

119

Odds Ratio (M‐H, Fixed, 95% CI)

2.17 [1.00, 4.68]

2 OHSS per woman Show forest plot

8

Odds Ratio (M‐H, Fixed, 95% CI)

Subtotals only

2.1 Moderate to severe OHSS

3

417

Odds Ratio (M‐H, Fixed, 95% CI)

1.76 [0.37, 8.45]

2.2 Moderate OHSS

1

243

Odds Ratio (M‐H, Fixed, 95% CI)

0.78 [0.27, 2.27]

2.3 Mild to moderate OHSS

2

320

Odds Ratio (M‐H, Fixed, 95% CI)

1.0 [0.42, 2.38]

2.4 Undefined OHSS

3

495

Odds Ratio (M‐H, Fixed, 95% CI)

1.18 [0.50, 2.78]

3 Clinical pregnancy rate per woman Show forest plot

13

1806

Odds Ratio (M‐H, Fixed, 95% CI)

1.06 [0.87, 1.29]

3.1 Long GnRH agonist protocol

12

1687

Odds Ratio (M‐H, Fixed, 95% CI)

1.01 [0.82, 1.24]

3.2 GnRH antagonist protocol

1

119

Odds Ratio (M‐H, Fixed, 95% CI)

1.97 [0.93, 4.18]

4 Miscarriage rate per woman Show forest plot

8

1196

Odds Ratio (M‐H, Fixed, 95% CI)

0.72 [0.41, 1.25]

4.1 Long GnRH agonist protocol

7

1077

Odds Ratio (M‐H, Fixed, 95% CI)

0.73 [0.41, 1.29]

4.2 GnRH antagonist protocol

1

119

Odds Ratio (M‐H, Fixed, 95% CI)

0.5 [0.04, 5.67]

5 No of oocytes retrieved per woman Show forest plot

12

1744

Mean Difference (IV, Fixed, 95% CI)

‐0.11 [‐0.70, 0.47]

5.1 Long GnRH agonist protocol

11

1625

Mean Difference (IV, Fixed, 95% CI)

‐0.14 [‐0.73, 0.45]

5.2 GnRH antagonist protocol

1

119

Mean Difference (IV, Fixed, 95% CI)

1.20 [‐3.14, 5.54]

6 Adverse events per woman Show forest plot

5

561

Odds Ratio (M‐H, Fixed, 95% CI)

0.52 [0.35, 0.76]

Figuras y tablas -
Comparison 1. rhCG versus uhCG for triggering ovulation
Comparison 2. rhLH versus uhCG for triggering ovulation

Outcome or subgroup title

No. of studies

No. of participants

Statistical method

Effect size

1 Ongoing pregnancy/live birth rate per woman Show forest plot

2

289

Odds Ratio (M‐H, Fixed, 95% CI)

0.95 [0.51, 1.78]

2 OHSS per woman Show forest plot

2

289

Odds Ratio (M‐H, Fixed, 95% CI)

0.83 [0.40, 1.70]

2.1 Moderate OHSS

2

289

Odds Ratio (M‐H, Fixed, 95% CI)

0.83 [0.40, 1.70]

3 Clinical pregnancy rate per woman Show forest plot

2

289

Odds Ratio (M‐H, Fixed, 95% CI)

0.94 [0.54, 1.64]

4 Miscarriage rate per woman Show forest plot

2

289

Odds Ratio (M‐H, Fixed, 95% CI)

0.95 [0.38, 2.40]

5 No of oocytes retrieved per woman Show forest plot

2

103

Mean Difference (IV, Fixed, 95% CI)

‐1.33 [‐3.26, 0.60]

6 Adverse events per woman Show forest plot

1

Odds Ratio (M‐H, Fixed, 95% CI)

Subtotals only

Figuras y tablas -
Comparison 2. rhLH versus uhCG for triggering ovulation