Bladder neck needle suspension for urinary incontinence in women
Referencias
References to studies included in this review
References to studies excluded from this review
Additional references
References to other published versions of this review
Characteristics of studies
Characteristics of included studies [ordered by study ID]
Ir a:
| Methods | Quasi‐randomised RCT (by birth date) | |
| Participants | n = 51. No withdrawals mentioned | |
| Interventions | (I) Burch (27) | |
| Outcomes | Cure = complete freedom from SUI at 8 to 27 months | |
| Notes | — | |
| Risk of bias | ||
| Bias | Authors' judgement | Support for judgement |
| Random sequence generation (selection bias) | High risk | Date of birth |
| Allocation concealment (selection bias) | High risk | C ‐ Inadequate |
| Blinding (performance bias and detection bias) | Unclear risk | Not mentioned |
| Incomplete outcome data (attrition bias) | Low risk | No drop‐outs reported |
| Methods | RCT | |
| Participants | 127 women recruited, results reported for 107 at 12 months. Results for 64 at 5 years out of 78 cured at 1 year | |
| Interventions | (I) Anterior vaginal repair (colporrhaphy) (35) (n = 30 at 5 years) | |
| Outcomes | Cure defined as no loss of urine in history or on urodynamic investigation | |
| Notes | Sensitivity analysis at 5 years for 107 assuming missing 14 were failures and including 29 already failed at 1 year | |
| Risk of bias | ||
| Bias | Authors' judgement | Support for judgement |
| Random sequence generation (selection bias) | Low risk | Randomisation tables |
| Allocation concealment (selection bias) | Unclear risk | B ‐ Unclear |
| Blinding (performance bias and detection bias) | Unclear risk | Not mentioned |
| Incomplete outcome data (attrition bias) | High risk | 20 women lost to follow‐up at 1 year, 43 at 5 years |
| Methods | RCT | |
| Participants | 342 women (298 reported) | |
| Interventions | (I) Anterior vaginal repair (99) | |
| Outcomes | Failure rate: (I) at 3 months 20/99, at 12 months 31/99 | |
| Notes | Tertiary referral centre. No power calculation | |
| Risk of bias | ||
| Bias | Authors' judgement | Support for judgement |
| Random sequence generation (selection bias) | Low risk | Randomisation tables |
| Allocation concealment (selection bias) | Unclear risk | B ‐ Unclear |
| Blinding (performance bias and detection bias) | Unclear risk | Not mentioned |
| Incomplete outcome data (attrition bias) | High risk | 44 women lost to follow‐up |
| Methods | RCT | |
| Participants | 80 women with SUI + urethrocystocele (anterior prolapse) grade 3 or 4 | |
| Interventions | (I) Anterior repair (Nicholls) (52) | |
| Outcomes | SUI (failed): (I) 14/52, (II) 4/28 (assumed to be after first year) | |
| Notes | Women comparable at baseline for age, diabetes, respiratory problems, obstetric history, concomitant vaginal hysterectomy | |
| Risk of bias | ||
| Bias | Authors' judgement | Support for judgement |
| Random sequence generation (selection bias) | Unclear risk | RCT |
| Allocation concealment (selection bias) | Low risk | A ‐ Adequate (sealed envelopes) |
| Incomplete outcome data (attrition bias) | Low risk | No drop‐outs reported |
| Methods | RCT. Method not described. 2 arms | |
| Participants | n = 50. No withdrawals | |
| Interventions | (I) Colposuspension (vagina/obturator shelf repair) (24) | |
| Outcomes | Success = complete dryness or occasional incontinence | |
| Notes | Separate analysis of primary and recurrent cases possible | |
| Risk of bias | ||
| Bias | Authors' judgement | Support for judgement |
| Random sequence generation (selection bias) | Unclear risk | RCT |
| Allocation concealment (selection bias) | Unclear risk | B ‐ Unclear |
| Blinding (performance bias and detection bias) | Unclear risk | Not mentioned |
| Incomplete outcome data (attrition bias) | Low risk | No drop‐outs reported |
| Methods | RCT by open randomisation list (3 arms) | |
| Participants | n = 204, 58 lost to follow‐up due to war | |
| Interventions | (I) Colposuspension (Burch) (56) Single surgeon for all | |
| Outcomes | Subjective UI in 1st year: (I) 2/56; (II) 1/44; (III) 3/46 | |
| Notes | With additional information from author | |
| Risk of bias | ||
| Bias | Authors' judgement | Support for judgement |
| Random sequence generation (selection bias) | Low risk | Open randomisation list |
| Allocation concealment (selection bias) | High risk | C ‐ Inadequate (open list) |
| Blinding (performance bias and detection bias) | Unclear risk | Not mentioned |
| Incomplete outcome data (attrition bias) | High risk | 58 drop‐outs (due to war) |
| Methods | RCT. Follow‐up at 2, 3, 12 and 24 months. Women allocated to 1 of 2 interventions by random tables. All women available at follow‐up | |
| Participants | 20 women recruited, 10 in each arm of the study Single‐centre, Department of Obstetrics and Gynaecology, UK | |
| Interventions | (I) Needle suspension (Stamey) (10) | |
| Outcomes | Cure = objective (urodynamic diagnosis, pad test) at 3 months and subjective at 24 months Urodynamic data also given | |
| Notes | Pad test at 12 and 24 months stated but not reported | |
| Risk of bias | ||
| Bias | Authors' judgement | Support for judgement |
| Random sequence generation (selection bias) | Low risk | Random tables |
| Allocation concealment (selection bias) | Unclear risk | B ‐ Unclear |
| Blinding (performance bias and detection bias) | Unclear risk | Not mentioned |
| Incomplete outcome data (attrition bias) | Low risk | No drop‐outs |
| Methods | Quasi‐randomised RCT (alternate allocation) | |
| Participants | n = 51. No withdrawals | |
| Interventions | (I) Colposuspension (Burch) (26) Colposuspension referenced; modified Stamey described Single surgeon for all cases | |
| Outcomes | Subjective cure = not defined | |
| Notes | Colposuspension described as Burch | |
| Risk of bias | ||
| Bias | Authors' judgement | Support for judgement |
| Random sequence generation (selection bias) | High risk | Alternation |
| Allocation concealment (selection bias) | High risk | C ‐ Inadequate |
| Blinding (performance bias and detection bias) | Unclear risk | Not mentioned |
| Incomplete outcome data (attrition bias) | Low risk | No withdrawals |
| Methods | RCT, method not described | |
| Participants | n = 70. No withdrawals mentioned | |
| Interventions | (I) MMK (30) | |
| Outcomes | Not cured in first year: (I) 4/30, (II) 1/20 | |
| Notes | Abstract | |
| Risk of bias | ||
| Bias | Authors' judgement | Support for judgement |
| Random sequence generation (selection bias) | Unclear risk | RCT |
| Allocation concealment (selection bias) | Unclear risk | B ‐ Unclear |
| Blinding (performance bias and detection bias) | Unclear risk | Not mentioned |
| Incomplete outcome data (attrition bias) | High risk | 20 participants not reported |
| Methods | RCT of 2 different suture materials. Method of randomisation not described | |
| Participants | 24 women, 4 excluded because not followed up | |
| Interventions | (I) CV‐0 polytetrafluoro‐ethylene (Goretex) suture (9) | |
| Outcomes | Pain and continence. Cure defined as no incontinence, no use of pads or medication, good = slight incontinence, improved = occasional pad or drug use, failed = unimproved or worse | |
| Notes | Type of operation stated not to have affected randomisation or outcomes but data not given to assess this. Raz urethropexy, Raz 4‐corner repair or Gittes urethropexy | |
| Risk of bias | ||
| Bias | Authors' judgement | Support for judgement |
| Random sequence generation (selection bias) | Unclear risk | RCT |
| Allocation concealment (selection bias) | Unclear risk | B ‐ Unclear |
| Blinding (performance bias and detection bias) | Unclear risk | Not mentioned |
| Incomplete outcome data (attrition bias) | High risk | 4 excluded because not followed up |
BMI = body mass index; DI = detrusor instability (now DO = detrusor overactivity); GSI = genuine stress incontinence (now USI = urodynamic stress incontinence); ITT = intention‐to‐treat; kg = kilograms; MMK = Marshall‐Marchetti‐Krantz; NS = not significant; PFMT = pelvic floor muscle training; RCT = randomised controlled trial; SUI = stress urinary incontinence (symptom diagnosis); TVT = tension‐free vaginal tape; w = week(s); SD = standard deviation; UDS = urodynamics; UI = urinary incontinence; UUI= Urgency Urinary Incontinence; UTI = urinary tract infection; VAS = visual analogue score
Characteristics of excluded studies [ordered by study ID]
Ir a:
| Study | Reason for exclusion |
| RCT, but women had prolapse and NO incontinence | |
| RCT, but women were not incontinent | |
| RCT, but women did not all have incontinence | |
| RCT, but data not presented separately for each type of surgery | |
| RCT, but of mesh versus no mesh for prolapse. This paper reports outcomes of women who had concomitant incontinence procedures, but were not randomised to these operations | |
| Randomisation and groups unclear ("randomised by age"). Excluded as attempts to contact authors unsuccessful and insufficient information given in abstract | |
| Not RCT | |
| RCT, but trial not focused on needle suspension alone | |
| RCT of 54 women with urodynamic stress urinary incontinence | |
| Not RCT | |
| Not RCT | |
| Not RCT | |
| Not RCT |
RCT = randomised controlled trial
Data and analyses
| Outcome or subgroup title | No. of studies | No. of participants | Statistical method | Effect size | ||||||||||||
| 1 Number not cured (worse, unchanged or improved) within first year Show forest plot | 5 | 517 | Risk Ratio (M‐H, Fixed, 95% CI) | 1.70 [1.11, 2.60] | ||||||||||||
| Analysis 1.1 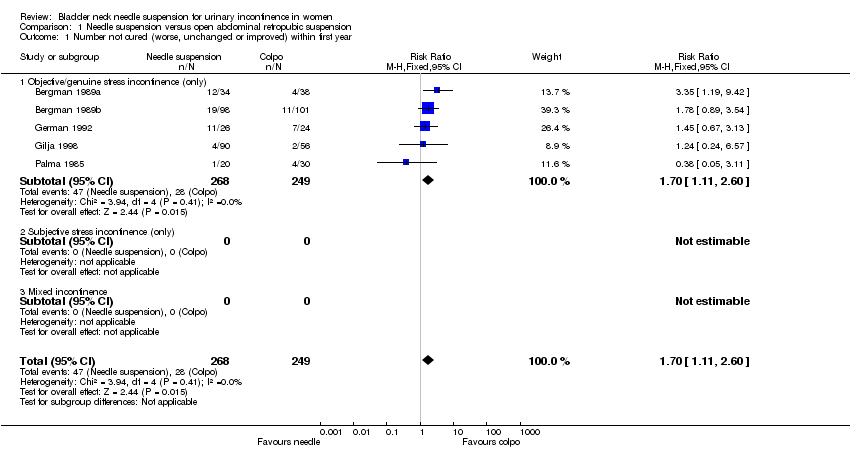 Comparison 1 Needle suspension versus open abdominal retropubic suspension, Outcome 1 Number not cured (worse, unchanged or improved) within first year. | ||||||||||||||||
| 1.1 Objective/genuine stress incontinence (only) | 5 | 517 | Risk Ratio (M‐H, Fixed, 95% CI) | 1.70 [1.11, 2.60] | ||||||||||||
| 1.2 Subjective stress incontinence (only) | 0 | 0 | Risk Ratio (M‐H, Fixed, 95% CI) | 0.0 [0.0, 0.0] | ||||||||||||
| 1.3 Mixed incontinence | 0 | 0 | Risk Ratio (M‐H, Fixed, 95% CI) | 0.0 [0.0, 0.0] | ||||||||||||
| 2 Number not cured (worse, unchanged or improved) after first year Show forest plot | 7 | 610 | Risk Ratio (M‐H, Fixed, 95% CI) | 2.00 [1.47, 2.72] | ||||||||||||
| Analysis 1.2 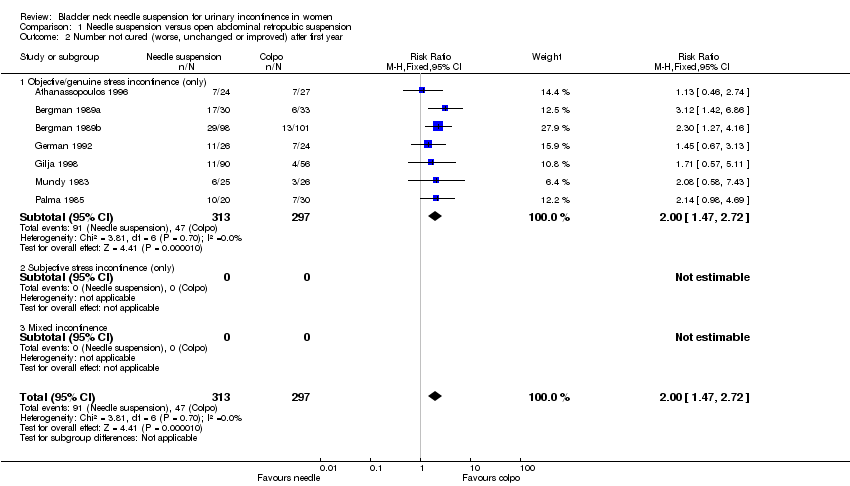 Comparison 1 Needle suspension versus open abdominal retropubic suspension, Outcome 2 Number not cured (worse, unchanged or improved) after first year. | ||||||||||||||||
| 2.1 Objective/genuine stress incontinence (only) | 7 | 610 | Risk Ratio (M‐H, Fixed, 95% CI) | 2.00 [1.47, 2.72] | ||||||||||||
| 2.2 Subjective stress incontinence (only) | 0 | 0 | Risk Ratio (M‐H, Fixed, 95% CI) | 0.0 [0.0, 0.0] | ||||||||||||
| 2.3 Mixed incontinence | 0 | 0 | Risk Ratio (M‐H, Fixed, 95% CI) | 0.0 [0.0, 0.0] | ||||||||||||
| 3 Number not improved (worse or unchanged) within first year Show forest plot | 1 | 50 | Risk Ratio (M‐H, Fixed, 95% CI) | 0.75 [0.07, 7.73] | ||||||||||||
| Analysis 1.3  Comparison 1 Needle suspension versus open abdominal retropubic suspension, Outcome 3 Number not improved (worse or unchanged) within first year. | ||||||||||||||||
| 3.1 Objective/genuine stress incontinence (only) | 1 | 50 | Risk Ratio (M‐H, Fixed, 95% CI) | 0.75 [0.07, 7.73] | ||||||||||||
| 3.2 Subjective stress incontinence (only) | 0 | 0 | Risk Ratio (M‐H, Fixed, 95% CI) | 0.0 [0.0, 0.0] | ||||||||||||
| 3.3 Mixed incontinence | 0 | 0 | Risk Ratio (M‐H, Fixed, 95% CI) | 0.0 [0.0, 0.0] | ||||||||||||
| 4 Number not improved (worse or unchanged) after first year Show forest plot | 1 | 51 | Risk Ratio (M‐H, Fixed, 95% CI) | 1.5 [0.37, 6.04] | ||||||||||||
| Analysis 1.4 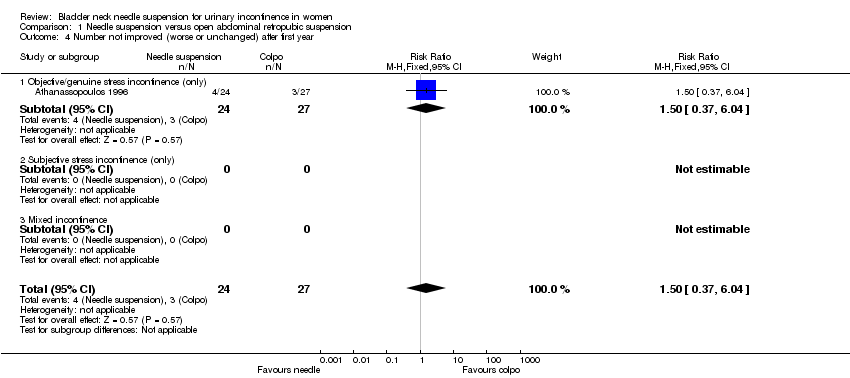 Comparison 1 Needle suspension versus open abdominal retropubic suspension, Outcome 4 Number not improved (worse or unchanged) after first year. | ||||||||||||||||
| 4.1 Objective/genuine stress incontinence (only) | 1 | 51 | Risk Ratio (M‐H, Fixed, 95% CI) | 1.5 [0.37, 6.04] | ||||||||||||
| 4.2 Subjective stress incontinence (only) | 0 | 0 | Risk Ratio (M‐H, Fixed, 95% CI) | 0.0 [0.0, 0.0] | ||||||||||||
| 4.3 Mixed incontinence | 0 | 0 | Risk Ratio (M‐H, Fixed, 95% CI) | 0.0 [0.0, 0.0] | ||||||||||||
| 5 Urge symptoms or urge incontinence Show forest plot | 4 | 297 | Risk Ratio (M‐H, Fixed, 95% CI) | 1.80 [0.71, 4.56] | ||||||||||||
| Analysis 1.5  Comparison 1 Needle suspension versus open abdominal retropubic suspension, Outcome 5 Urge symptoms or urge incontinence. | ||||||||||||||||
| 5.1 Objective/genuine stress incontinence (only) | 4 | 297 | Risk Ratio (M‐H, Fixed, 95% CI) | 1.80 [0.71, 4.56] | ||||||||||||
| 5.2 Subjective stress incontinence (only) | 0 | 0 | Risk Ratio (M‐H, Fixed, 95% CI) | 0.0 [0.0, 0.0] | ||||||||||||
| 5.3 Mixed incontinence | 0 | 0 | Risk Ratio (M‐H, Fixed, 95% CI) | 0.0 [0.0, 0.0] | ||||||||||||
| 6 Voiding dysfunction after 3 months Show forest plot | 4 | 202 | Risk Ratio (M‐H, Fixed, 95% CI) | 2.12 [0.81, 5.55] | ||||||||||||
| Analysis 1.6  Comparison 1 Needle suspension versus open abdominal retropubic suspension, Outcome 6 Voiding dysfunction after 3 months. | ||||||||||||||||
| 6.1 Objective/genuine stress incontinence (only) | 4 | 202 | Risk Ratio (M‐H, Fixed, 95% CI) | 2.12 [0.81, 5.55] | ||||||||||||
| 6.2 Subjective stress incontinence (only) | 0 | 0 | Risk Ratio (M‐H, Fixed, 95% CI) | 0.0 [0.0, 0.0] | ||||||||||||
| 6.3 Mixed incontinence | 0 | 0 | Risk Ratio (M‐H, Fixed, 95% CI) | 0.0 [0.0, 0.0] | ||||||||||||
| 7 Detrusor overactivity (objective diagnosis by urodynamics) Show forest plot | 2 | 101 | Risk Ratio (M‐H, Fixed, 95% CI) | 2.91 [0.73, 11.58] | ||||||||||||
| Analysis 1.7 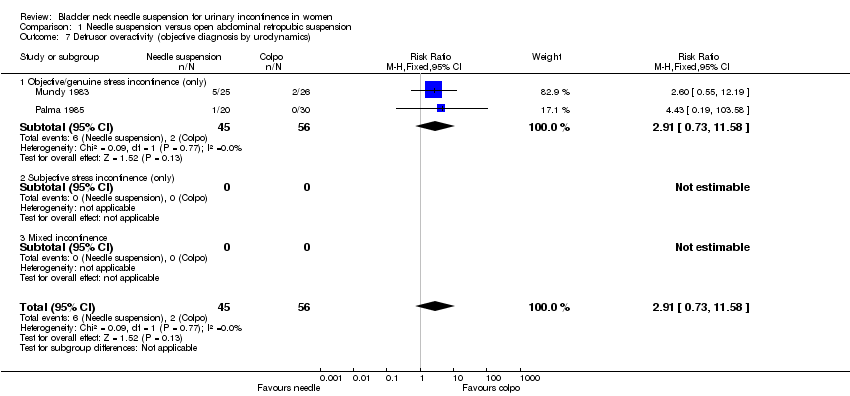 Comparison 1 Needle suspension versus open abdominal retropubic suspension, Outcome 7 Detrusor overactivity (objective diagnosis by urodynamics). | ||||||||||||||||
| 7.1 Objective/genuine stress incontinence (only) | 2 | 101 | Risk Ratio (M‐H, Fixed, 95% CI) | 2.91 [0.73, 11.58] | ||||||||||||
| 7.2 Subjective stress incontinence (only) | 0 | 0 | Risk Ratio (M‐H, Fixed, 95% CI) | 0.0 [0.0, 0.0] | ||||||||||||
| 7.3 Mixed incontinence | 0 | 0 | Risk Ratio (M‐H, Fixed, 95% CI) | 0.0 [0.0, 0.0] | ||||||||||||
| 8 New or persistent prolapse Show forest plot | 1 | 72 | Risk Ratio (M‐H, Fixed, 95% CI) | 2.24 [0.21, 23.57] | ||||||||||||
| Analysis 1.8  Comparison 1 Needle suspension versus open abdominal retropubic suspension, Outcome 8 New or persistent prolapse. | ||||||||||||||||
| 8.1 Objective/genuine stress incontinence (only) | 1 | 72 | Risk Ratio (M‐H, Fixed, 95% CI) | 2.24 [0.21, 23.57] | ||||||||||||
| 8.2 Subjective stress incontinence (only) | 0 | 0 | Risk Ratio (M‐H, Fixed, 95% CI) | 0.0 [0.0, 0.0] | ||||||||||||
| 8.3 Mixed incontinence | 0 | 0 | Risk Ratio (M‐H, Fixed, 95% CI) | 0.0 [0.0, 0.0] | ||||||||||||
| 9 Peri‐operative surgical complications Show forest plot | 3 | 152 | Risk Ratio (M‐H, Fixed, 95% CI) | 1.44 [0.73, 2.83] | ||||||||||||
| Analysis 1.9  Comparison 1 Needle suspension versus open abdominal retropubic suspension, Outcome 9 Peri‐operative surgical complications. | ||||||||||||||||
| 9.1 Objective/genuine stress incontinence (only) | 3 | 152 | Risk Ratio (M‐H, Fixed, 95% CI) | 1.44 [0.73, 2.83] | ||||||||||||
| 9.2 Subjective stress incontinence (only) | 0 | 0 | Risk Ratio (M‐H, Fixed, 95% CI) | 0.0 [0.0, 0.0] | ||||||||||||
| 9.3 Mixed incontinence | 0 | 0 | Risk Ratio (M‐H, Fixed, 95% CI) | 0.0 [0.0, 0.0] | ||||||||||||
| 10 Length of stay/time to return to normal function Show forest plot | Other data | No numeric data | ||||||||||||||
| Analysis 1.10
Comparison 1 Needle suspension versus open abdominal retropubic suspension, Outcome 10 Length of stay/time to return to normal function. | ||||||||||||||||
| Outcome or subgroup title | No. of studies | No. of participants | Statistical method | Effect size |
| 1 Number not cured (worse, unchanged or improved) within first year Show forest plot | 3 | 417 | Risk Ratio (M‐H, Fixed, 95% CI) | 2.05 [1.20, 3.50] |
| Analysis 2.1  Comparison 2 Needle suspension versus open abdominal retropubic suspension (no previous surgery), Outcome 1 Number not cured (worse, unchanged or improved) within first year. | ||||
| 1.1 Objective/genuine stress incontinence (only) | 3 | 417 | Risk Ratio (M‐H, Fixed, 95% CI) | 2.05 [1.20, 3.50] |
| 1.2 Subjective stress incontinence (only) | 0 | 0 | Risk Ratio (M‐H, Fixed, 95% CI) | 0.0 [0.0, 0.0] |
| 1.3 Mixed incontinence | 0 | 0 | Risk Ratio (M‐H, Fixed, 95% CI) | 0.0 [0.0, 0.0] |
| 2 Number not cured (worse, unchanged or improved) after first year Show forest plot | 3 | 408 | Risk Ratio (M‐H, Fixed, 95% CI) | 2.37 [1.54, 3.66] |
| Analysis 2.2  Comparison 2 Needle suspension versus open abdominal retropubic suspension (no previous surgery), Outcome 2 Number not cured (worse, unchanged or improved) after first year. | ||||
| 2.1 Objective/genuine stress incontinence (only) | 3 | 408 | Risk Ratio (M‐H, Fixed, 95% CI) | 2.37 [1.54, 3.66] |
| 2.2 Subjective stress incontinence (only) | 0 | 0 | Risk Ratio (M‐H, Fixed, 95% CI) | 0.0 [0.0, 0.0] |
| 2.3 Mixed incontinence | 0 | 0 | Risk Ratio (M‐H, Fixed, 95% CI) | 0.0 [0.0, 0.0] |
| 3 Urge symptoms or urge incontinence Show forest plot | 1 | 146 | Risk Ratio (M‐H, Fixed, 95% CI) | 2.49 [0.55, 11.30] |
| Analysis 2.3  Comparison 2 Needle suspension versus open abdominal retropubic suspension (no previous surgery), Outcome 3 Urge symptoms or urge incontinence. | ||||
| 3.1 Objective/genuine stress incontinence (only) | 1 | 146 | Risk Ratio (M‐H, Fixed, 95% CI) | 2.49 [0.55, 11.30] |
| 3.2 Subjective stress incontinence (only) | 0 | 0 | Risk Ratio (M‐H, Fixed, 95% CI) | 0.0 [0.0, 0.0] |
| 3.3 Mixed incontinence | 0 | 0 | Risk Ratio (M‐H, Fixed, 95% CI) | 0.0 [0.0, 0.0] |
| 4 New or persistent prolapse Show forest plot | 1 | 72 | Risk Ratio (M‐H, Fixed, 95% CI) | 2.24 [0.21, 23.57] |
| Analysis 2.4  Comparison 2 Needle suspension versus open abdominal retropubic suspension (no previous surgery), Outcome 4 New or persistent prolapse. | ||||
| 4.1 Objective/genuine stress incontinence (only) | 1 | 72 | Risk Ratio (M‐H, Fixed, 95% CI) | 2.24 [0.21, 23.57] |
| 4.2 Subjective stress incontinence (only) | 0 | 0 | Risk Ratio (M‐H, Fixed, 95% CI) | 0.0 [0.0, 0.0] |
| 4.3 Mixed incontinence | 0 | 0 | Risk Ratio (M‐H, Fixed, 95% CI) | 0.0 [0.0, 0.0] |
| Outcome or subgroup title | No. of studies | No. of participants | Statistical method | Effect size |
| 1 Number not cured (worse, unchanged or improved) within first year Show forest plot | 2 | 100 | Risk Ratio (M‐H, Fixed, 95% CI) | 1.12 [0.55, 2.29] |
| Analysis 3.1 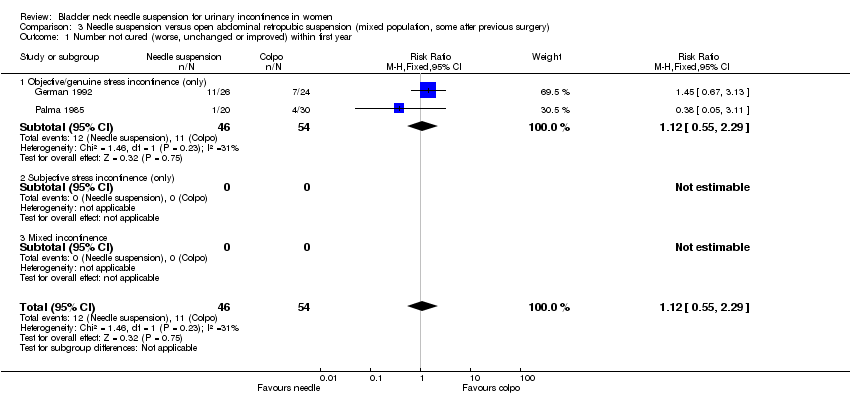 Comparison 3 Needle suspension versus open abdominal retropubic suspension (mixed population, some after previous surgery), Outcome 1 Number not cured (worse, unchanged or improved) within first year. | ||||
| 1.1 Objective/genuine stress incontinence (only) | 2 | 100 | Risk Ratio (M‐H, Fixed, 95% CI) | 1.12 [0.55, 2.29] |
| 1.2 Subjective stress incontinence (only) | 0 | 0 | Risk Ratio (M‐H, Fixed, 95% CI) | 0.0 [0.0, 0.0] |
| 1.3 Mixed incontinence | 0 | 0 | Risk Ratio (M‐H, Fixed, 95% CI) | 0.0 [0.0, 0.0] |
| 2 Number not cured (worse, unchanged or improved) after first year Show forest plot | 4 | 202 | Risk Ratio (M‐H, Fixed, 95% CI) | 1.61 [1.04, 2.49] |
| Analysis 3.2  Comparison 3 Needle suspension versus open abdominal retropubic suspension (mixed population, some after previous surgery), Outcome 2 Number not cured (worse, unchanged or improved) after first year. | ||||
| 2.1 Objective/genuine stress incontinence (only) | 4 | 202 | Risk Ratio (M‐H, Fixed, 95% CI) | 1.61 [1.04, 2.49] |
| 2.2 Subjective stress incontinence (only) | 0 | 0 | Risk Ratio (M‐H, Fixed, 95% CI) | 0.0 [0.0, 0.0] |
| 2.3 Mixed incontinence | 0 | 0 | Risk Ratio (M‐H, Fixed, 95% CI) | 0.0 [0.0, 0.0] |
| 3 Number not improved (worse or unchanged) within first year Show forest plot | 1 | 50 | Risk Ratio (M‐H, Fixed, 95% CI) | 0.75 [0.07, 7.73] |
| Analysis 3.3  Comparison 3 Needle suspension versus open abdominal retropubic suspension (mixed population, some after previous surgery), Outcome 3 Number not improved (worse or unchanged) within first year. | ||||
| 3.1 Objective/genuine stress incontinence (only) | 1 | 50 | Risk Ratio (M‐H, Fixed, 95% CI) | 0.75 [0.07, 7.73] |
| 3.2 Subjective stress incontinence (only) | 0 | 0 | Risk Ratio (M‐H, Fixed, 95% CI) | 0.0 [0.0, 0.0] |
| 3.3 Mixed incontinence | 0 | 0 | Risk Ratio (M‐H, Fixed, 95% CI) | 0.0 [0.0, 0.0] |
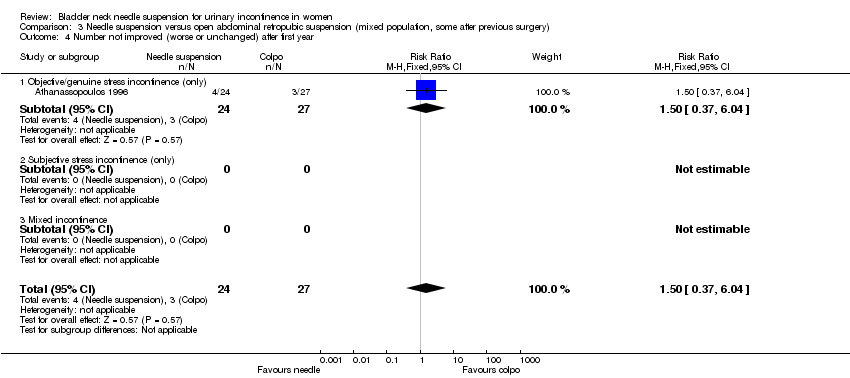
| 4 Number not improved (worse or unchanged) after first year Show forest plot | 1 | 51 | Risk Ratio (M‐H, Fixed, 95% CI) | 1.5 [0.37, 6.04] |
| Analysis 3.4  Comparison 3 Needle suspension versus open abdominal retropubic suspension (mixed population, some after previous surgery), Outcome 4 Number not improved (worse or unchanged) after first year. | ||||
| 4.1 Objective/genuine stress incontinence (only) | 1 | 51 | Risk Ratio (M‐H, Fixed, 95% CI) | 1.5 [0.37, 6.04] |
| 4.2 Subjective stress incontinence (only) | 0 | 0 | Risk Ratio (M‐H, Fixed, 95% CI) | 0.0 [0.0, 0.0] |
| 4.3 Mixed incontinence | 0 | 0 | Risk Ratio (M‐H, Fixed, 95% CI) | 0.0 [0.0, 0.0] |
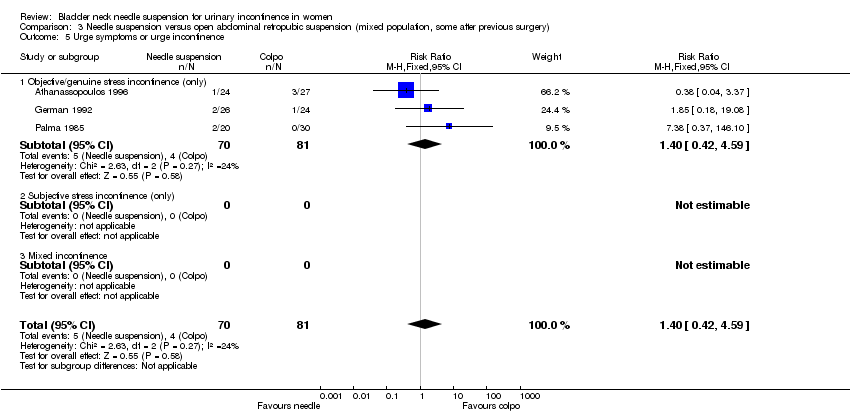
| 5 Urge symptoms or urge incontinence Show forest plot | 3 | 151 | Risk Ratio (M‐H, Fixed, 95% CI) | 1.40 [0.42, 4.59] |
| Analysis 3.5  Comparison 3 Needle suspension versus open abdominal retropubic suspension (mixed population, some after previous surgery), Outcome 5 Urge symptoms or urge incontinence. | ||||
| 5.1 Objective/genuine stress incontinence (only) | 3 | 151 | Risk Ratio (M‐H, Fixed, 95% CI) | 1.40 [0.42, 4.59] |
| 5.2 Subjective stress incontinence (only) | 0 | 0 | Risk Ratio (M‐H, Fixed, 95% CI) | 0.0 [0.0, 0.0] |
| 5.3 Mixed incontinence | 0 | 0 | Risk Ratio (M‐H, Fixed, 95% CI) | 0.0 [0.0, 0.0] |
| 6 Voiding dysfunction after 3 months Show forest plot | 4 | 202 | Risk Ratio (M‐H, Fixed, 95% CI) | 2.12 [0.81, 5.55] |
| Analysis 3.6  Comparison 3 Needle suspension versus open abdominal retropubic suspension (mixed population, some after previous surgery), Outcome 6 Voiding dysfunction after 3 months. | ||||
| 6.1 Objective/genuine stress incontinence (only) | 4 | 202 | Risk Ratio (M‐H, Fixed, 95% CI) | 2.12 [0.81, 5.55] |
| 6.2 Subjective stress incontinence (only) | 0 | 0 | Risk Ratio (M‐H, Fixed, 95% CI) | 0.0 [0.0, 0.0] |
| 6.3 Mixed incontinence | 0 | 0 | Risk Ratio (M‐H, Fixed, 95% CI) | 0.0 [0.0, 0.0] |
| 7 Detrusor overactivity (objective diagnosis by urodynamics) Show forest plot | 2 | 101 | Risk Ratio (M‐H, Fixed, 95% CI) | 2.91 [0.73, 11.58] |
| Analysis 3.7  Comparison 3 Needle suspension versus open abdominal retropubic suspension (mixed population, some after previous surgery), Outcome 7 Detrusor overactivity (objective diagnosis by urodynamics). | ||||
| 7.1 Objective/genuine stress incontinence (only) | 2 | 101 | Risk Ratio (M‐H, Fixed, 95% CI) | 2.91 [0.73, 11.58] |
| 7.2 Subjective stress incontinence (only) | 0 | 0 | Risk Ratio (M‐H, Fixed, 95% CI) | 0.0 [0.0, 0.0] |
| 7.3 Mixed incontinence | 0 | 0 | Risk Ratio (M‐H, Fixed, 95% CI) | 0.0 [0.0, 0.0] |
| 8 Peri‐operative surgical complications Show forest plot | 3 | 152 | Risk Ratio (M‐H, Fixed, 95% CI) | 1.44 [0.73, 2.83] |
| Analysis 3.8 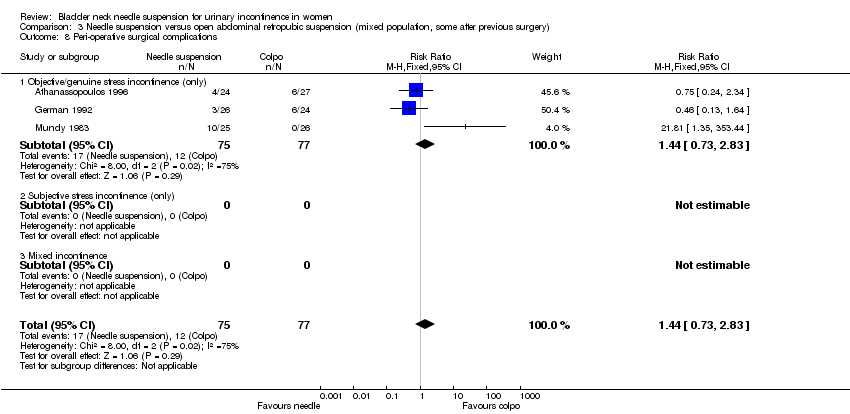 Comparison 3 Needle suspension versus open abdominal retropubic suspension (mixed population, some after previous surgery), Outcome 8 Peri‐operative surgical complications. | ||||
| 8.1 Objective/genuine stress incontinence (only) | 3 | 152 | Risk Ratio (M‐H, Fixed, 95% CI) | 1.44 [0.73, 2.83] |
| 8.2 Subjective stress incontinence (only) | 0 | 0 | Risk Ratio (M‐H, Fixed, 95% CI) | 0.0 [0.0, 0.0] |
| 8.3 Mixed incontinence | 0 | 0 | Risk Ratio (M‐H, Fixed, 95% CI) | 0.0 [0.0, 0.0] |
| Outcome or subgroup title | No. of studies | No. of participants | Statistical method | Effect size |
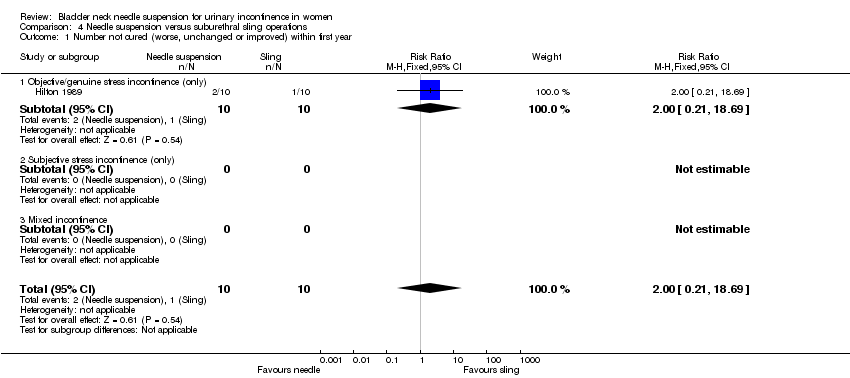
| 1 Number not cured (worse, unchanged or improved) within first year Show forest plot | 1 | 20 | Risk Ratio (M‐H, Fixed, 95% CI) | 2.0 [0.21, 18.69] |
| Analysis 4.1  Comparison 4 Needle suspension versus suburethral sling operations, Outcome 1 Number not cured (worse, unchanged or improved) within first year. | ||||
| 1.1 Objective/genuine stress incontinence (only) | 1 | 20 | Risk Ratio (M‐H, Fixed, 95% CI) | 2.0 [0.21, 18.69] |
| 1.2 Subjective stress incontinence (only) | 0 | 0 | Risk Ratio (M‐H, Fixed, 95% CI) | 0.0 [0.0, 0.0] |
| 1.3 Mixed incontinence | 0 | 0 | Risk Ratio (M‐H, Fixed, 95% CI) | 0.0 [0.0, 0.0] |
| 2 Number not cured (worse, unchanged or improved) after first year Show forest plot | 1 | 20 | Risk Ratio (M‐H, Fixed, 95% CI) | 3.0 [0.37, 24.17] |
| Analysis 4.2  Comparison 4 Needle suspension versus suburethral sling operations, Outcome 2 Number not cured (worse, unchanged or improved) after first year. | ||||
| 2.1 Objective/genuine stress incontinence (only) | 1 | 20 | Risk Ratio (M‐H, Fixed, 95% CI) | 3.0 [0.37, 24.17] |
| 2.2 Subjective stress incontinence (only) | 0 | 0 | Risk Ratio (M‐H, Fixed, 95% CI) | 0.0 [0.0, 0.0] |
| 2.3 Mixed incontinence | 0 | 0 | Risk Ratio (M‐H, Fixed, 95% CI) | 0.0 [0.0, 0.0] |
| 3 Urge symptoms or urge incontinence Show forest plot | 1 | 20 | Risk Ratio (M‐H, Fixed, 95% CI) | 0.6 [0.19, 1.86] |
| Analysis 4.3 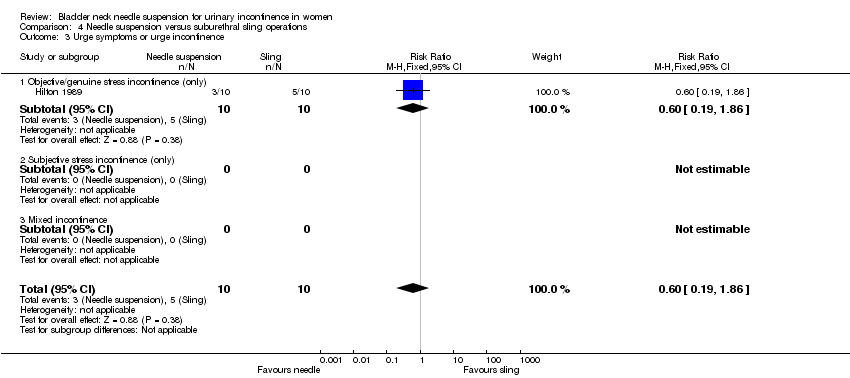 Comparison 4 Needle suspension versus suburethral sling operations, Outcome 3 Urge symptoms or urge incontinence. | ||||
| 3.1 Objective/genuine stress incontinence (only) | 1 | 20 | Risk Ratio (M‐H, Fixed, 95% CI) | 0.6 [0.19, 1.86] |
| 3.2 Subjective stress incontinence (only) | 0 | 0 | Risk Ratio (M‐H, Fixed, 95% CI) | 0.0 [0.0, 0.0] |
| 3.3 Mixed incontinence | 0 | 0 | Risk Ratio (M‐H, Fixed, 95% CI) | 0.0 [0.0, 0.0] |
| 4 Voiding dysfunction after 3 months Show forest plot | 1 | 20 | Risk Ratio (M‐H, Fixed, 95% CI) | 0.5 [0.12, 2.14] |
| Analysis 4.4 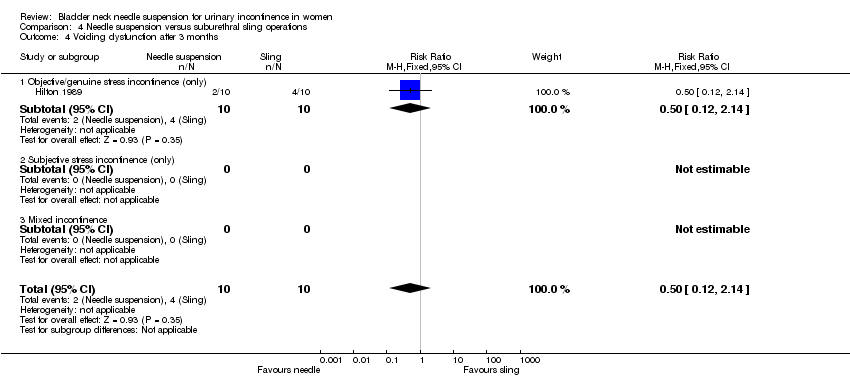 Comparison 4 Needle suspension versus suburethral sling operations, Outcome 4 Voiding dysfunction after 3 months. | ||||
| 4.1 Objective/genuine stress incontinence (only) | 1 | 20 | Risk Ratio (M‐H, Fixed, 95% CI) | 0.5 [0.12, 2.14] |
| 4.2 Subjective stress incontinence (only) | 0 | 0 | Risk Ratio (M‐H, Fixed, 95% CI) | 0.0 [0.0, 0.0] |
| 4.3 Mixed incontinence | 0 | 0 | Risk Ratio (M‐H, Fixed, 95% CI) | 0.0 [0.0, 0.0] |
| 5 Detrusor overactivity (objective diagnosis by urodynamics) Show forest plot | 1 | 20 | Risk Ratio (M‐H, Fixed, 95% CI) | 0.5 [0.05, 4.67] |
| Analysis 4.5  Comparison 4 Needle suspension versus suburethral sling operations, Outcome 5 Detrusor overactivity (objective diagnosis by urodynamics). | ||||
| 5.1 Objective/genuine stress incontinence (only) | 1 | 20 | Risk Ratio (M‐H, Fixed, 95% CI) | 0.5 [0.05, 4.67] |
| 5.2 Subjective stress incontinence (only) | 0 | 0 | Risk Ratio (M‐H, Fixed, 95% CI) | 0.0 [0.0, 0.0] |
| 5.3 Mixed incontinence | 0 | 0 | Risk Ratio (M‐H, Fixed, 95% CI) | 0.0 [0.0, 0.0] |
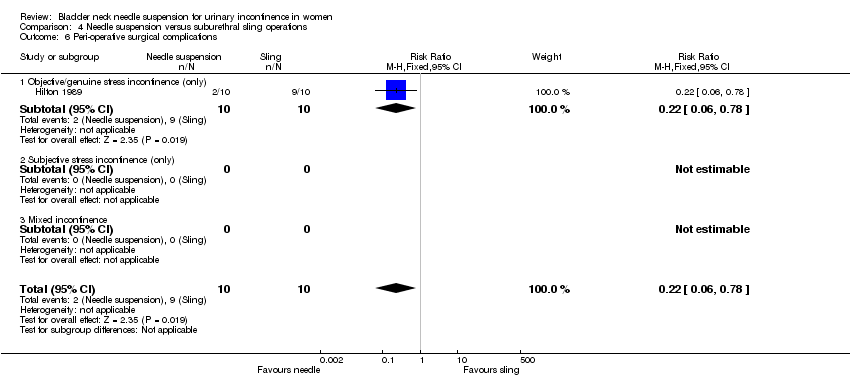
| 6 Peri‐operative surgical complications Show forest plot | 1 | 20 | Risk Ratio (M‐H, Fixed, 95% CI) | 0.22 [0.06, 0.78] |
| Analysis 4.6  Comparison 4 Needle suspension versus suburethral sling operations, Outcome 6 Peri‐operative surgical complications. | ||||
| 6.1 Objective/genuine stress incontinence (only) | 1 | 20 | Risk Ratio (M‐H, Fixed, 95% CI) | 0.22 [0.06, 0.78] |
| 6.2 Subjective stress incontinence (only) | 0 | 0 | Risk Ratio (M‐H, Fixed, 95% CI) | 0.0 [0.0, 0.0] |
| 6.3 Mixed incontinence | 0 | 0 | Risk Ratio (M‐H, Fixed, 95% CI) | 0.0 [0.0, 0.0] |
| 7 Length of inpatient stay Show forest plot | 1 | 20 | Mean Difference (IV, Fixed, 95% CI) | ‐13.0 [‐19.00, ‐5.00] |
| Analysis 4.7 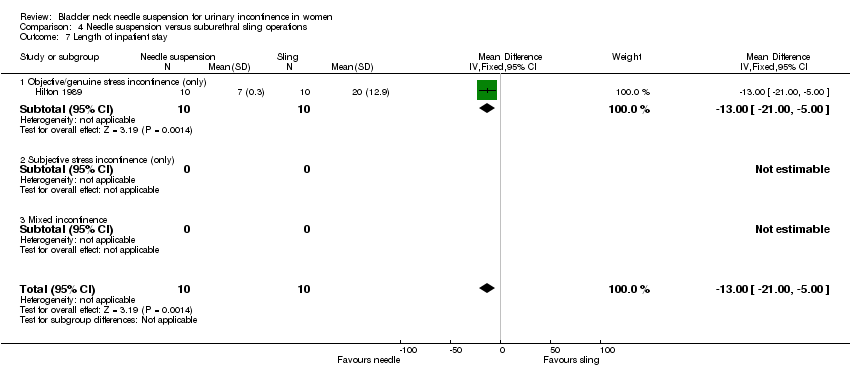 Comparison 4 Needle suspension versus suburethral sling operations, Outcome 7 Length of inpatient stay. | ||||
| 7.1 Objective/genuine stress incontinence (only) | 1 | 20 | Mean Difference (IV, Fixed, 95% CI) | ‐13.0 [‐19.00, ‐5.00] |
| 7.2 Subjective stress incontinence (only) | 0 | 0 | Mean Difference (IV, Fixed, 95% CI) | 0.0 [0.0, 0.0] |
| 7.3 Mixed incontinence | 0 | 0 | Mean Difference (IV, Fixed, 95% CI) | 0.0 [0.0, 0.0] |
| Outcome or subgroup title | No. of studies | No. of participants | Statistical method | Effect size |
| 1 Number not cured (worse, unchanged or improved) within first year Show forest plot | 2 | 266 | Risk Ratio (M‐H, Fixed, 95% CI) | 0.96 [0.63, 1.46] |
| Analysis 5.1  Comparison 5 Needle suspension versus anterior vaginal repair, Outcome 1 Number not cured (worse, unchanged or improved) within first year. | ||||
| 1.1 Objective/genuine stress incontinence (only) | 2 | 266 | Risk Ratio (M‐H, Fixed, 95% CI) | 0.96 [0.63, 1.46] |
| 1.2 Subjective stress incontinence (only) | 0 | 0 | Risk Ratio (M‐H, Fixed, 95% CI) | 0.0 [0.0, 0.0] |
| 1.3 Mixed incontinence | 0 | 0 | Risk Ratio (M‐H, Fixed, 95% CI) | 0.0 [0.0, 0.0] |
| 2 Number not cured (worse, unchanged or improved) after first year Show forest plot | 3 | 337 | Risk Ratio (M‐H, Fixed, 95% CI) | 0.86 [0.64, 1.16] |
| Analysis 5.2  Comparison 5 Needle suspension versus anterior vaginal repair, Outcome 2 Number not cured (worse, unchanged or improved) after first year. | ||||
| 2.1 Objective/genuine stress incontinence (only) | 2 | 257 | Risk Ratio (M‐H, Fixed, 95% CI) | 0.93 [0.68, 1.26] |
| 2.2 Subjective stress incontinence (only) | 0 | 0 | Risk Ratio (M‐H, Fixed, 95% CI) | 0.0 [0.0, 0.0] |
| 2.3 Mixed incontinence | 1 | 80 | Risk Ratio (M‐H, Fixed, 95% CI) | 0.53 [0.19, 1.46] |
| 3 Urge symptoms or urge incontinence Show forest plot | 1 | Risk Ratio (M‐H, Fixed, 95% CI) | Totals not selected | |
| Analysis 5.3  Comparison 5 Needle suspension versus anterior vaginal repair, Outcome 3 Urge symptoms or urge incontinence. | ||||
| 3.1 Objective/genuine stress incontinence (only) | 0 | Risk Ratio (M‐H, Fixed, 95% CI) | 0.0 [0.0, 0.0] | |
| 3.2 Subjective stress incontinence (only) | 0 | Risk Ratio (M‐H, Fixed, 95% CI) | 0.0 [0.0, 0.0] | |
| 3.3 Mixed incontinence | 1 | Risk Ratio (M‐H, Fixed, 95% CI) | 0.0 [0.0, 0.0] | |
| 4 Voiding dysfunction after 3 months Show forest plot | 3 | Risk Ratio (M‐H, Fixed, 95% CI) | Totals not selected | |
| Analysis 5.4 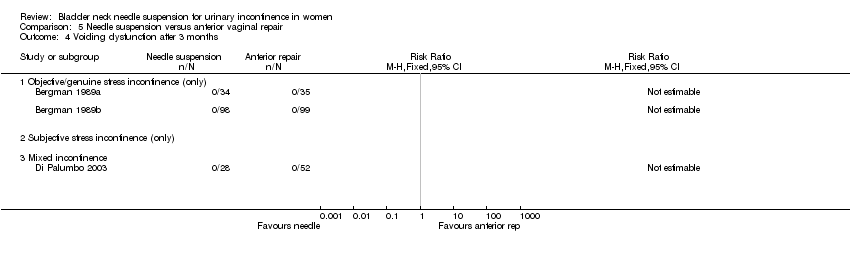 Comparison 5 Needle suspension versus anterior vaginal repair, Outcome 4 Voiding dysfunction after 3 months. | ||||
| 4.1 Objective/genuine stress incontinence (only) | 2 | Risk Ratio (M‐H, Fixed, 95% CI) | 0.0 [0.0, 0.0] | |
| 4.2 Subjective stress incontinence (only) | 0 | Risk Ratio (M‐H, Fixed, 95% CI) | 0.0 [0.0, 0.0] | |
| 4.3 Mixed incontinence | 1 | Risk Ratio (M‐H, Fixed, 95% CI) | 0.0 [0.0, 0.0] | |
| 5 Peri‐operative surgical complications Show forest plot | 1 | Risk Ratio (M‐H, Fixed, 95% CI) | Totals not selected | |
| Analysis 5.5  Comparison 5 Needle suspension versus anterior vaginal repair, Outcome 5 Peri‐operative surgical complications. | ||||
| 5.1 Objective/genuine stress incontinence (only) | 0 | Risk Ratio (M‐H, Fixed, 95% CI) | 0.0 [0.0, 0.0] | |
| 5.2 Subjective stress incontinence (only) | 0 | Risk Ratio (M‐H, Fixed, 95% CI) | 0.0 [0.0, 0.0] | |
| 5.3 Mixed incontinence | 1 | Risk Ratio (M‐H, Fixed, 95% CI) | 0.0 [0.0, 0.0] | |
| 6 New or persistent prolapse Show forest plot | 1 | Risk Ratio (M‐H, Fixed, 95% CI) | Totals not selected | |
| Analysis 5.6  Comparison 5 Needle suspension versus anterior vaginal repair, Outcome 6 New or persistent prolapse. | ||||
| 6.1 Objective/genuine stress incontinence (only) | 0 | Risk Ratio (M‐H, Fixed, 95% CI) | 0.0 [0.0, 0.0] | |
| 6.2 Subjective stress incontinence (only) | 0 | Risk Ratio (M‐H, Fixed, 95% CI) | 0.0 [0.0, 0.0] | |
| 6.3 Mixed incontinence | 1 | Risk Ratio (M‐H, Fixed, 95% CI) | 0.0 [0.0, 0.0] | |
| Outcome or subgroup title | No. of studies | No. of participants | Statistical method | Effect size |
| 1 Number not cured (worse, unchanged or improved) within first year Show forest plot | 1 | 90 | Risk Ratio (M‐H, Fixed, 95% CI) | 2.87 [0.31, 26.56] |
| Analysis 6.1 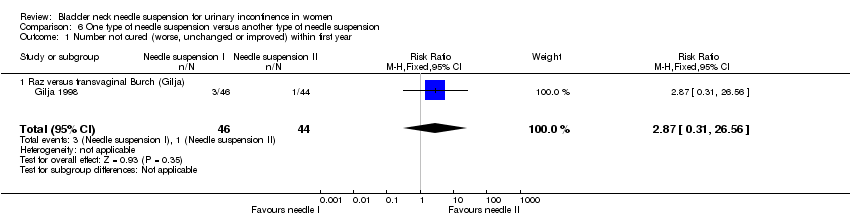 Comparison 6 One type of needle suspension versus another type of needle suspension, Outcome 1 Number not cured (worse, unchanged or improved) within first year. | ||||
| 1.1 Raz versus transvaginal Burch (Gilja) | 1 | 90 | Risk Ratio (M‐H, Fixed, 95% CI) | 2.87 [0.31, 26.56] |
| 2 Number not cured (worse, unchanged or improved) after first year Show forest plot | 1 | 90 | Risk Ratio (M‐H, Fixed, 95% CI) | 1.67 [0.53, 5.32] |
| Analysis 6.2  Comparison 6 One type of needle suspension versus another type of needle suspension, Outcome 2 Number not cured (worse, unchanged or improved) after first year. | ||||
| 2.1 Raz versus transvaginal Burch (Gilja) | 1 | 90 | Risk Ratio (M‐H, Fixed, 95% CI) | 1.67 [0.53, 5.32] |
| 3 Urge symptoms or urge incontinence Show forest plot | 1 | 90 | Risk Ratio (M‐H, Fixed, 95% CI) | 1.59 [0.40, 6.28] |
| Analysis 6.3 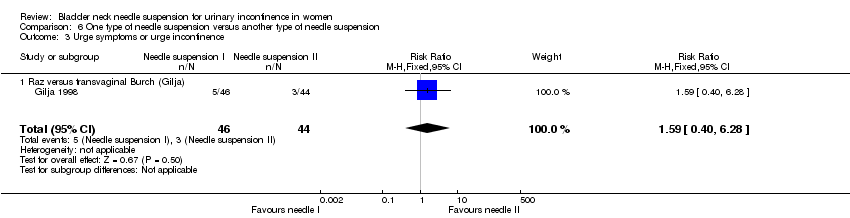 Comparison 6 One type of needle suspension versus another type of needle suspension, Outcome 3 Urge symptoms or urge incontinence. | ||||
| 3.1 Raz versus transvaginal Burch (Gilja) | 1 | 90 | Risk Ratio (M‐H, Fixed, 95% CI) | 1.59 [0.40, 6.28] |
| Outcome or subgroup title | No. of studies | No. of participants | Statistical method | Effect size |
| 1 Number not cured (worse, unchanged or improved) within first year Show forest plot | 1 | 20 | Risk Ratio (M‐H, Fixed, 95% CI) | 0.17 [0.01, 2.94] |
| Analysis 7.1  Comparison 7 One type of suture versus another type of suture, Outcome 1 Number not cured (worse, unchanged or improved) within first year. | ||||
| 2 Number not improved (worse or unchanged) within first year Show forest plot | 1 | 20 | Risk Ratio (M‐H, Fixed, 95% CI) | 0.4 [0.02, 8.78] |
| Analysis 7.2  Comparison 7 One type of suture versus another type of suture, Outcome 2 Number not improved (worse or unchanged) within first year. | ||||
| 3 Urge symptoms or urge incontinence Show forest plot | 1 | 20 | Risk Ratio (M‐H, Fixed, 95% CI) | 0.24 [0.01, 4.44] |
| Analysis 7.3  Comparison 7 One type of suture versus another type of suture, Outcome 3 Urge symptoms or urge incontinence. | ||||
| 4 Pain score Show forest plot | 1 | Mean Difference (IV, Fixed, 95% CI) | Subtotals only | |
| Analysis 7.4  Comparison 7 One type of suture versus another type of suture, Outcome 4 Pain score. | ||||
| 4.1 At one month | 1 | 19 | Mean Difference (IV, Fixed, 95% CI) | ‐0.60 [‐1.87, 0.67] |
| 4.2 At three months | 1 | 20 | Mean Difference (IV, Fixed, 95% CI) | ‐0.92 [‐1.77, ‐0.07] |

Comparison 1 Needle suspension versus open abdominal retropubic suspension, Outcome 1 Number not cured (worse, unchanged or improved) within first year.

Comparison 1 Needle suspension versus open abdominal retropubic suspension, Outcome 2 Number not cured (worse, unchanged or improved) after first year.
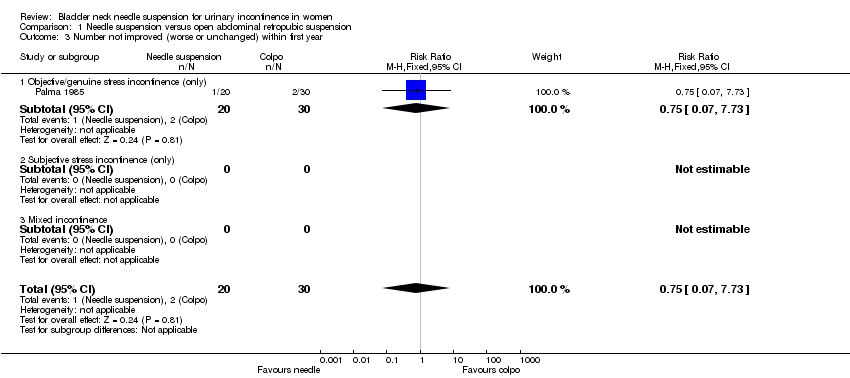
Comparison 1 Needle suspension versus open abdominal retropubic suspension, Outcome 3 Number not improved (worse or unchanged) within first year.

Comparison 1 Needle suspension versus open abdominal retropubic suspension, Outcome 4 Number not improved (worse or unchanged) after first year.

Comparison 1 Needle suspension versus open abdominal retropubic suspension, Outcome 5 Urge symptoms or urge incontinence.
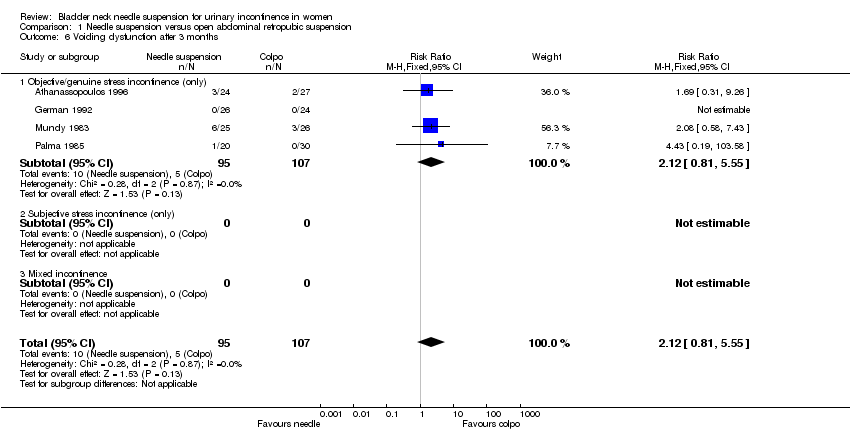
Comparison 1 Needle suspension versus open abdominal retropubic suspension, Outcome 6 Voiding dysfunction after 3 months.

Comparison 1 Needle suspension versus open abdominal retropubic suspension, Outcome 7 Detrusor overactivity (objective diagnosis by urodynamics).

Comparison 1 Needle suspension versus open abdominal retropubic suspension, Outcome 8 New or persistent prolapse.

Comparison 1 Needle suspension versus open abdominal retropubic suspension, Outcome 9 Peri‐operative surgical complications.
| Study | Needle suspension | Abdominal suspension |
| Athanassopoulos 1996 | Mean length of stay: 3 days (range 6 to 12) | Mean length of stay: 5.8 days (range 4 to 11) |
| German 1992 | Mean length of stay: 7 days | Mean length of stay: 8.3 days |
Comparison 1 Needle suspension versus open abdominal retropubic suspension, Outcome 10 Length of stay/time to return to normal function.

Comparison 2 Needle suspension versus open abdominal retropubic suspension (no previous surgery), Outcome 1 Number not cured (worse, unchanged or improved) within first year.

Comparison 2 Needle suspension versus open abdominal retropubic suspension (no previous surgery), Outcome 2 Number not cured (worse, unchanged or improved) after first year.
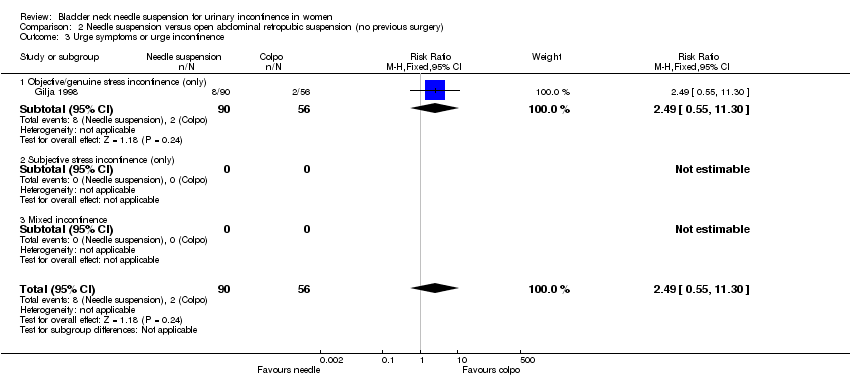
Comparison 2 Needle suspension versus open abdominal retropubic suspension (no previous surgery), Outcome 3 Urge symptoms or urge incontinence.
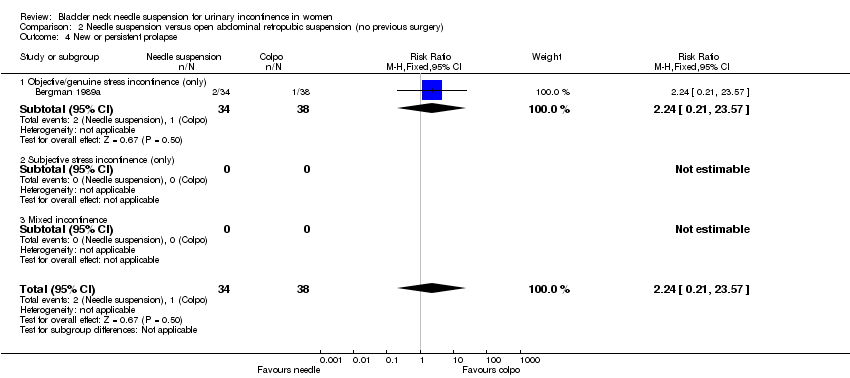
Comparison 2 Needle suspension versus open abdominal retropubic suspension (no previous surgery), Outcome 4 New or persistent prolapse.

Comparison 3 Needle suspension versus open abdominal retropubic suspension (mixed population, some after previous surgery), Outcome 1 Number not cured (worse, unchanged or improved) within first year.

Comparison 3 Needle suspension versus open abdominal retropubic suspension (mixed population, some after previous surgery), Outcome 2 Number not cured (worse, unchanged or improved) after first year.

Comparison 3 Needle suspension versus open abdominal retropubic suspension (mixed population, some after previous surgery), Outcome 3 Number not improved (worse or unchanged) within first year.
Comparison 3 Needle suspension versus open abdominal retropubic suspension (mixed population, some after previous surgery), Outcome 4 Number not improved (worse or unchanged) after first year.
Comparison 3 Needle suspension versus open abdominal retropubic suspension (mixed population, some after previous surgery), Outcome 5 Urge symptoms or urge incontinence.

Comparison 3 Needle suspension versus open abdominal retropubic suspension (mixed population, some after previous surgery), Outcome 6 Voiding dysfunction after 3 months.

Comparison 3 Needle suspension versus open abdominal retropubic suspension (mixed population, some after previous surgery), Outcome 7 Detrusor overactivity (objective diagnosis by urodynamics).

Comparison 3 Needle suspension versus open abdominal retropubic suspension (mixed population, some after previous surgery), Outcome 8 Peri‐operative surgical complications.
Comparison 4 Needle suspension versus suburethral sling operations, Outcome 1 Number not cured (worse, unchanged or improved) within first year.

Comparison 4 Needle suspension versus suburethral sling operations, Outcome 2 Number not cured (worse, unchanged or improved) after first year.

Comparison 4 Needle suspension versus suburethral sling operations, Outcome 3 Urge symptoms or urge incontinence.

Comparison 4 Needle suspension versus suburethral sling operations, Outcome 4 Voiding dysfunction after 3 months.

Comparison 4 Needle suspension versus suburethral sling operations, Outcome 5 Detrusor overactivity (objective diagnosis by urodynamics).
Comparison 4 Needle suspension versus suburethral sling operations, Outcome 6 Peri‐operative surgical complications.

Comparison 4 Needle suspension versus suburethral sling operations, Outcome 7 Length of inpatient stay.
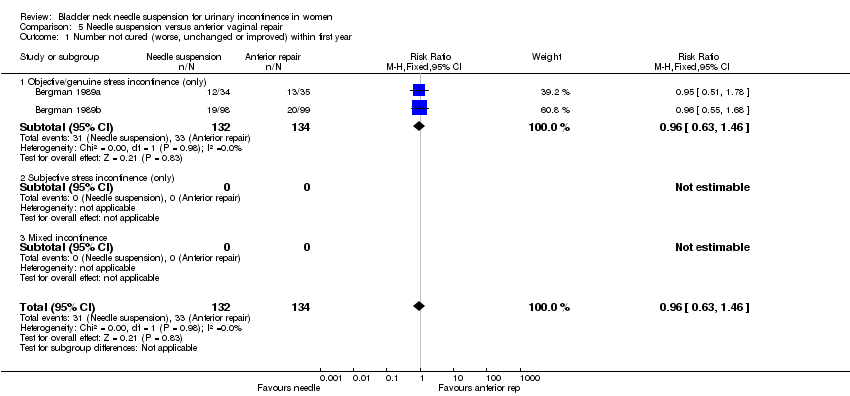
Comparison 5 Needle suspension versus anterior vaginal repair, Outcome 1 Number not cured (worse, unchanged or improved) within first year.
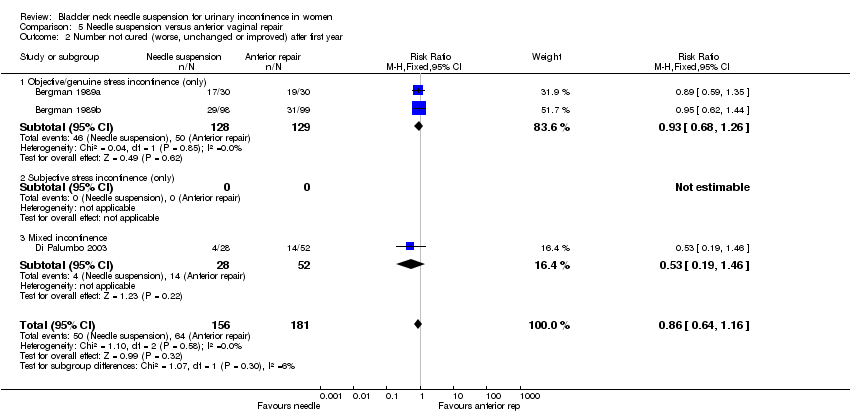
Comparison 5 Needle suspension versus anterior vaginal repair, Outcome 2 Number not cured (worse, unchanged or improved) after first year.
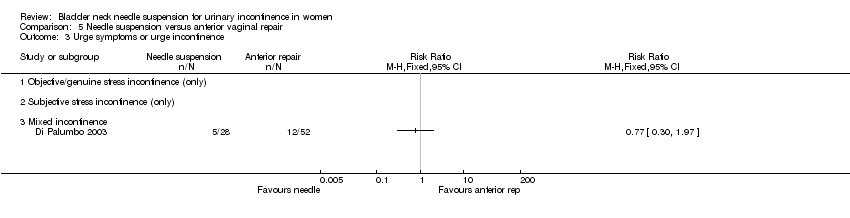
Comparison 5 Needle suspension versus anterior vaginal repair, Outcome 3 Urge symptoms or urge incontinence.

Comparison 5 Needle suspension versus anterior vaginal repair, Outcome 4 Voiding dysfunction after 3 months.

Comparison 5 Needle suspension versus anterior vaginal repair, Outcome 5 Peri‐operative surgical complications.

Comparison 5 Needle suspension versus anterior vaginal repair, Outcome 6 New or persistent prolapse.

Comparison 6 One type of needle suspension versus another type of needle suspension, Outcome 1 Number not cured (worse, unchanged or improved) within first year.

Comparison 6 One type of needle suspension versus another type of needle suspension, Outcome 2 Number not cured (worse, unchanged or improved) after first year.

Comparison 6 One type of needle suspension versus another type of needle suspension, Outcome 3 Urge symptoms or urge incontinence.

Comparison 7 One type of suture versus another type of suture, Outcome 1 Number not cured (worse, unchanged or improved) within first year.
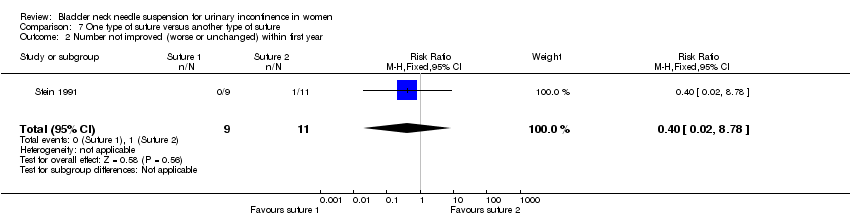
Comparison 7 One type of suture versus another type of suture, Outcome 2 Number not improved (worse or unchanged) within first year.
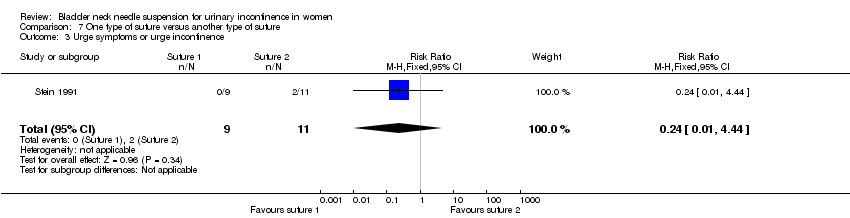
Comparison 7 One type of suture versus another type of suture, Outcome 3 Urge symptoms or urge incontinence.

Comparison 7 One type of suture versus another type of suture, Outcome 4 Pain score.
| Outcome or subgroup title | No. of studies | No. of participants | Statistical method | Effect size |
| 1 Number not cured (worse, unchanged or improved) within first year Show forest plot | 5 | 517 | Risk Ratio (M‐H, Fixed, 95% CI) | 1.70 [1.11, 2.60] |
| 1.1 Objective/genuine stress incontinence (only) | 5 | 517 | Risk Ratio (M‐H, Fixed, 95% CI) | 1.70 [1.11, 2.60] |
| 1.2 Subjective stress incontinence (only) | 0 | 0 | Risk Ratio (M‐H, Fixed, 95% CI) | 0.0 [0.0, 0.0] |
| 1.3 Mixed incontinence | 0 | 0 | Risk Ratio (M‐H, Fixed, 95% CI) | 0.0 [0.0, 0.0] |
| 2 Number not cured (worse, unchanged or improved) after first year Show forest plot | 7 | 610 | Risk Ratio (M‐H, Fixed, 95% CI) | 2.00 [1.47, 2.72] |
| 2.1 Objective/genuine stress incontinence (only) | 7 | 610 | Risk Ratio (M‐H, Fixed, 95% CI) | 2.00 [1.47, 2.72] |
| 2.2 Subjective stress incontinence (only) | 0 | 0 | Risk Ratio (M‐H, Fixed, 95% CI) | 0.0 [0.0, 0.0] |
| 2.3 Mixed incontinence | 0 | 0 | Risk Ratio (M‐H, Fixed, 95% CI) | 0.0 [0.0, 0.0] |
| 3 Number not improved (worse or unchanged) within first year Show forest plot | 1 | 50 | Risk Ratio (M‐H, Fixed, 95% CI) | 0.75 [0.07, 7.73] |
| 3.1 Objective/genuine stress incontinence (only) | 1 | 50 | Risk Ratio (M‐H, Fixed, 95% CI) | 0.75 [0.07, 7.73] |
| 3.2 Subjective stress incontinence (only) | 0 | 0 | Risk Ratio (M‐H, Fixed, 95% CI) | 0.0 [0.0, 0.0] |
| 3.3 Mixed incontinence | 0 | 0 | Risk Ratio (M‐H, Fixed, 95% CI) | 0.0 [0.0, 0.0] |
| 4 Number not improved (worse or unchanged) after first year Show forest plot | 1 | 51 | Risk Ratio (M‐H, Fixed, 95% CI) | 1.5 [0.37, 6.04] |
| 4.1 Objective/genuine stress incontinence (only) | 1 | 51 | Risk Ratio (M‐H, Fixed, 95% CI) | 1.5 [0.37, 6.04] |
| 4.2 Subjective stress incontinence (only) | 0 | 0 | Risk Ratio (M‐H, Fixed, 95% CI) | 0.0 [0.0, 0.0] |
| 4.3 Mixed incontinence | 0 | 0 | Risk Ratio (M‐H, Fixed, 95% CI) | 0.0 [0.0, 0.0] |
| 5 Urge symptoms or urge incontinence Show forest plot | 4 | 297 | Risk Ratio (M‐H, Fixed, 95% CI) | 1.80 [0.71, 4.56] |
| 5.1 Objective/genuine stress incontinence (only) | 4 | 297 | Risk Ratio (M‐H, Fixed, 95% CI) | 1.80 [0.71, 4.56] |
| 5.2 Subjective stress incontinence (only) | 0 | 0 | Risk Ratio (M‐H, Fixed, 95% CI) | 0.0 [0.0, 0.0] |
| 5.3 Mixed incontinence | 0 | 0 | Risk Ratio (M‐H, Fixed, 95% CI) | 0.0 [0.0, 0.0] |
| 6 Voiding dysfunction after 3 months Show forest plot | 4 | 202 | Risk Ratio (M‐H, Fixed, 95% CI) | 2.12 [0.81, 5.55] |
| 6.1 Objective/genuine stress incontinence (only) | 4 | 202 | Risk Ratio (M‐H, Fixed, 95% CI) | 2.12 [0.81, 5.55] |
| 6.2 Subjective stress incontinence (only) | 0 | 0 | Risk Ratio (M‐H, Fixed, 95% CI) | 0.0 [0.0, 0.0] |
| 6.3 Mixed incontinence | 0 | 0 | Risk Ratio (M‐H, Fixed, 95% CI) | 0.0 [0.0, 0.0] |
| 7 Detrusor overactivity (objective diagnosis by urodynamics) Show forest plot | 2 | 101 | Risk Ratio (M‐H, Fixed, 95% CI) | 2.91 [0.73, 11.58] |
| 7.1 Objective/genuine stress incontinence (only) | 2 | 101 | Risk Ratio (M‐H, Fixed, 95% CI) | 2.91 [0.73, 11.58] |
| 7.2 Subjective stress incontinence (only) | 0 | 0 | Risk Ratio (M‐H, Fixed, 95% CI) | 0.0 [0.0, 0.0] |
| 7.3 Mixed incontinence | 0 | 0 | Risk Ratio (M‐H, Fixed, 95% CI) | 0.0 [0.0, 0.0] |
| 8 New or persistent prolapse Show forest plot | 1 | 72 | Risk Ratio (M‐H, Fixed, 95% CI) | 2.24 [0.21, 23.57] |
| 8.1 Objective/genuine stress incontinence (only) | 1 | 72 | Risk Ratio (M‐H, Fixed, 95% CI) | 2.24 [0.21, 23.57] |
| 8.2 Subjective stress incontinence (only) | 0 | 0 | Risk Ratio (M‐H, Fixed, 95% CI) | 0.0 [0.0, 0.0] |
| 8.3 Mixed incontinence | 0 | 0 | Risk Ratio (M‐H, Fixed, 95% CI) | 0.0 [0.0, 0.0] |
| 9 Peri‐operative surgical complications Show forest plot | 3 | 152 | Risk Ratio (M‐H, Fixed, 95% CI) | 1.44 [0.73, 2.83] |
| 9.1 Objective/genuine stress incontinence (only) | 3 | 152 | Risk Ratio (M‐H, Fixed, 95% CI) | 1.44 [0.73, 2.83] |
| 9.2 Subjective stress incontinence (only) | 0 | 0 | Risk Ratio (M‐H, Fixed, 95% CI) | 0.0 [0.0, 0.0] |
| 9.3 Mixed incontinence | 0 | 0 | Risk Ratio (M‐H, Fixed, 95% CI) | 0.0 [0.0, 0.0] |
| 10 Length of stay/time to return to normal function Show forest plot | Other data | No numeric data | ||
| Outcome or subgroup title | No. of studies | No. of participants | Statistical method | Effect size |
| 1 Number not cured (worse, unchanged or improved) within first year Show forest plot | 3 | 417 | Risk Ratio (M‐H, Fixed, 95% CI) | 2.05 [1.20, 3.50] |
| 1.1 Objective/genuine stress incontinence (only) | 3 | 417 | Risk Ratio (M‐H, Fixed, 95% CI) | 2.05 [1.20, 3.50] |
| 1.2 Subjective stress incontinence (only) | 0 | 0 | Risk Ratio (M‐H, Fixed, 95% CI) | 0.0 [0.0, 0.0] |
| 1.3 Mixed incontinence | 0 | 0 | Risk Ratio (M‐H, Fixed, 95% CI) | 0.0 [0.0, 0.0] |
| 2 Number not cured (worse, unchanged or improved) after first year Show forest plot | 3 | 408 | Risk Ratio (M‐H, Fixed, 95% CI) | 2.37 [1.54, 3.66] |
| 2.1 Objective/genuine stress incontinence (only) | 3 | 408 | Risk Ratio (M‐H, Fixed, 95% CI) | 2.37 [1.54, 3.66] |
| 2.2 Subjective stress incontinence (only) | 0 | 0 | Risk Ratio (M‐H, Fixed, 95% CI) | 0.0 [0.0, 0.0] |
| 2.3 Mixed incontinence | 0 | 0 | Risk Ratio (M‐H, Fixed, 95% CI) | 0.0 [0.0, 0.0] |
| 3 Urge symptoms or urge incontinence Show forest plot | 1 | 146 | Risk Ratio (M‐H, Fixed, 95% CI) | 2.49 [0.55, 11.30] |
| 3.1 Objective/genuine stress incontinence (only) | 1 | 146 | Risk Ratio (M‐H, Fixed, 95% CI) | 2.49 [0.55, 11.30] |
| 3.2 Subjective stress incontinence (only) | 0 | 0 | Risk Ratio (M‐H, Fixed, 95% CI) | 0.0 [0.0, 0.0] |
| 3.3 Mixed incontinence | 0 | 0 | Risk Ratio (M‐H, Fixed, 95% CI) | 0.0 [0.0, 0.0] |
| 4 New or persistent prolapse Show forest plot | 1 | 72 | Risk Ratio (M‐H, Fixed, 95% CI) | 2.24 [0.21, 23.57] |
| 4.1 Objective/genuine stress incontinence (only) | 1 | 72 | Risk Ratio (M‐H, Fixed, 95% CI) | 2.24 [0.21, 23.57] |
| 4.2 Subjective stress incontinence (only) | 0 | 0 | Risk Ratio (M‐H, Fixed, 95% CI) | 0.0 [0.0, 0.0] |
| 4.3 Mixed incontinence | 0 | 0 | Risk Ratio (M‐H, Fixed, 95% CI) | 0.0 [0.0, 0.0] |
| Outcome or subgroup title | No. of studies | No. of participants | Statistical method | Effect size |
| 1 Number not cured (worse, unchanged or improved) within first year Show forest plot | 2 | 100 | Risk Ratio (M‐H, Fixed, 95% CI) | 1.12 [0.55, 2.29] |
| 1.1 Objective/genuine stress incontinence (only) | 2 | 100 | Risk Ratio (M‐H, Fixed, 95% CI) | 1.12 [0.55, 2.29] |
| 1.2 Subjective stress incontinence (only) | 0 | 0 | Risk Ratio (M‐H, Fixed, 95% CI) | 0.0 [0.0, 0.0] |
| 1.3 Mixed incontinence | 0 | 0 | Risk Ratio (M‐H, Fixed, 95% CI) | 0.0 [0.0, 0.0] |
| 2 Number not cured (worse, unchanged or improved) after first year Show forest plot | 4 | 202 | Risk Ratio (M‐H, Fixed, 95% CI) | 1.61 [1.04, 2.49] |
| 2.1 Objective/genuine stress incontinence (only) | 4 | 202 | Risk Ratio (M‐H, Fixed, 95% CI) | 1.61 [1.04, 2.49] |
| 2.2 Subjective stress incontinence (only) | 0 | 0 | Risk Ratio (M‐H, Fixed, 95% CI) | 0.0 [0.0, 0.0] |
| 2.3 Mixed incontinence | 0 | 0 | Risk Ratio (M‐H, Fixed, 95% CI) | 0.0 [0.0, 0.0] |
| 3 Number not improved (worse or unchanged) within first year Show forest plot | 1 | 50 | Risk Ratio (M‐H, Fixed, 95% CI) | 0.75 [0.07, 7.73] |
| 3.1 Objective/genuine stress incontinence (only) | 1 | 50 | Risk Ratio (M‐H, Fixed, 95% CI) | 0.75 [0.07, 7.73] |
| 3.2 Subjective stress incontinence (only) | 0 | 0 | Risk Ratio (M‐H, Fixed, 95% CI) | 0.0 [0.0, 0.0] |
| 3.3 Mixed incontinence | 0 | 0 | Risk Ratio (M‐H, Fixed, 95% CI) | 0.0 [0.0, 0.0] |
| 4 Number not improved (worse or unchanged) after first year Show forest plot | 1 | 51 | Risk Ratio (M‐H, Fixed, 95% CI) | 1.5 [0.37, 6.04] |
| 4.1 Objective/genuine stress incontinence (only) | 1 | 51 | Risk Ratio (M‐H, Fixed, 95% CI) | 1.5 [0.37, 6.04] |
| 4.2 Subjective stress incontinence (only) | 0 | 0 | Risk Ratio (M‐H, Fixed, 95% CI) | 0.0 [0.0, 0.0] |
| 4.3 Mixed incontinence | 0 | 0 | Risk Ratio (M‐H, Fixed, 95% CI) | 0.0 [0.0, 0.0] |
| 5 Urge symptoms or urge incontinence Show forest plot | 3 | 151 | Risk Ratio (M‐H, Fixed, 95% CI) | 1.40 [0.42, 4.59] |
| 5.1 Objective/genuine stress incontinence (only) | 3 | 151 | Risk Ratio (M‐H, Fixed, 95% CI) | 1.40 [0.42, 4.59] |
| 5.2 Subjective stress incontinence (only) | 0 | 0 | Risk Ratio (M‐H, Fixed, 95% CI) | 0.0 [0.0, 0.0] |
| 5.3 Mixed incontinence | 0 | 0 | Risk Ratio (M‐H, Fixed, 95% CI) | 0.0 [0.0, 0.0] |
| 6 Voiding dysfunction after 3 months Show forest plot | 4 | 202 | Risk Ratio (M‐H, Fixed, 95% CI) | 2.12 [0.81, 5.55] |
| 6.1 Objective/genuine stress incontinence (only) | 4 | 202 | Risk Ratio (M‐H, Fixed, 95% CI) | 2.12 [0.81, 5.55] |
| 6.2 Subjective stress incontinence (only) | 0 | 0 | Risk Ratio (M‐H, Fixed, 95% CI) | 0.0 [0.0, 0.0] |
| 6.3 Mixed incontinence | 0 | 0 | Risk Ratio (M‐H, Fixed, 95% CI) | 0.0 [0.0, 0.0] |
| 7 Detrusor overactivity (objective diagnosis by urodynamics) Show forest plot | 2 | 101 | Risk Ratio (M‐H, Fixed, 95% CI) | 2.91 [0.73, 11.58] |
| 7.1 Objective/genuine stress incontinence (only) | 2 | 101 | Risk Ratio (M‐H, Fixed, 95% CI) | 2.91 [0.73, 11.58] |
| 7.2 Subjective stress incontinence (only) | 0 | 0 | Risk Ratio (M‐H, Fixed, 95% CI) | 0.0 [0.0, 0.0] |
| 7.3 Mixed incontinence | 0 | 0 | Risk Ratio (M‐H, Fixed, 95% CI) | 0.0 [0.0, 0.0] |
| 8 Peri‐operative surgical complications Show forest plot | 3 | 152 | Risk Ratio (M‐H, Fixed, 95% CI) | 1.44 [0.73, 2.83] |
| 8.1 Objective/genuine stress incontinence (only) | 3 | 152 | Risk Ratio (M‐H, Fixed, 95% CI) | 1.44 [0.73, 2.83] |
| 8.2 Subjective stress incontinence (only) | 0 | 0 | Risk Ratio (M‐H, Fixed, 95% CI) | 0.0 [0.0, 0.0] |
| 8.3 Mixed incontinence | 0 | 0 | Risk Ratio (M‐H, Fixed, 95% CI) | 0.0 [0.0, 0.0] |
| Outcome or subgroup title | No. of studies | No. of participants | Statistical method | Effect size |
| 1 Number not cured (worse, unchanged or improved) within first year Show forest plot | 1 | 20 | Risk Ratio (M‐H, Fixed, 95% CI) | 2.0 [0.21, 18.69] |
| 1.1 Objective/genuine stress incontinence (only) | 1 | 20 | Risk Ratio (M‐H, Fixed, 95% CI) | 2.0 [0.21, 18.69] |
| 1.2 Subjective stress incontinence (only) | 0 | 0 | Risk Ratio (M‐H, Fixed, 95% CI) | 0.0 [0.0, 0.0] |
| 1.3 Mixed incontinence | 0 | 0 | Risk Ratio (M‐H, Fixed, 95% CI) | 0.0 [0.0, 0.0] |
| 2 Number not cured (worse, unchanged or improved) after first year Show forest plot | 1 | 20 | Risk Ratio (M‐H, Fixed, 95% CI) | 3.0 [0.37, 24.17] |
| 2.1 Objective/genuine stress incontinence (only) | 1 | 20 | Risk Ratio (M‐H, Fixed, 95% CI) | 3.0 [0.37, 24.17] |
| 2.2 Subjective stress incontinence (only) | 0 | 0 | Risk Ratio (M‐H, Fixed, 95% CI) | 0.0 [0.0, 0.0] |
| 2.3 Mixed incontinence | 0 | 0 | Risk Ratio (M‐H, Fixed, 95% CI) | 0.0 [0.0, 0.0] |
| 3 Urge symptoms or urge incontinence Show forest plot | 1 | 20 | Risk Ratio (M‐H, Fixed, 95% CI) | 0.6 [0.19, 1.86] |
| 3.1 Objective/genuine stress incontinence (only) | 1 | 20 | Risk Ratio (M‐H, Fixed, 95% CI) | 0.6 [0.19, 1.86] |
| 3.2 Subjective stress incontinence (only) | 0 | 0 | Risk Ratio (M‐H, Fixed, 95% CI) | 0.0 [0.0, 0.0] |
| 3.3 Mixed incontinence | 0 | 0 | Risk Ratio (M‐H, Fixed, 95% CI) | 0.0 [0.0, 0.0] |
| 4 Voiding dysfunction after 3 months Show forest plot | 1 | 20 | Risk Ratio (M‐H, Fixed, 95% CI) | 0.5 [0.12, 2.14] |
| 4.1 Objective/genuine stress incontinence (only) | 1 | 20 | Risk Ratio (M‐H, Fixed, 95% CI) | 0.5 [0.12, 2.14] |
| 4.2 Subjective stress incontinence (only) | 0 | 0 | Risk Ratio (M‐H, Fixed, 95% CI) | 0.0 [0.0, 0.0] |
| 4.3 Mixed incontinence | 0 | 0 | Risk Ratio (M‐H, Fixed, 95% CI) | 0.0 [0.0, 0.0] |
| 5 Detrusor overactivity (objective diagnosis by urodynamics) Show forest plot | 1 | 20 | Risk Ratio (M‐H, Fixed, 95% CI) | 0.5 [0.05, 4.67] |
| 5.1 Objective/genuine stress incontinence (only) | 1 | 20 | Risk Ratio (M‐H, Fixed, 95% CI) | 0.5 [0.05, 4.67] |
| 5.2 Subjective stress incontinence (only) | 0 | 0 | Risk Ratio (M‐H, Fixed, 95% CI) | 0.0 [0.0, 0.0] |
| 5.3 Mixed incontinence | 0 | 0 | Risk Ratio (M‐H, Fixed, 95% CI) | 0.0 [0.0, 0.0] |
| 6 Peri‐operative surgical complications Show forest plot | 1 | 20 | Risk Ratio (M‐H, Fixed, 95% CI) | 0.22 [0.06, 0.78] |
| 6.1 Objective/genuine stress incontinence (only) | 1 | 20 | Risk Ratio (M‐H, Fixed, 95% CI) | 0.22 [0.06, 0.78] |
| 6.2 Subjective stress incontinence (only) | 0 | 0 | Risk Ratio (M‐H, Fixed, 95% CI) | 0.0 [0.0, 0.0] |
| 6.3 Mixed incontinence | 0 | 0 | Risk Ratio (M‐H, Fixed, 95% CI) | 0.0 [0.0, 0.0] |
| 7 Length of inpatient stay Show forest plot | 1 | 20 | Mean Difference (IV, Fixed, 95% CI) | ‐13.0 [‐19.00, ‐5.00] |
| 7.1 Objective/genuine stress incontinence (only) | 1 | 20 | Mean Difference (IV, Fixed, 95% CI) | ‐13.0 [‐19.00, ‐5.00] |
| 7.2 Subjective stress incontinence (only) | 0 | 0 | Mean Difference (IV, Fixed, 95% CI) | 0.0 [0.0, 0.0] |
| 7.3 Mixed incontinence | 0 | 0 | Mean Difference (IV, Fixed, 95% CI) | 0.0 [0.0, 0.0] |
| Outcome or subgroup title | No. of studies | No. of participants | Statistical method | Effect size |
| 1 Number not cured (worse, unchanged or improved) within first year Show forest plot | 2 | 266 | Risk Ratio (M‐H, Fixed, 95% CI) | 0.96 [0.63, 1.46] |
| 1.1 Objective/genuine stress incontinence (only) | 2 | 266 | Risk Ratio (M‐H, Fixed, 95% CI) | 0.96 [0.63, 1.46] |
| 1.2 Subjective stress incontinence (only) | 0 | 0 | Risk Ratio (M‐H, Fixed, 95% CI) | 0.0 [0.0, 0.0] |
| 1.3 Mixed incontinence | 0 | 0 | Risk Ratio (M‐H, Fixed, 95% CI) | 0.0 [0.0, 0.0] |
| 2 Number not cured (worse, unchanged or improved) after first year Show forest plot | 3 | 337 | Risk Ratio (M‐H, Fixed, 95% CI) | 0.86 [0.64, 1.16] |
| 2.1 Objective/genuine stress incontinence (only) | 2 | 257 | Risk Ratio (M‐H, Fixed, 95% CI) | 0.93 [0.68, 1.26] |
| 2.2 Subjective stress incontinence (only) | 0 | 0 | Risk Ratio (M‐H, Fixed, 95% CI) | 0.0 [0.0, 0.0] |
| 2.3 Mixed incontinence | 1 | 80 | Risk Ratio (M‐H, Fixed, 95% CI) | 0.53 [0.19, 1.46] |
| 3 Urge symptoms or urge incontinence Show forest plot | 1 | Risk Ratio (M‐H, Fixed, 95% CI) | Totals not selected | |
| 3.1 Objective/genuine stress incontinence (only) | 0 | Risk Ratio (M‐H, Fixed, 95% CI) | 0.0 [0.0, 0.0] | |
| 3.2 Subjective stress incontinence (only) | 0 | Risk Ratio (M‐H, Fixed, 95% CI) | 0.0 [0.0, 0.0] | |
| 3.3 Mixed incontinence | 1 | Risk Ratio (M‐H, Fixed, 95% CI) | 0.0 [0.0, 0.0] | |
| 4 Voiding dysfunction after 3 months Show forest plot | 3 | Risk Ratio (M‐H, Fixed, 95% CI) | Totals not selected | |
| 4.1 Objective/genuine stress incontinence (only) | 2 | Risk Ratio (M‐H, Fixed, 95% CI) | 0.0 [0.0, 0.0] | |
| 4.2 Subjective stress incontinence (only) | 0 | Risk Ratio (M‐H, Fixed, 95% CI) | 0.0 [0.0, 0.0] | |
| 4.3 Mixed incontinence | 1 | Risk Ratio (M‐H, Fixed, 95% CI) | 0.0 [0.0, 0.0] | |
| 5 Peri‐operative surgical complications Show forest plot | 1 | Risk Ratio (M‐H, Fixed, 95% CI) | Totals not selected | |
| 5.1 Objective/genuine stress incontinence (only) | 0 | Risk Ratio (M‐H, Fixed, 95% CI) | 0.0 [0.0, 0.0] | |
| 5.2 Subjective stress incontinence (only) | 0 | Risk Ratio (M‐H, Fixed, 95% CI) | 0.0 [0.0, 0.0] | |
| 5.3 Mixed incontinence | 1 | Risk Ratio (M‐H, Fixed, 95% CI) | 0.0 [0.0, 0.0] | |
| 6 New or persistent prolapse Show forest plot | 1 | Risk Ratio (M‐H, Fixed, 95% CI) | Totals not selected | |
| 6.1 Objective/genuine stress incontinence (only) | 0 | Risk Ratio (M‐H, Fixed, 95% CI) | 0.0 [0.0, 0.0] | |
| 6.2 Subjective stress incontinence (only) | 0 | Risk Ratio (M‐H, Fixed, 95% CI) | 0.0 [0.0, 0.0] | |
| 6.3 Mixed incontinence | 1 | Risk Ratio (M‐H, Fixed, 95% CI) | 0.0 [0.0, 0.0] | |
| Outcome or subgroup title | No. of studies | No. of participants | Statistical method | Effect size |
| 1 Number not cured (worse, unchanged or improved) within first year Show forest plot | 1 | 90 | Risk Ratio (M‐H, Fixed, 95% CI) | 2.87 [0.31, 26.56] |
| 1.1 Raz versus transvaginal Burch (Gilja) | 1 | 90 | Risk Ratio (M‐H, Fixed, 95% CI) | 2.87 [0.31, 26.56] |
| 2 Number not cured (worse, unchanged or improved) after first year Show forest plot | 1 | 90 | Risk Ratio (M‐H, Fixed, 95% CI) | 1.67 [0.53, 5.32] |
| 2.1 Raz versus transvaginal Burch (Gilja) | 1 | 90 | Risk Ratio (M‐H, Fixed, 95% CI) | 1.67 [0.53, 5.32] |
| 3 Urge symptoms or urge incontinence Show forest plot | 1 | 90 | Risk Ratio (M‐H, Fixed, 95% CI) | 1.59 [0.40, 6.28] |
| 3.1 Raz versus transvaginal Burch (Gilja) | 1 | 90 | Risk Ratio (M‐H, Fixed, 95% CI) | 1.59 [0.40, 6.28] |
| Outcome or subgroup title | No. of studies | No. of participants | Statistical method | Effect size |
| 1 Number not cured (worse, unchanged or improved) within first year Show forest plot | 1 | 20 | Risk Ratio (M‐H, Fixed, 95% CI) | 0.17 [0.01, 2.94] |
| 2 Number not improved (worse or unchanged) within first year Show forest plot | 1 | 20 | Risk Ratio (M‐H, Fixed, 95% CI) | 0.4 [0.02, 8.78] |
| 3 Urge symptoms or urge incontinence Show forest plot | 1 | 20 | Risk Ratio (M‐H, Fixed, 95% CI) | 0.24 [0.01, 4.44] |
| 4 Pain score Show forest plot | 1 | Mean Difference (IV, Fixed, 95% CI) | Subtotals only | |
| 4.1 At one month | 1 | 19 | Mean Difference (IV, Fixed, 95% CI) | ‐0.60 [‐1.87, 0.67] |
| 4.2 At three months | 1 | 20 | Mean Difference (IV, Fixed, 95% CI) | ‐0.92 [‐1.77, ‐0.07] |