Bladder neck needle suspension for urinary incontinence in women
Información
- DOI:
- https://doi.org/10.1002/14651858.CD003636.pub3Copiar DOI

- Base de datos:
-
- Cochrane Database of Systematic Reviews
- Versión publicada:
-
- 17 diciembre 2014see what's new
- Tipo:
-
- Intervention
- Etapa:
-
- Review
- Grupo Editorial Cochrane:
-
Grupo Cochrane de Incontinencia
- Copyright:
-
- Copyright © 2014 The Cochrane Collaboration. Published by John Wiley & Sons, Ltd.
Cifras del artículo
Altmetric:
Citado por:
Autores
Contributions of authors
CG and KC wrote the original protocol, selected trials, extracted data separately, interpreted the results and wrote the review.
Sources of support
Internal sources
-
Chief Scientist Office, Scottish Executive Health Department, UK.
External sources
-
The National Institute for Health Research (NIHR), UK.
The National Institute for Health Research (NIHR) is the largest single funder of the Cochrane Incontinence Group.
Declarations of interest
Cathryn MA Glazener: None known
Kevin Cooper: None known
Acknowledgements
Dr Ivan Gilja provided extra information for an included trial, and Dr Jacob Ramon gave information that allowed another to be excluded. Data abstraction was also performed by Mela Lapitan, June Cody and Carlos Bezerra.
Version history
| Published | Title | Stage | Authors | Version |
| 2017 Jul 25 | Bladder neck needle suspension for urinary incontinence in women | Review | Cathryn MA Glazener, Kevin Cooper, Atefeh Mashayekhi | |
| 2014 Dec 17 | Bladder neck needle suspension for urinary incontinence in women | Review | Cathryn MA Glazener, Kevin Cooper | |
| 2004 Apr 19 | Bladder neck needle suspension for urinary incontinence in women | Review | Cathryn MA Glazener, Kevin Cooper | |
| 2002 Feb 27 | Bladder neck needle suspension for urinary incontinence in women | Review | Cathryn MA Glazener, Kevin Cooper | |
Notes
Old procedure; no new trials.
Keywords
MeSH
Medical Subject Headings (MeSH) Keywords
Medical Subject Headings Check Words
Female; Humans;
PICO
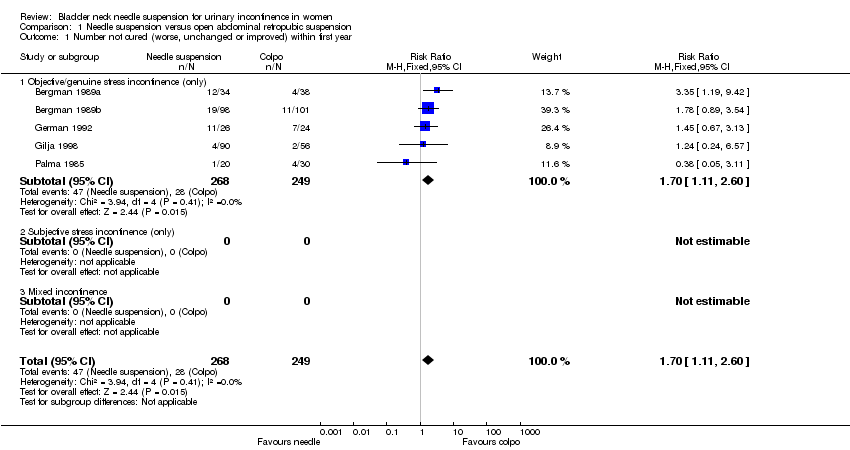
Comparison 1 Needle suspension versus open abdominal retropubic suspension, Outcome 1 Number not cured (worse, unchanged or improved) within first year.

Comparison 1 Needle suspension versus open abdominal retropubic suspension, Outcome 2 Number not cured (worse, unchanged or improved) after first year.
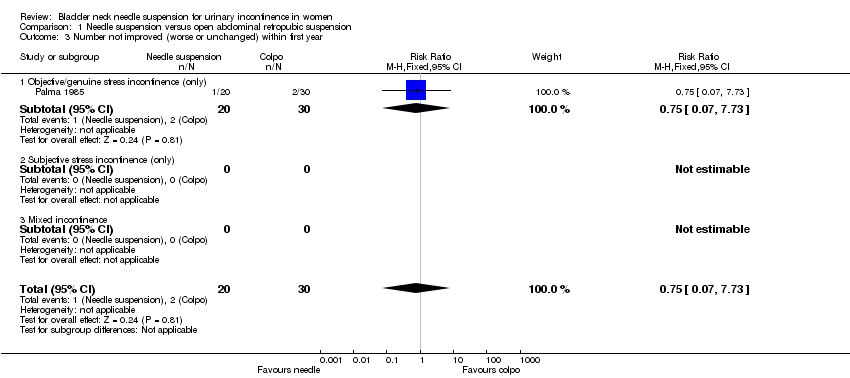
Comparison 1 Needle suspension versus open abdominal retropubic suspension, Outcome 3 Number not improved (worse or unchanged) within first year.

Comparison 1 Needle suspension versus open abdominal retropubic suspension, Outcome 4 Number not improved (worse or unchanged) after first year.

Comparison 1 Needle suspension versus open abdominal retropubic suspension, Outcome 5 Urge symptoms or urge incontinence.
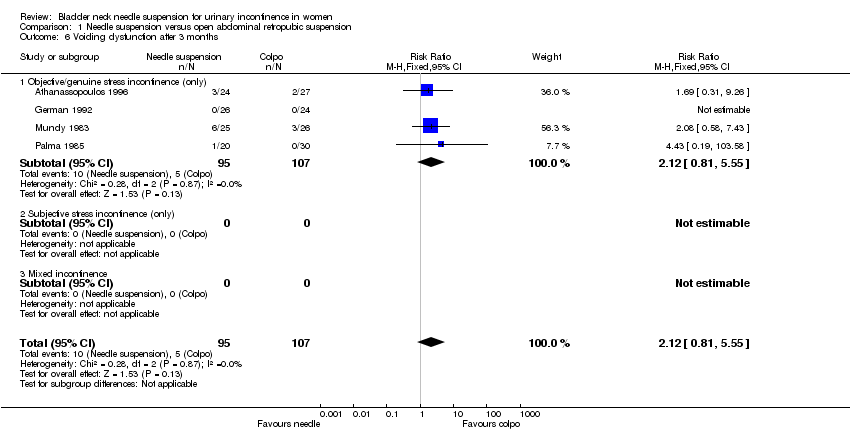
Comparison 1 Needle suspension versus open abdominal retropubic suspension, Outcome 6 Voiding dysfunction after 3 months.

Comparison 1 Needle suspension versus open abdominal retropubic suspension, Outcome 7 Detrusor overactivity (objective diagnosis by urodynamics).

Comparison 1 Needle suspension versus open abdominal retropubic suspension, Outcome 8 New or persistent prolapse.

Comparison 1 Needle suspension versus open abdominal retropubic suspension, Outcome 9 Peri‐operative surgical complications.
| Study | Needle suspension | Abdominal suspension |
| Athanassopoulos 1996 | Mean length of stay: 3 days (range 6 to 12) | Mean length of stay: 5.8 days (range 4 to 11) |
| German 1992 | Mean length of stay: 7 days | Mean length of stay: 8.3 days |
Comparison 1 Needle suspension versus open abdominal retropubic suspension, Outcome 10 Length of stay/time to return to normal function.

Comparison 2 Needle suspension versus open abdominal retropubic suspension (no previous surgery), Outcome 1 Number not cured (worse, unchanged or improved) within first year.

Comparison 2 Needle suspension versus open abdominal retropubic suspension (no previous surgery), Outcome 2 Number not cured (worse, unchanged or improved) after first year.
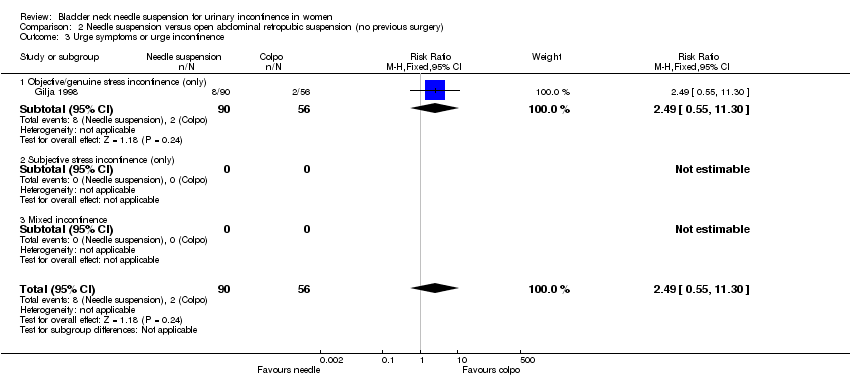
Comparison 2 Needle suspension versus open abdominal retropubic suspension (no previous surgery), Outcome 3 Urge symptoms or urge incontinence.
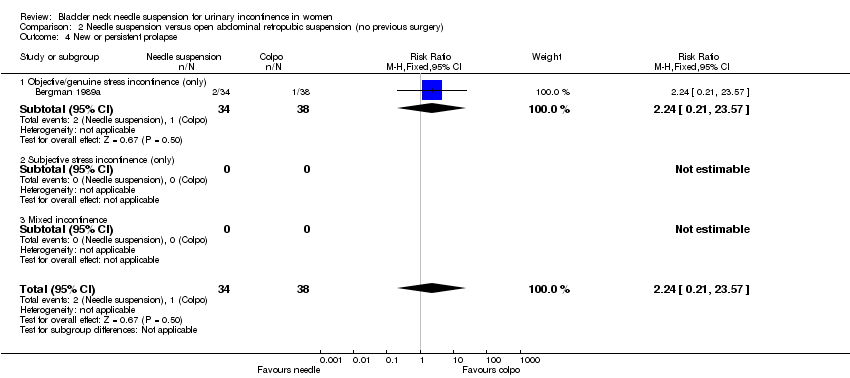
Comparison 2 Needle suspension versus open abdominal retropubic suspension (no previous surgery), Outcome 4 New or persistent prolapse.
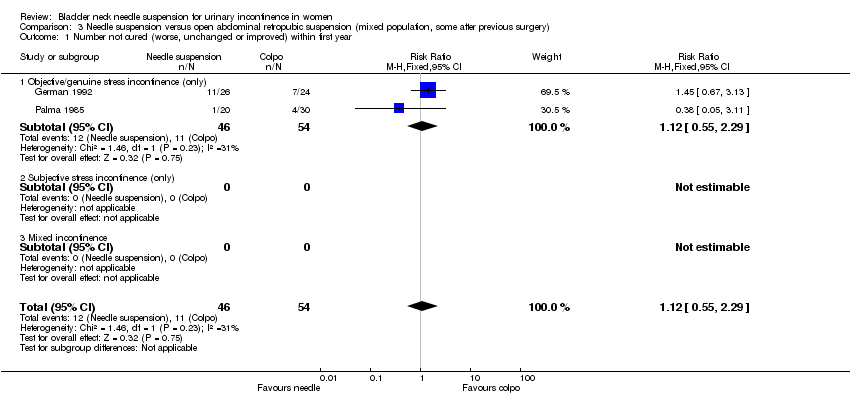
Comparison 3 Needle suspension versus open abdominal retropubic suspension (mixed population, some after previous surgery), Outcome 1 Number not cured (worse, unchanged or improved) within first year.

Comparison 3 Needle suspension versus open abdominal retropubic suspension (mixed population, some after previous surgery), Outcome 2 Number not cured (worse, unchanged or improved) after first year.

Comparison 3 Needle suspension versus open abdominal retropubic suspension (mixed population, some after previous surgery), Outcome 3 Number not improved (worse or unchanged) within first year.
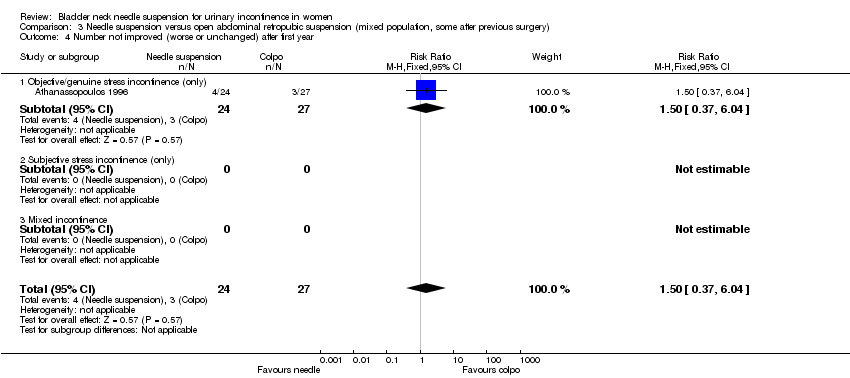
Comparison 3 Needle suspension versus open abdominal retropubic suspension (mixed population, some after previous surgery), Outcome 4 Number not improved (worse or unchanged) after first year.
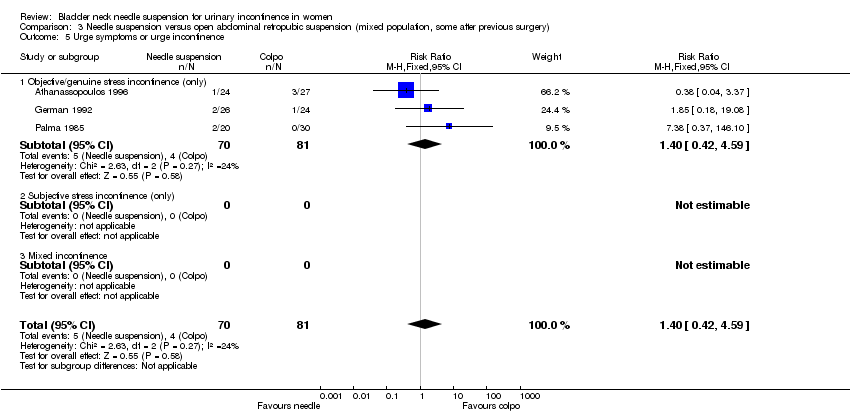
Comparison 3 Needle suspension versus open abdominal retropubic suspension (mixed population, some after previous surgery), Outcome 5 Urge symptoms or urge incontinence.

Comparison 3 Needle suspension versus open abdominal retropubic suspension (mixed population, some after previous surgery), Outcome 6 Voiding dysfunction after 3 months.

Comparison 3 Needle suspension versus open abdominal retropubic suspension (mixed population, some after previous surgery), Outcome 7 Detrusor overactivity (objective diagnosis by urodynamics).

Comparison 3 Needle suspension versus open abdominal retropubic suspension (mixed population, some after previous surgery), Outcome 8 Peri‐operative surgical complications.
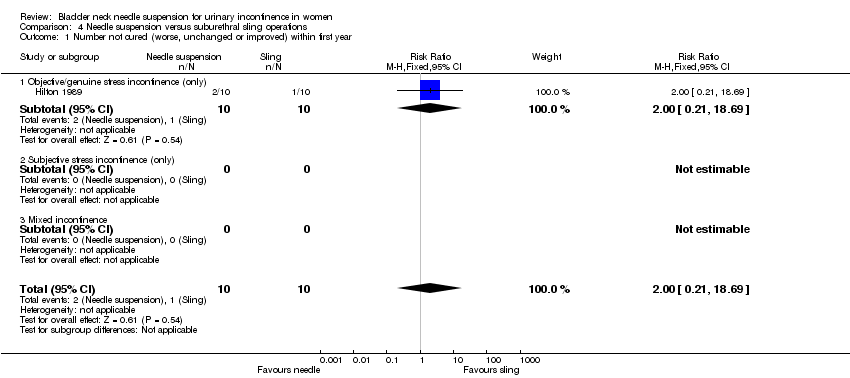
Comparison 4 Needle suspension versus suburethral sling operations, Outcome 1 Number not cured (worse, unchanged or improved) within first year.

Comparison 4 Needle suspension versus suburethral sling operations, Outcome 2 Number not cured (worse, unchanged or improved) after first year.

Comparison 4 Needle suspension versus suburethral sling operations, Outcome 3 Urge symptoms or urge incontinence.
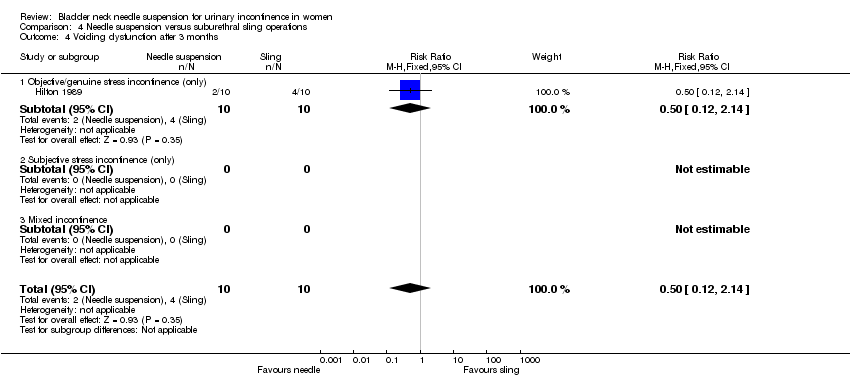
Comparison 4 Needle suspension versus suburethral sling operations, Outcome 4 Voiding dysfunction after 3 months.

Comparison 4 Needle suspension versus suburethral sling operations, Outcome 5 Detrusor overactivity (objective diagnosis by urodynamics).
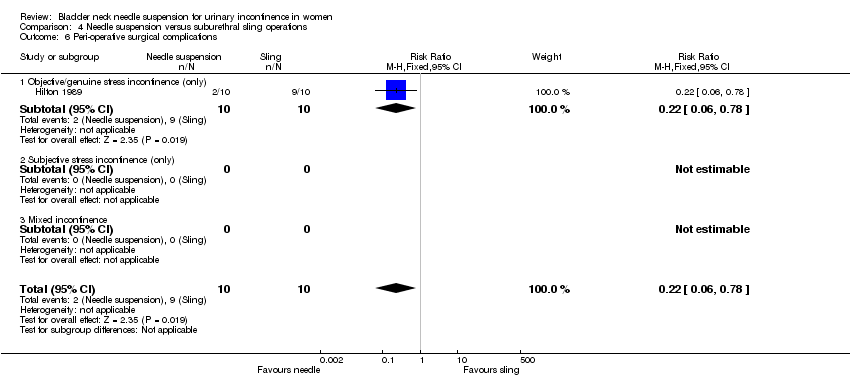
Comparison 4 Needle suspension versus suburethral sling operations, Outcome 6 Peri‐operative surgical complications.

Comparison 4 Needle suspension versus suburethral sling operations, Outcome 7 Length of inpatient stay.
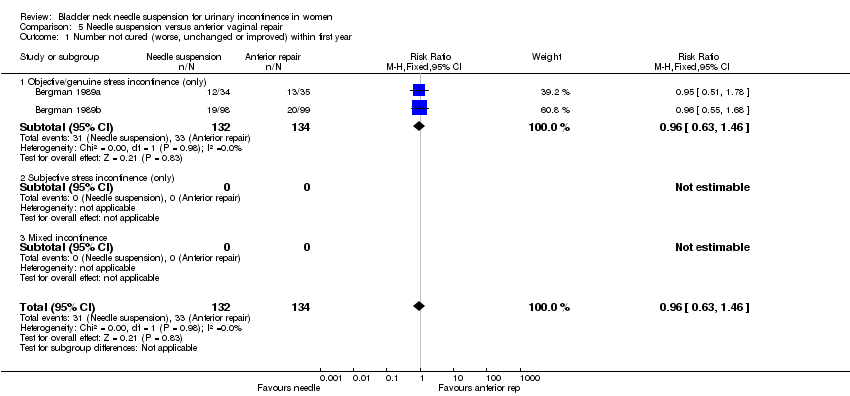
Comparison 5 Needle suspension versus anterior vaginal repair, Outcome 1 Number not cured (worse, unchanged or improved) within first year.
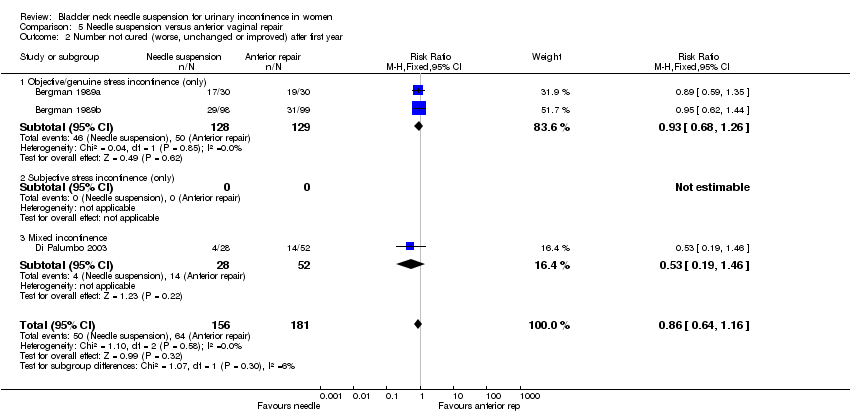
Comparison 5 Needle suspension versus anterior vaginal repair, Outcome 2 Number not cured (worse, unchanged or improved) after first year.
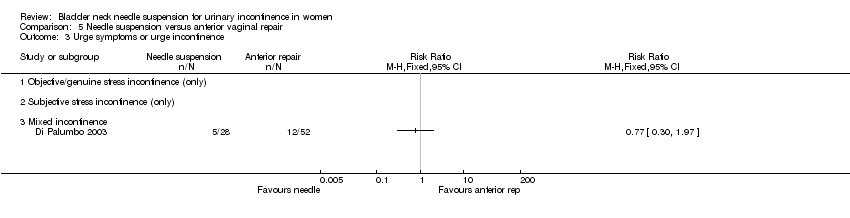
Comparison 5 Needle suspension versus anterior vaginal repair, Outcome 3 Urge symptoms or urge incontinence.

Comparison 5 Needle suspension versus anterior vaginal repair, Outcome 4 Voiding dysfunction after 3 months.

Comparison 5 Needle suspension versus anterior vaginal repair, Outcome 5 Peri‐operative surgical complications.

Comparison 5 Needle suspension versus anterior vaginal repair, Outcome 6 New or persistent prolapse.

Comparison 6 One type of needle suspension versus another type of needle suspension, Outcome 1 Number not cured (worse, unchanged or improved) within first year.

Comparison 6 One type of needle suspension versus another type of needle suspension, Outcome 2 Number not cured (worse, unchanged or improved) after first year.

Comparison 6 One type of needle suspension versus another type of needle suspension, Outcome 3 Urge symptoms or urge incontinence.

Comparison 7 One type of suture versus another type of suture, Outcome 1 Number not cured (worse, unchanged or improved) within first year.
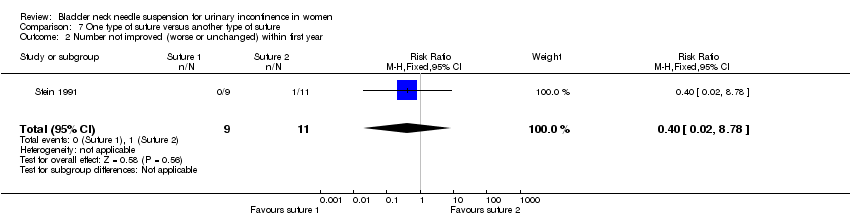
Comparison 7 One type of suture versus another type of suture, Outcome 2 Number not improved (worse or unchanged) within first year.
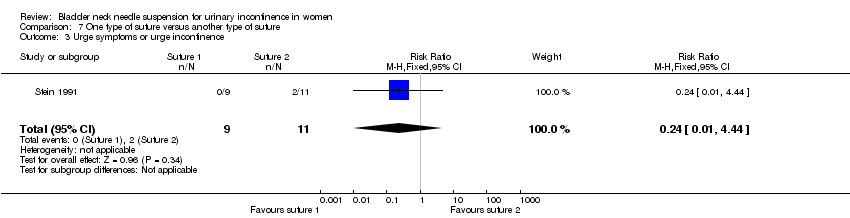
Comparison 7 One type of suture versus another type of suture, Outcome 3 Urge symptoms or urge incontinence.

Comparison 7 One type of suture versus another type of suture, Outcome 4 Pain score.
| Outcome or subgroup title | No. of studies | No. of participants | Statistical method | Effect size |
| 1 Number not cured (worse, unchanged or improved) within first year Show forest plot | 5 | 517 | Risk Ratio (M‐H, Fixed, 95% CI) | 1.70 [1.11, 2.60] |
| 1.1 Objective/genuine stress incontinence (only) | 5 | 517 | Risk Ratio (M‐H, Fixed, 95% CI) | 1.70 [1.11, 2.60] |
| 1.2 Subjective stress incontinence (only) | 0 | 0 | Risk Ratio (M‐H, Fixed, 95% CI) | 0.0 [0.0, 0.0] |
| 1.3 Mixed incontinence | 0 | 0 | Risk Ratio (M‐H, Fixed, 95% CI) | 0.0 [0.0, 0.0] |
| 2 Number not cured (worse, unchanged or improved) after first year Show forest plot | 7 | 610 | Risk Ratio (M‐H, Fixed, 95% CI) | 2.00 [1.47, 2.72] |
| 2.1 Objective/genuine stress incontinence (only) | 7 | 610 | Risk Ratio (M‐H, Fixed, 95% CI) | 2.00 [1.47, 2.72] |
| 2.2 Subjective stress incontinence (only) | 0 | 0 | Risk Ratio (M‐H, Fixed, 95% CI) | 0.0 [0.0, 0.0] |
| 2.3 Mixed incontinence | 0 | 0 | Risk Ratio (M‐H, Fixed, 95% CI) | 0.0 [0.0, 0.0] |
| 3 Number not improved (worse or unchanged) within first year Show forest plot | 1 | 50 | Risk Ratio (M‐H, Fixed, 95% CI) | 0.75 [0.07, 7.73] |
| 3.1 Objective/genuine stress incontinence (only) | 1 | 50 | Risk Ratio (M‐H, Fixed, 95% CI) | 0.75 [0.07, 7.73] |
| 3.2 Subjective stress incontinence (only) | 0 | 0 | Risk Ratio (M‐H, Fixed, 95% CI) | 0.0 [0.0, 0.0] |
| 3.3 Mixed incontinence | 0 | 0 | Risk Ratio (M‐H, Fixed, 95% CI) | 0.0 [0.0, 0.0] |
| 4 Number not improved (worse or unchanged) after first year Show forest plot | 1 | 51 | Risk Ratio (M‐H, Fixed, 95% CI) | 1.5 [0.37, 6.04] |
| 4.1 Objective/genuine stress incontinence (only) | 1 | 51 | Risk Ratio (M‐H, Fixed, 95% CI) | 1.5 [0.37, 6.04] |
| 4.2 Subjective stress incontinence (only) | 0 | 0 | Risk Ratio (M‐H, Fixed, 95% CI) | 0.0 [0.0, 0.0] |
| 4.3 Mixed incontinence | 0 | 0 | Risk Ratio (M‐H, Fixed, 95% CI) | 0.0 [0.0, 0.0] |
| 5 Urge symptoms or urge incontinence Show forest plot | 4 | 297 | Risk Ratio (M‐H, Fixed, 95% CI) | 1.80 [0.71, 4.56] |
| 5.1 Objective/genuine stress incontinence (only) | 4 | 297 | Risk Ratio (M‐H, Fixed, 95% CI) | 1.80 [0.71, 4.56] |
| 5.2 Subjective stress incontinence (only) | 0 | 0 | Risk Ratio (M‐H, Fixed, 95% CI) | 0.0 [0.0, 0.0] |
| 5.3 Mixed incontinence | 0 | 0 | Risk Ratio (M‐H, Fixed, 95% CI) | 0.0 [0.0, 0.0] |
| 6 Voiding dysfunction after 3 months Show forest plot | 4 | 202 | Risk Ratio (M‐H, Fixed, 95% CI) | 2.12 [0.81, 5.55] |
| 6.1 Objective/genuine stress incontinence (only) | 4 | 202 | Risk Ratio (M‐H, Fixed, 95% CI) | 2.12 [0.81, 5.55] |
| 6.2 Subjective stress incontinence (only) | 0 | 0 | Risk Ratio (M‐H, Fixed, 95% CI) | 0.0 [0.0, 0.0] |
| 6.3 Mixed incontinence | 0 | 0 | Risk Ratio (M‐H, Fixed, 95% CI) | 0.0 [0.0, 0.0] |
| 7 Detrusor overactivity (objective diagnosis by urodynamics) Show forest plot | 2 | 101 | Risk Ratio (M‐H, Fixed, 95% CI) | 2.91 [0.73, 11.58] |
| 7.1 Objective/genuine stress incontinence (only) | 2 | 101 | Risk Ratio (M‐H, Fixed, 95% CI) | 2.91 [0.73, 11.58] |
| 7.2 Subjective stress incontinence (only) | 0 | 0 | Risk Ratio (M‐H, Fixed, 95% CI) | 0.0 [0.0, 0.0] |
| 7.3 Mixed incontinence | 0 | 0 | Risk Ratio (M‐H, Fixed, 95% CI) | 0.0 [0.0, 0.0] |
| 8 New or persistent prolapse Show forest plot | 1 | 72 | Risk Ratio (M‐H, Fixed, 95% CI) | 2.24 [0.21, 23.57] |
| 8.1 Objective/genuine stress incontinence (only) | 1 | 72 | Risk Ratio (M‐H, Fixed, 95% CI) | 2.24 [0.21, 23.57] |
| 8.2 Subjective stress incontinence (only) | 0 | 0 | Risk Ratio (M‐H, Fixed, 95% CI) | 0.0 [0.0, 0.0] |
| 8.3 Mixed incontinence | 0 | 0 | Risk Ratio (M‐H, Fixed, 95% CI) | 0.0 [0.0, 0.0] |
| 9 Peri‐operative surgical complications Show forest plot | 3 | 152 | Risk Ratio (M‐H, Fixed, 95% CI) | 1.44 [0.73, 2.83] |
| 9.1 Objective/genuine stress incontinence (only) | 3 | 152 | Risk Ratio (M‐H, Fixed, 95% CI) | 1.44 [0.73, 2.83] |
| 9.2 Subjective stress incontinence (only) | 0 | 0 | Risk Ratio (M‐H, Fixed, 95% CI) | 0.0 [0.0, 0.0] |
| 9.3 Mixed incontinence | 0 | 0 | Risk Ratio (M‐H, Fixed, 95% CI) | 0.0 [0.0, 0.0] |
| 10 Length of stay/time to return to normal function Show forest plot | Other data | No numeric data | ||
| Outcome or subgroup title | No. of studies | No. of participants | Statistical method | Effect size |
| 1 Number not cured (worse, unchanged or improved) within first year Show forest plot | 3 | 417 | Risk Ratio (M‐H, Fixed, 95% CI) | 2.05 [1.20, 3.50] |
| 1.1 Objective/genuine stress incontinence (only) | 3 | 417 | Risk Ratio (M‐H, Fixed, 95% CI) | 2.05 [1.20, 3.50] |
| 1.2 Subjective stress incontinence (only) | 0 | 0 | Risk Ratio (M‐H, Fixed, 95% CI) | 0.0 [0.0, 0.0] |
| 1.3 Mixed incontinence | 0 | 0 | Risk Ratio (M‐H, Fixed, 95% CI) | 0.0 [0.0, 0.0] |
| 2 Number not cured (worse, unchanged or improved) after first year Show forest plot | 3 | 408 | Risk Ratio (M‐H, Fixed, 95% CI) | 2.37 [1.54, 3.66] |
| 2.1 Objective/genuine stress incontinence (only) | 3 | 408 | Risk Ratio (M‐H, Fixed, 95% CI) | 2.37 [1.54, 3.66] |
| 2.2 Subjective stress incontinence (only) | 0 | 0 | Risk Ratio (M‐H, Fixed, 95% CI) | 0.0 [0.0, 0.0] |
| 2.3 Mixed incontinence | 0 | 0 | Risk Ratio (M‐H, Fixed, 95% CI) | 0.0 [0.0, 0.0] |
| 3 Urge symptoms or urge incontinence Show forest plot | 1 | 146 | Risk Ratio (M‐H, Fixed, 95% CI) | 2.49 [0.55, 11.30] |
| 3.1 Objective/genuine stress incontinence (only) | 1 | 146 | Risk Ratio (M‐H, Fixed, 95% CI) | 2.49 [0.55, 11.30] |
| 3.2 Subjective stress incontinence (only) | 0 | 0 | Risk Ratio (M‐H, Fixed, 95% CI) | 0.0 [0.0, 0.0] |
| 3.3 Mixed incontinence | 0 | 0 | Risk Ratio (M‐H, Fixed, 95% CI) | 0.0 [0.0, 0.0] |
| 4 New or persistent prolapse Show forest plot | 1 | 72 | Risk Ratio (M‐H, Fixed, 95% CI) | 2.24 [0.21, 23.57] |
| 4.1 Objective/genuine stress incontinence (only) | 1 | 72 | Risk Ratio (M‐H, Fixed, 95% CI) | 2.24 [0.21, 23.57] |
| 4.2 Subjective stress incontinence (only) | 0 | 0 | Risk Ratio (M‐H, Fixed, 95% CI) | 0.0 [0.0, 0.0] |
| 4.3 Mixed incontinence | 0 | 0 | Risk Ratio (M‐H, Fixed, 95% CI) | 0.0 [0.0, 0.0] |
| Outcome or subgroup title | No. of studies | No. of participants | Statistical method | Effect size |
| 1 Number not cured (worse, unchanged or improved) within first year Show forest plot | 2 | 100 | Risk Ratio (M‐H, Fixed, 95% CI) | 1.12 [0.55, 2.29] |
| 1.1 Objective/genuine stress incontinence (only) | 2 | 100 | Risk Ratio (M‐H, Fixed, 95% CI) | 1.12 [0.55, 2.29] |
| 1.2 Subjective stress incontinence (only) | 0 | 0 | Risk Ratio (M‐H, Fixed, 95% CI) | 0.0 [0.0, 0.0] |
| 1.3 Mixed incontinence | 0 | 0 | Risk Ratio (M‐H, Fixed, 95% CI) | 0.0 [0.0, 0.0] |
| 2 Number not cured (worse, unchanged or improved) after first year Show forest plot | 4 | 202 | Risk Ratio (M‐H, Fixed, 95% CI) | 1.61 [1.04, 2.49] |
| 2.1 Objective/genuine stress incontinence (only) | 4 | 202 | Risk Ratio (M‐H, Fixed, 95% CI) | 1.61 [1.04, 2.49] |
| 2.2 Subjective stress incontinence (only) | 0 | 0 | Risk Ratio (M‐H, Fixed, 95% CI) | 0.0 [0.0, 0.0] |
| 2.3 Mixed incontinence | 0 | 0 | Risk Ratio (M‐H, Fixed, 95% CI) | 0.0 [0.0, 0.0] |
| 3 Number not improved (worse or unchanged) within first year Show forest plot | 1 | 50 | Risk Ratio (M‐H, Fixed, 95% CI) | 0.75 [0.07, 7.73] |
| 3.1 Objective/genuine stress incontinence (only) | 1 | 50 | Risk Ratio (M‐H, Fixed, 95% CI) | 0.75 [0.07, 7.73] |
| 3.2 Subjective stress incontinence (only) | 0 | 0 | Risk Ratio (M‐H, Fixed, 95% CI) | 0.0 [0.0, 0.0] |
| 3.3 Mixed incontinence | 0 | 0 | Risk Ratio (M‐H, Fixed, 95% CI) | 0.0 [0.0, 0.0] |
| 4 Number not improved (worse or unchanged) after first year Show forest plot | 1 | 51 | Risk Ratio (M‐H, Fixed, 95% CI) | 1.5 [0.37, 6.04] |
| 4.1 Objective/genuine stress incontinence (only) | 1 | 51 | Risk Ratio (M‐H, Fixed, 95% CI) | 1.5 [0.37, 6.04] |
| 4.2 Subjective stress incontinence (only) | 0 | 0 | Risk Ratio (M‐H, Fixed, 95% CI) | 0.0 [0.0, 0.0] |
| 4.3 Mixed incontinence | 0 | 0 | Risk Ratio (M‐H, Fixed, 95% CI) | 0.0 [0.0, 0.0] |
| 5 Urge symptoms or urge incontinence Show forest plot | 3 | 151 | Risk Ratio (M‐H, Fixed, 95% CI) | 1.40 [0.42, 4.59] |
| 5.1 Objective/genuine stress incontinence (only) | 3 | 151 | Risk Ratio (M‐H, Fixed, 95% CI) | 1.40 [0.42, 4.59] |
| 5.2 Subjective stress incontinence (only) | 0 | 0 | Risk Ratio (M‐H, Fixed, 95% CI) | 0.0 [0.0, 0.0] |
| 5.3 Mixed incontinence | 0 | 0 | Risk Ratio (M‐H, Fixed, 95% CI) | 0.0 [0.0, 0.0] |
| 6 Voiding dysfunction after 3 months Show forest plot | 4 | 202 | Risk Ratio (M‐H, Fixed, 95% CI) | 2.12 [0.81, 5.55] |
| 6.1 Objective/genuine stress incontinence (only) | 4 | 202 | Risk Ratio (M‐H, Fixed, 95% CI) | 2.12 [0.81, 5.55] |
| 6.2 Subjective stress incontinence (only) | 0 | 0 | Risk Ratio (M‐H, Fixed, 95% CI) | 0.0 [0.0, 0.0] |
| 6.3 Mixed incontinence | 0 | 0 | Risk Ratio (M‐H, Fixed, 95% CI) | 0.0 [0.0, 0.0] |
| 7 Detrusor overactivity (objective diagnosis by urodynamics) Show forest plot | 2 | 101 | Risk Ratio (M‐H, Fixed, 95% CI) | 2.91 [0.73, 11.58] |
| 7.1 Objective/genuine stress incontinence (only) | 2 | 101 | Risk Ratio (M‐H, Fixed, 95% CI) | 2.91 [0.73, 11.58] |
| 7.2 Subjective stress incontinence (only) | 0 | 0 | Risk Ratio (M‐H, Fixed, 95% CI) | 0.0 [0.0, 0.0] |
| 7.3 Mixed incontinence | 0 | 0 | Risk Ratio (M‐H, Fixed, 95% CI) | 0.0 [0.0, 0.0] |
| 8 Peri‐operative surgical complications Show forest plot | 3 | 152 | Risk Ratio (M‐H, Fixed, 95% CI) | 1.44 [0.73, 2.83] |
| 8.1 Objective/genuine stress incontinence (only) | 3 | 152 | Risk Ratio (M‐H, Fixed, 95% CI) | 1.44 [0.73, 2.83] |
| 8.2 Subjective stress incontinence (only) | 0 | 0 | Risk Ratio (M‐H, Fixed, 95% CI) | 0.0 [0.0, 0.0] |
| 8.3 Mixed incontinence | 0 | 0 | Risk Ratio (M‐H, Fixed, 95% CI) | 0.0 [0.0, 0.0] |
| Outcome or subgroup title | No. of studies | No. of participants | Statistical method | Effect size |
| 1 Number not cured (worse, unchanged or improved) within first year Show forest plot | 1 | 20 | Risk Ratio (M‐H, Fixed, 95% CI) | 2.0 [0.21, 18.69] |
| 1.1 Objective/genuine stress incontinence (only) | 1 | 20 | Risk Ratio (M‐H, Fixed, 95% CI) | 2.0 [0.21, 18.69] |
| 1.2 Subjective stress incontinence (only) | 0 | 0 | Risk Ratio (M‐H, Fixed, 95% CI) | 0.0 [0.0, 0.0] |
| 1.3 Mixed incontinence | 0 | 0 | Risk Ratio (M‐H, Fixed, 95% CI) | 0.0 [0.0, 0.0] |
| 2 Number not cured (worse, unchanged or improved) after first year Show forest plot | 1 | 20 | Risk Ratio (M‐H, Fixed, 95% CI) | 3.0 [0.37, 24.17] |
| 2.1 Objective/genuine stress incontinence (only) | 1 | 20 | Risk Ratio (M‐H, Fixed, 95% CI) | 3.0 [0.37, 24.17] |
| 2.2 Subjective stress incontinence (only) | 0 | 0 | Risk Ratio (M‐H, Fixed, 95% CI) | 0.0 [0.0, 0.0] |
| 2.3 Mixed incontinence | 0 | 0 | Risk Ratio (M‐H, Fixed, 95% CI) | 0.0 [0.0, 0.0] |
| 3 Urge symptoms or urge incontinence Show forest plot | 1 | 20 | Risk Ratio (M‐H, Fixed, 95% CI) | 0.6 [0.19, 1.86] |
| 3.1 Objective/genuine stress incontinence (only) | 1 | 20 | Risk Ratio (M‐H, Fixed, 95% CI) | 0.6 [0.19, 1.86] |
| 3.2 Subjective stress incontinence (only) | 0 | 0 | Risk Ratio (M‐H, Fixed, 95% CI) | 0.0 [0.0, 0.0] |
| 3.3 Mixed incontinence | 0 | 0 | Risk Ratio (M‐H, Fixed, 95% CI) | 0.0 [0.0, 0.0] |
| 4 Voiding dysfunction after 3 months Show forest plot | 1 | 20 | Risk Ratio (M‐H, Fixed, 95% CI) | 0.5 [0.12, 2.14] |
| 4.1 Objective/genuine stress incontinence (only) | 1 | 20 | Risk Ratio (M‐H, Fixed, 95% CI) | 0.5 [0.12, 2.14] |
| 4.2 Subjective stress incontinence (only) | 0 | 0 | Risk Ratio (M‐H, Fixed, 95% CI) | 0.0 [0.0, 0.0] |
| 4.3 Mixed incontinence | 0 | 0 | Risk Ratio (M‐H, Fixed, 95% CI) | 0.0 [0.0, 0.0] |
| 5 Detrusor overactivity (objective diagnosis by urodynamics) Show forest plot | 1 | 20 | Risk Ratio (M‐H, Fixed, 95% CI) | 0.5 [0.05, 4.67] |
| 5.1 Objective/genuine stress incontinence (only) | 1 | 20 | Risk Ratio (M‐H, Fixed, 95% CI) | 0.5 [0.05, 4.67] |
| 5.2 Subjective stress incontinence (only) | 0 | 0 | Risk Ratio (M‐H, Fixed, 95% CI) | 0.0 [0.0, 0.0] |
| 5.3 Mixed incontinence | 0 | 0 | Risk Ratio (M‐H, Fixed, 95% CI) | 0.0 [0.0, 0.0] |
| 6 Peri‐operative surgical complications Show forest plot | 1 | 20 | Risk Ratio (M‐H, Fixed, 95% CI) | 0.22 [0.06, 0.78] |
| 6.1 Objective/genuine stress incontinence (only) | 1 | 20 | Risk Ratio (M‐H, Fixed, 95% CI) | 0.22 [0.06, 0.78] |
| 6.2 Subjective stress incontinence (only) | 0 | 0 | Risk Ratio (M‐H, Fixed, 95% CI) | 0.0 [0.0, 0.0] |
| 6.3 Mixed incontinence | 0 | 0 | Risk Ratio (M‐H, Fixed, 95% CI) | 0.0 [0.0, 0.0] |
| 7 Length of inpatient stay Show forest plot | 1 | 20 | Mean Difference (IV, Fixed, 95% CI) | ‐13.0 [‐19.00, ‐5.00] |
| 7.1 Objective/genuine stress incontinence (only) | 1 | 20 | Mean Difference (IV, Fixed, 95% CI) | ‐13.0 [‐19.00, ‐5.00] |
| 7.2 Subjective stress incontinence (only) | 0 | 0 | Mean Difference (IV, Fixed, 95% CI) | 0.0 [0.0, 0.0] |
| 7.3 Mixed incontinence | 0 | 0 | Mean Difference (IV, Fixed, 95% CI) | 0.0 [0.0, 0.0] |
| Outcome or subgroup title | No. of studies | No. of participants | Statistical method | Effect size |
| 1 Number not cured (worse, unchanged or improved) within first year Show forest plot | 2 | 266 | Risk Ratio (M‐H, Fixed, 95% CI) | 0.96 [0.63, 1.46] |
| 1.1 Objective/genuine stress incontinence (only) | 2 | 266 | Risk Ratio (M‐H, Fixed, 95% CI) | 0.96 [0.63, 1.46] |
| 1.2 Subjective stress incontinence (only) | 0 | 0 | Risk Ratio (M‐H, Fixed, 95% CI) | 0.0 [0.0, 0.0] |
| 1.3 Mixed incontinence | 0 | 0 | Risk Ratio (M‐H, Fixed, 95% CI) | 0.0 [0.0, 0.0] |
| 2 Number not cured (worse, unchanged or improved) after first year Show forest plot | 3 | 337 | Risk Ratio (M‐H, Fixed, 95% CI) | 0.86 [0.64, 1.16] |
| 2.1 Objective/genuine stress incontinence (only) | 2 | 257 | Risk Ratio (M‐H, Fixed, 95% CI) | 0.93 [0.68, 1.26] |
| 2.2 Subjective stress incontinence (only) | 0 | 0 | Risk Ratio (M‐H, Fixed, 95% CI) | 0.0 [0.0, 0.0] |
| 2.3 Mixed incontinence | 1 | 80 | Risk Ratio (M‐H, Fixed, 95% CI) | 0.53 [0.19, 1.46] |
| 3 Urge symptoms or urge incontinence Show forest plot | 1 | Risk Ratio (M‐H, Fixed, 95% CI) | Totals not selected | |
| 3.1 Objective/genuine stress incontinence (only) | 0 | Risk Ratio (M‐H, Fixed, 95% CI) | 0.0 [0.0, 0.0] | |
| 3.2 Subjective stress incontinence (only) | 0 | Risk Ratio (M‐H, Fixed, 95% CI) | 0.0 [0.0, 0.0] | |
| 3.3 Mixed incontinence | 1 | Risk Ratio (M‐H, Fixed, 95% CI) | 0.0 [0.0, 0.0] | |
| 4 Voiding dysfunction after 3 months Show forest plot | 3 | Risk Ratio (M‐H, Fixed, 95% CI) | Totals not selected | |
| 4.1 Objective/genuine stress incontinence (only) | 2 | Risk Ratio (M‐H, Fixed, 95% CI) | 0.0 [0.0, 0.0] | |
| 4.2 Subjective stress incontinence (only) | 0 | Risk Ratio (M‐H, Fixed, 95% CI) | 0.0 [0.0, 0.0] | |
| 4.3 Mixed incontinence | 1 | Risk Ratio (M‐H, Fixed, 95% CI) | 0.0 [0.0, 0.0] | |
| 5 Peri‐operative surgical complications Show forest plot | 1 | Risk Ratio (M‐H, Fixed, 95% CI) | Totals not selected | |
| 5.1 Objective/genuine stress incontinence (only) | 0 | Risk Ratio (M‐H, Fixed, 95% CI) | 0.0 [0.0, 0.0] | |
| 5.2 Subjective stress incontinence (only) | 0 | Risk Ratio (M‐H, Fixed, 95% CI) | 0.0 [0.0, 0.0] | |
| 5.3 Mixed incontinence | 1 | Risk Ratio (M‐H, Fixed, 95% CI) | 0.0 [0.0, 0.0] | |
| 6 New or persistent prolapse Show forest plot | 1 | Risk Ratio (M‐H, Fixed, 95% CI) | Totals not selected | |
| 6.1 Objective/genuine stress incontinence (only) | 0 | Risk Ratio (M‐H, Fixed, 95% CI) | 0.0 [0.0, 0.0] | |
| 6.2 Subjective stress incontinence (only) | 0 | Risk Ratio (M‐H, Fixed, 95% CI) | 0.0 [0.0, 0.0] | |
| 6.3 Mixed incontinence | 1 | Risk Ratio (M‐H, Fixed, 95% CI) | 0.0 [0.0, 0.0] | |
| Outcome or subgroup title | No. of studies | No. of participants | Statistical method | Effect size |
| 1 Number not cured (worse, unchanged or improved) within first year Show forest plot | 1 | 90 | Risk Ratio (M‐H, Fixed, 95% CI) | 2.87 [0.31, 26.56] |
| 1.1 Raz versus transvaginal Burch (Gilja) | 1 | 90 | Risk Ratio (M‐H, Fixed, 95% CI) | 2.87 [0.31, 26.56] |
| 2 Number not cured (worse, unchanged or improved) after first year Show forest plot | 1 | 90 | Risk Ratio (M‐H, Fixed, 95% CI) | 1.67 [0.53, 5.32] |
| 2.1 Raz versus transvaginal Burch (Gilja) | 1 | 90 | Risk Ratio (M‐H, Fixed, 95% CI) | 1.67 [0.53, 5.32] |
| 3 Urge symptoms or urge incontinence Show forest plot | 1 | 90 | Risk Ratio (M‐H, Fixed, 95% CI) | 1.59 [0.40, 6.28] |
| 3.1 Raz versus transvaginal Burch (Gilja) | 1 | 90 | Risk Ratio (M‐H, Fixed, 95% CI) | 1.59 [0.40, 6.28] |
| Outcome or subgroup title | No. of studies | No. of participants | Statistical method | Effect size |
| 1 Number not cured (worse, unchanged or improved) within first year Show forest plot | 1 | 20 | Risk Ratio (M‐H, Fixed, 95% CI) | 0.17 [0.01, 2.94] |
| 2 Number not improved (worse or unchanged) within first year Show forest plot | 1 | 20 | Risk Ratio (M‐H, Fixed, 95% CI) | 0.4 [0.02, 8.78] |
| 3 Urge symptoms or urge incontinence Show forest plot | 1 | 20 | Risk Ratio (M‐H, Fixed, 95% CI) | 0.24 [0.01, 4.44] |
| 4 Pain score Show forest plot | 1 | Mean Difference (IV, Fixed, 95% CI) | Subtotals only | |
| 4.1 At one month | 1 | 19 | Mean Difference (IV, Fixed, 95% CI) | ‐0.60 [‐1.87, 0.67] |
| 4.2 At three months | 1 | 20 | Mean Difference (IV, Fixed, 95% CI) | ‐0.92 [‐1.77, ‐0.07] |