Suspensión del cuello vesical con agujas para la incontinencia urinaria en mujeres
Resumen
Antecedentes
La suspensión del cuello vesical con agujas es una operación tradicionalmente utilizada para la incontinencia urinaria de esfuerzo de moderada o severa en las mujeres. Alrededor de un tercio de las mujeres adultas experimentan algo de incontinencia urinaria, y alrededor de un tercio de ellas tienen síntomas moderados o graves. La incontinencia urinaria de esfuerzo (IUE) impone importantes cargas sanitarias y económicas a la sociedad y a las mujeres afectadas.
Objetivos
Determinar los efectos de la suspensión de agujas en la incontinencia urinaria de esfuerzo o mixta en comparación con otras opciones de tratamiento.
Métodos de búsqueda
Se realizaron búsquedas en el Registro Especializado del Grupo Cochrane de Incontinencia (Cochrane Incontinence Group), que contiene ensayos identificados en el Registro Cochrane Central de Ensayos Controlados (Cochrane Central Register of Controlled Trials, CENTRAL), MEDLINE, MEDLINE in process, ClinicalTrials.gov, WHO ICTRP y búsquedas manuales en revistas y actas de congresos (búsqueda del 12 de noviembre de 2014), y en las listas de referencias de los artículos pertinentes.
Criterios de selección
Ensayos aleatorizados o cuasialeatorizados que incluyeron la suspensión con agujas para el tratamiento de la incontinencia urinaria.
Obtención y análisis de los datos
Al menos dos autores de la revisión evaluaron los ensayos y extrajeron los datos de forma independiente. Dos investigadores de ensayos proporcionaron información adicional.
Resultados principales
Se identificaron 10 ensayos, que incluyeron a 375 mujeres con seis tipos diferentes de procedimientos de suspensión con agujas y 489 que recibieron intervenciones de comparación. Las suspensiones con agujas tenían más probabilidades de fallar que la suspensión retropúbica abdominal abierta. Hubo una mayor tasa de fracaso subjetivo después del primer año (91/313 (29%) fracasaron versus 47/297 (16%) fracasaron después de la suspensión retropúbica abdominal abierta). Los riesgos relativos (RR) fueron de 2,00 (intervalo de confianza (IC) del 95%: 1,47 a 2,72), aunque la diferencia en las complicaciones perioperatorias no fue significativa (17/75 (23%) versus 12/77 (16%); RR 1,44, IC del 95%: 0,73 a 2,83). No hubo diferencias significativas en las demás medidas de resultado. Este efecto se observó tanto en mujeres con incontinencia primaria como en mujeres con incontinencia recurrente después de operaciones primarias fallidas. Las suspensiones con agujas pueden ser tan efectivas como la reparación vaginal anterior (50/156 (32%) fracasó después de la suspensión con agujas versus 64/181 (35%) después de la reparación anterior; RR 0,86, IC del 95%: 0,64 a 1,16), pero hubo poca información sobre la morbilidad. Los datos para la comparación con las hondas suburetrales no fueron concluyentes porque provenían de una población pequeña y atípica.
Ningún ensayo comparó las suspensiones con agujas con el tratamiento conservador, las inyecciones periuretrales o la cirugía laparoscópica o simulada.
Conclusiones de los autores
La cirugía de suspensión del cuello vesical con agujas probablemente no sea tan buena como la suspensión retropúbica abdominal abierta para el tratamiento de la incontinencia urinaria de esfuerzo primaria y secundaria porque las tasas de curación fueron menores en los ensayos revisados. Sin embargo, la fiabilidad de la evidencia se vio limitada por la mala calidad y los ensayos pequeños. No había suficiente información para comentar las comparaciones con las operaciones de cabestrillo suburetral. Aunque las tasas de curación fueron similares después de la suspensión con agujas en comparación con la reparación vaginal anterior, los datos fueron insuficientes para ser fiables e inadecuados para comparar la morbilidad. Un breve comentario económico (BEC) no identificó ningún estudio de costo‐efectividad que comparara la suspensión con agujas del cuello vesical con otras cirugías.
PICO
Resumen en términos sencillos
Cirugía de suspensión con agujas para la incontinencia urinaria en mujeres
Antecedentes
La incontinencia urinaria de esfuerzo es la pérdida de orina con la tos, la risa, el estornudo o el ejercicio. El daño a los músculos que sostienen la vejiga puede causarlo. Alrededor de un tercio de las mujeres adultas pueden tener pérdidas de orina, y alrededor de un tercio de ellas pueden tener problemas lo suficientemente graves como para requerir una cirugía. Una cantidad significativa de los ingresos de una mujer y de su familia se puede gastar en el tratamiento de la incontinencia urinaria de esfuerzo.
Cuando los métodos no quirúrgicos, como el ejercicio de los músculos del suelo pélvico (la base del abdomen) o los fármacos, no han funcionado, a veces se utiliza la cirugía para levantar y sostener el cuello de la vejiga para ayudar a detener las pérdidas de orina. La suspensión con agujas implica atar suturas entre la vagina y la pared abdominal.
Características de los estudios
La revisión encontró 10 ensayos, que estudiaron a 375 mujeres con seis tipos diferentes de operaciones de suspensión con agujas y los compararon con 489 mujeres que recibieron otros tratamientos. La mayoría de los ensayos fueron pequeños o de mala calidad, lo que hace que sus resultados sean menos fiables.
Resultados clave
Se curaron más mujeres después de operaciones abdominales como la colposuspensión (84%) que después de la suspensión con agujas (71%): tanto las mujeres que se habían operado de incontinencia como las que no lo habían hecho anteriormente. No había suficiente evidencia sobre las complicaciones, o sobre cómo la suspensión de agujas se compara con otras operaciones. Las operaciones de suspensión con agujas no se compararon con tratamientos conservadores como los ejercicios del suelo pélvico o fármacos. En resumen, la cirugía de suspensión con agujas parece ser menos efectiva para la incontinencia urinaria que la cirugía abdominal, y no hay suficiente evidencia para compararla con otros tratamientos.
Authors' conclusions
Background
This is one of a series of inter‐related Cochrane reviews of surgical approaches to the management of urinary incontinence: anterior vaginal repair (Glazener 2001); suburethral slings (Rehman 2011); laparoscopic retropubic suspension (Dean 2006); open abdominal retropubic suspension (Lapitan 2012); peri‐urethral injections (Kirchin 2012); and artificial sphincters. The reader is referred to one review in this series for a background description of urinary incontinence in women, the principal categories of incontinence and the broad approaches to management (Glazener 2001). As well as surgery, these include medical (drug) and conservative (physical) approaches.
Stress Urinary Incontinence (SUI) constitutes a huge financial economic burden to the society. In the USA the annual total direct costs of urinary incontinence in both men and women is over USD 16 billion (1995 USD) (Chong 2011), with a societal costs of USD 26.2 billion (Wagner 1998). Approximately, USD 13.12 billion of the total direct costs of urinary incontinence are spent on SUI (Chong 2011; Kunkle 2015).
About 70% of this USD 13.12 billion is borne by the patients, mainly through routine care (purchasing pads and disposable underwear (diapers), laundry and dry cleaning). This constitutes a significant individual financial burden. Of the remaining 30% of costs, 14% is spent on nursing home admission, 9% on treatment, 6% on addressing complications and 1% on diagnosis (Chong 2011).
A study in the USA reported that about 1% of the median annual household income (USD 50,000 to USD 59,999 in 2006) was spent by women on incontinence management. This study estimated that women spent an annual mean cost of USD 751 to USD 1277 (2006 USD) on incontinence. This cost increases with the severity of the symptoms (Subak 2008). The indirect cost associated exerts a social and psychological burden which is unquantifiable. (Chong 2011; Kilonzo 2004). Nevertheless, Birnbaum 2004 estimated that the annual average direct medical costs of SUI for one year (1998 USD) was USD 5642 and USD 4208 for indirect workplace costs. The cost of management and treatment of SUI appears to have increased over time due to increasing prevalence and increased desire for improved quality of life (QOL). This in turn has resulted from improved recognition of the condition, as well as increased use of surgical and non‐surgical managements.
Surgical procedures to remedy urinary incontinence generally aim to lift and support the urethrovesical junction between the urethra and the bladder in order to increase bladder outlet resistance. There is disagreement, however, regarding the precise mechanism by which continence is achieved after surgery. The choice of procedures is often influenced by co‐existent problems, a surgeon's specialty and preference, and the physical features of the person affected. Numerous surgical methods have been described, but essentially they fall into seven categories:
-
open abdominal retropubic suspension (e.g. Burch colposuspension, Marshall‐Marchetti‐Krantz);
-
laparoscopic retropubic suspension;
-
anterior vaginal repair (anterior colporrhaphy) (e.g. Pacey, Kelly);
-
suburethral sling procedures;
-
bladder neck needle suspensions (e.g. Pereyra, Stamey, Raz);
-
peri‐urethral injections;
-
artificial sphincters.
This review concentrated on needle suspensions of the bladder neck (referred to as 'needle suspension' in this review).
Needle suspension may be performed from a vaginal or abdominal approach. A long needle is used to thread sutures from the vagina to the anterior abdominal fascia. The sutures are looped through to the para‐urethral tissue on each side of the bladder neck, thereby supporting it. There are three principal types (Pereyra, Stamey, Raz) and several modifications of each, such as site of initial approach (abdominal or vaginal), type of suture, site of attachment of the sutures, and the use of silastic spacers or Dacron sheaths to protect the suture from cutting through (Downs 1996). Cystoscopy (endoscopy), during or after the placement of the sutures, is used to check that the bladder has not been injured. The salient features are that the passage of the needle through the retropubic space is done blindly, and the support to the urethra is derived indirectly from the vaginal walls rather than directly to the urethra.
The wide variety of surgical treatments for urinary incontinence indicates the lack of consensus as to which procedure is the best. Guidelines using the available literature have been published, but were based on studies of mixed quality and type (Black 1996; Downs 1996; Fantl 1996; Jarvis 1994; Leach 1997). Provided that a sufficient number of adequate quality have been conducted, the most reliable evidence is likely to come from consideration of all well‐designed randomised controlled trials. Hence, there is a need for an easily accessible, periodically updated, comprehensive systematic review of such studies, which will not only help to identify optimal practice, but also highlight gaps in the evidence base.
Objectives
To determine the effects of needle suspension on stress or mixed urinary incontinence in comparison with other management options.
Methods
Criteria for considering studies for this review
Types of studies
All randomised or quasi‐randomised trials studying the effects of treatment for stress or mixed urinary incontinence in women, in which at least one management arm involved bladder neck needle suspension.
Types of participants
Adult women with urinary incontinence, diagnosed as having:
-
urodynamic stress incontinence (USI, urodynamic diagnosis of stress incontinence in the absence of detrusor contractions); or
-
stress urinary incontinence (SUI, clinical diagnosis); or
-
mixed incontinence (MUI, any stress incontinence plus other urinary symptoms such as: detrusor overactivity (urodynamic diagnosis); urge incontinence (clinical diagnosis); other types of incontinence; urgency; or frequency.
We accepted the classification of diagnoses as defined by the trialists.
Types of interventions
At least one arm of a trial must have involved needle suspension to treat urinary incontinence.
We made the following comparisons:
-
Needle suspension compared with no treatment or sham operation.
-
Needle suspension compared with conservative interventions (e.g. pelvic floor muscle training, electrical stimulation, cones, biofeedback).
-
Needle suspension compared with open abdominal retropubic suspension (abdominal surgery).
-
Needle suspension compared with suburethral sling procedures (abdominal and vaginal surgery).
-
Needle suspension compared with anterior vaginal repair (anterior colporrhaphy, vaginal surgery).
-
Needle suspension compared with laparoscopic retropubic suspension.
-
Needle suspension compared with peri‐urethral injections.
-
Needle suspension compared with drug treatment (e.g. adrenergic agonists).
-
One method of needle suspension compared with another.
-
One suture type compared with another for carrying out needle suspension operations.
Types of outcome measures
We selected the outcome measures used in this review on the basis of their relevance to the subjective cure or improvement of incontinence. We regard the principal measures of effectiveness as the proportion of women cured (continent or dry) following surgery, and the proportion of women whose symptoms are improved.
We adopted the recommendations made by the Standardisation Committee of the International Continence Society for outcomes of research investigating the effect of therapeutic interventions for women with urinary incontinence. These outcome categories include: women's observations (symptoms), quantification of symptoms, the clinician's observations (anatomical and functional) and quality of life.(Lose 1998).
Relevant data could come from both history and questionnaire assessment, supplemented by the use of urinary diaries (including time and type of incontinence, frequency of micturition and voided volumes) and pad tests (quantitative estimate of weight of urine lost under standard conditions). This review also included other surgical information and adverse events as outcome measures.
A. Women's observations
-
Perception of cure and improvement in the short term (< 12 months) and longer term (> 12 months) (expressed as failure to cure or improve)
-
Urge symptoms or urge incontinence (clinical diagnosis without urodynamics)
B. Quantification of symptoms
-
Pad changes over 24 hours (from self reported number of pads used)
-
Incontinent episodes over 24 hours (from self completed bladder chart)
-
Pad tests of quantified leakage (mean volume or weight of urine loss)
C. Clinician's observations
-
Objective assessment of incontinence at urodynamics
-
Detrusor overactivity (urodynamic diagnosis)
-
New or recurrent prolapse
D. Quality of life
-
General health status measures (physical, psychological, other)
-
Condition‐specific health measures (specific instruments designed to assess incontinence)
E. Surgical outcome measures
-
Voiding dysfunction/difficulty after three months (with or without urodynamic confirmation)
-
Peri‐operative surgical complications (e.g. vascular or visceral injury, haemorrhage, infection, bacteriuria, death associated with surgery)
-
Length of inpatient stay
-
Time to return to normal activity level
-
Dyspareunia (pain with intercourse)
-
Repeat incontinence surgery
-
Later prolapse surgery
-
Death
F. Other outcomes
-
Non‐prespecified outcomes judged important when performing the review
Search methods for identification of studies
We did not impose any language or other limits on the searches, details of which are given below.
Electronic searches
This review has drawn on the search strategy developed for the Cochrane Incontinence Review Group. We identified relevant trials from the Group's Specialised Register of controlled trials, which is described, along with the group search strategy, under the Incontinence Group's module in The Cochrane Library. The Register contains trials identified from the Cochrane Central Register of Controlled Trials (CENTRAL), MEDLINE, MEDLINE in process, ClinicalTrials.gov, the World Health Organization (WHO) International Clinical Trials Registry Platform (ICTRP) and handsearching of journals and conference proceedings. We searched the Incontinence Group Specialised Register using the Group's own keyword system. The search terms used were:
({design.cct*} OR {design.rct*})
AND
({intvent.surg.bladnecsusp.*} OR {intvent.surg.needle.*})
(All searches were of the keyword field of Reference Manager 2012).
The date of the most recent search of the Register for this review was 12 November 2014.
Most of the trials in the Incontinence Group Specialised Register are also contained in CENTRAL.
We performed additional searches for the Brief Economic Commentary (BEC). We conducted them in MEDLINE(1 January 1946 to March 2017), Embase (1 January 1980 to 2017 Week 12) and NHS EED (1st Quarter 2016). We ran all searches on 6 April 2017. Details of the searches run and the search terms used can be found in Appendix 1.
Searching other resources
We searched the reference lists of relevant articles.
Data collection and analysis
Selection of studies
We identified randomised and quasi‐randomised trials using the above search strategy. We excluded studies if they were not randomised or quasi‐randomised trials for incontinent women. Excluded studies are listed with reasons for their exclusion. We resolved any differences of opinion related to study inclusion, methodological quality or data extraction by discussion with a third party.
Quality of trials
The review authors evaluated the reports of all possibly eligible trials for methodological quality and appropriateness for inclusion, without prior consideration of the results. Each review author independently assessed methodological quality using the Cochrane Incontinence Group's assessment criteria, which include quality of random allocation and concealment, description of drop‐outs and withdrawals, analysis by intention‐to‐treat, and blinding during treatment and at outcome assessment. We resolved any differences of opinion by discussion with a third party.
Data extraction and management
Two review authors independently extracted data from the included trials and cross‐checked the data. We sought clarification from the trialists for data that may have been collected but not reported. We subgrouped trial data by type of incontinence ‐ either urodynamic stress incontinence (USI) based on a urodynamic diagnosis, or stress urinary incontinence (SUI) based upon a symptom classification. Mixed urinary incontinence (MUI) was defined when either type of stress incontinence co‐existed with detrusor overactivity, urge urinary incontinence or other urinary symptoms. We used the International Continence Society terminology (Abrams 2002). In the event, however, all the included trials were limited to women with urodynamic stress incontinence.
Data synthesis
We processed the included trial data as described in the Cochrane Handbook for Systematic Reviews of Interventions (Higgins 2011). When appropriate, we undertook meta‐analysis. We expressed outcomes as negative (i.e. failed rather than cured). For categorical outcomes we related the numbers reporting an outcome to the numbers at risk in each group to derive a risk ratio (RR). For continuous variables we used means and standard deviations to derive a mean difference (MD). We used a fixed‐effect model to calculate pooled estimates and their 95% confidence intervals. We only combined trials if the interventions were similar enough based on clinical criteria. When we suspected important heterogeneity from visual inspection of the results, we used the Chi² test for heterogeneity (at 10%) or the I² statistic (Higgins 2003). If concern about heterogeneity persisted, we planned to use a random‐effects model.
Subgroup analyses included different diagnostic groups (i.e. USI, SUI or MUI), types of operations and groups with and without previous incontinence surgery. We would have carried out sensitivity analysis for individual methodological criteria if the data allowed (e.g. quality of concealment of randomisation), but the data were insufficient. For the purpose of the analysis, we considered the Burch colposuspension and Marshall‐Marchetti‐Krantz operations together.
Results
Description of studies
We updated the first version of this review for Issue 2, 2004. We excluded a further four studies and included one new trial (Palma 1985). In a subsequent update (Issue 2, 2006), we included another trial (Di Palumbo 2003). We have identified no further trials since then.
Thus, we have now identified 10 randomised or quasi‐randomised trials of surgery for urinary incontinence, which included needle suspension in one arm. They were conducted in six countries (UK, USA, Brazil, Greece, Italy and Croatia) and included a total of 864 women, of whom 375 had a needle suspension. Sample sizes ranged from nine to 289. We excluded a total of 11 studies because they were not randomised controlled trials, the women were not all incontinent or the surgical arms included other types of operations (Bump 1995; Bump 1996; Colombo 1997; Corcos 2001; Ishenko 1999; Koonings 1988; Morley 1995; Ramon 1991; Salinas 1994; Vordermark 1979). We excluded one more study because no information was available from the authors to allow a decision to be made about eligibility (Morley 1995), and another because it was a trial of prolapse treatment rather than needle suspension (Goldberg 2001). Details are given in the table of Characteristics of excluded studies.
Nine trials included only women with urodynamic stress incontinence (USI). In one trial women had mixed incontinence (Di Palumbo 2003); three specifically included women with prolapse (Athanassopoulos 1996; Bergman 1989b; Di Palumbo 2003), and only four were restricted to women who had not had previous incontinence surgery (Bergman 1989a; Bergman 1989b; Gilja 1998; Stein 1991). The other six included a mixed population of women, some of whom had previous failed continence surgery. All trials included pre‐ and post‐menopausal women. Long‐term follow‐up was reported in two trials (Bergman 1989a; Di Palumbo 2003).
Types of needle operations
Six different types or modifications of needle suspension were described in the trials:
-
Stamey (Athanassopoulos 1996; German 1992; Hilton 1989; Mundy 1983; Palma 1985);
-
Pereyra (Bergman 1989a; Bergman 1989b);
-
Raz urethropexy (Gilja 1998; Stein 1991);
-
Raz four‐corner repair (Di Palumbo 2003; Stein 1991);
-
Gittes urethropexy (Stein 1991); and
-
a modified Raz (termed as 'transvaginal Burch (Gilja) operation' by the authors), where the needle sutures were placed under direct (open) vision (Gilja 1998).
We classed the Gilja operation as a needle suspension rather than an open retropubic colposuspension for this review. In one trial using three different operations, it was the suture used rather than the operation that was randomised: the authors stated that the type of operation did not affect randomisation or outcomes (Stein 1991). The open abdominal retropubic suspensions were all described as 'Burch colposuspension' except in one trial (German 1992), in which a vagina/obturator shelf repair was used and another where the comparison was with Marshall‐Marchetti‐Krantz (Palma 1985): we classed both as open abdominal retropubic suspensions for this review.
Further details of the trials are reported in the table of Characteristics of included studies.
Risk of bias in included studies
One study used a secure method of concealment of randomisation (sealed envelopes, Di Palumbo 2003), and three studies used a quasi‐randomised method of allocation (birth date (Athanassopoulos 1996); open randomisation list (Gilja 1998); and alternation (Mundy 1983)). The others used 'randomisation lists or tables' without explaining how they were actually used. Women could not be blinded when abdominal operations were compared with vaginal operations. Blinding of outcome assessors was only reported in one trial (Palma 1985).
Baseline comparability of the groups was not mentioned in two studies (Athanassopoulos 1996; Mundy 1983). The others reported that the groups were 'comparable' in terms of age, parity and menopausal status, but four failed to provide specific data (Bergman 1989a; Bergman 1989b; Di Palumbo 2003; Gilja 1998). Only three studies reported drop‐outs: 20 women could not be traced at five years in one trial (Bergman 1989a); in another trial, 58 were lost to follow‐up at three years due to war (Gilja 1998) and four were excluded because they were not followed up in another trial (Stein 1991).
Four studies reported follow‐up of a year or less (Bergman 1989b; Mundy 1983; Stein 1991), one presented data at five years (Bergman 1989a), and some women were followed to six years in another trial (Di Palumbo 2003).
Effects of interventions
1. Needle suspension versus mock procedure
We identified no studies in which needle suspension was compared with a sham or mock procedure, or no alternative intervention.
2. Needle suspension versus conservative interventions
We identified no studies in which needle suspension was compared with a conservative or physical intervention.
3. Needle suspension versus open abdominal retropubic suspension
Needle suspension was compared with open abdominal retropubic suspension in seven trials (Athanassopoulos 1996; Bergman 1989a; Bergman 1989b; German 1992; Gilja 1998; Mundy 1983; Palma 1985). Five compared a needle suspension with a Burch type of colposuspension; one was described as a vagina/obturator shelf repair (German 1992), and the other used a Marshall‐Marchetti Krantz (Palma 1985). Two methods of needle suspension were combined for comparison with colposuspension in one trial (Gilja 1998), although one of them could be regarded as a hybrid of a needle suspension and a colposuspension (termed as 'transvaginal Burch (Gilja) operation' by the authors).
Needle suspension was less effective than colposuspension, based on subjective outcome within one year of surgery (risk ratio (RR) for failure 1.70, 95% confidence interval (CI) 1.11 to 2.60, Analysis 1.1); and after the first year (91/313 (29%) failed after needle suspension versus 47/297 (16%) after open abdominal retropubic suspension; RR 2.00, 95% CI 1.47 to 2.72, Analysis 1.2) (Athanassopoulos 1996; Bergman 1989a; Bergman 1989b; German 1992; Gilja 1998; Mundy 1983; Palma 1985).
Overall, there was no statistically significant difference in peri‐operative complications (haematoma, abscess, infection, pain, urinary tract infection, stitch removal for pain and Dacron sheath removal for infection) after needle procedures (17/75 (23%) versus 12/77 (16%); RR 1.44, 95% CI 0.73 to 2.83, Analysis 1.9), which were reported in three trials (Athanassopoulos 1996; German 1992; Mundy 1983). However, there was significant heterogeneity for this outcome (P value = 0.02, I² = 75%), which may have been due to an unusually low rate of complications after colposuspension in one trial (Mundy 1983).
There were no clear differences between the procedures for any of the other outcome measures, but the confidence intervals around these estimates were wide.
See Analysis 1.1 to Analysis 1.10.
Effect of previous incontinence surgery
Three of the trials included only women who had primary incontinence (i.e. they had not had previous surgery for incontinence) (Bergman 1989a; Bergman 1989b; Gilja 1998). In these trials, women who had an open operation did better after at least one year (57/218 (26%) failed after needle suspension versus 23/190 (12%) after open abdominal retropubic suspension; RR 2.37, 95% CI 1.54 to 3.66, Analysis 2.2). However, none of these trials reported peri‐operative morbidity rates.
Results from the four smaller trials, which included some women who had had previous incontinence surgery, showed the same trend (34/95 (36%) failed after needle suspension versus 24/107 (22%) after open abdominal retropubic suspension; RR 1.61, 95% CI 1.04 to 2.49, Analysis 3.2).
The peri‐operative morbidity data were the same as when all trials were considered together (17/75 (23%) versus 12/77 (16%); RR 1.44, 95% CI 0.73 to 2.83, Analysis 3.8) (Athanassopoulos 1996; German 1992; Mundy 1983; Palma 1985).
4. Needle suspension versus suburethral sling operations
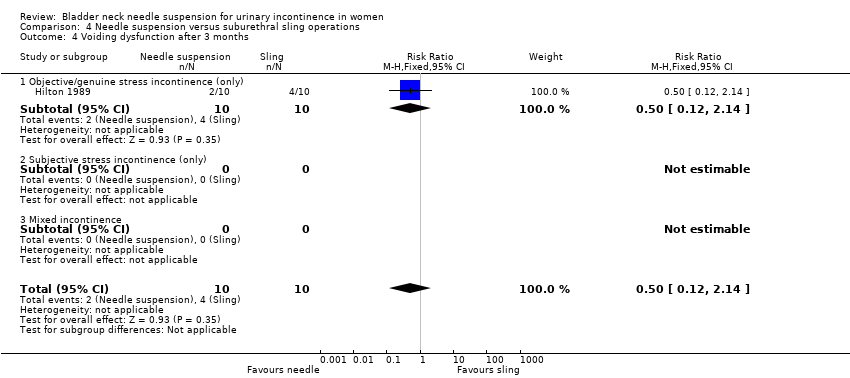
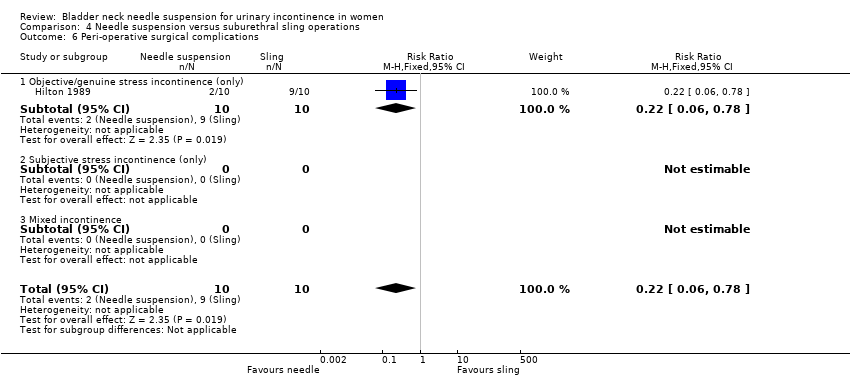
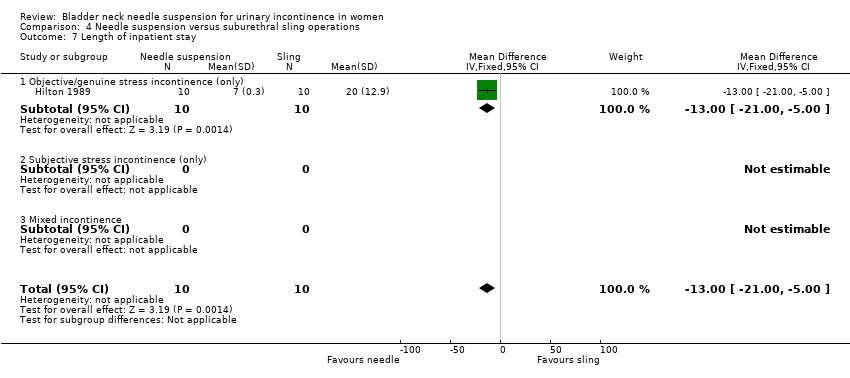
One trial compared Stamey needle suspension with porcine dermis sling (Hilton 1989). This was a small trial with only 10 women in each arm. The women were unsuitable for open abdominal retropubic suspension (the author's preferred procedure) because they had vaginal narrowing secondary to either previous interventions or atrophic vaginitis. Although the trial was too small to address differences in cure rates, sling operations were associated with higher complication rates (9/10 versus 2/10) (Analysis 4.6). These included pyrexia, blood loss, wound infection and pulmonary embolus, need for a permanent suprapubic catheter and more adjuvant therapy, and resulted in a longer stay in hospital (Analysis 4.7).
5. Needle suspension versus anterior vaginal repair
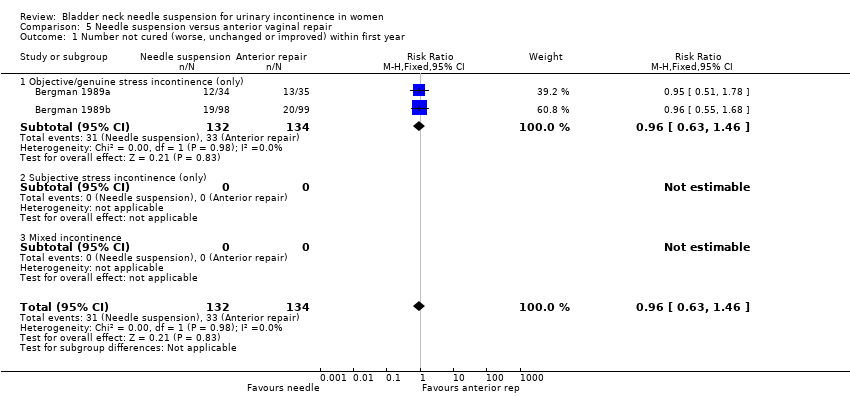
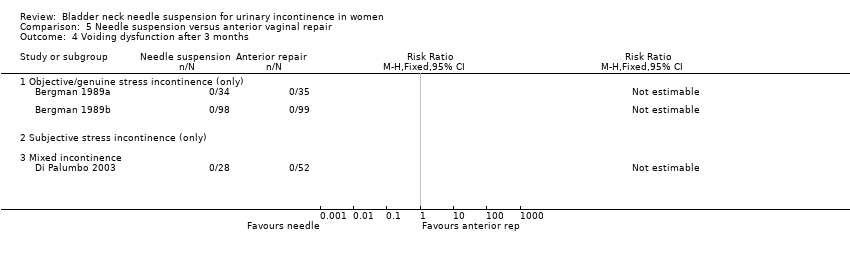
Needle suspension was compared with anterior repair in three trials (Bergman 1989a; Bergman 1989b; Di Palumbo 2003). The performance of the two operations appeared similar in terms of subjective cure rates after 12 months (50/156 versus 64/181; RR 0.86, 95% CI 0.64 to 1.16, Analysis 5.2) and voiding dysfunction, whether the women had prolapse in addition to stress incontinence (Bergman 1989b; Di Palumbo 2003), or not (Bergman 1989a). The numbers were not large, however, and only one objective clinical outcome was reported (no women had long‐term problems with voiding dysfunction after any of the operations, Analysis 5.4).
6. Needle suspension versus laparoscopic colposuspension
We identified no eligible studies in which needle suspension was compared with laparoscopic colposuspension.
7. Needle suspension versus peri‐urethral injections
We identified no eligible studies in which needle suspension was compared with peri‐urethral injections.
8. Needle suspension versus drug treatment (e.g. adrenergic agonists)
We identified no eligible studies in which needle suspension was compared with a drug.
9. One type of needle suspension versus another
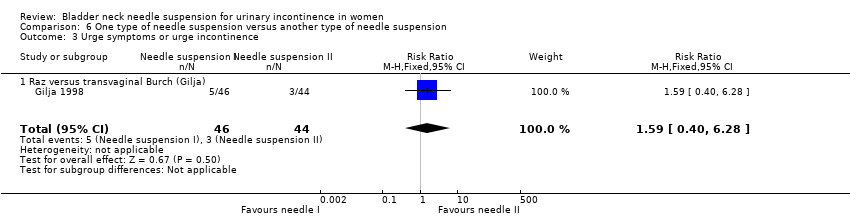
One trial involved a comparison between a standard Raz needle suspension and a modified operation involving direct attachment of the sutures to the ileopectineal ligament (termed 'transvaginal Burch (Gilja) operation' by the authors) (Gilja 1998). However, while there were no significant differences in outcomes, the confidence intervals were wide, reflecting the small number of women in the trial (See Analysis 6.1 to Analysis 6.3).
10. Different types of sutures
In one small trial postoperative pain was significantly less at three months in women whose needle suspension was carried out using polytetrafluoroethylene sutures (Gore‐TexTM) compared with polypropylene (difference in pain score ‐0.92, 95% CI ‐1.77 to ‐0.07, Analysis 7.4) (Stein 1991). The numbers were too small to provide useful information about effectiveness.
Surgical outcomes
Some trials reported length of stay (Athanassopoulos 1996; Hilton 1989; Palma 1985), duration to return to normal function (German 1992), or operating time (Palma 1985). However, with the exception of the Hilton trial (where women stayed longer after sling operations, Hilton 1989), we could make no formal statistical comparisons or draw any conclusions.
Discussion
This review is one of a series of reviews of surgical operations for urinary incontinence and it should be viewed in that context (Dean 2006; Glazener 2001; Kirchin 2012; Lapitan 2012; Rehman 2011). Amongst the trials that addressed the effects of needle suspension procedures for stress incontinence, the quality of the trials was poor (three of nine used quasi‐randomised methods and all but one of the remainder did not provide details of the process of randomisation) and the numbers of women who participated were low. Long‐term follow‐up (five years) was only available in two trials (Bergman 1989a; Di Palumbo 2003). Five of the trials included some women who had previous surgery for incontinence, and three included women with prolapse; however, data were not reported separately according to these subgroups.
Outcome measures were generally subjective and limited, with little evidence of reliability and validity. Only one of the trials reported that assessment of outcome was carried out by blinded observers. Patient satisfaction with, and acceptability of, the treatment were not addressed but are important factors in choice of management. No quality of life and mental health outcomes were reported (Black 1997; Kelleher 1997).. The cost‐effectiveness of bladder neck needle suspension would be important to determine, given the health and financial burden of SUI. Nevertheless, searches for economics evaluations in this area have failed to identify any relevant studies. Should this procedure be considered for more than very occasional use it would be important that this deficit in the evidence based be rectified.
All trials included women with urodynamic stress incontinence only, therefore the effect in women with co‐existing detrusor overactivity or urge incontinence (mixed incontinence) could not be assessed.
Needle suspension versus open abdominal retropubic suspension
Needle suspensions were less successful than open abdominal retropubic suspensions in terms of higher failure rates, although there were no significant differences in other outcome measures. This effect was seen in women with both primary and secondary (after failed primary continence surgery) incontinence.
Needle suspension versus suburethral sling operations
The one small trial that compared needle operations with slings included an atypical population who were unsuitable for more radical surgery (Hilton 1989). There were too few women to provide reliable data about cure rates. Although the sling operations were associated with more postoperative morbidity, the results cannot be generalised to the whole population having surgery because of the atypical nature of the women involved in the trial.
Needle suspension versus anterior vaginal repair
Needle suspension appeared to provide similar cure rates to anterior vaginal repair in women with (Bergman 1989b) and without prolapse (Bergman 1989a), both in the short term and long term, but the numbers were small and clinically important differences could not be ruled out. However, the effects were of the order expected from a review of anterior repair (132/322 (41%) failed after the first year) (Glazener 2001). In the current review, 50/129 (39%) failed after anterior repair versus 46/128 (36%) after needle suspension. This suggests that needle suspension is as effective as anterior repair (but both are less effective than open abdominal retropubic suspension).
One type of needle suspension versus another
In one trial, using direct vision to attach the needle sutures did not significantly improve outcomes, but the numbers were too small to be reliable (Gilja 1998).
Types of sutures
Polytetrafluoroethylene sutures (Gore‐TexTM) seemed to result in less postoperative pain in the medium term than polypropylene sutures, but the single study was too small to assess continence (Stein 1991).
Outcomes
The primary outcome of effectiveness used in this review was subjective report of failure to cure incontinence. Objective urodynamic outcome measures, for example change in functional urethral length or maximal urethral pressure (Bump 1988; Hilton 1983) were reported in four of the trials (Athanassopoulos 1996; Bergman 1989a; Bergman 1989b; Hilton 1989). These are measurable continuous variables, which allow trials with smaller numbers of participants to obtain relatively precise statistical estimates of any differences. However, they are of limited help in determining optimal treatment because they have no proven correlation with clinical outcome (Meyer 1994; Swift 1995). Until accepted normal values, which correlate with clinical signs and symptoms, are available for these tests, they will not be included in this review.
Morbidity outcomes relevant to surgical complications (such as pain, voiding dysfunction, detrusor overactivity, entero‐rectocoele, wound and urinary infections, length of stay and time to return to normal function) were not consistently reported. Such morbidity is of particular importance in decision‐making when treating benign disease. Data describing treatment failure in terms of need for alternative interventions, or for repeat surgery for incontinence and prolapse, would be particularly useful.

Comparison 1 Needle suspension versus open abdominal retropubic suspension, Outcome 1 Number not cured (worse, unchanged or improved) within first year.
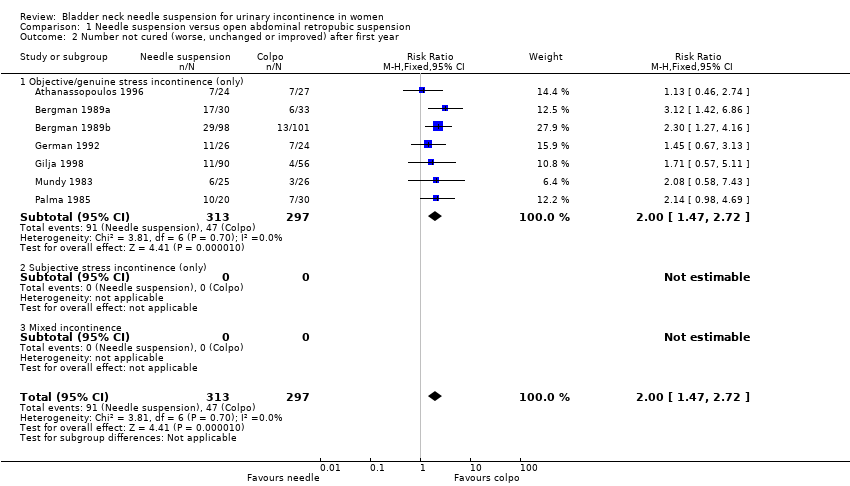
Comparison 1 Needle suspension versus open abdominal retropubic suspension, Outcome 2 Number not cured (worse, unchanged or improved) after first year.
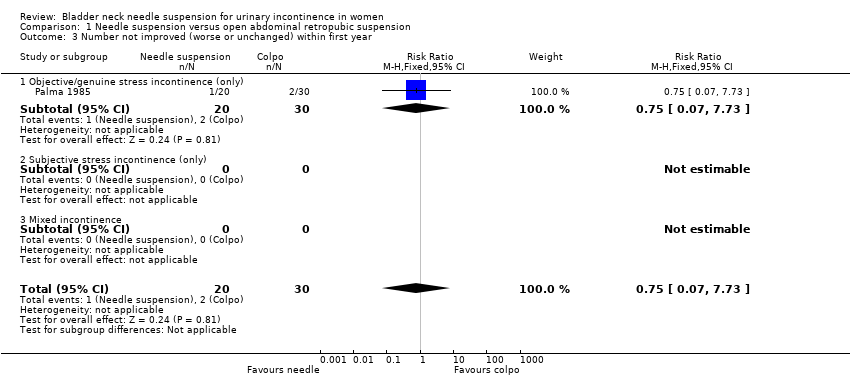
Comparison 1 Needle suspension versus open abdominal retropubic suspension, Outcome 3 Number not improved (worse or unchanged) within first year.
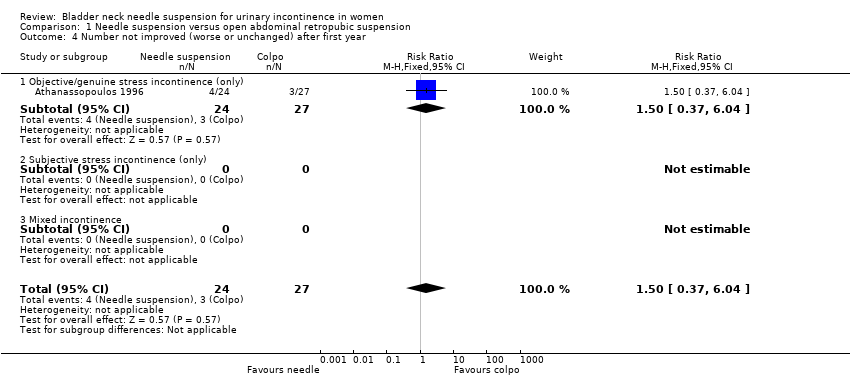
Comparison 1 Needle suspension versus open abdominal retropubic suspension, Outcome 4 Number not improved (worse or unchanged) after first year.

Comparison 1 Needle suspension versus open abdominal retropubic suspension, Outcome 5 Urge symptoms or urge incontinence.

Comparison 1 Needle suspension versus open abdominal retropubic suspension, Outcome 6 Voiding dysfunction after 3 months.
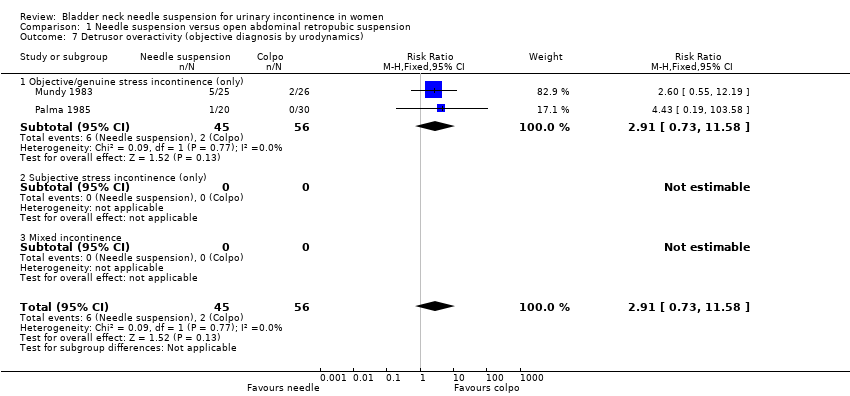
Comparison 1 Needle suspension versus open abdominal retropubic suspension, Outcome 7 Detrusor overactivity (objective diagnosis by urodynamics).

Comparison 1 Needle suspension versus open abdominal retropubic suspension, Outcome 8 New or persistent prolapse.

Comparison 1 Needle suspension versus open abdominal retropubic suspension, Outcome 9 Peri‐operative surgical complications.
| Study | Needle suspension | Abdominal suspension |
| Athanassopoulos 1996 | Mean length of stay: 3 days (range 6 to 12) | Mean length of stay: 5.8 days (range 4 to 11) |
| German 1992 | Mean length of stay: 7 days | Mean length of stay: 8.3 days |
Comparison 1 Needle suspension versus open abdominal retropubic suspension, Outcome 10 Length of stay/time to return to normal function.

Comparison 2 Needle suspension versus open abdominal retropubic suspension (no previous surgery), Outcome 1 Number not cured (worse, unchanged or improved) within first year.
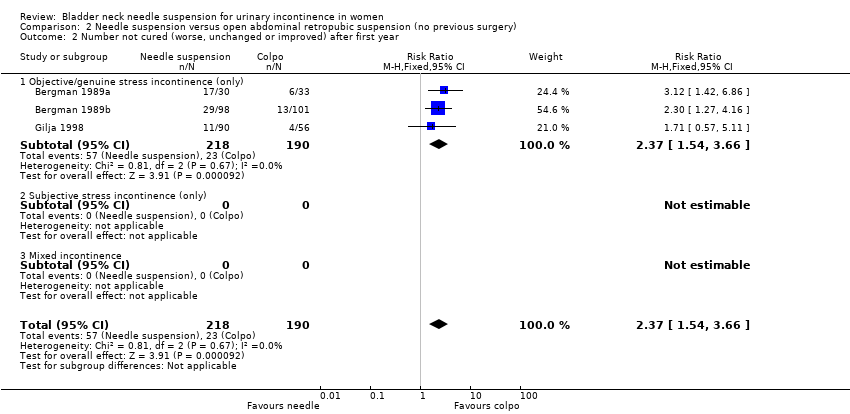
Comparison 2 Needle suspension versus open abdominal retropubic suspension (no previous surgery), Outcome 2 Number not cured (worse, unchanged or improved) after first year.
Comparison 2 Needle suspension versus open abdominal retropubic suspension (no previous surgery), Outcome 3 Urge symptoms or urge incontinence.

Comparison 2 Needle suspension versus open abdominal retropubic suspension (no previous surgery), Outcome 4 New or persistent prolapse.

Comparison 3 Needle suspension versus open abdominal retropubic suspension (mixed population, some after previous surgery), Outcome 1 Number not cured (worse, unchanged or improved) within first year.

Comparison 3 Needle suspension versus open abdominal retropubic suspension (mixed population, some after previous surgery), Outcome 2 Number not cured (worse, unchanged or improved) after first year.

Comparison 3 Needle suspension versus open abdominal retropubic suspension (mixed population, some after previous surgery), Outcome 3 Number not improved (worse or unchanged) within first year.

Comparison 3 Needle suspension versus open abdominal retropubic suspension (mixed population, some after previous surgery), Outcome 4 Number not improved (worse or unchanged) after first year.

Comparison 3 Needle suspension versus open abdominal retropubic suspension (mixed population, some after previous surgery), Outcome 5 Urge symptoms or urge incontinence.
Comparison 3 Needle suspension versus open abdominal retropubic suspension (mixed population, some after previous surgery), Outcome 6 Voiding dysfunction after 3 months.

Comparison 3 Needle suspension versus open abdominal retropubic suspension (mixed population, some after previous surgery), Outcome 7 Detrusor overactivity (objective diagnosis by urodynamics).

Comparison 3 Needle suspension versus open abdominal retropubic suspension (mixed population, some after previous surgery), Outcome 8 Peri‐operative surgical complications.

Comparison 4 Needle suspension versus suburethral sling operations, Outcome 1 Number not cured (worse, unchanged or improved) within first year.

Comparison 4 Needle suspension versus suburethral sling operations, Outcome 2 Number not cured (worse, unchanged or improved) after first year.

Comparison 4 Needle suspension versus suburethral sling operations, Outcome 3 Urge symptoms or urge incontinence.
Comparison 4 Needle suspension versus suburethral sling operations, Outcome 4 Voiding dysfunction after 3 months.

Comparison 4 Needle suspension versus suburethral sling operations, Outcome 5 Detrusor overactivity (objective diagnosis by urodynamics).
Comparison 4 Needle suspension versus suburethral sling operations, Outcome 6 Peri‐operative surgical complications.
Comparison 4 Needle suspension versus suburethral sling operations, Outcome 7 Length of inpatient stay.
Comparison 5 Needle suspension versus anterior vaginal repair, Outcome 1 Number not cured (worse, unchanged or improved) within first year.

Comparison 5 Needle suspension versus anterior vaginal repair, Outcome 2 Number not cured (worse, unchanged or improved) after first year.

Comparison 5 Needle suspension versus anterior vaginal repair, Outcome 3 Urge symptoms or urge incontinence.
Comparison 5 Needle suspension versus anterior vaginal repair, Outcome 4 Voiding dysfunction after 3 months.
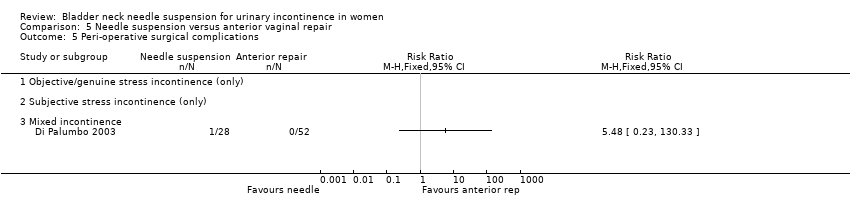
Comparison 5 Needle suspension versus anterior vaginal repair, Outcome 5 Peri‐operative surgical complications.
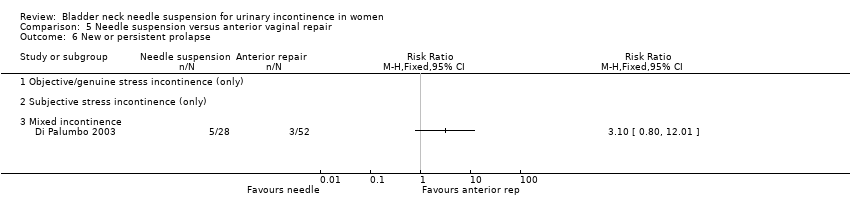
Comparison 5 Needle suspension versus anterior vaginal repair, Outcome 6 New or persistent prolapse.

Comparison 6 One type of needle suspension versus another type of needle suspension, Outcome 1 Number not cured (worse, unchanged or improved) within first year.

Comparison 6 One type of needle suspension versus another type of needle suspension, Outcome 2 Number not cured (worse, unchanged or improved) after first year.
Comparison 6 One type of needle suspension versus another type of needle suspension, Outcome 3 Urge symptoms or urge incontinence.

Comparison 7 One type of suture versus another type of suture, Outcome 1 Number not cured (worse, unchanged or improved) within first year.

Comparison 7 One type of suture versus another type of suture, Outcome 2 Number not improved (worse or unchanged) within first year.

Comparison 7 One type of suture versus another type of suture, Outcome 3 Urge symptoms or urge incontinence.

Comparison 7 One type of suture versus another type of suture, Outcome 4 Pain score.
| Outcome or subgroup title | No. of studies | No. of participants | Statistical method | Effect size |
| 1 Number not cured (worse, unchanged or improved) within first year Show forest plot | 5 | 517 | Risk Ratio (M‐H, Fixed, 95% CI) | 1.70 [1.11, 2.60] |
| 1.1 Objective/genuine stress incontinence (only) | 5 | 517 | Risk Ratio (M‐H, Fixed, 95% CI) | 1.70 [1.11, 2.60] |
| 1.2 Subjective stress incontinence (only) | 0 | 0 | Risk Ratio (M‐H, Fixed, 95% CI) | 0.0 [0.0, 0.0] |
| 1.3 Mixed incontinence | 0 | 0 | Risk Ratio (M‐H, Fixed, 95% CI) | 0.0 [0.0, 0.0] |
| 2 Number not cured (worse, unchanged or improved) after first year Show forest plot | 7 | 610 | Risk Ratio (M‐H, Fixed, 95% CI) | 2.00 [1.47, 2.72] |
| 2.1 Objective/genuine stress incontinence (only) | 7 | 610 | Risk Ratio (M‐H, Fixed, 95% CI) | 2.00 [1.47, 2.72] |
| 2.2 Subjective stress incontinence (only) | 0 | 0 | Risk Ratio (M‐H, Fixed, 95% CI) | 0.0 [0.0, 0.0] |
| 2.3 Mixed incontinence | 0 | 0 | Risk Ratio (M‐H, Fixed, 95% CI) | 0.0 [0.0, 0.0] |
| 3 Number not improved (worse or unchanged) within first year Show forest plot | 1 | 50 | Risk Ratio (M‐H, Fixed, 95% CI) | 0.75 [0.07, 7.73] |
| 3.1 Objective/genuine stress incontinence (only) | 1 | 50 | Risk Ratio (M‐H, Fixed, 95% CI) | 0.75 [0.07, 7.73] |
| 3.2 Subjective stress incontinence (only) | 0 | 0 | Risk Ratio (M‐H, Fixed, 95% CI) | 0.0 [0.0, 0.0] |
| 3.3 Mixed incontinence | 0 | 0 | Risk Ratio (M‐H, Fixed, 95% CI) | 0.0 [0.0, 0.0] |
| 4 Number not improved (worse or unchanged) after first year Show forest plot | 1 | 51 | Risk Ratio (M‐H, Fixed, 95% CI) | 1.5 [0.37, 6.04] |
| 4.1 Objective/genuine stress incontinence (only) | 1 | 51 | Risk Ratio (M‐H, Fixed, 95% CI) | 1.5 [0.37, 6.04] |
| 4.2 Subjective stress incontinence (only) | 0 | 0 | Risk Ratio (M‐H, Fixed, 95% CI) | 0.0 [0.0, 0.0] |
| 4.3 Mixed incontinence | 0 | 0 | Risk Ratio (M‐H, Fixed, 95% CI) | 0.0 [0.0, 0.0] |
| 5 Urge symptoms or urge incontinence Show forest plot | 4 | 297 | Risk Ratio (M‐H, Fixed, 95% CI) | 1.80 [0.71, 4.56] |
| 5.1 Objective/genuine stress incontinence (only) | 4 | 297 | Risk Ratio (M‐H, Fixed, 95% CI) | 1.80 [0.71, 4.56] |
| 5.2 Subjective stress incontinence (only) | 0 | 0 | Risk Ratio (M‐H, Fixed, 95% CI) | 0.0 [0.0, 0.0] |
| 5.3 Mixed incontinence | 0 | 0 | Risk Ratio (M‐H, Fixed, 95% CI) | 0.0 [0.0, 0.0] |
| 6 Voiding dysfunction after 3 months Show forest plot | 4 | 202 | Risk Ratio (M‐H, Fixed, 95% CI) | 2.12 [0.81, 5.55] |
| 6.1 Objective/genuine stress incontinence (only) | 4 | 202 | Risk Ratio (M‐H, Fixed, 95% CI) | 2.12 [0.81, 5.55] |
| 6.2 Subjective stress incontinence (only) | 0 | 0 | Risk Ratio (M‐H, Fixed, 95% CI) | 0.0 [0.0, 0.0] |
| 6.3 Mixed incontinence | 0 | 0 | Risk Ratio (M‐H, Fixed, 95% CI) | 0.0 [0.0, 0.0] |
| 7 Detrusor overactivity (objective diagnosis by urodynamics) Show forest plot | 2 | 101 | Risk Ratio (M‐H, Fixed, 95% CI) | 2.91 [0.73, 11.58] |
| 7.1 Objective/genuine stress incontinence (only) | 2 | 101 | Risk Ratio (M‐H, Fixed, 95% CI) | 2.91 [0.73, 11.58] |
| 7.2 Subjective stress incontinence (only) | 0 | 0 | Risk Ratio (M‐H, Fixed, 95% CI) | 0.0 [0.0, 0.0] |
| 7.3 Mixed incontinence | 0 | 0 | Risk Ratio (M‐H, Fixed, 95% CI) | 0.0 [0.0, 0.0] |
| 8 New or persistent prolapse Show forest plot | 1 | 72 | Risk Ratio (M‐H, Fixed, 95% CI) | 2.24 [0.21, 23.57] |
| 8.1 Objective/genuine stress incontinence (only) | 1 | 72 | Risk Ratio (M‐H, Fixed, 95% CI) | 2.24 [0.21, 23.57] |
| 8.2 Subjective stress incontinence (only) | 0 | 0 | Risk Ratio (M‐H, Fixed, 95% CI) | 0.0 [0.0, 0.0] |
| 8.3 Mixed incontinence | 0 | 0 | Risk Ratio (M‐H, Fixed, 95% CI) | 0.0 [0.0, 0.0] |
| 9 Peri‐operative surgical complications Show forest plot | 3 | 152 | Risk Ratio (M‐H, Fixed, 95% CI) | 1.44 [0.73, 2.83] |
| 9.1 Objective/genuine stress incontinence (only) | 3 | 152 | Risk Ratio (M‐H, Fixed, 95% CI) | 1.44 [0.73, 2.83] |
| 9.2 Subjective stress incontinence (only) | 0 | 0 | Risk Ratio (M‐H, Fixed, 95% CI) | 0.0 [0.0, 0.0] |
| 9.3 Mixed incontinence | 0 | 0 | Risk Ratio (M‐H, Fixed, 95% CI) | 0.0 [0.0, 0.0] |
| 10 Length of stay/time to return to normal function Show forest plot | Other data | No numeric data | ||
| Outcome or subgroup title | No. of studies | No. of participants | Statistical method | Effect size |
| 1 Number not cured (worse, unchanged or improved) within first year Show forest plot | 3 | 417 | Risk Ratio (M‐H, Fixed, 95% CI) | 2.05 [1.20, 3.50] |
| 1.1 Objective/genuine stress incontinence (only) | 3 | 417 | Risk Ratio (M‐H, Fixed, 95% CI) | 2.05 [1.20, 3.50] |
| 1.2 Subjective stress incontinence (only) | 0 | 0 | Risk Ratio (M‐H, Fixed, 95% CI) | 0.0 [0.0, 0.0] |
| 1.3 Mixed incontinence | 0 | 0 | Risk Ratio (M‐H, Fixed, 95% CI) | 0.0 [0.0, 0.0] |
| 2 Number not cured (worse, unchanged or improved) after first year Show forest plot | 3 | 408 | Risk Ratio (M‐H, Fixed, 95% CI) | 2.37 [1.54, 3.66] |
| 2.1 Objective/genuine stress incontinence (only) | 3 | 408 | Risk Ratio (M‐H, Fixed, 95% CI) | 2.37 [1.54, 3.66] |
| 2.2 Subjective stress incontinence (only) | 0 | 0 | Risk Ratio (M‐H, Fixed, 95% CI) | 0.0 [0.0, 0.0] |
| 2.3 Mixed incontinence | 0 | 0 | Risk Ratio (M‐H, Fixed, 95% CI) | 0.0 [0.0, 0.0] |
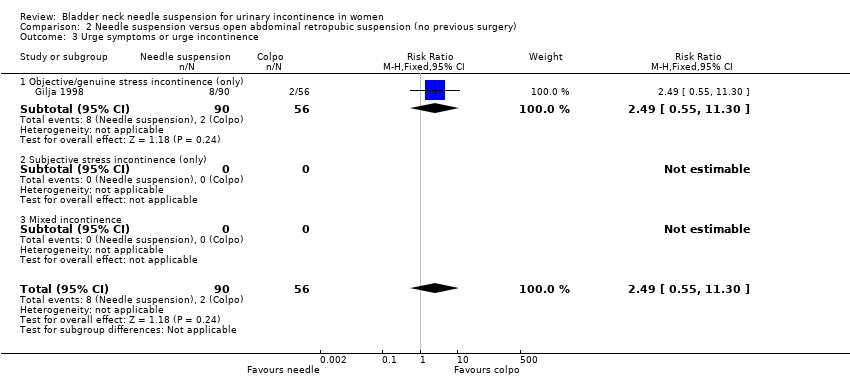
| 3 Urge symptoms or urge incontinence Show forest plot | 1 | 146 | Risk Ratio (M‐H, Fixed, 95% CI) | 2.49 [0.55, 11.30] |
| 3.1 Objective/genuine stress incontinence (only) | 1 | 146 | Risk Ratio (M‐H, Fixed, 95% CI) | 2.49 [0.55, 11.30] |
| 3.2 Subjective stress incontinence (only) | 0 | 0 | Risk Ratio (M‐H, Fixed, 95% CI) | 0.0 [0.0, 0.0] |
| 3.3 Mixed incontinence | 0 | 0 | Risk Ratio (M‐H, Fixed, 95% CI) | 0.0 [0.0, 0.0] |
| 4 New or persistent prolapse Show forest plot | 1 | 72 | Risk Ratio (M‐H, Fixed, 95% CI) | 2.24 [0.21, 23.57] |
| 4.1 Objective/genuine stress incontinence (only) | 1 | 72 | Risk Ratio (M‐H, Fixed, 95% CI) | 2.24 [0.21, 23.57] |
| 4.2 Subjective stress incontinence (only) | 0 | 0 | Risk Ratio (M‐H, Fixed, 95% CI) | 0.0 [0.0, 0.0] |
| 4.3 Mixed incontinence | 0 | 0 | Risk Ratio (M‐H, Fixed, 95% CI) | 0.0 [0.0, 0.0] |
| Outcome or subgroup title | No. of studies | No. of participants | Statistical method | Effect size |
| 1 Number not cured (worse, unchanged or improved) within first year Show forest plot | 2 | 100 | Risk Ratio (M‐H, Fixed, 95% CI) | 1.12 [0.55, 2.29] |
| 1.1 Objective/genuine stress incontinence (only) | 2 | 100 | Risk Ratio (M‐H, Fixed, 95% CI) | 1.12 [0.55, 2.29] |
| 1.2 Subjective stress incontinence (only) | 0 | 0 | Risk Ratio (M‐H, Fixed, 95% CI) | 0.0 [0.0, 0.0] |
| 1.3 Mixed incontinence | 0 | 0 | Risk Ratio (M‐H, Fixed, 95% CI) | 0.0 [0.0, 0.0] |
| 2 Number not cured (worse, unchanged or improved) after first year Show forest plot | 4 | 202 | Risk Ratio (M‐H, Fixed, 95% CI) | 1.61 [1.04, 2.49] |
| 2.1 Objective/genuine stress incontinence (only) | 4 | 202 | Risk Ratio (M‐H, Fixed, 95% CI) | 1.61 [1.04, 2.49] |
| 2.2 Subjective stress incontinence (only) | 0 | 0 | Risk Ratio (M‐H, Fixed, 95% CI) | 0.0 [0.0, 0.0] |
| 2.3 Mixed incontinence | 0 | 0 | Risk Ratio (M‐H, Fixed, 95% CI) | 0.0 [0.0, 0.0] |
| 3 Number not improved (worse or unchanged) within first year Show forest plot | 1 | 50 | Risk Ratio (M‐H, Fixed, 95% CI) | 0.75 [0.07, 7.73] |
| 3.1 Objective/genuine stress incontinence (only) | 1 | 50 | Risk Ratio (M‐H, Fixed, 95% CI) | 0.75 [0.07, 7.73] |
| 3.2 Subjective stress incontinence (only) | 0 | 0 | Risk Ratio (M‐H, Fixed, 95% CI) | 0.0 [0.0, 0.0] |
| 3.3 Mixed incontinence | 0 | 0 | Risk Ratio (M‐H, Fixed, 95% CI) | 0.0 [0.0, 0.0] |
| 4 Number not improved (worse or unchanged) after first year Show forest plot | 1 | 51 | Risk Ratio (M‐H, Fixed, 95% CI) | 1.5 [0.37, 6.04] |
| 4.1 Objective/genuine stress incontinence (only) | 1 | 51 | Risk Ratio (M‐H, Fixed, 95% CI) | 1.5 [0.37, 6.04] |
| 4.2 Subjective stress incontinence (only) | 0 | 0 | Risk Ratio (M‐H, Fixed, 95% CI) | 0.0 [0.0, 0.0] |
| 4.3 Mixed incontinence | 0 | 0 | Risk Ratio (M‐H, Fixed, 95% CI) | 0.0 [0.0, 0.0] |
| 5 Urge symptoms or urge incontinence Show forest plot | 3 | 151 | Risk Ratio (M‐H, Fixed, 95% CI) | 1.40 [0.42, 4.59] |
| 5.1 Objective/genuine stress incontinence (only) | 3 | 151 | Risk Ratio (M‐H, Fixed, 95% CI) | 1.40 [0.42, 4.59] |
| 5.2 Subjective stress incontinence (only) | 0 | 0 | Risk Ratio (M‐H, Fixed, 95% CI) | 0.0 [0.0, 0.0] |
| 5.3 Mixed incontinence | 0 | 0 | Risk Ratio (M‐H, Fixed, 95% CI) | 0.0 [0.0, 0.0] |
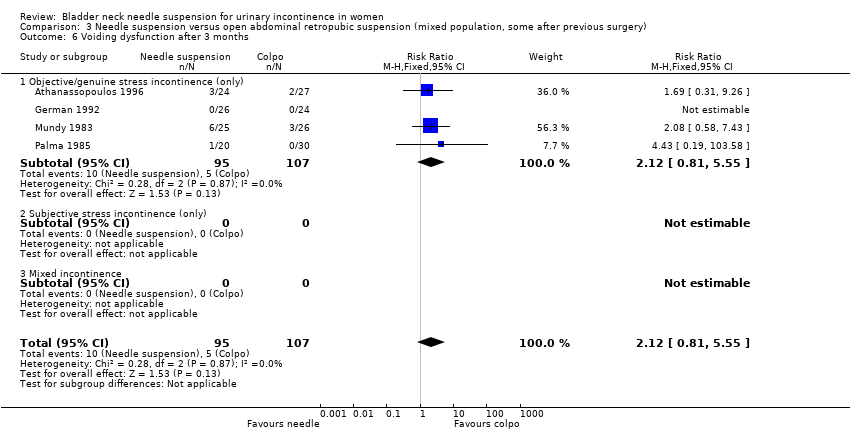
| 6 Voiding dysfunction after 3 months Show forest plot | 4 | 202 | Risk Ratio (M‐H, Fixed, 95% CI) | 2.12 [0.81, 5.55] |
| 6.1 Objective/genuine stress incontinence (only) | 4 | 202 | Risk Ratio (M‐H, Fixed, 95% CI) | 2.12 [0.81, 5.55] |
| 6.2 Subjective stress incontinence (only) | 0 | 0 | Risk Ratio (M‐H, Fixed, 95% CI) | 0.0 [0.0, 0.0] |
| 6.3 Mixed incontinence | 0 | 0 | Risk Ratio (M‐H, Fixed, 95% CI) | 0.0 [0.0, 0.0] |
| 7 Detrusor overactivity (objective diagnosis by urodynamics) Show forest plot | 2 | 101 | Risk Ratio (M‐H, Fixed, 95% CI) | 2.91 [0.73, 11.58] |
| 7.1 Objective/genuine stress incontinence (only) | 2 | 101 | Risk Ratio (M‐H, Fixed, 95% CI) | 2.91 [0.73, 11.58] |
| 7.2 Subjective stress incontinence (only) | 0 | 0 | Risk Ratio (M‐H, Fixed, 95% CI) | 0.0 [0.0, 0.0] |
| 7.3 Mixed incontinence | 0 | 0 | Risk Ratio (M‐H, Fixed, 95% CI) | 0.0 [0.0, 0.0] |
| 8 Peri‐operative surgical complications Show forest plot | 3 | 152 | Risk Ratio (M‐H, Fixed, 95% CI) | 1.44 [0.73, 2.83] |
| 8.1 Objective/genuine stress incontinence (only) | 3 | 152 | Risk Ratio (M‐H, Fixed, 95% CI) | 1.44 [0.73, 2.83] |
| 8.2 Subjective stress incontinence (only) | 0 | 0 | Risk Ratio (M‐H, Fixed, 95% CI) | 0.0 [0.0, 0.0] |
| 8.3 Mixed incontinence | 0 | 0 | Risk Ratio (M‐H, Fixed, 95% CI) | 0.0 [0.0, 0.0] |
| Outcome or subgroup title | No. of studies | No. of participants | Statistical method | Effect size |
| 1 Number not cured (worse, unchanged or improved) within first year Show forest plot | 1 | 20 | Risk Ratio (M‐H, Fixed, 95% CI) | 2.0 [0.21, 18.69] |
| 1.1 Objective/genuine stress incontinence (only) | 1 | 20 | Risk Ratio (M‐H, Fixed, 95% CI) | 2.0 [0.21, 18.69] |
| 1.2 Subjective stress incontinence (only) | 0 | 0 | Risk Ratio (M‐H, Fixed, 95% CI) | 0.0 [0.0, 0.0] |
| 1.3 Mixed incontinence | 0 | 0 | Risk Ratio (M‐H, Fixed, 95% CI) | 0.0 [0.0, 0.0] |
| 2 Number not cured (worse, unchanged or improved) after first year Show forest plot | 1 | 20 | Risk Ratio (M‐H, Fixed, 95% CI) | 3.0 [0.37, 24.17] |
| 2.1 Objective/genuine stress incontinence (only) | 1 | 20 | Risk Ratio (M‐H, Fixed, 95% CI) | 3.0 [0.37, 24.17] |
| 2.2 Subjective stress incontinence (only) | 0 | 0 | Risk Ratio (M‐H, Fixed, 95% CI) | 0.0 [0.0, 0.0] |
| 2.3 Mixed incontinence | 0 | 0 | Risk Ratio (M‐H, Fixed, 95% CI) | 0.0 [0.0, 0.0] |
| 3 Urge symptoms or urge incontinence Show forest plot | 1 | 20 | Risk Ratio (M‐H, Fixed, 95% CI) | 0.6 [0.19, 1.86] |
| 3.1 Objective/genuine stress incontinence (only) | 1 | 20 | Risk Ratio (M‐H, Fixed, 95% CI) | 0.6 [0.19, 1.86] |
| 3.2 Subjective stress incontinence (only) | 0 | 0 | Risk Ratio (M‐H, Fixed, 95% CI) | 0.0 [0.0, 0.0] |
| 3.3 Mixed incontinence | 0 | 0 | Risk Ratio (M‐H, Fixed, 95% CI) | 0.0 [0.0, 0.0] |
| 4 Voiding dysfunction after 3 months Show forest plot | 1 | 20 | Risk Ratio (M‐H, Fixed, 95% CI) | 0.5 [0.12, 2.14] |
| 4.1 Objective/genuine stress incontinence (only) | 1 | 20 | Risk Ratio (M‐H, Fixed, 95% CI) | 0.5 [0.12, 2.14] |
| 4.2 Subjective stress incontinence (only) | 0 | 0 | Risk Ratio (M‐H, Fixed, 95% CI) | 0.0 [0.0, 0.0] |
| 4.3 Mixed incontinence | 0 | 0 | Risk Ratio (M‐H, Fixed, 95% CI) | 0.0 [0.0, 0.0] |
| 5 Detrusor overactivity (objective diagnosis by urodynamics) Show forest plot | 1 | 20 | Risk Ratio (M‐H, Fixed, 95% CI) | 0.5 [0.05, 4.67] |
| 5.1 Objective/genuine stress incontinence (only) | 1 | 20 | Risk Ratio (M‐H, Fixed, 95% CI) | 0.5 [0.05, 4.67] |
| 5.2 Subjective stress incontinence (only) | 0 | 0 | Risk Ratio (M‐H, Fixed, 95% CI) | 0.0 [0.0, 0.0] |
| 5.3 Mixed incontinence | 0 | 0 | Risk Ratio (M‐H, Fixed, 95% CI) | 0.0 [0.0, 0.0] |
| 6 Peri‐operative surgical complications Show forest plot | 1 | 20 | Risk Ratio (M‐H, Fixed, 95% CI) | 0.22 [0.06, 0.78] |
| 6.1 Objective/genuine stress incontinence (only) | 1 | 20 | Risk Ratio (M‐H, Fixed, 95% CI) | 0.22 [0.06, 0.78] |
| 6.2 Subjective stress incontinence (only) | 0 | 0 | Risk Ratio (M‐H, Fixed, 95% CI) | 0.0 [0.0, 0.0] |
| 6.3 Mixed incontinence | 0 | 0 | Risk Ratio (M‐H, Fixed, 95% CI) | 0.0 [0.0, 0.0] |
| 7 Length of inpatient stay Show forest plot | 1 | 20 | Mean Difference (IV, Fixed, 95% CI) | ‐13.0 [‐19.00, ‐5.00] |
| 7.1 Objective/genuine stress incontinence (only) | 1 | 20 | Mean Difference (IV, Fixed, 95% CI) | ‐13.0 [‐19.00, ‐5.00] |
| 7.2 Subjective stress incontinence (only) | 0 | 0 | Mean Difference (IV, Fixed, 95% CI) | 0.0 [0.0, 0.0] |
| 7.3 Mixed incontinence | 0 | 0 | Mean Difference (IV, Fixed, 95% CI) | 0.0 [0.0, 0.0] |
| Outcome or subgroup title | No. of studies | No. of participants | Statistical method | Effect size |
| 1 Number not cured (worse, unchanged or improved) within first year Show forest plot | 2 | 266 | Risk Ratio (M‐H, Fixed, 95% CI) | 0.96 [0.63, 1.46] |
| 1.1 Objective/genuine stress incontinence (only) | 2 | 266 | Risk Ratio (M‐H, Fixed, 95% CI) | 0.96 [0.63, 1.46] |
| 1.2 Subjective stress incontinence (only) | 0 | 0 | Risk Ratio (M‐H, Fixed, 95% CI) | 0.0 [0.0, 0.0] |
| 1.3 Mixed incontinence | 0 | 0 | Risk Ratio (M‐H, Fixed, 95% CI) | 0.0 [0.0, 0.0] |
| 2 Number not cured (worse, unchanged or improved) after first year Show forest plot | 3 | 337 | Risk Ratio (M‐H, Fixed, 95% CI) | 0.86 [0.64, 1.16] |
| 2.1 Objective/genuine stress incontinence (only) | 2 | 257 | Risk Ratio (M‐H, Fixed, 95% CI) | 0.93 [0.68, 1.26] |
| 2.2 Subjective stress incontinence (only) | 0 | 0 | Risk Ratio (M‐H, Fixed, 95% CI) | 0.0 [0.0, 0.0] |
| 2.3 Mixed incontinence | 1 | 80 | Risk Ratio (M‐H, Fixed, 95% CI) | 0.53 [0.19, 1.46] |
| 3 Urge symptoms or urge incontinence Show forest plot | 1 | Risk Ratio (M‐H, Fixed, 95% CI) | Totals not selected | |
| 3.1 Objective/genuine stress incontinence (only) | 0 | Risk Ratio (M‐H, Fixed, 95% CI) | 0.0 [0.0, 0.0] | |
| 3.2 Subjective stress incontinence (only) | 0 | Risk Ratio (M‐H, Fixed, 95% CI) | 0.0 [0.0, 0.0] | |
| 3.3 Mixed incontinence | 1 | Risk Ratio (M‐H, Fixed, 95% CI) | 0.0 [0.0, 0.0] | |
| 4 Voiding dysfunction after 3 months Show forest plot | 3 | Risk Ratio (M‐H, Fixed, 95% CI) | Totals not selected | |
| 4.1 Objective/genuine stress incontinence (only) | 2 | Risk Ratio (M‐H, Fixed, 95% CI) | 0.0 [0.0, 0.0] | |
| 4.2 Subjective stress incontinence (only) | 0 | Risk Ratio (M‐H, Fixed, 95% CI) | 0.0 [0.0, 0.0] | |
| 4.3 Mixed incontinence | 1 | Risk Ratio (M‐H, Fixed, 95% CI) | 0.0 [0.0, 0.0] | |
| 5 Peri‐operative surgical complications Show forest plot | 1 | Risk Ratio (M‐H, Fixed, 95% CI) | Totals not selected | |
| 5.1 Objective/genuine stress incontinence (only) | 0 | Risk Ratio (M‐H, Fixed, 95% CI) | 0.0 [0.0, 0.0] | |
| 5.2 Subjective stress incontinence (only) | 0 | Risk Ratio (M‐H, Fixed, 95% CI) | 0.0 [0.0, 0.0] | |
| 5.3 Mixed incontinence | 1 | Risk Ratio (M‐H, Fixed, 95% CI) | 0.0 [0.0, 0.0] | |
| 6 New or persistent prolapse Show forest plot | 1 | Risk Ratio (M‐H, Fixed, 95% CI) | Totals not selected | |
| 6.1 Objective/genuine stress incontinence (only) | 0 | Risk Ratio (M‐H, Fixed, 95% CI) | 0.0 [0.0, 0.0] | |
| 6.2 Subjective stress incontinence (only) | 0 | Risk Ratio (M‐H, Fixed, 95% CI) | 0.0 [0.0, 0.0] | |
| 6.3 Mixed incontinence | 1 | Risk Ratio (M‐H, Fixed, 95% CI) | 0.0 [0.0, 0.0] | |
| Outcome or subgroup title | No. of studies | No. of participants | Statistical method | Effect size |
| 1 Number not cured (worse, unchanged or improved) within first year Show forest plot | 1 | 90 | Risk Ratio (M‐H, Fixed, 95% CI) | 2.87 [0.31, 26.56] |
| 1.1 Raz versus transvaginal Burch (Gilja) | 1 | 90 | Risk Ratio (M‐H, Fixed, 95% CI) | 2.87 [0.31, 26.56] |
| 2 Number not cured (worse, unchanged or improved) after first year Show forest plot | 1 | 90 | Risk Ratio (M‐H, Fixed, 95% CI) | 1.67 [0.53, 5.32] |
| 2.1 Raz versus transvaginal Burch (Gilja) | 1 | 90 | Risk Ratio (M‐H, Fixed, 95% CI) | 1.67 [0.53, 5.32] |
| 3 Urge symptoms or urge incontinence Show forest plot | 1 | 90 | Risk Ratio (M‐H, Fixed, 95% CI) | 1.59 [0.40, 6.28] |
| 3.1 Raz versus transvaginal Burch (Gilja) | 1 | 90 | Risk Ratio (M‐H, Fixed, 95% CI) | 1.59 [0.40, 6.28] |
| Outcome or subgroup title | No. of studies | No. of participants | Statistical method | Effect size |
| 1 Number not cured (worse, unchanged or improved) within first year Show forest plot | 1 | 20 | Risk Ratio (M‐H, Fixed, 95% CI) | 0.17 [0.01, 2.94] |
| 2 Number not improved (worse or unchanged) within first year Show forest plot | 1 | 20 | Risk Ratio (M‐H, Fixed, 95% CI) | 0.4 [0.02, 8.78] |
| 3 Urge symptoms or urge incontinence Show forest plot | 1 | 20 | Risk Ratio (M‐H, Fixed, 95% CI) | 0.24 [0.01, 4.44] |
| 4 Pain score Show forest plot | 1 | Mean Difference (IV, Fixed, 95% CI) | Subtotals only | |
| 4.1 At one month | 1 | 19 | Mean Difference (IV, Fixed, 95% CI) | ‐0.60 [‐1.87, 0.67] |
| 4.2 At three months | 1 | 20 | Mean Difference (IV, Fixed, 95% CI) | ‐0.92 [‐1.77, ‐0.07] |