Interventions for protecting renal function in the perioperative period
Abstract
Background
Various methods have been used to try to protect kidney function in patients undergoing surgery. These most often include pharmacological interventions such as dopamine and its analogues, diuretics, calcium channel blockers, angiotensin‐converting enzyme (ACE) inhibitors, N‐acetyl cysteine (NAC), atrial natriuretic peptide (ANP), sodium bicarbonate, antioxidants and erythropoietin (EPO).
Objectives
This review is aimed at determining the effectiveness of various measures advocated to protect patients' kidneys during the perioperative period.
We considered the following questions: (1) Are any specific measures known to protect kidney function during the perioperative period? (2) Of measures used to protect the kidneys during the perioperative period, does any one method appear to be more effective than the others? (3) Of measures used to protect the kidneys during the perioperative period,does any one method appear to be safer than the others?
Search methods
In this updated review, we searched the Cochrane Central Register of Controlled Trials (CENTRAL) (The Cochrane Library, Issue 2, 2012), MEDLINE (Ovid SP) (1966 to August 2012) and EMBASE (Ovid SP) (1988 to August 2012). We originally handsearched six journals (Anesthesia and Analgesia, Anesthesiology, Annals of Surgery, British Journal of Anaesthesia, Journal of Thoracic and Cardiovascular Surgery, and Journal of Vascular Surgery) (1985 to 2004). However, because these journals are properly indexed in MEDLINE, we decided to rely on electronic searches only without handsearching the journals from 2004 onwards.
Selection criteria
We selected all randomized controlled trials in adults undergoing surgery for which a treatment measure was used for the purpose of providing renal protection during the perioperative period.
Data collection and analysis
We selected 72 studies for inclusion in this review. Two review authors extracted data from all selected studies and entered them into RevMan 5.1; then the data were appropriately analysed. We performed subgroup analyses for type of intervention, type of surgical procedure and pre‐existing renal dysfunction. We undertook sensitivity analyses for studies with high and moderately good methodological quality.
Main results
The updated review included data from 72 studies, comprising a total of 4378 participants. Of these, 2291 received some form of treatment and 2087 acted as controls. The interventions consisted most often of different pharmaceutical agents, such as dopamine and its analogues, diuretics, calcium channel blockers, ACE inhibitors, NAC, ANP, sodium bicarbonate, antioxidants and EPO or selected hydration fluids. Some clinical heterogeneity and varying risk of bias were noted amongst the studies, although we were able to meaningfully interpret the data. Results showed significant heterogeneity and indicated that most interventions provided no benefit.
Data on perioperative mortality were reported in 41 studies and data on acute renal injury in 44 studies (all interventions combined). Because of considerable clinical heterogeneity (different clinical scenarios, as well as considerable methodological variability amongst the studies), we did not perform a meta‐analysis on the combined data.
Subgroup analysis of major interventions and surgical procedures showed no significant influence of interventions on reported mortality and acute renal injury. For the subgroup of participants who had pre‐existing renal damage, the risk of mortality from 10 trials (959 participants) was estimated as odds ratio (OR) 0.76, 95% confidence interval (CI) 0.38 to 1.52; the risk of acute renal injury (as reported in the trials) was estimated from 11 trials (979 participants) as OR 0.43, 95% CI 0.23 to 0.80. Subgroup analysis of studies that were rated as having low risk of bias revealed that 19 studies reported mortality numbers (1604 participants); OR was 1.01, 95% CI 0.54 to 1.90. Fifteen studies reported data on acute renal injury (criteria chosen by the individual studies; 1600 participants); OR was 1.03, 95% CI 0.54 to 1.97.
Authors' conclusions
No reliable evidence from the available literature suggests that interventions during surgery can protect the kidneys from damage. However, the criteria used to diagnose acute renal damage varied in many of the older studies selected for inclusion in this review, many of which suffered from poor methodological quality such as insufficient participant numbers and poor definitions of end points such as acute renal failure and acute renal injury. Recent methods of detecting renal damage such as the use of specific biomarkers and better defined criteria for identifying renal damage (RIFLE (risk, injury, failure, loss of kidney function and end‐stage renal failure) or AKI (acute kidney injury)) may have to be explored further to determine any possible benefit derived from interventions used to protect the kidneys during the perioperative period.
PICO
Plain language summary
No evidence indicates that any of the measures used to protect patients' kidneys during the perioperative period are beneficial
The kidneys may be damaged during an operation as a result of direct and indirect insult. The reasons for this are multiple and include changes to physiology brought on by the surgery and by the body’s response to such insult. Damage to kidneys during the perioperative period is associated with significant morbidity and mortality. This updated Cochrane review looked at 72 randomized controlled trials (RCTs) with 4378 participants (search data until August 2012); interventions most often included pharmacological interventions (administration of dopamine and its analogues, diuretics, calcium channel blockers, angiotensin‐converting enzyme (ACE) inhibitors, N‐acetyl cysteine, atrial natriuretic peptide, sodium bicarbonate, antioxidants and erythropoietin) or selected hydration fluids. We attempted to identify any possible damage to the kidneys by evaluating kidney function up to seven days after the operation.
No clear evidence from available RCTs suggests that any of the measures used to protect the kidneys during the perioperative period are beneficial. These findings held true in 14 studies of patients with pre‐existing renal damage and in 24 studies that were considered of good methodological quality. The primary outcomes of these studies were mortality and acute renal injury. Reported mortality in studies with low risk of bias was not different between intervention and control groups (odds ratio (OR) 1.01, 95% confidence interval (CI) 0.52 to 1.97) or for acute renal injury (OR 1.05, 95% CI 0.55 to 2.03). The summary of findings revealed a similar picture. So we conclude that evidence suggests that none of the interventions used currently are helpful in protecting the kidneys during the perioperative period, nor do they cause increased harm.
Authors' conclusions
Summary of findings
| Interventions for protecting renal function in patients with pre‐existing renal impairment who are undergoing surgery | ||||||
| Patient or population: patients with pre‐existing renal impairment Settings: perioperative period (7 days) Intervention: interventions to protect the kidneys during the perioperative period Comparison: placebo or no intervention | ||||||
| Outcomes | Illustrative comparative risks* (95% CI) | Relative effect | No. of participants | Quality of the evidence | Comments | |
| Assumed risk | Corresponding risk | |||||
| Placebo or no intervention | Various interventions | |||||
| Mortality in patients with pre‐existing renal impairment As reported in the included trials Folliow‐up: 7 days | Study population | OR 0.74 (0.36 to 1.52) | 959 | ⊕⊝⊝⊝ | Evidence is not strong and is of poor quality | |
| 38 per 1000 | 29 per 1000 | |||||
| Moderate | ||||||
| 20 per 1000 | 15 per 1000 (8 to 30) | |||||
| Acute renal injury in patients with pre‐existing renal impairment As reported in the included trials Follow‐up: 1 to 7 days | Study population | OR 0.40 (0.22 to 0.76) | 979 | ⊕⊝⊝⊝ | Evidence is not strong and is of poor quality (although it might give a statistical edge) | |
| 62 per 1000 | 28 per 1000 | |||||
| Moderate | ||||||
| 40 per 1000 | 18 per 1000 (9 to 32) | |||||
| *The basis for the assumed risk (e.g. the median control group risk across studies) is provided in the footnotes. The corresponding risk (and its 95% confidence interval) is based on the assumed risk in the comparison group and the relative effect of the intervention (and its 95% CI). CI: Confidence interval; OR: Odds ratio. | ||||||
| GRADE Working Group grades of evidence: | ||||||
| aOnly six of the 10 studies showed low risk of bias. | ||||||
| Interventions to protect the kidneys during the perioperative period in patients undergoing surgery: low ROB studies only | ||||||
| Patient or population: patients undergoing surgery Comparison: placebo or no intervention | ||||||
| Outcomes | Illustrative comparative risks* (95% CI) | Relative effect | No. of participants | Quality of the evidence | Comments | |
| Assumed risk | Corresponding risk | |||||
| Control | Interventions to protect the kidneys: low ROB cases only | |||||
| Reported mortality, low risk of bias studies only | Study population | OR 1.01 | 1604 | ⊕⊝⊝⊝ | Evidence is not strong and is of poor quality | |
| 23 per 1000 | 23 per 1000 | |||||
| Moderate | ||||||
| 20 per 1000 | 20 per 1000 | |||||
| Acute renal injury, low‐risk studies only | Study population | OR 1.05 | 1550 | ⊕⊝⊝⊝ | Evidence is not strong and is of poor quality (although it might give a statistical edge) | |
| 23 per 1000 | 24 per 1000 | |||||
| Moderate | ||||||
| 0 per 1000 | 0 per 1000 | |||||
| *The basis for the assumed risk (e.g. the median control group risk across studies) is provided in the footnotes. The corresponding risk (and its 95% confidence interval) is based on the assumed risk in the comparison group and the relative effect of the intervention (and its 95% CI). | ||||||
| GRADE Working Group grades of evidence: | ||||||
| aOnly six of the 10 studies showed low risk of bias. | ||||||
Background
Description of the condition
Intraoperative changes in renal blood flow and glomerular filtration rate are common. Postoperative renal dysfunction is mainly attributed to adverse events that occur during the perioperative period, including hypotension, hypovolaemia and sepsis, or it may be due to perioperative administration of contrast material (Morcos 2004). The reported risk of perioperative renal failure varies according to aetiology, definition and type of surgery; acute renal failure during the perioperative period is a serious complication associated with considerable morbidity and mortality. When postoperative renal dysfunction occurs, it is generally thought to be multi‐factorial in nature.
Description of the intervention
Over the past few decades, attempts have been made to protect the kidneys both during surgery and in the immediate postoperative period (Wang 2003). Various regimens, such as low‐dose dopamine, dopexamine, fenoldopam or diuretics, have been tried. The results are somewhat uncertain, hence a number of other measures have been tried. These include N‐acetyl cysteine (Adabag 2008; Barr 2008; Burns 2005; Fischer 2005; Hynninen 2006; Prasad 2010; Ristikankare 2006), atrial natriuretic peptide (ANP) (Chen 2007; Mitaka 2008; Sezai 2000; Sezai 2009) and erythropoietin (EPO) (Song 2009). Amongst nephrologists, considerable enthusiasm has surrounded the potential for EPO to provide some renal protection (Johnson 2006).
Different tests, some simple and some complicated, are used with varying success to detect acute kidney injury (AKI) in the perioperative period. Measurement of urine output over a 24‐hour period after surgery is one of the simpler tests. A commonly used measure is creatinine clearance, which is often examined by using the Cockcroft‐Gault formula, which takes into consideration the age, body weight and sex of the individual, as well as serum creatinine levels. Glomurular filtration rate (GFR) can be measured, as can renal plasma flow. Other tests include assessment of the ability of kidneys to clear a water load (free water clearance) and to excrete sodium (fractional excretion of sodium).
Several newer tests are used as markers of renal damage. The ratio in urine of microalbumin to creatinine (Hynninen 2006; Turner 2008) has been used but is considered an index of kidney damage, most often in chronic kidney disease. Urinary N‐acetyl‐beta‐D‐glucosaminidase (U‐NAG) to creatinine ratio (Hynninen 2006; Mitaka 2008), retinol‐binding protein (RBP) to creatinine ratio and urinary neutrophil gelatinase‐associated lipocalin (NGAL) to creatinine ratio are newer methods that can be used to detect renal damage; we have looked at these tests in preparing this update of the review. Plasma cystatin C (CysC) (Chen 2007; Haase 2007; Harten 2008; Hynninen 2006) is another available marker. In a recent study (Endre 2011), glutamytranspeptidase (GGT), alkaline phosphatase (ALP), NGAL, CysC, kidney injury molecule‐1 (KIM‐1) and interleukin‐18 (IL‐18) were used in intensive care units as biomarkers of acute kidney injury.
How the intervention might work
Over the past few decades, several strategies have been used to attempt to protect the kidneys both during surgery and in the immediate postoperative period on a physiological basis (maintaining adequate cardiac output, maintaining renal vasodilatation, suppressing renal vasoconstriction and maintaining renal tubular flow). Various pharmacological regimens, such as use of low‐dose dopamine, dopexamine, calcium channel blockers, angiotensin‐converting enzyme (ACE) inhibitors or diuretics, have been tried. Some success has been reported with such interventions (Welch 1995) but no clear evidence of success (Renton 2005) or of deterioration in renal function has been found (Lassnigg 2000).
Dopamine, an endogenous catecholamine, given at a dose of 2 µg·kg·min to 5 µg·kg·min (low‐dose or renal dopamine), causes renal vasodilatation with a dose‐dependent increase in renal blood flow (McDonald 1964; Seri 1988); at higher doses, dopamine augments renal blood flow by increasing cardiac output through β‐adrenergic stimulation. The effect of dopamine has been studied extensively over the years (ANZICS CTG 2000). The net sum of these actions is seen as an increase in renal blood flow, an increase in GFR, diuresis and natriuresis. Mannitol, an osmotic diuretic, attenuates ischaemic reperfusion injury through multiple mechanisms, including maintenance of glomerular filtration pressure, prevention of tubular obstruction by cellular casts, scavenging of hydroxyl free radicals and prevention of cellular swelling (Schrier 1984). Furosemide, a loop diuretic, blocks ion transport activity in the medullary thick ascending loop of Henle and enhances tubular oxygen balance by decreasing tubular oxygen demand and consumption. However, loop diuretics also cause renal cortical vasodilatation, resulting in redistribution of blood flow, which could undermine the benefit previously described (Moitra 2009). Calcium channel blockers appear to confer protection against intracellular calcium injury in ischaemic reperfusion injury (Schrier 1991). Rapid administration of fluids results in expansion of intravascular volume, leading to an increase in cardiac output. ACE inhibitors alter the balance between the vasoconstrictive and salt‐retentive properties of angiotensin ІІ and between the vasodilatory and natriuretic properties of bradykinin (Brown 1998). In the kidneys, ACE inhibitors decrease glomerular capillary pressure by decreasing arterial pressure and by selectively dilating efferent arterioles (Anderson 1986).
N‐acetyl cysteine (NAC) has a variety of biological actions. It is an antioxidant (Zafarullah 2003); it stimulates endothelium‐derived relaxing factor, thereby improving microvascular flow (Kiefer 2000); and it increases cyclic guanosine monophosphate (GMP) levels, thereby acting as a vasodilator and as an inhibitor of platelet aggregation. These various clinical actions might have led several investigators to focus on the use of NAC for the prevention of contrast‐induced nephropathy (CIN) (Kay 2003; Tepel 2000). The natriuretic peptides play an important role in cardiovascular, renal and endocrine homeostasis. The natriuretic and diuretic actions of ANP are due to renal haemodynamic and direct tubular actions (Levin 1998). ANP increases GFR by increasing pressure within the glomerular capillaries (Marin‐Grez 1986). ANP also inhibits angiotensin II-stimulated sodium and water transport in proximal tubules (Harris 1987), vasopressin‐stimulated water transport in the collecting tubules (Dillingham 1986) and sodium absorption in the inner medullary collecting duct (Sonnenberg 1986). The combined effect of all of this consists of natriuresis and diuresis. Thus ANP has been used to try to counteract the two proposed pathophysiological mechanisms of decreased GFR in AKI, namely, reduced glomerular perfusion and tubular obstruction (Edelstein 1997). Accumulating evidence indicates that EPO has tissue protective or pleiotropic effects (Chatterjee 2005; Maiese 2005) that may be useful in preventing or treating AKI. The protective mechanisms are multi‐factorial and involve inhibition of apoptotic cell death, stimulation of cellular regeneration, inhibition of deleterious pathways and promotion of recovery (Moore 2011).
Why it is important to do this review
The previously published version of this review (Zacharias 2008) was unable to detect much benefit derived from various interventions to protect the kidneys during the perioperative period. The efficacy of dopamine and its analogues, diuretics, calcium channel blockers, ACE inhibitors, NAC, ANP, sodium bicarbonate, EPO and antioxidants has yet to be proved in the capacity of reversing or preventing AKI during the perioperative period. In this updated review, we are taking a fresh look at the current status of this important topic.
Objectives
This review is aimed at determining the effectiveness of various measures advocated to protect patients' kidneys during the perioperative period.
We considered the following questions: (1) Are any specific measures known to protect kidney function during the perioperative period? (2) Of measures used to protect the kidneys during the perioperative period, does any one method appear to be more effective than the others? (3) Of measures used to protect the kidneys during the perioperative period,does any one method appear to be safer than the others?
Methods
Criteria for considering studies for this review
Types of studies
We considered all randomized controlled trials of any intervention (dopamine and its analogues, diuretics, calcium channel blockers, ACE inhibitors, N‐acetyl cysteine, atrial natriuretic peptides, hydration fluids or any other interventions) versus control (placebo or no intervention), published in any language.
Types of participants
We included participants undergoing all types of major surgery during which a specified intervention was used to protect the kidneys from possible damage during surgery. We did not include studies that specifically considered a paediatric population. We did not include studies with participants undergoing transplant surgery (heart, liver or kidney) because of the complexity of the surgery and the postoperative management required for these participants.
Types of interventions
We included studies that used the following interventions to maintain or protect kidney function during anaesthesia and surgery.
-
Dopamine and its analogues.
-
Diuretics.
-
Calcium channel blockers.
-
Angiotensin‐converting enzyme (ACE) inhibitors.
-
Hydration fluids.
-
N‐acetyl cysteine.
-
Atrial natriuretic peptide.
-
Erythropoietin (EPO).
-
Any other measures.
Types of outcome measures
Primary outcomes
Postoperative adverse outcomes. These included significant adverse outcomes: acute renal failure or death.
Secondary outcomes
Any changes in perioperative renal function. These included the following measures.
-
Urine output.
-
Creatinine clearance (or glomerular filtration rate).
-
Renal plasma flow (or renal blood flow).
-
Free water clearance.
-
Fractional excretion of sodium.
-
Urinary NAG/creatinine ratio.
-
Urinary RBP/creatinine ratio.
-
Plasma cystatin C.
-
Urinary NGAL/creatinine ratio.
Search methods for identification of studies
Electronic searches
In our updated review, we searched the following electronic databases: Cochrane Central Register of Controlled Trials (CENTRAL, The Cochrane Library, Issue 2, 2012); MEDLINE (Ovid SP) (1966 to August 2012); and EMBASE (Ovid SP) (1988 to August 2012). We used the search strategies given in Appendix 1.
Searching other resources
We originally handsearched six major journals in anaesthesia and vascular or thoracic surgery (1985 to 2004).
-
Anesthesia and Analgesia.
-
Anesthesiology.
-
Annals of Surgery.
-
British Journal of Anaesthesia.
-
Journal of Thoracic and Cardiovascular Surgery.
-
Journal of Vascular Surgery.
However, because these journals are properly indexed in MEDLINE, we decided to rely on the electronic searches only without handsearching these journals from 2004 onwards.
Data collection and analysis
Selection of studies
We evaluated for appropriateness of inclusion all studies obtained by the search methods described above, as well as their abstracts and summaries. We obtained full publications for those studies, which required further assessment. Two of the review authors (MZ, NPC or PS or MM) evaluated these studies without prior consideration of the results, and consensus was reached on the final selection. Colleagues at the local hospital or university translated some of the selected studies into English.
Data extraction and management
We used specifically designed data extractions forms to extract the relevant data (Appendix 2). Two authors (MZ, NC or PS or MM) separately extracted and compared data. We resolved differences by discussion and reaching consensus. Wherever we considered it necessary, we attempted to contact the authors for further clarification, data, or both, with limited success.
The data collected included the following.
-
Reported mortality or acute renal failure.
-
Nature of the surgical intervention.
-
Nature of the intervention used.
-
Methodological quality (risk of bias) of the study.
-
Presence of pre‐existing renal damage.
-
Any other relevant information.
Results of the individual studies were reported in many different ways, including means, standard deviations (SDs), standard errors of the mean (SEMs), median or interquartile ranges (IQRs) or ranges. We converted standard errors of the mean and interquartile ranges to standard deviations using appropriate formulae. We considered the interquartile range to be 1.35 times the standard deviation (for the purpose of this review, we assumed that the data were normally distributed). We calculated the standard deviation as the square root of the sample size times the standard error of the mean.
We considered creatinine clearance as a surrogate measure of GFR. When data involved weights, we made an assumption of 70 kg to convert the data. When data were presented in graphical form, we extracted the numerical data from the graphs as accurately as possible. We converted all data to uniform measurements; thus urine output, creatinine clearance, renal plasma flow and free water clearance were expressed in mL/min and fractional excretion of sodium as a percentage, urinary microalbumin/creatinine ratio as mg/mg, U‐NAG (N‐acetyl‐beta‐D‐glucosaminidase)/creatinine ratio as mcmol/mmol, urinary retinol‐binding protein/creatinine ratio as mcg/mmol, urinary NGAL (urinary neutrophil gelatinase‐associated lipocalin)/creatinine ratio as ng/mmol and plasma cystatin C as mg/L.
In this review, we chose to look at data for the various renal function tests at 24 hours, two to three days and five to seven days, because these were the times that the results were most frequently reported in the selected studies. We were reluctant to look at data collected earlier than 24 hours because these would have shown acute changes brought on by anaesthesia and surgery. Even though it is not specified in most of the publications, we assumed that data on urine output at 24 hours reflect the average reading for urine output in the first 24 hours after surgery; the same applies to urine output results at two to four days and five to seven days postoperatively. For measurements such as creatinine clearance, renal plasma flow, free water clearance and fractional excretion of sodium, we assumed that the data were obtained at the specified time.
Assessment of risk of bias in included studies
At least two review authors independently assessed each included study for methodological quality on the basis of assessment of the following domains of quality: randomization, concealment of allocation, blinding and acknowledgement of dropouts. An overall quality assessment was rated as good, moderately good or poor (see Table 1).
| Study ID | Randomization | Allocation concealment | Blinding | Withdrawals recorded | Overall quality |
| Randomly assigned by the investigational pharmacist Block randomization (blocks of 10) | Participants, researchers and clinicians blinded to treatment assignment
| Participants, researchers and clinicians (including data collecting nurse) blinded Drug packets matched in volume, colour, consistency and transparency and given mixed with fruit juice to mask taste | Not reported | Good | |
| ‘Randomly assigned’ into two groups | None described | None described; control group had no treatment | Not described | Poor | |
| ‘Patients were randomized into either diltiazem or no treatment' | Not described | None described; control group had no treatment | Not described | Poor | |
| ‘Prospectively randomized by card allocation’ | ‘Prospectively randomized by card allocation’ | Not used | Not discussed | Moderate | |
| Randomization done by pharmacy department; method of randomization uncertain Not sure about adequacy of randomization | No specific mention of allocation concealment except to say ‘double‐blinded’ Allocation concealment inadequate | No specific mention of who all were blinded; ‘double‐blinded’, placebo‐controlled trial Not sure whether blinding was adequate | One withdrawal from study reported | Moderate | |
| ‘Placebo controlled prospective study’; no randomization | None described | None described | Not described | Poor | |
| ‘Consented and were randomized’ | Not described | Not used | 3 participants (2, 1) not operated upon; 2 participants excluded from final analysis because of clinical management changes | Poor | |
| Randomization done by pharmacy trial co‐ordinator using a permitted block strategy | Allocation concealment using central randomization with drugs prepared by pharmacy | Quadruple‐blinded (participants, clinicians, data collectors and data analyst) placebo‐controlled study | Clearly accounted for (5 in intervention group and 2 in control group) | Good | |
| ‘Prospective randomized double‐blinded and placebo‐controlled study’ Computer‐generated random number tables | Not specifically described, but quite likely it was concealed allocation | Blinded manner; drug or saline supplied by the department investigational pharmacy in a blinded manner + additive for the CPB circuit prime (mannitol or saline, supplied similarly) | All allocated participants completed the trial (withdrawals before allocation) | Good | |
| ‘Randomized’; no details provided ‘Double‐blind, placebo‐controlled proof of concept trial’ | No details provided ‘Double‐blind, placebo‐controlled proof of concept trial’ | No details provided ‘Double‐blind, placebo‐controlled proof of concept trial’ | Four withdrawals from trial reported
| Poor | |
| Computer‐generated randomization method used | Computer allocation, no further details given | Not described except by the statement, ‘investigator blinded to the study group evaluated the postoperative data’ | Not reported | Moderate | |
| Randomization from a computer list, in an envelope | Sealed envelope used ‘All personnel and patients were blinded to the assignment’ | Blinded nurse, not involved with study, prepared the drug/ placebo in identical 50 mL filled syringes ‘All personnel and patients were blinded to the assignment’ | 1 participant | Good | |
| Allocated in a randomized double‐blind fashion to 2 groups No details on randomization method | Allocated in a randomized double‐blind fashion to 2 groups No description of allocation concealment | No details on blinding except ‘double‐blind fashion’ | Not given | Poor | |
| Allocated in a randomized double‐blind fashion to 2 groups No details on randomization method | Allocated in a randomized double‐blind fashion to 2 groups No description of allocation concealment | No details on blinding except ‘double‐blind fashion’ | Not given | Poor | |
|
| Participants with renal dysfunction (CCl < 50 mL/min) ‘Randomly divided into 3 groups’; no description of randomization | No description of allocation | No description of blinding | Not given | Poor |
| ‘Randomly allocated’ into 3 groups; no description of randomization | No description of allocation | No description of blinding | Not given | Poor | |
| ‘Randomized to either treatment group’ by pulling a card from a previously prepared deck | No description of allocation concealment | No details on blinding | Not given | Poor | |
| ‘Randomly allocated into infusion of dopamine or placebo’ by one of the authors, who was unaware of the treatment allocation
| ‘Randomly allocated into infusion of dopamine or placebo’ by one of the authors, who was unaware of the treatment allocation; no description of allocation concealment
| No blinding described | Not given | Poor | |
| Randomization and drug or placebo preparation provided by drug company; method not described, but likely to be good | Not sure of any allocation concealment, but likely possible | Possible, but blinded tables not described | 1 participant had additional drugs but was not excluded | Moderate | |
| Randomly allocated into 2 groups, randomization method not described | Allocation concealment not described | Blinding not mentioned | All participants accounted for in calculations | Poor | |
| ‘Randomly allocated into 3 groups’; method of randomization not described | ‘Randomly allocated into 3 groups’; method of allocation concealment not described | ‘Randomly allocated into 3 groups’; method of blinding not described | Dropouts not described | Poor | |
| ‘Randomly allocated into 3 groups’; method of randomization not described | ‘Randomly allocated into 3 groups’; method of allocation concealment not described | ‘Randomly allocated into 3 groups’; method of blinding not described | Dropouts not described | Poor | |
| Randomization done by the last digit of the medical record number of participant (quasi‐randomization) | ‘Patients were prospectively allocated into 2 groups’ No details given | Not given | Not given | Poor | |
| Retrospective chart review of a randomized trial in 2003, which used computer‐generated allocation list (randomly permuted blocks of random size) provided by department of Medical Statistics | Computer‐generated allocation list (randomly permuted blocks of random size) provided by department of Medical Statistics | Drugs supplied in identical looking glass vials containing drug or placebo | Exclusions described in text | Good | |
|
| ’Prospectively randomized’; no details of method of randomization | ’Prospectively randomized’; no details of method of allocation | ’Prospectively randomized’; no details of method of blinding | Fate of participants discussed | Poor |
| Random assignment of participants using Microsoft Excel‐based random number generation to create a randomization list, in blocks of 10 | Allocation concealment ensured by quadruple‐blinding (participants, clinicians, data collectors and data analysers were unaware of groups or treatment) | Quadruple‐blinding (participants, clinicians, data collectors and data analysers were blinded) | 0 participants | Good | |
| Microsoft Excel‐based random number generation, with blocks of 10; central randomization by department of pharmacy | Allocation concealment achieved by central randomization, blinding to all researchers, participants and others. Allocation revealed only after data analysis | Both fluids in separate shrink‐wrapped black plastic bags that were identical in appearance (blinded to participants, anaesthetists, surgeons, ICU personnel, nurses and others) | 1 in each group | Good | |
| ‘Random allocation used’; method not given | ‘Random allocation used’; method not given | ‘Random allocation used’; method not given | 1 participant excluded from the trial | Poor | |
| ‘Randomized’, but no details given | Allocated to control and intervention groups using opaque envelopes immediately before surgery; not sure whether allocation was maintained | No blinding | 1 died before operation (intervention group) | Poor | |
| Random assignment in blocks of 10 done by hospital pharmacy, no details given | Allocation done by hospital pharmacy Clinical and study personnel not aware of study allocation | Blinding quite likely, although not detailed in text | 1 participant withdrew from study intraoperatively (does not mention which group, although most likely the intervention group-1 less in that group) | Moderate | |
| Computer‐generated randomization done by statistician | Sequentially numbered, sealed envelopes
| SNP and saline in uniformly appearing 50 mL syringes, blinded to surgeons, perfusionists and nurses; investigators did not know the details | None | Good | |
| Randomization by computer | Not described in detail | Not described in detail | No detailed description | Poor | |
| Participants randomly assigned to receive 1 of 2 treatments | No details given | No details given | Early termination of study in 33 of 56 participants; ITT used | Poor | |
| Allocated into 2 groups in a double‐blinded random fashion; no details of randomization given | Allocated into 2 groups in a double‐blinded random fashion; no details of allocation given | Allocated into 2 groups in a double‐blinded random fashion; no details of blinding given | 2 participants excluded | Poor | |
| Placebo‐controlled randomized double‐blind trial; block randomization done and sealed envelopes used | Placebo‐controlled randomized double‐blind trial; block randomizations done with the use of sealed envelopes; no further details on allocation concealment provided | Placebo‐controlled randomized double‐blind trial; no other details of blinding provided | 3 participants excluded from analysis | Moderate | |
| ‘Recruited patients were allocated to one of 2 groups’; no details on randomization | ‘Recruited patients were allocated to one of 2 groups’; no details on allocation concealment | ‘Recruited patients were allocated to one of 2 groups’; no details on blinding provided | 2 participants accounted for | Poor | |
| 'Patients were allocated in a randomized double‐blind manner’; no details of randomization given | 'Patients were allocated in a randomized double‐blind manner’; no details of allocation concealment given | 'Patients were allocated in a randomized double‐blind manner’; no details of blinding given | 2 participants excluded from the trial | Poor | |
| ‘Randomized in a double‐blind fashion’; no details of randomization given | ‘Randomized in a double‐blind fashion’; no details of allocation given | ‘Randomized in a double‐blind fashion’; no details of blinding given | All participants completed the trial | Poor | |
| Used a 2:1 ratio in randomization process, participants randomly assigned into groups; no other details of randomization given | Participants randomly assigned into groups; no other details of allocation given | Participants randomly assigned into groups; no other details of blinding given | Not given | Poor | |
| ‘Patients were randomized into 2 groups’; not sure what method of randomization was used | Not sure how allocation was performed | ‘Blind infusion was performed’; not sure about blinding | None indicated | Poor | |
| Designed as a prospective double‐blind placebo‐controlled randomized trial; no other details of randomization provided | Prospective double‐blind placebo‐controlled randomized trial; no other details of allocation concealment provided | Prospective double‐blind placebo‐controlled randomized trial; no other details of blinding provided | All participants competed the trial | Poor | |
| ‘Patients were randomized’; no other details given | ‘Patients were randomized’; no other details given | ‘Patients were randomized’; no other details given | 2 participants excluded from analysis | Poor | |
| Randomly assigned with the use of a table of random numbers; ‘prospective double‐blind randomized trial’ | Coded 50 mL syringes from the pharmacy, with contents remaining unknown to investigators until the end of the trial; allocation concealed | Coded 50 mL syringes from the pharmacy, with contents remaining unknown to investigators until the end of the trial; blinded | 3 withdrawals before start of trial | Good | |
| ‘Prospective randomized trial’; no further details on randomization | ‘Prospective randomized trial’; no further details on allocation | ‘Prospective randomized trial’; no details on blinding | None reported | Poor | |
| ‘Patients were randomized’; no further details | No indication of allocation concealment, but for statement, ‘To prevent bias, surgeons, nurses, and lab technicians were blinded to patient assignment’ | Possible: ‘To prevent bias, surgeons, nurses, and lab technicians were blinded to patient assignment’ | None indicated in text | Poor | |
| ‘Prospective randomized study’; no further details on randomization given | ‘Prospective randomized study’; no further details on allocation | ‘Prospective randomized study’; no further details on blinding | 11 of 35 excluded | Poor | |
| ‘Patients were randomly allocated into 2 groups’; no further details on randomization | ‘Patients were randomly allocated into 2 groups’; no further details on allocation | ‘Patients were randomly allocated into 2 groups’; no further details on blinding | Not disclosed | Poor | |
| Randomization performed by aleatorized numbers prepared in closed envelopes | No details on concealment of allocation except ‘Randomization performed by aleatorized numbers prepared in closed envelopes’ | Drug or placebo given with an identical container in a double‐blind manner with the same volume of drug or saline | 4 participants excluded | Moderate | |
| Randomized, prospective, open‐label study Random number generated from a random number table | No concealment of assignment | No blinding | 4 excluded after randomization? | Poor | |
| Random assignment by the hospital pharmacy clinical trials co‐ordinator Microsoft Excel–based random number generator permuted block strategy with blocks of 10 | Allocation stratified into 2 groups based on pre‐op use of statins Allocation concealed to participants, anaesthetists, cardiac surgeons, intensive care specialists, bedside nurses and investigators | 'Double‐blind'. Atorvastatin or placebo medication prepared in capsules of identical appearance
| 8 in intervention group and 7 in control group | Good | |
| Random assignment into 2 groups; no further details | Random assignment into 2 groups; no further details | Random assignment into 2 groups; no further details; the anaesthesiologist was aware of the allocation and treatment received | No details provided | Poor | |
| ‘Randomly allocated in a double‐blinded manner; the hospital pharmacy performed the randomization and prepared the study medications’ | ‘Randomly allocated in a double‐blinded manner; the hospital pharmacy performed the randomization and prepared the study medications’, but no details of allocation concealment provided | ‘Randomly allocated in a double‐blinded manner; the hospital pharmacy performed the randomization and prepared the study medications’; no details of blinding provided | 3 participants excluded | Moderate | |
| ‘Patients were allocated in a randomized double‐blind fashion to 2 groups’; no further details of randomization given | ‘Patients were allocated in a randomized double‐blind fashion to 2 groups’; no further details of allocation given | ‘Patients were allocated in a randomized double‐blind fashion to 2 groups’; no further details of blinding given | No dropouts detailed in text | Poor | |
| ‘Randomly allocated to two groups receiving blind infusion of drug or placebo’; no other details on randomization method | ‘Randomly allocated to two groups receiving blind infusion of drug or placebo’; no other details on allocation method | ‘Randomly allocated to two groups receiving blind infusion of drug or placebo’; no other details on blinding | Not described, but study probably had no dropouts | Poor | |
| Randomly allocated into 2 groups by drawing lots | ‘Randomly allocated by drawing lots’ No other details | No evidence of blinding | No mention in the text | Poor | |
| Randomly allocated into 2 groups by lottery method | 'Randomly allocated into 2 groups'; no evidence of concealment of allocation | No blinding discussed | Dropouts discussed | Poor | |
| Participants were assigned by random number to 1 of 2 groups; no details on randomization given | Participants were assigned by random number to 1 of 2 groups; no details on concealment of allocation given | Participants assigned by random number to 1 of 2 groups; no details on blinding | No dropouts | Poor | |
| Participants randomly allocated to 1 of 2 groups with use of a computer‐generated randomization table | Participants randomly allocated to 1 of 2 groups with use of a computer‐generated randomization table; no further details on allocation concealment given | All medical personnel involved in the study blinded to the contents of the infusion bottle | No dropouts recorded | Moderate | |
| Block randomization developed by research centre Randomization stratified by serum creatinine levels | Allocation via Internet using predetermined randomization | Participants, healthcare clinicians and researchers blinded | None | Good | |
| Prospectively randomly assigned | No details on allocation provided in text | No details of blinding provided in text | No dropouts recorded | Poor | |
| Participants randomly assigned; no further details on randomization given | Participants randomly assigned; no further details on allocation given | 2 different types of procedures; no blinding possible | 5 participants subsequently excluded from trial | Poor | |
| ‘Patients were randomized’; no more details | ‘Patients were randomized’; no more details | No details provided | ‘There were no withdrawals’ | Poor | |
| Random assignment done with use of computer‐generated randomization list | Computer‐generated randomization list placed in sealed envelopes and opened in numerical order by a third party, who prepared the study infusion | Third party prepared the infusion. Infusions were such that volumes were equal in the bag and of identical colour, and contents of the bag were indistinguishable; the infusion was done over 30 minutes to avoid haemodynamic effects of treatment | Yes, none lost | Good | |
| Participants randomly assigned into 1 of 2 groups, according to the last digit of their clinical history number (quasi‐randomization) | No description of concealment of allocation | No report of blinding | All participants completed | Poor | |
| ‘Patients were randomly allocated into 4 equal groups’; no further details on randomization | Patients were randomly allocated into 4 equal groups’; no further details on allocation | No description of blinding | None described | Poor | |
| ‘Patients were randomly assigned’; no further details on randomization method used | ‘Patients were randomly assigned’; no further details on allocation method used | No description of blinding | None described | Poor | |
| ‘Patients were randomized’; no further details on method of randomization used | ‘Patients were randomized’; no details on method of allocation used | No details on blinding | One death described | Poor | |
| Participants were ‘randomized’ It appears that the anaesthesiologist ‘randomly drew an envelope with the assigned treatment’ | Allocation concealment was possible only for participants and the statistician | No; control received no treatment Participants and the statistician were blinded | Not described | Poor | |
| ‘Patients were randomized’; no further details on method of randomization used | ‘Patients were randomized’; no details on method of allocation used | No details on blinding | 8 participants excluded because of death or major complications | Poor | |
| ‘Patients were prospectively randomized’; no details on method of randomization used | ‘Patients were prospectively randomized’; no details on method of allocation used | No description of blinding | States no deaths; no description of dropouts | Poor | |
| ‘Patients randomized into 4 groups’; no further details on randomization given | ‘Patients randomized into 4 groups’; no description of allocation used | No description of blinding | No mortality described, but no suggestion of dropouts | Poor | |
| ‘Randomly assigned’; no further details of randomization given | ‘Randomly assigned’; no further details of allocation given | No blinding described | No dropouts described | Poor |
Measures of treatment effect
We pooled continuous outcomes with mean differences (MDs) and 95% confidence intervals (CIs). Initially, we pooled the results using a fixed‐effect model, but substantial heterogeneity existed in many analyses, and we explored the reasons for this. Because of considerable heterogeneity seen in the results, we opted to present the data using a random‐effects model.
Dichotomous outcomes (acute renal failure and mortality) were very rare events, hence we have presented these as odds ratios (ORs), using the Peto method.
Unit of analysis issues
We found no unit of analysis issues.
Dealing with missing data
We attempted to contact the authors of the publications to ask for information related to missing data, as well as further information on risk of bias.
Assessment of heterogeneity
Heterogeneity was assessed by visual inspection of forest plots, the test for heterogeneity and I2. We suspected significant heterogeneity on the basis of the I2 tests; values of I2 greater than 25% were regarded as moderate heterogeneity and values of I2 greater than 75% as significant heterogeneity) (Higgins 2008). Clinical heterogeneity was determined on the basis of clinical and demographic data provided in the studies.
Assessment of reporting biases
Reporting biases were assessed by using funnel plots constructed from the data.
Data synthesis
We used RevMan 5.1 for the synthesis of data (Deeks 2008). Continuous data are presented as MDs with 95% CIs. Because substantial heterogeneity was suspected, these results were pooled using a random‐effects model. For dichotomous outcome data (primary outcomes, mortality and acute renal injury), we used a fixed‐effect model because the incidence rate was very low; results are presented as ORs, using the Peto method.
Subgroup analysis and investigation of heterogeneity
We undertook subgroup analyses for the following situations.
-
Methods used for renal protection.
-
Types of operation.
-
Studies on participants with pre‐existing renal dysfunction.
Sensitivity analysis
We undertook sensitivity analyses for randomized controlled trials using only studies with low or moderate risk of bias.
Results
Description of studies
Details of studies can be found in 'Characteristics of included studies' and 'Characteristics of excluded studies'.
Results of the search
In the 2008 update (Zacharias 2008), we identified 136 studies from the MEDLINE search, 113 studies from the EMBASE search and 177 from CENTRAL (426 studies in total). We searched reference lists and bibliographical data from all retrieved articles and reviews for additional, relevant material. We sought information from authors of published studies and contacted recognized experts on this topic about any unpublished data. We identified a further 25 studies by this method. Thus in 2008, a total of 451 studies were considered potentially eligible for this review.
The extended search strategy in 2011 yielded 655 studies, and four studies were obtained from other sources. Of these, we obtained full papers for 35 studies and included 26 additional studies in the review. A further search in August 2012 provided a further 318 studies. From this group, we added one study to the review, one conference presentation to the list of studies awaiting further analysis and one exclusion due to duplicity. In this updated review, we have included 72 studies (Figure 1).

Study flow diagram, as of December 2012.
Included studies
See 'Characteristics of included studies'. The 72 included studies comprised a total of 4378 participants; 2291 of these received some form of intervention to protect the kidneys, and 2087 acted as controls. Of the 72 included studies, 13 had multiple arms (Barr 2008; Berendes 1997; Carcoana 2003; Colson 1992; Costa 1990; Dehne 2001; Donmez 1998; Dural 2000; Kleinschmidt 1997; Lassnigg 2000; Wahbah 2000; Yavuz 2002B; Zanardo 1993). We used the data from each arm separately for analysis of the interventions; whenever we did this, we adjusted (reduced) the numbers in the control groups in the appropriate sections. Barr 2008 had three arms; one arm used fenoldopam, one arm N‐acetyl cysteine and another arm a combination of the two (the latter was excluded from the review). Berendes 1997 had three treatment arms with increasing strengths of dopexamine in cardiac surgery; another arm acted as control. We combined the three treatment groups for the purpose of analysis. Carcoana 2003 had three treatment arms and a control arm; one treatment group received dopamine infusion during the surgery, one group received a bolus of mannitol in the pump prime and the third group received both treatments. We excluded the third arm of the study. Colson 1992 had two treatment arms and one control arm; one treatment group received a calcium channel blocker, and the second group received an angiotensin‐converting enzyme (ACE) inhibitor. Costa 1990 also had three arms-two treatment arms and one control arm; we excluded the arm that used multiple interventions (dopamine and SNP). Dehne 2001 had two control groups-one for participants with normal renal function and one for participants with pre‐existing renal dysfunction. Intervention groups in this study (two) used dopexamine and matched the control for the presence or absence of pre‐existing renal failure. Donmez 1998 used two intervention groups-one received verapamil and the other received nimodipine. Dural 2000 had three arms; one arm received dopamine, another arm received mannitol and the third arm was the control group. Kleinschmidt 1997 had two intervention groups-pentoxyfilline and gamma hydroxybutyrate-and one control group. Lassnigg 2000 had three arms-two active (dopamine or furosemide) and one control. In the case of Wahbah 2000, we used only one of three treatment arms because two arms combined multiple interventions (dopamine and mannitol, or dopamine and furosemide). This study contained a fourth control arm. Yavuz 2002B had three treatment arms and one control arm; one treatment arm used two interventions simultaneously, and we excluded this arm in the appropriate sections. Zanardo 1993 used two doses of dopamine by infusion; we combined the two groups in the analysis.
We identified three studies that were published both in abstract form and as full papers. We were unable to confirm whether they were duplicate papers and hence considered only the full papers for inclusion in the analysis (Kulka 1996; O'Hara 2002; Ryckwaert 2001) for this review. We have referred to the abstract publications (Kulka 1993; O'Hara 2002A; Ryckwaert 1995) in the table 'Characteristics of excluded studies'.
The details of participants' sex were not available for all studies, so we did not attempt to separately document this information. All included studies except one (Cregg 1999) involved adult populations; the Cregg study involved correction of scoliosis surgery and included a younger age group.
Forty‐nine studies involved participants undergoing cardiac surgery (Adabag 2008; Amano 1994; Amano 1995; Ascione 1999; Barr 2008; Berendes 1997; Bergman 2002; Burns 2005; Carcoana 2003; Chen 2007; Cogliati 2007; Colson 1990; Costa 1990; Cregg 1999; Dehne 2001; Donmez 1998; Dural 2000; Durmaz 2003; Fischer 2005; Haase 2007; Haase 2009; Kaya 2007; Kleinschmidt 1997; Kramer 2002; Kulka 1996; Lassnigg 2000; Loef 2004; Marathias 2006; Morariu 2005; Morgera 2002; Myles 1993; Nouri‐Majalan 2009; Prasad 2010; Prowle 2012; Ristikankare 2006; Ryckwaert 2001; Sezai 2000; Sezai 2009; Sezai 2011; Shim 2007; Song 2009; Tang 1999; Tang 2002; Urzua 1992; Witczak 2008; Woo 2002; Yavuz 2002A; Yavuz 2002B; Zanardo 1993). Fifteen trials included participants undergoing abdominal aortic surgery (for aortic aneurysm and occlusive arterial disease) (Colson 1992; Dawidson 1991; de Lasson 1995; de Lasson 1997; Halpenny 2002; Hynninen 2006; Lau 2001; Licker 1996; Mitaka 2008; Nicholson 1996; Pull Ter Gunne 1990; Shackford 1983; Turner 2008; Welch 1995; Wijnen 2002). Four trials consisted of participants undergoing biliary surgery (Gubern 1988; Parks 1994; Thompson 1986; Wahbah 2000); one involved laparoscopic colorectal surgery (Perez 2002); one partial nephrectomy (O'Hara 2002); and one correction of scoliosis (Cregg 1999). Fourteen studies involved participants with pre‐existing renal dysfunction or those with increased risk of renal dysfunction as a result of the surgery (Adabag 2008; Burns 2005; Chen 2007; Cogliati 2007; Dehne 2001; Durmaz 2003; Haase 2007; Haase 2009; Marathias 2006; Nouri‐Majalan 2009; Prasad 2010; Prowle 2012; Ristikankare 2006; Witczak 2008).
Various treatment measures were used in the different trials to protect the kidneys during the perioperative period. Interventions included dopamine and its analogue or agonist (dopexamine or fenoldopam) in 22 studies (Barr 2008; Berendes 1997; Carcoana 2003; Cogliati 2007; Costa 1990; Cregg 1999; de Lasson 1995; Dehne 2001; Dural 2000; Halpenny 2002; Lassnigg 2000; Myles 1993; O'Hara 2002; Parks 1994; Perez 2002; Tang 1999; Wahbah 2000; Welch 1995; Woo 2002; Yavuz 2002A; Yavuz 2002B; Zanardo 1993); diuretics (mannitol, furosemide) in six trials (Carcoana 2003; Dural 2000; Gubern 1988; Lassnigg 2000; Nicholson 1996; Shim 2007); calcium channel blockers (diltiazem, nicardipine, felodipine, verapamil, nimodipine) in nine trials (Amano 1995; Bergman 2002; Cho 2009; Colson 1992; de Lasson 1997; Donmez 1998; Witczak 2008; Yavuz 2002B; Zanardo 1993); ACE inhibitors (captopril, enalapril) in four trials (Colson 1990; Colson 1992; Licker 1996; Ryckwaert 2001); N‐acetyl cysteine in seven trials (Adabag 2008; Barr 2008; Burns 2005; Fischer 2005; Hynninen 2006; Prasad 2010; Ristikankare 2006); atrial natriuretic peptide in five trials (Chen 2007; Mitaka 2008; Sezai 2000; Sezai 2009; Sezai 2011); and, in one trial each, glutathione (Amano 1994), prostaglandin (Morgera 2002), theophylline (Kramer 2002), clonidine (Kulka 1996), dexamethasone (Loef 2004; Morariu 2005), pentoxifylline (Kleinschmidt 1997), gamma hydroxybutyrate (Kleinschmidt 1997), antioxidant therapy (Wijnen 2002), phenylephrine (Urzua 1992), ursodeoxycholic acid (Thompson 1986) and preoperative haemodialysis (Durmaz 2003); and surgical measures such as off‐pump cardiac surgery (Ascione 1999; Tang 2002) and an extraperitoneal approach to aortic surgery (Lau 2001). Five studies looked at the effects of hydration fluids (Dawidson 1991; Harten 2008; Marathias 2006; Pull Ter Gunne 1990; Shackford 1983). One trial (Song 2009) used erythropoietin (EPO) as the intervention. We have included this because it is currently an area of interest in this field.
We have conducted subgroup analyses of trials to observe the effects of different interventions on renal protection in the perioperative period. These subgroups included dopamine and its analogue or agonist; diuretics; calcium channel blockers; ACE inhibitors; atrial natriuretic peptide; N‐acetyl cysteine; EPO; and hydration fluids. We also undertook subgroup analyses to observe the effects of the type of surgery; these included cardiac surgery, abdominal aortic surgery and biliary surgery. We performed a limited subgroup analysis of studies with pre‐existing renal impairment.
We also completed a limited sensitivity analysis on studies with low risk of bias.
Excluded studies
We provide the reasons for excluding studies in the table 'Characteristics of excluded studies'. Studies published in languages other than English (German, Turkish, Serbian, Russian and Japanese) were translated with the help of volunteers. All of these studies were available as full publications. We have had only limited success in receiving adequate information and feedback from the authors whom we attempted to contact, in spite of repeated attempts. All included and excluded studies were published between 1976 and 2012. We did not include three studies in the analysis because we could not confirm that they were not duplicate publications (see below). We did not include three studies authored by Boldt et al because of issues surrounding the reliability of studies from that group of researchers.
Risk of bias in included studies
Even though we included 72 studies in the review, the overall methodological quality of the studies was poor. We used a quality assessment system (see 'Methodological quality of studies' Table 1) based on method of randomization, allocation concealment, blinding and reporting of dropouts as the criterion. We scored the methodological quality of selected studies as good, moderately good or poor. When randomization, allocation concealment and blinding (participants, researchers, care givers and nurses) were adequately described and appropriately done, we classified the study as a good quality study. When randomization, allocation concealment and blinding (participants, researchers, care givers and nurses) were stated to have been done but no details were given in the publication, we classified the study as moderately good. When we found no evidence of allocation concealment and blinding, we classified the study as having poor methodological quality. The risk of bias information is given in Figure 2 and Figure 3.
The methodological quality assessment identified twelve studies of good quality (Adabag 2008; Burns 2005; Carcoana 2003; Cogliati 2007; Fischer 2005; Haase 2007; Haase 2009; Kaya 2007; Myles 1993; Prowle 2012; Song 2009; Turner 2008) and another nine studies for which the methodological quality was considered moderately good (Ascione 1999; Barr 2008; Cho 2009; de Lasson 1997; Hynninen 2006; Lassnigg 2000; Perez 2002; Ristikankare 2006; Shim 2007). Most of the studies that we assessed (51 studies) were classified as having poor methodological quality (see 'Methodological quality of studies', additional Table 1). We had no success in obtaining data on concealment of allocation, blinding and method of randomization from most of the trial authors. Some trials were old, and we had very little chance of contacting these authors. We received replies from only five authors.

Risk of bias graph: review authors' judgements about each risk of bias item presented as percentages across 78 included studies.

Risk of bias summary: review authors' judgements about each risk of bias item for each included study.
Allocation
See 'Characteristics of included studies' and Table 1 for details.
Blinding
See 'Characteristics of included studies' and Table 1 for details.
Incomplete outcome data
Data are available in 'Characteristics of included studies'.
Selective reporting
Funnel plots for primary outcomes, reported mortality and reported acute renal failure showed no evidence of selective reporting (see Analysis 1.1 and Analysis 1.2).
Other potential sources of bias
None of the publications mentioned any conflict of interest with respect to the choice of drugs used. The following studies acknowledged pharmaceutical company sponsorships: de Lasson 1995; de Lasson 1997; Halpenny 2002; Kramer 2002; Lassnigg 2000; and Thompson 1986.
We constructed funnel plots to detect publication bias in primary outcomes, mortality and acute renal injury (failure) but employed this approach only in studies that looked at participants with pre‐existing renal damage and studies that were assessed to have low risk of bias.
Effects of interventions
See: Summary of findings for the main comparison Interventions in patients with pre‐existing renal dysfunction; Summary of findings 2 Interventions to protect the kidneys in the perioperative period in patients undergoing surgery: low ROB studies only
We collected and analysed data from the selected 72 studies.
The dichotomous data (mortality and acute renal failure) consisted of rare events, so we used the Peto method of analysis and reported these results as Peto odds ratios (ORs) with 95% confidence intervals (CIs). We presented all continuous data results as mean differences (MDs) with 95% CIs. Results were plagued by heterogeneity throughout the analyses, so we used a random‐effects model instead of a fixed‐effect model. We undertook subgroup analysis for treatment measures and type of surgery. We were able to conduct only limited subgroup analysis for studies with pre‐existing renal impairment because of the inadequate number of trials identified. A limited sensitivity analysis was done for studies with low risk of bias. To make the review less cumbersome for the reader, study results are listed in the text only when they were considered essential; references to appropriate 'Data and Analysis' tables are given.
Mortality
Data on perioperative mortality were reported in 41 studies, which included 3116 participants. Many cases of mortality were due to a combination of factors, including surgical causes and pathology. The risk of mortality was very low, and we did not perform a meta‐analysis because of the significant clinical heterogeneity noted.
Acute renal injury
Acute renal injury (renal damage) in the postoperative period was reported in 44 studies. Many studies did not specify the criteria used to diagnose acute renal failure (ARF), hence we obtained information from these studies on the numbers of participants with acute renal injury requiring renal replacement therapy, in both treatment and control groups. Reported incidences were very low, and because of the significant clinical heterogeneity observed, we did not perform a meta‐analysis of the data.
Effectiveness of measures used for renal protection
In this section, we tried to combine the data from the 72 identified studies to ascertain the effectiveness of treatments provided to protect the kidneys during the perioperative period compared with findings in the control population. Again, because of clinical heterogeneity in the form of different procedures and populations and decades of reporting such data, we decided to refrain from combining the data for a meta‐analysis.
Effect of various interventions on renal protection
Most studies looked at dopamine and its analogues, although some trials used other measures to protect the kidneys during the perioperative period.
Dopamine or its analogues
Infusions of dopamine or its analogue (dopexamine) or agonist (fenoldopam) were used as treatment in 22 studies (Barr 2008; Berendes 1997; Carcoana 2003; Cogliati 2007; Costa 1990; Cregg 1999; de Lasson 1995; Dehne 2001; Dural 2000; Haase 2007; Halpenny 2002; Lassnigg 2000; Myles 1993; O'Hara 2002; Parks 1994; Perez 2002; Tang 1999; Wahbah 2000; Welch 1995; Woo 2002; Yavuz 2002A; Yavuz 2002B).
Mortality was reported in 11 trials (583 participants, OR 1.50, 95% CI 0.48 to 4.73, I2 = 25%; see Analysis 1.1), and acute renal injury was reported in 10 trials (541 participants, OR 1.36, 95% CI 0.44 to 4.23, I2 = 63%; see Analysis 1.2).
Urine output at 24 hours after operation was studied in 13 trials (see Analysis 1.3.1). Considerable heterogeneity was observed (I2 = 92%), and no difference was noted between intervention and control groups (MD 0.18 mL/min, 95% CI ‐0.19 to 0.54). Urine flow at two to three days showed no significant increase with the intervention in seven studies (see Analysis 1.3.2); the urine flow difference was 0.51 mL/min (95% CI 0.04 to 0.97), and heterogeneity was high (I2 = 95%). On the fifth to seventh day, treatment did not offer any advantages in five trials (see Analysis 1.3.3) (MD 0.23 mL/min, 95% CI ‐0.06 to 0.51, I2 = 72%).
Creatinine clearance was studied in 15 trials after dopamine or its analogues were administered (see Analysis 1.4). Fourteen trials reported creatinine clearance at 24 hours; nine studies at two to three days; and five studies at five to seven days after an operation. Analysis showed no significant difference between intervention and control groups at 24 hours (616 participants, MD 7.17 mL/min, 95% CI ‐5.53 to 19.86) and considerable heterogeneity (I2 = 91%); one study, in particular, favoured the treatment group (Berendes 1997). No differences were reported at two to four days (MD 7.31 mL/min, 95% CI ‐6.19 to 20.82, I2 = 94%) or at five to seven days after the operation (MD ‐3.33 mL/min, 95% CI ‐13.63 to 6.98, I2 = 18%).
Free water clearance in mL/min was looked at 24 hours after surgery in six trials (see Analysis 1.5). Results showed no difference between treatment and control groups (MD 0.03 mL/min, 95% CI ‐0.17 to 0.22, I2 = 0%). Fractional excretion of sodium at 24 hours was reported in five trials (see Analysis 1.6). As in the previous section, we did not analyse these data.
Renal blood flow in mL/min was studied at 24 hours after surgery in only two trials (see Analysis 1.7) (de Lasson 1995; O'Hara 2002). No difference was noted (48 participants, MD 75.36 mL/min, 95% CI ‐63.27 to 213.98, I2 = 45%).
Diuretics
Mortality was reported in four trials (255 participants, OR 2.49, 95% CI 0.50 to 7.74, I2 = 0%; see Analysis 2.1), and acute renal injury was reported in five trials (305 participants, OR 2.39, 95% CI 0.68 to 8.47, I2 = 35%; see Analysis 2.2).
Mannitol or furosemide was used as treatment in six studies. Data were available for only five studies (see Analysis 2.3). Urine output did not show a significant difference between groups at 24 hours in four studies (MD 0.10 mL/min, 95% CI ‐0.12 to 0.33, I2 = 0%; see Analysis 2.3.1); at two to three days in three studies (MD 0.17 mL/min, 95% CI ‐0.06 to 0.40, I2 = 0%). No significant differences were noted on any occasion.
Creatinine clearance was measured at 24 hours in three studies. This measure showed no statistically significant differences (see Analysis 2.4.1; MD ‐18.02 mL/min, 95% CI ‐41.78 to 5.75, I2 = 55%). The same was true on the second to fourth day (see Analysis 2.4.2; MD 2.33 mL/min, 95% CI ‐14.76 to 19.42, I2 = 0%).
Calcium channel blockers
Mortality was reported in two trials (68 participants), and acute renal injury was reported in six trials (172 participants, OR 0.11, 95% CI 0.01 to 1.17; see Analysis 3.1 and Analysis 3.2, respectively).
Calcium channel blockers such as diltiazem, nicardipine and felodipine were used in nine studies. Four studies looked at urine output at 24 hours after treatment; no difference was observed between treatment and control groups (MD 0.23 mL/min, 95% CI 0.02 to 0.45, I2 = 0%; see Analysis 3.3.1). Five studies looked at creatinine clearance at 24 hours postoperatively (see Analysis 3.4.1). No advantage was derived from treatment (MD 4.74 mL/min, 95% CI ‐3.30 to 12.77, I2 = 57%). A total of 251 participants were included in the four studies.
Three studies measured free water clearance at 24 hours (see Analysis 3.5.1) and reported no difference (MD ‐0.09 mL/min, 95% CI ‐0.47 to 0.29, I2 = 43%).
ACE inhibitors
Data were insufficient for calculations of risk of mortality and acute renal injury in this intervention group (see Analysis 4.1 and Analysis 4.2).
Four trials (Colson 1990; Colson 1992; Licker 1996; Ryckwaert 2001) looked at the usefulness of ACE inhibitors (enalapril or captopril) as renal protective agents. Data from three studies show that renal plasma flow in mL/min at the end of the operation (see Analysis 4.3.1) was not significantly different (MD 46.37 mL/min, 95% CI ‐68.61 to 161.34, I2 = 0%).
Atrial Natriuretic Peptide
Mortality was reported in three trials (825 participants, OR 0.52, 95% CI 0.19 to 1.44, I2 = 48%; see Analysis 5.1), and acute renal injury was reported in four trials (865 participants, OR 0.23, 95% CI 0.08 to 0.64, I2 = 0%; see Analysis 5.2).
Five trials produced evidence for the use of atrial natriuretic peptide (ANP) (Chen 2007; Mitaka 2008; Sezai 2000; Sezai 2009; Sezai 2011). Much larger numbers of participants were included in Sezai 2009 and Sezai 2011 (789 participants), and this considerably influenced the meta‐analysis.
Urine output at 24 hours showed no significant change in three studies; this favoured the intervention (4.82 mL/min, 95% CI ‐2.74 to 12.38, I2 = 100%; see Analysis 5.3). Creatinine clearance at 24 hours in five studies showed similar results, favouring treatment by 4.31 mL/min (95% CI 0.34 to 8.28, I2= 99%; see Analysis 5.4). Creatinine clearance at 2 to 3 days in four studies favoured the intervention (13.11 mL/min, 95% CI 13.11 to 13.76, but with I2 = 100%; see Analysis 5.5). The poor methodological quality and the large heterogeneity (I2=100%) of the two dominant studies (Sezai 2009; Sezai 2011) make any conclusions worthless.
N‐Acetyl Cysteine
Mortality was reported in six trials (641 participants, OR 1.01, 95% CI 0.42 to 2.42, I2 = 0%; see Analysis 6.1), and acute renal injury was reported in five trials (601 participants, OR 0.91, 95% CI 0.32 to 2.62; I2 = 0%; see Analysis 6.2).
Seven trials used administration of N‐acetyl cysteine (NAC) as a measure to protect the kidneys intraoperatively (Adabag 2008; Barr 2008;Burns 2005; Fischer 2005; Haase 2007; Hynninen 2006; Prasad 2010; Ristikankare 2006). Urine output at 24 hours was estimated in two studies (146 participants). No differences were reported (0.23 mL/min, 95% CI ‐0.21 to 0.68, I2 = 47%).
Erythropoietin (EPO)
Recognition of EPO as a possible drug for renal protection is increasing, hence we reported data from the single available study. One study (Song 2009) used this drug in participants undergoing cardiac surgery, some of whom had pre‐existing raised creatinine. The data are given in Analysis 7.3, Analysis 7.4 and Analysis 7.5.
We estimated the risk of mortality with this intervention in one study (71 participants, OR 0.13, 95% CI 0.00 to 6.63; see Analysis 7.1). The risk of acute renal injury was not estimable from this single intervention study (see Analysis 7.2).
Intravenous fluid
Mortality was reported in four trials (152 participants, OR 0.75, 95% CI 0.16 to 3.42, I2 = 0%; see Analysis 8.1), and acute renal injury was reported in three trials (123 participants, OR 0.22, 95% CI 0.05 to 0.96, I2 = 56%; see Analysis 8.2).
Five trials studied the role of intravenous fluids such as colloids and hypertonic saline (Dawidson 1991; Harten 2008; Marathias 2006; Pull Ter Gunne 1990; Shackford 1983). Two studies (Pull Ter Gunne 1990; Shackford 1983) looked at creatinine clearance at 24 hours (see Analysis 8.3.1), and no difference was noted (MD ‐10.34 mL/min, 95% CI ‐29.57 to 8.88, I2 = 0%).
Cardiac surgery
Forty‐eight studies looked at the influence of different interventions in protecting the kidneys during cardiac surgery, and various measures were attempted.
Mortality
The risk of mortality (as reported in the trials) was estimated from 26 trials (2390 participants, OR 0.96, 95% CI 0.56 to 1.64, I2 = 10%; see Analysis 9.1).
Acute renal injury
The risk of acute renal injury (as reported in the trials) was estimated from 31 trials (2504 participants, OR 0.55, 95% CI 0.32 to 0.92, I2 = 49%; see Analysis 9.2).
Urine output
Seventeen studies (774 participants in the intervention groups and 701 participants in the control groups) looked at the influence of different interventions on urine output after cardiac surgery at 24 hours (see Analysis 9.3.1). Urine output increased by 0.26 mL/min in the treatment group (95% CI 0.17 to 0.36) but with significant heterogeneity in the results (I2 = 86%). Nine studies (see Analysis 9.3.2) looked at urine output two to three days after surgery. This measurement also showed no difference between intervention and control groups (MD 0.21 mL/min, 95% CI ‐0.13 to 0.54, I2 = 100%).
Creatinine clearance
Twenty‐four studies (see Analysis 9.4.1) looked at creatinine clearance after cardiac surgery at 24 hours in 1120 participants in the intervention groups and in 1016 participants in the control groups. The results suggested no significant improvement in creatinine clearance with treatment compared with control (MD 9.38 mL/min, 95% CI ‐5.99 to 24.74). Heterogeneity was high (I2 = 100%). Creatinine clearance was reported in 17 studies at two to three days after cardiac surgery (see Analysis 9.4.2) and in seven studies on the fifth to seventh day (see Analysis 9.4.3). Any evidence of beneficial effects of treatment in the later postoperative days was not clear because of the high heterogeneity of the results. Creatinine clearance improved on the second to third postoperative days (MD 14.21 mL/min, 95% CI 3.58 to 24.85, I2 = 100%) and on the fifth to seventh postoperative days (MD 14.99 mL/min, 95% CI 0.84 to 29.13, I2 = 97%). However, it is worthwhile noting that Sezai 2000, Sezai 2009 and Sezai 2011 (using atrial natriuretic peptide infusion as the treatment) estimated the GFR, which considerably favoured the treatment groups; the latter two studies included disproportionately high numbers of participants (789) and showed poor methodological quality.
Free water clearance
Free water clearance in mL/min was measured at 24 hours in seven studies (see Analysis 9.5.1). The results suggested less water clearance with treatment at 24 hours (MD ‐1.81 mL/min, 95% CI ‐2.02 to ‐1.60), with significant heterogeneity (I2 = 98%). Again, Sezai 2009 has largely influenced the results. A difference was reported from the second to the third day in four studies (MD ‐3.55 mL/min, 95% CI ‐3.89 to ‐03.21) but with significant heterogeneity (I2 = 99%).
Fractional excretion of sodium
Eight studies documented fractional excretion of sodium at 24 hours, and three studies at two to three days postoperatively (see Analysis 9.6).
Aortic surgery
Mortality
The risk of mortality (as reported in the trials) was estimated from eight trials (236 participants, OR 0.76, 95% CI 0.20 to 2.89, I2 = 5%; see Analysis 10.1).
Acute renal injury
The risk of acute renal injury (as reported in the trials) was estimated from eight trials (284 participants, OR 0.62, 95% CI 0.11 to 3.70, I2 = 0%; see Analysis 10.2).
Urine output
Seven studies measured urine output at 24 hours after elective aortic surgery. No demonstrable benefit was derived from treatment (see Analysis 10.3.1; MD ‐0.04 mL/min, 95% CI ‐0.10 to 0.19, I2 = 0%). Two trials measured urine output on second and third postoperative days and on fifth and seventh postoperative days (see Analysis 10.3.2 and Analysis 10.3.3) and showed no difference with treatment (MD 0.26 mL/min, 95% CI ‐0.06 to 0.58, I2 = 12% and MD ‐0.09 mL/min, 95% CI ‐0.39 to 0.21, I2 = 23%, respectively).
Creatinine clearance
Ten studies (see Analysis 10.4) looked at creatinine clearance after elective aortic surgery. All ten studies estimated creatinine clearance at 24 hours after surgery (see Analysis 10.4.1), and the results suggested no benefit resulting from treatment (MD 7.99 mL/min, 95% CI ‐0.77 to 16.74, I2 = 22%). The same conclusions were drawn from five trials that measured creatinine clearance on the second to third postoperative days and on the fifth to seventh postoperative days (see Analysis 10.4.2 and Analysis 10.4.3). The MD were 11.62 mL/min (95% CI ‐6.13 to 29.37, I2 = 46%) and ‐12.85 mL/min (95% CI ‐26.41 to 0.72, I2 = 5%), respectively. It is interesting to note that heterogeneity was moderate in these results.
Free water clearance
Five trials studied this outcome at 24 hours after aortic surgery (see Analysis 10.5.1). Results showed no significant benefit derived from treatment (MD ‐0.25 mL/min, 95% CI ‐0.51 to 0.01, I2 = 0%). Two studies looked at free water clearance on the second to fourth postoperative days and on the fifth to seventh postoperative days (see Analysis 10.5.2 and Analysis 10.5.3). No differences were noted (MD 0.37 mL/min, 95% CI ‐0.12 to 0.85, I2 = 0% and MD 0.24 mL/min, 95% CI ‐0.13 to 0.61, I2 = 0%, respectively).
Fractional excretion of sodium
Five studies reported this outcome (see Analysis 10.6.1) at 24 hours, and two studies (see Analysis 10.6.2) reported the results on the second to fourth postoperative days.
Renal plasma flow
Four trials estimated renal plasma flow after aortic surgery (see 'Data and analyses'; Analysis 10.7). Analysis of results at the end of the operation in two studies (see Analysis 10.7.1) showed no statistically significant difference between treatment and control groups (MD 50.29 mL/min, 95% CI ‐92.83 to 193.40, I2 = 28%). The same held true for renal plasma flow at 24 hours after operation in two studies (see Analysis 10.7; MD 45.86 mL/min, 95% CI ‐18.64 to 110.36, I2 = 0%).
Biliary surgery
Urine output
Only two trials looked at urine output at 24 hours, two to four days, and five to seven days after biliary surgery (see Analysis 11.1). Some evidence from these two studies showed that urine output was less at 24 hours after an intervention was used (MD ‐0.59 mL/min, 95% CI ‐0.99 to ‐0.19, I2 = 18%), but it was not different at two to four days (MD 0.24 mL/min, 95% CI ‐0.22 to 0.69, I2 = 26%) and favoured control at five to seven days (MD 0.23 mL/min, 95% CI 0.09 to 0.37, I2 = 0%).
Creatinine clearance
Three trials measured creatinine clearance in mL/min at 24 hours (see Analysis 11.2.1). No benefit was derived from the use of an intervention (MD ‐2.84 mL/min, 95% CI ‐14.07 to 8.39, I2 = 46%). The same was true for creatinine clearance values from three trials measuring creatinine clearance on the second to fourth postoperative days (see Analysis 11.2.2; MD 0.42 mL/min, 95% CI ‐16.68 to 17.52, I2 = 8%) and from two trials at five to seven days postoperatively (MD 0.58 mL/min, 95% CI ‐16.43 to 17.60, I2 = 28%).
Pre‐existing renal impairment
Fourteen studies included participants with pre‐existing renal impairment or high risk of renal damage, although different criteria were used (Adabag 2008; Burns 2005; Chen 2007; Cogliati 2007; Dehne 2001; Durmaz 2003; Haase 2007; Haase 2009; Marathias 2006; Nouri‐Majalan 2009; Prasad 2010; Prowle 2012; Ristikankare 2006; Witczak 2008). All of these trials involved participants undergoing cardiac surgery. Bergman 2002 used diltiazem infusions; Costa 1990 used dopamine or dopexamine infusions; Durmaz 2003 used preoperative haemodialysis; and Marathias 2006 used preoperative hydration. We identified an additional ten studies with pre‐existing renal damage.
Ten studies looked at mortality. No differences were noted between treatment groups and control groups (OR 0.74, 95% CI 0.36 to 1.52, I2= 20%; see Analysis 12.1). Participants who developed acute renal injury requiring renal dialysis were reported in eleven studies (OR 0.40, 95% CI 0.22 to 0.76, I2 = 37%; see Analysis 12.2). Both of these analyses used the fixed‐effect model because the incidence rate was very low. Studies were sufficient for the construction of funnel plots (Figure 4 and Figure 5); both suggested no significant publication bias.

Funnel plot of comparison: 12 Studies on participants with pre‐existing renal impairment, outcome: 12.1 Mortality.

Funnel plot of comparison: 12 Studies on participants with pre‐existing renal impairment, outcome: 12.2 Acute renal injury.
Four studies looked at urine output at 24 hours. The heterogeneity of these studies was large and hence precludes any conclusions; at 24 hours, the difference between intervention groups and control groups was 0.55 mL/min (95% CI 0.37 to 0.74 mL, I2 = 76%; see Analysis 12.3.1), and at 2 to 3 days postoperatively, the difference was 0.48 mL/min (95% CI 0.32 to 0.64, I2 = 98%; see Analysis 12.3.2). Four studies also looked at creatinine clearance at 24 hours, and the difference was insignificant (0.65 mL/min, 95% CI ‐0.75 to 2.06, I2 = 97%; see Analysis 12.4.1). On postoperative days 2 to 3, the difference was 1.33 mL/min in three studies (95% CI ‐0.02 to 2.68, I2 = 95%; see Analysis 12.4.2).
Low risk of bias studies
In this update, we identified 24 studies as having low risk of bias (Additional Table 1, Characteristics of included studies), 12 of them being assessed as good (Adabag 2008; Burns 2005; Cogliati 2007; Fischer 2005; Haase 2007; Haase 2009; Kaya 2007; Myles 1993; Prowle 2012; Shim 2007; Song 2009; Turner 2008) and 12 assessed as moderately good (Ascione 1999; Barr 2008; Carcoana 2003; Cho 2009; Dawidson 1991; de Lasson 1995; de Lasson 1997; Hynninen 2006; Lassnigg 2000; Morariu 2005; Perez 2002; Ristikankare 2006). Data from these studies were subjected to sensitivity analysis. Unfortunately, reports on Perez 2002 contained data that were unsuitable for analysis, and this was confirmed by contact with the authors. We performed sensitivity analyses on the low risk of bias studies, and available data enabled us to report on mortality, acute renal impairment requiring renal supportive measures (dialysis) and urine output and creatinine clearance at 24 hours.
Nineteen studies reported mortality numbers (1604 participants,OR 1.01, 95% CI 0.52 to 1.97, I2= 0%; see Analysis 13.1). Fifteen studies reported data on acute renal injury requiring dialysis (1600 participants, OR 1.05, 95% CI 0.55 to 2.03, I2= 1%; see Analysis 13.2). Studies were sufficient for construction of funnel plots (Figure 6 and Figure 7); both suggested no significant publication bias.

Funnel plot of comparison: 13 Studies with low risk of bias: sensitivity analysis, outcome: 13.1 Reported mortality, low risk of bias studies only.

Funnel plot of comparison: 13 Studies with low risk of bias: sensitivity analysis, outcome: 13.2 Acute renal injury, requiring dialysis, low risk of bias studies only.
Urine output at 24 hours was reported in 11 studies; the difference was 0.20 mL/min (95% CI ‐0.04 to 0.44 mL/min, I2 = 71%; see Analysis 13.3). Creatinine clearance at 24 hours was reported in nine studies, and the difference was 6.59 mL/min (95% CI ‐3.53 to 16.72 mL/min, I2 = 94%; see Analysis 13.4).
Results suggested that even the low risk of bias studies, although few, showed no overall advantage for treatment versus control groups.
Assessment of small study bias
Funnel plots were examined for meta‐analyses with 10 or more studies. Results showed no evidence of small sample biases (graphs not shown).
Summary of findings
A summary of findings (SoF) table was developed using GradePro on studies with pre‐existing renal impairment (summary of findings Table for the main comparison). The results suggest no advantage of interventions for mortality, but statistical evidence suggests that interventions might be helpful for reducing acute renal injury. However, it should be noted that the evidence is of low quality because clinical heterogeneity was considerable. Studies with low risk of bias (summary of findings Table 2) show no significant changes in reported perioperative mortality and in acute renal injury between intervention and control groups. Both SoF analyses suffer from low quality of evidence because of clinical heterogeneity and the small numbers of participants and events included in each study.
Discussion
Summary of main results
Renal dysfunction after major surgery is one of the causes of postoperative morbidity and mortality. The cause of renal injury in the postoperative period is thought to be multi‐factorial. Over the past three or four decades, many studies have tried to identify interventions that could provide renal protection during the perioperative period. Many different interventions have been tried, such as continuous infusions of dopamine or its analogues, use of diuretics such as mannitol and diligent use of ACE inhibitors and calcium channel blockers, to name a few. Drugs such as N‐acetyl cysteine (NAC), atrial natriuretic peptide (ANP), sodium bicarbonate, antioxidants and erythropoietin (EPO) are some of the more recent interventions. None of these interventions appears to have a good evidence base.
We were unable to combine the whole data because of significant heterogeneity among selected studies. Given the large range of treatments, operation types and methods used to protect the kidneys, it is not surprising that heterogeneity is large. Heterogeneity could have been the result of multiple causes, including differences in the nature of treatment, the duration of treatment or participants' conditions, and of course it could have been related to the methodological quality of the studies. We used subgroup analyses to explore this further.
We performed subgroup analyses for the different interventions that were studied. Dopamine and its analogues showed no improvement in urine output or in other tests such as creatinine clearance, free water clearance or fractional excretion of sodium. Overall, on the basis of available studies, it appears that dopamine and its analogues do not offer much protection to the kidneys. It is worth noting that in a multi‐centre study of participants in intensive care units (ANZICS CTG 2000), no significant benefit of dopamine was noted for these seriously ill individuals.
A 'Summary of findings' table, which used only low risk of bias studies, showed no benefit derived from interventions for domains of mortality and acute renal injury requiring dialysis. We looked at the effects of some of the major interventions (dopamine and its analogues, diuretics, calcium channel blockers, ACE inhibitors, atrial natriuretic peptide, N‐acetyl cysteine, IV fluids and EPO) and major surgical procedures (cardiac surgery and abdominal aortic surgery), as well as groups of participants identified as having pre‐existing renal damage; none of these groups showed a significant change in reported mortality or renal injury (as reported in the individual studies) in treatment groups versus control groups.
Overall completeness and applicability of evidence
Many physiological and biochemical variables can be used as markers of change in renal function. The various trials included in this review used numerous different markers as indicators of altered renal function. Each test has significant limitations, and results of the analysis must be interpreted in the context of these limitations.
-
Plasma creatinine is the most frequently measured marker of renal function. It is assumed that plasma creatinine remains constant and that clearance of creatinine occurs solely by glomerular filtration. Thus plasma creatinine is an indirect determinant of glomerular filtration rate (GFR). However, a greater than 50% reduction in GFR is needed before a change in plasma creatinine is seen. Plasma creatinine also reflects an individual's muscle mass, and alterations in muscle mass influence the plasma creatinine concentration, which does not reflect changes in GFR. A small amount of tubular excretion of creatinine occurs, which, in terms of normal GFR, is insignificant. However, with severe renal impairment, tubular secretion of creatinine has a greater role, and therefore plasma creatinine does not accurately reflect GFR. GFR is usually determined by the clearance of an inert substance, which is freely filtered at the glomerulus and has no tubular secretion or reabsorption. The gold standard has been estimation of inulin clearance. Creatinine clearance correlates well with GFR. For accuracy, it is essential that creatinine clearance is determined correctly. This requires a timed and complete collection of urine, along with a plasma creatinine determination. A variety of formulae have been derived that are based on plasma creatinine, body weight and age and are to estimate creatinine clearance and hence GFR. When renal function is stable, these estimates correlate well with measured GFR (r = 0.9).
-
Urine output is a non‐specific measure of renal function. Clearly, if no urine is produced, then no glomerular filtration occurs. However, urine output can be influenced by several factors that regulate renal tubular handling of water. Oliguria (<400 mL urine/24 h) may just reflect excess salt and water retention by the kidney due to low fluid intake, not necessarily impaired renal function or the effects of increased antidiuretic hormone (ADH) release-a normal response to surgery or stress.
-
In clinical practice, renal blood flow is rarely determined, but this can be done by using clearance techniques using the Fick principle.
-
Free water clearance measures urinary concentrating ability. Any form of damage to the kidney impairs urinary concentrating ability. With renal tubular injury, free water clearance is impaired. Likewise, free water clearance is modified by diuretic therapy.
-
The fractional excretion of sodium has been used as a marker of renal function. More correctly, it reflects renal tubular reabsorption of sodium. The normal physiological response to a reduction in renal perfusion and glomerular filtration is to activate the tubular glomerular feedback mechanism, leading to increased reabsorption of sodium, along with water. The net effect consists of increased blood pressure and hence renal perfusion. In the acute situation (the first 24 hours after an event that affects renal function), low fractional sodium excretion (FeNa < 1%) indicates impaired renal perfusion. With any form of established renal damage, or the use of diuretics, the fractional excretion of sodium is increased and becomes impossible to interpret. It is, therefore, essential that the changes in markers of renal function that were recorded in the analysed papers are examined critically for the variables that influence reported measurements. Conclusions drawn from the results should be closely examined for the validity of the renal function measures that were used. An inability to correctly interpret the results prompted us to refrain from analysing the data on FeNa and instead to provide the raw data.
-
Newer advances in determining acute renal injury have been reported. These include use of various biomarkers such as urinary N‐acetyl‐beta‐D‐glucosaminidase (U‐NAG) to creatinine ratio, urine retinol‐binding protein (RBP) to creatinine ratio and urinary neutrophil gelatinase‐associated lipocalin (NGAL) to creatinine ratio and blood plasma cystatin C levels. We have looked at these tests in this review update.
We believe it is important to emphasize that the lack of statistical significance described in this review could be due to many factors. We have already discussed heterogeneity as a significant factor; causes of heterogeneity include different types and durations of operations, gender differences, smoking status, state of nutrition, age, alcohol intake and co‐morbidities such as hypertension, diabetes or other unknown causes. The potential role of publication (or small sample) bias is also important. One of the common methods employed to facilitate recognition of publication bias is the funnel plot. The most common reasons for small sample bias are the reluctance of trialists or journal editors to publish because results are non-statistically significant, but other reasons include small numbers of cases investigated in trials; lack of allocation concealment; and inadequate blinding. All of these events may result in misleading positive outcomes, leading to publication bias. Apart from visual examination of funnel plots, various complicated statistical methods are available, but none are wholly satisfactory for recognizing and avoiding small sample bias. A high level of suspicion is always required when reviews consisting of poor quality studies and studies with small sample sizes are interpreted, as with this review. Of particular concern are the high I2 values seen in many analyses; these may be due to significant statistical and clinical heterogeneity.
Results obtained with the use of diuretics were disappointing and suggested no real advantage for participants who received the treatment. The same is true for the use of calcium channel blockers and ACE inhibitors, both of which apparently offer no advantages. The use of hydration fluids also showed no obvious advantage for clear fluids over specialized colloid solutions, although the methodology of the studies and the information provided were of poor quality. It is interesting to note that only four studies investigated the role of different types of intravenous fluids in the perioperative setting, although in most studies participants were well hydrated. Wahbah 2000 makes special mention of the fluid status of participants. Is it simply that kidneys are at their happiest when they have a good pre‐load to wash out toxic substances?
Other interventions such as N‐acetyl cysteine and EPO have failed to show any advantage. It is a matter of note that a meta‐analysis of studies using Atrial Natriuretic Peptides has shown some benefit of treatment in the form of improved creatinine clearance. However, caution is required in accepting these findings because two large studies conducted by one particular author reported an advantage of NAC over controls and considerably influenced the overall results (Sezai 2009; Sezai 2011).
Potential renal damage in participants with pre‐existing renal injury is widely recognized (Wijeysundera 2006). One area of interest for the authors of this review involved looking at the beneficial effects of treatment in participants with pre‐existing renal impairment. Fortunately, we were able to include in this updated review 14 studies that considered this topic. These studies used different interventions. Unfortunately, available data are somewhat limited for the purpose of analysis. No difference was noted in reported mortality, but some advantage seems to be associated with treatment intervention, thus avoiding acute renal injury. Note that we have previously discussed differing criteria between studies for the diagnosis of acute renal damage. Urine output seems to improve when interventions are provided for patients with pre‐existing renal damage, but the heterogeneity of the studies makes the results less valid.
We performed a sensitivity analysis of 24 studies of high and moderately high methodological quality. The results suggest no benefit for mortality or acute renal damage associated with treatment intervention. A marginal advantage seen in better urine output at 24 hours was offset by high heterogeneity, and no advantage was noted for creatinine clearance at 24 hours. These results substantiate the overall findings on questionable renal protection effects for various interventions given during the perioperative period.
It is important to remember that the effect of ADH is part of the usual stress response of surgery. Both urine output and free water clearance in the first 12 to 24 hours after surgery are reduced because of the influence of ADH (Brazel 1996). Fractional excretion of sodium is increased with the use of diuretics. Hence we would question the worth of measurements of urine output, free water clearance and fractional excretion of sodium as measures of renal function in the perioperative period. Glomerular filtration rate (and creatinine clearance) and renal plasma flow are good measures of renal function, but these must be measured accurately if meaningful conclusions are to be drawn.
Quality of the evidence
A major outcome of interest, mortality, was reported in a number of studies. Only a small number of deaths were reported in the trials, and this review shows that no advantage was conferred by individual interventions. Similarly, another outcome of major importance, acute renal injury after operation, was reported in only a few of the included studies. No evidence suggests that specific interventions offered any advantages for participants. However, it is important to recognize that the methodological quality of many of the included studies was poor and that the number of reported cases was small. Another point to consider is the inconsistency of the criteria used to diagnose renal injury across multiple studies. As a result, the statistical significance may not indicate a true advantage of interventions over no interventions.
In the subgroup of surgical procedures, cardiac surgery, aortic surgery and biliary surgery were considered for analysis. In cardiac surgery, interventions helped to increase urine output at 24 hours after surgery, but a high level of heterogeneity made the results unconvincing. Creatinine clearance also improved slightly at two to three days and five to seven days after surgery with treatment given to participants undergoing cardiac surgery, ,but the results are considerably swayed by the studies conducted by Sezai et al (Sezai 2009; Sezai 2011). None of the other tests showed any significant changes. Reported mortality and acute renal injury were no different after cardiac surgery and after abdominal aortic surgery.
No benefit was noted in other forms of interventions and surgery. However, the number and quality of studies in these areas are limited.
Potential biases in the review process
Even though we included 72 studies in this review, the overall methodological quality of the studies was poor. The methodological quality assessment identified twelve studies of good quality and another nine studies in which the methodological quality was considered moderately good. Most of the studies that we assessed (51 studies) were classified as showing poor methodological quality. This would reflect on any conclusions drawn from this review.
A note of caution: Many of the studies included in this review are old and were conducted before adaptations were made to the RIFLE (risk, injury, failure, loss of kidney function and end‐stage kidney disease) classification, which was introduced in 2004 (Bellomo 2007), and to acute kidney injury (AKI) diagnosis and classification criteria, introduced in 2007 (Mehta 2007). These classifications are generally accepted in modern clinical practice and research (Lopes 2013). So that the reader might find no uniformity or consistency for the diagnosis or classification of renal damage in many of the older studies included in this review; we have taken the criteria and diagnosis used by the authors. Any future update of this review should include a subgroup of studies conforming to such classification as RIFLE or AKI.
Another area of concern was that we were unable to standardize the administration or withholding of various medications, which may or may not have influenced individual study results.
Agreements and disagreements with other studies or reviews
Results of this review reflect previous versions of the review (Zacharias 2005; Zacharias 2008). A recent systematic review, undertaken to look at renal protection offered by perioperative haemodynamic manipulation, looks at the effects of haemodynamic stabilization and the effects of inotropes and fluids or a combination of these (Brienza 2009). Although we are reluctant to comment on the methodological rigor of the Brienza review, it is of note that this review agrees with the present review on the use of fluids as a measure to protect renal function, showing no clear advantage for fluid management alone. However, the focus of our review is exploration of the effects of pharmacological agents used in the perioperative period.
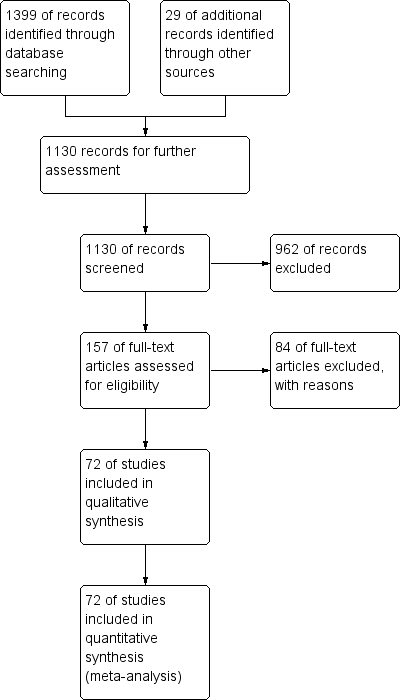
Study flow diagram, as of December 2012.

Risk of bias graph: review authors' judgements about each risk of bias item presented as percentages across 78 included studies.
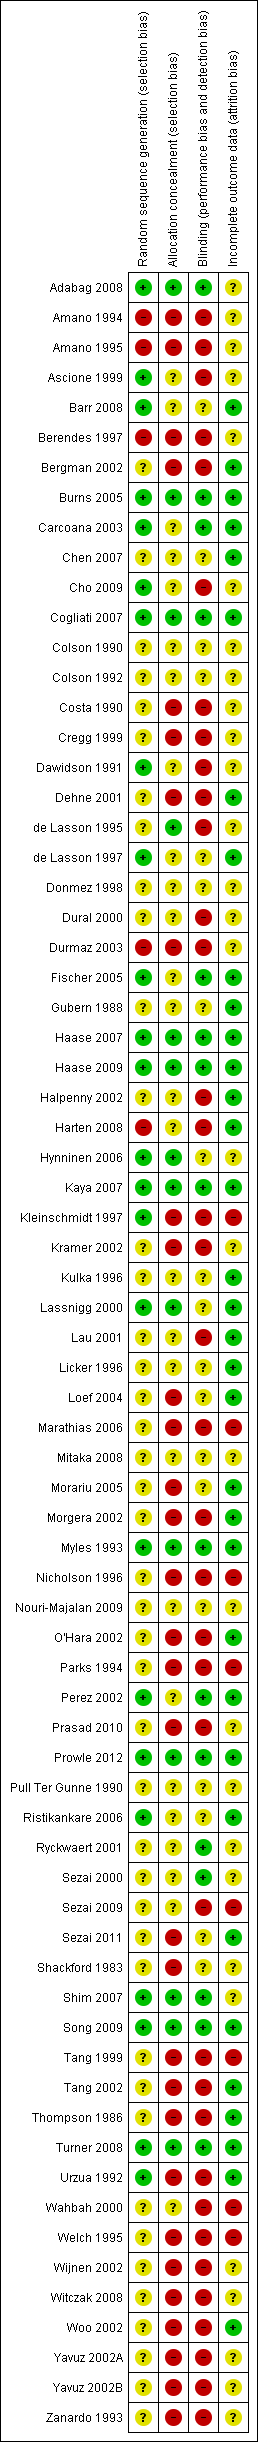
Risk of bias summary: review authors' judgements about each risk of bias item for each included study.

Funnel plot of comparison: 12 Studies on participants with pre‐existing renal impairment, outcome: 12.1 Mortality.
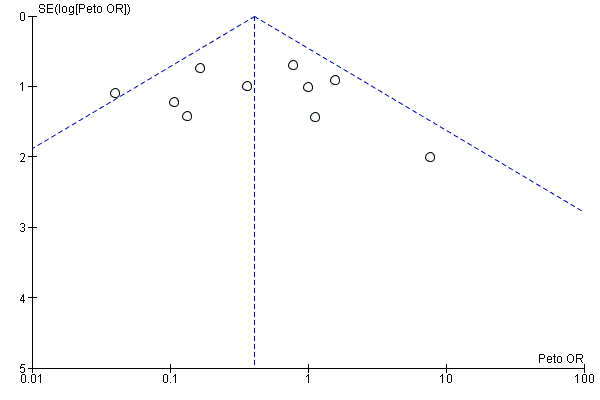
Funnel plot of comparison: 12 Studies on participants with pre‐existing renal impairment, outcome: 12.2 Acute renal injury.
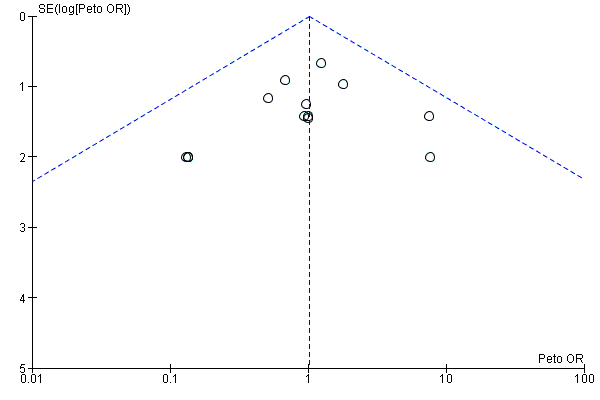
Funnel plot of comparison: 13 Studies with low risk of bias: sensitivity analysis, outcome: 13.1 Reported mortality, low risk of bias studies only.
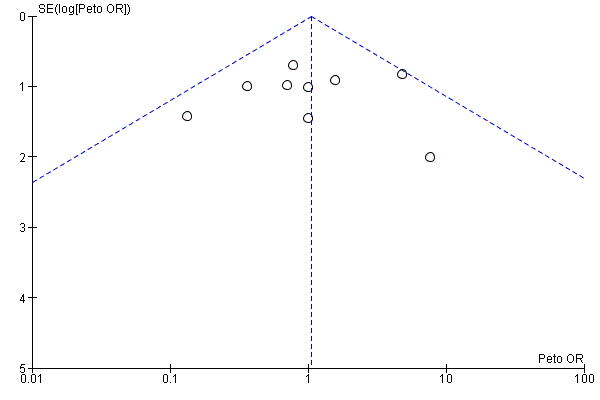
Funnel plot of comparison: 13 Studies with low risk of bias: sensitivity analysis, outcome: 13.2 Acute renal injury, requiring dialysis, low risk of bias studies only.
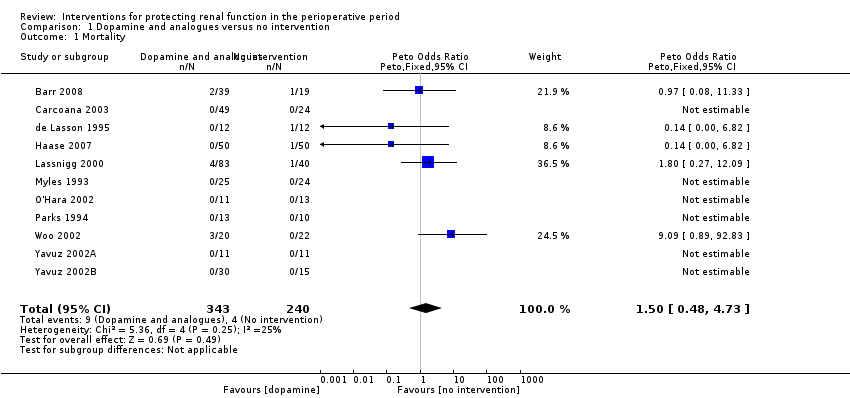
Comparison 1 Dopamine and analogues versus no intervention, Outcome 1 Mortality.

Comparison 1 Dopamine and analogues versus no intervention, Outcome 2 Acute renal injury.
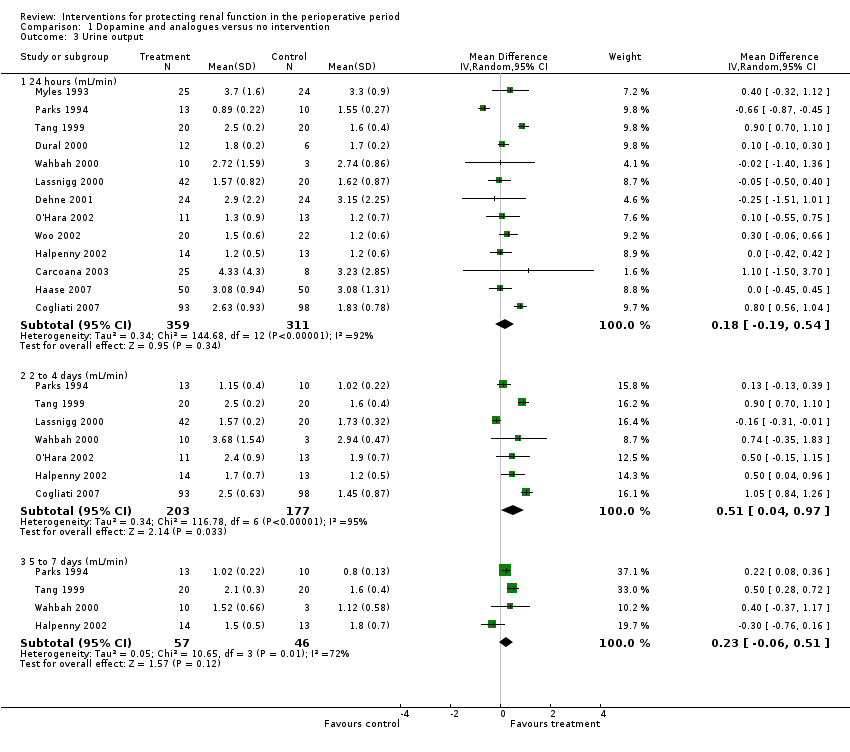
Comparison 1 Dopamine and analogues versus no intervention, Outcome 3 Urine output.

Comparison 1 Dopamine and analogues versus no intervention, Outcome 4 Creatinine clearance.
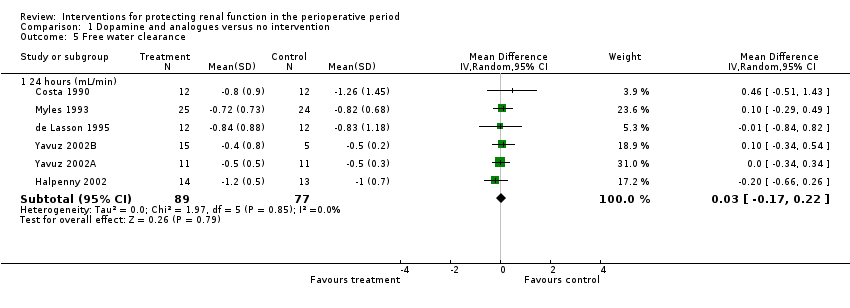
Comparison 1 Dopamine and analogues versus no intervention, Outcome 5 Free water clearance.

Comparison 1 Dopamine and analogues versus no intervention, Outcome 6 Fractional excretion of sodium.

Comparison 1 Dopamine and analogues versus no intervention, Outcome 7 Renal plasma flow (24 hours).

Comparison 2 Diuretics versus no intervention, Outcome 1 Mortality.
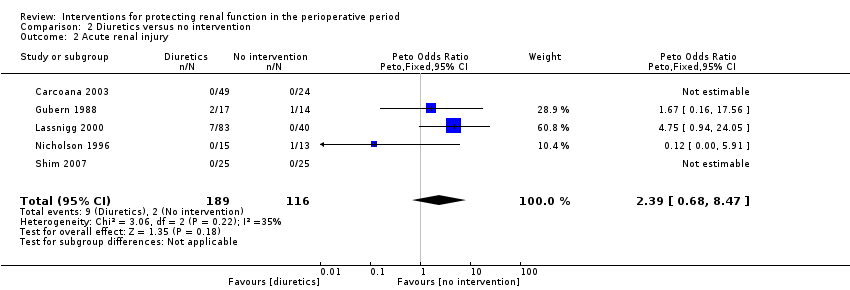
Comparison 2 Diuretics versus no intervention, Outcome 2 Acute renal injury.
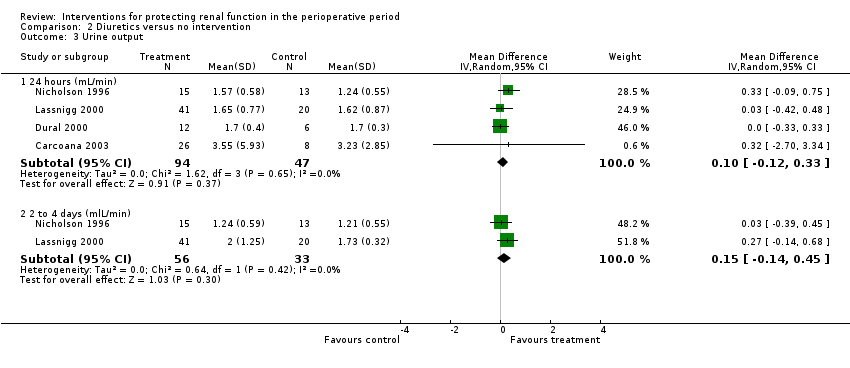
Comparison 2 Diuretics versus no intervention, Outcome 3 Urine output.

Comparison 2 Diuretics versus no intervention, Outcome 4 Creatinine clearance.

Comparison 3 Calcium channel blockers versus no intervention, Outcome 1 Mortality.

Comparison 3 Calcium channel blockers versus no intervention, Outcome 2 Acute renal injury.

Comparison 3 Calcium channel blockers versus no intervention, Outcome 3 Urine output.
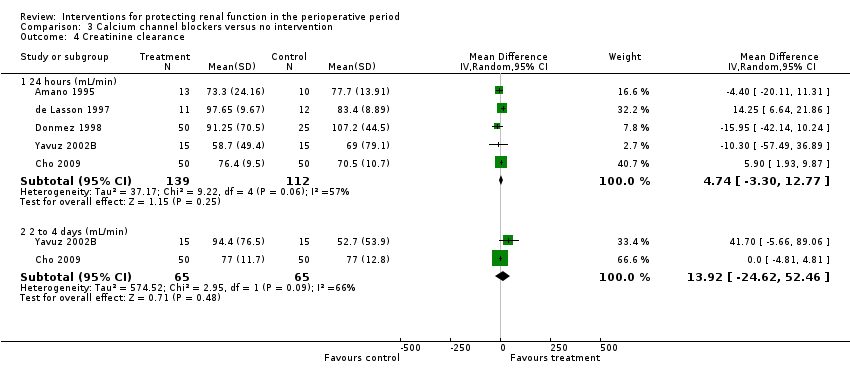
Comparison 3 Calcium channel blockers versus no intervention, Outcome 4 Creatinine clearance.

Comparison 3 Calcium channel blockers versus no intervention, Outcome 5 Free water clearance.
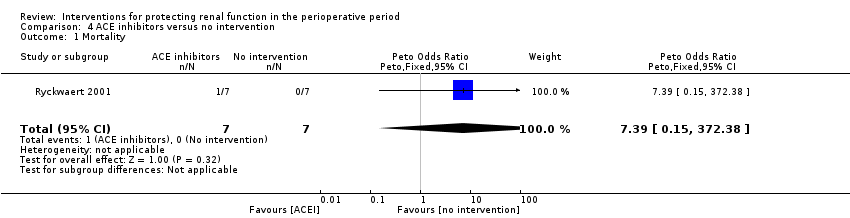
Comparison 4 ACE inhibitors versus no intervention, Outcome 1 Mortality.

Comparison 4 ACE inhibitors versus no intervention, Outcome 2 Acute renal injury.

Comparison 4 ACE inhibitors versus no intervention, Outcome 3 Renal plasma flow.
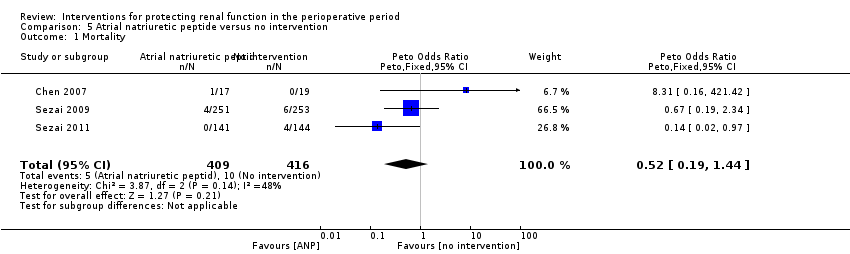
Comparison 5 Atrial natriuretic peptide versus no intervention, Outcome 1 Mortality.
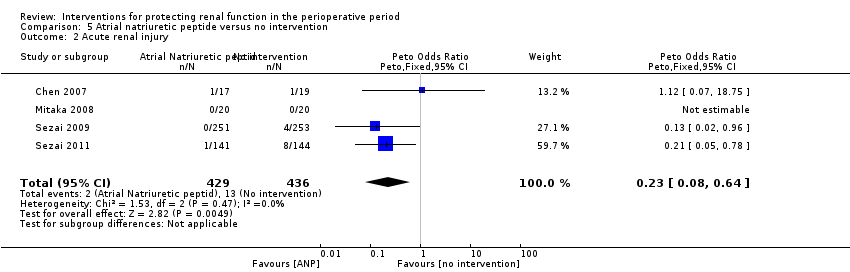
Comparison 5 Atrial natriuretic peptide versus no intervention, Outcome 2 Acute renal injury.

Comparison 5 Atrial natriuretic peptide versus no intervention, Outcome 3 Urine output at 24 hours.

Comparison 5 Atrial natriuretic peptide versus no intervention, Outcome 4 Creatinine clearance, 24 hours.

Comparison 5 Atrial natriuretic peptide versus no intervention, Outcome 5 Creatinine clearance, 2 to 3 days.
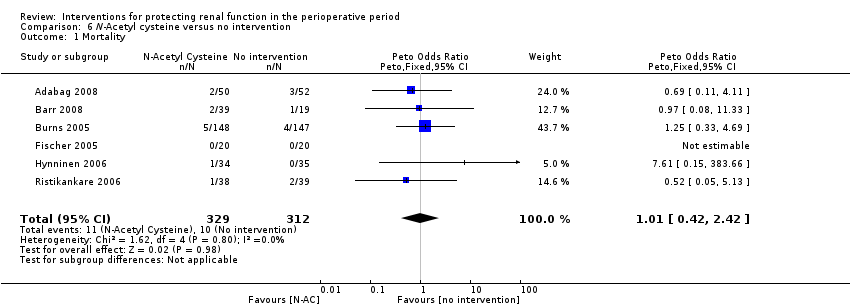
Comparison 6 N‐Acetyl cysteine versus no intervention, Outcome 1 Mortality.

Comparison 6 N‐Acetyl cysteine versus no intervention, Outcome 2 Acute renal injury.

Comparison 6 N‐Acetyl cysteine versus no intervention, Outcome 3 Urine output, 24 hours.
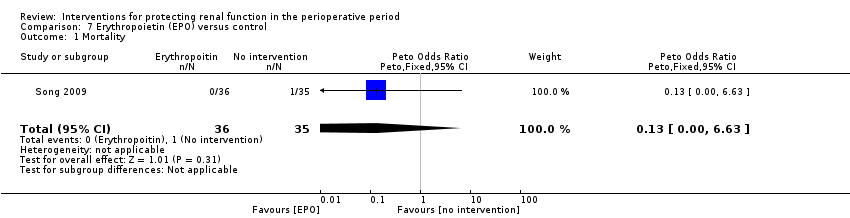
Comparison 7 Erythropoietin (EPO) versus control, Outcome 1 Mortality.

Comparison 7 Erythropoietin (EPO) versus control, Outcome 2 Acute renal injury.
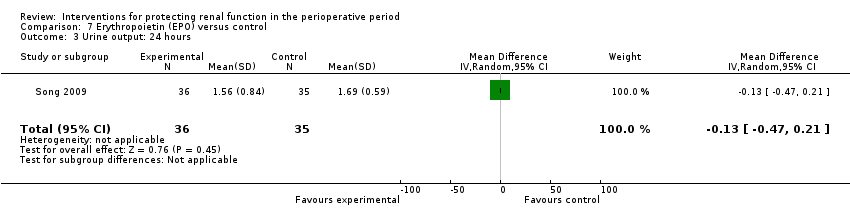
Comparison 7 Erythropoietin (EPO) versus control, Outcome 3 Urine output: 24 hours.

Comparison 7 Erythropoietin (EPO) versus control, Outcome 4 Urine output: 2 to 3 days.

Comparison 7 Erythropoietin (EPO) versus control, Outcome 5 Urine output: 5 to 7 days.

Comparison 8 Intravenous fluid versus control, Outcome 1 Mortality.
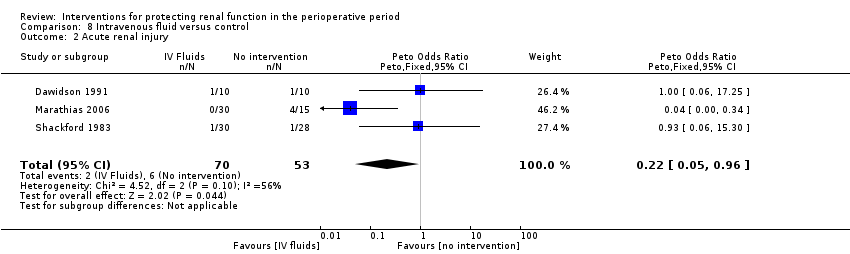
Comparison 8 Intravenous fluid versus control, Outcome 2 Acute renal injury.
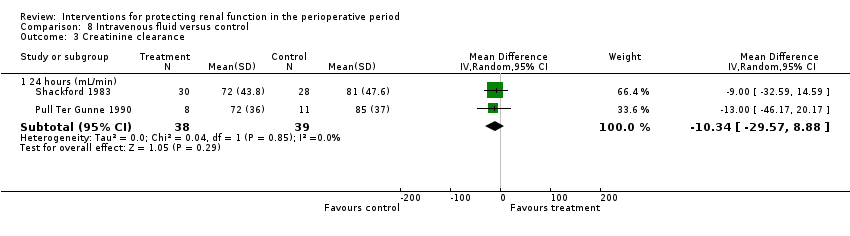
Comparison 8 Intravenous fluid versus control, Outcome 3 Creatinine clearance.

Comparison 9 Cardiac surgery: subgroup analysis, Outcome 1 Mortality.

Comparison 9 Cardiac surgery: subgroup analysis, Outcome 2 Acute renal injury.

Comparison 9 Cardiac surgery: subgroup analysis, Outcome 3 Urine output.
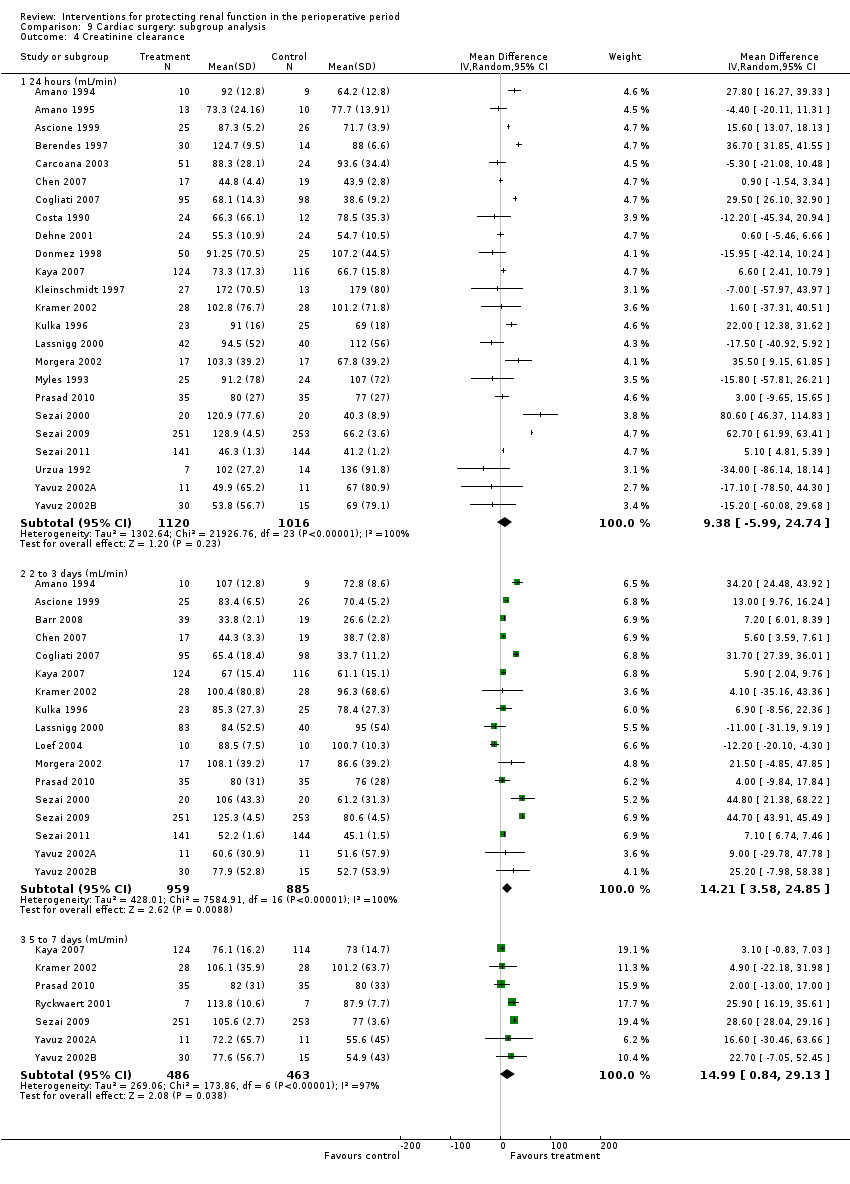
Comparison 9 Cardiac surgery: subgroup analysis, Outcome 4 Creatinine clearance.

Comparison 9 Cardiac surgery: subgroup analysis, Outcome 5 Free water clearance.

Comparison 9 Cardiac surgery: subgroup analysis, Outcome 6 Fractional excretion of sodium.
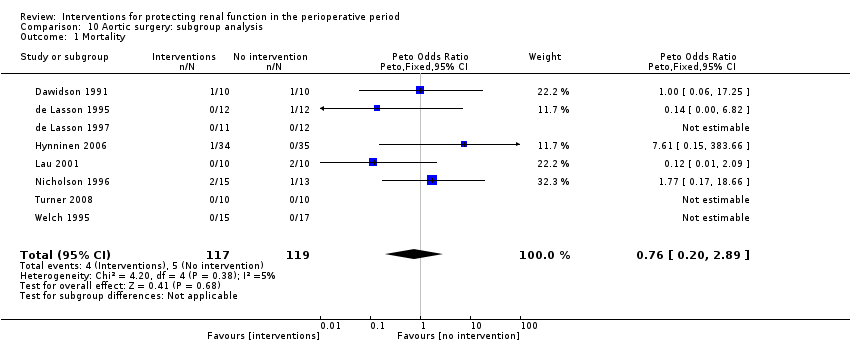
Comparison 10 Aortic surgery: subgroup analysis, Outcome 1 Mortality.
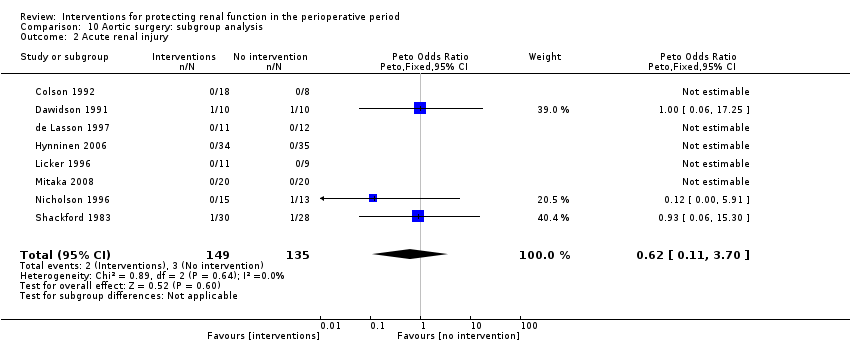
Comparison 10 Aortic surgery: subgroup analysis, Outcome 2 Acute renal injury.

Comparison 10 Aortic surgery: subgroup analysis, Outcome 3 Urine output.

Comparison 10 Aortic surgery: subgroup analysis, Outcome 4 Creatinine clearance.
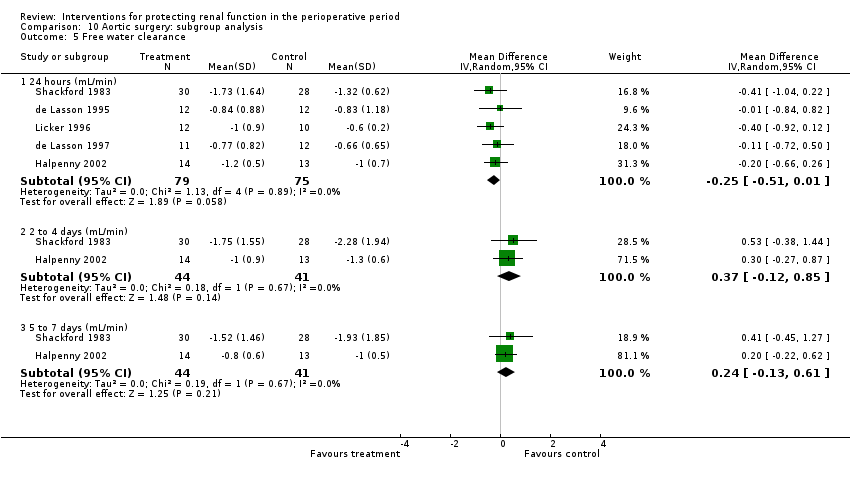
Comparison 10 Aortic surgery: subgroup analysis, Outcome 5 Free water clearance.

Comparison 10 Aortic surgery: subgroup analysis, Outcome 6 Fractional excretion of sodium.
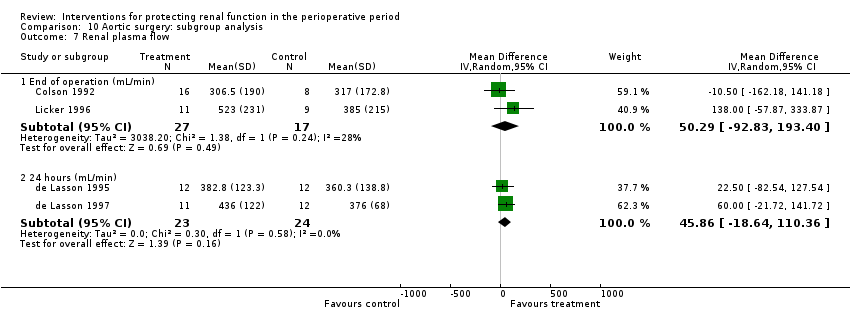
Comparison 10 Aortic surgery: subgroup analysis, Outcome 7 Renal plasma flow.
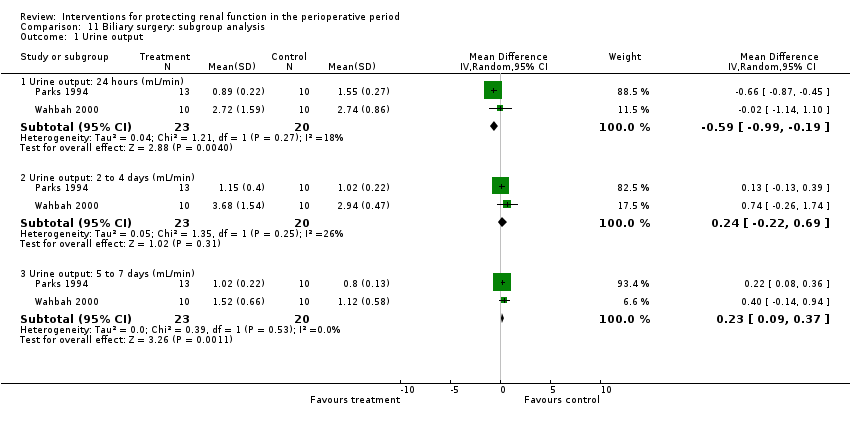
Comparison 11 Biliary surgery: subgroup analysis, Outcome 1 Urine output.
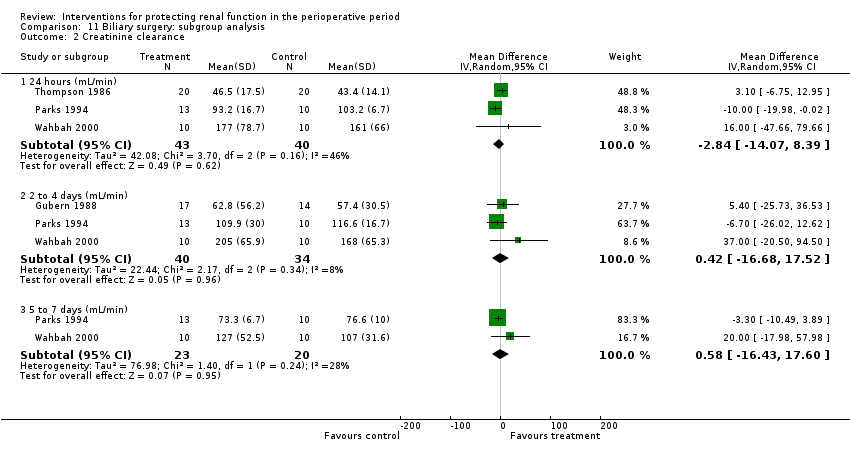
Comparison 11 Biliary surgery: subgroup analysis, Outcome 2 Creatinine clearance.

Comparison 12 Studies on participants with pre‐existing renal impairment, Outcome 1 Mortality.

Comparison 12 Studies on participants with pre‐existing renal impairment, Outcome 2 Acute renal injury.

Comparison 12 Studies on participants with pre‐existing renal impairment, Outcome 3 Urine output.

Comparison 12 Studies on participants with pre‐existing renal impairment, Outcome 4 Creatinine clearance.

Comparison 13 Studies with low risk of bias: sensitivity analysis, Outcome 1 Reported mortality, low risk of bias studies only.

Comparison 13 Studies with low risk of bias: sensitivity analysis, Outcome 2 Acute renal injury, requiring dialysis, low risk of bias studies only.

Comparison 13 Studies with low risk of bias: sensitivity analysis, Outcome 3 Urine output at 24 hours, low risk of bias studies only.

Comparison 13 Studies with low risk of bias: sensitivity analysis, Outcome 4 Creatinine clearance at 24 hours, low risk of bias studies only.
| Interventions for protecting renal function in patients with pre‐existing renal impairment who are undergoing surgery | ||||||
| Patient or population: patients with pre‐existing renal impairment Settings: perioperative period (7 days) Intervention: interventions to protect the kidneys during the perioperative period Comparison: placebo or no intervention | ||||||
| Outcomes | Illustrative comparative risks* (95% CI) | Relative effect | No. of participants | Quality of the evidence | Comments | |
| Assumed risk | Corresponding risk | |||||
| Placebo or no intervention | Various interventions | |||||
| Mortality in patients with pre‐existing renal impairment As reported in the included trials Folliow‐up: 7 days | Study population | OR 0.74 (0.36 to 1.52) | 959 | ⊕⊝⊝⊝ | Evidence is not strong and is of poor quality | |
| 38 per 1000 | 29 per 1000 | |||||
| Moderate | ||||||
| 20 per 1000 | 15 per 1000 (8 to 30) | |||||
| Acute renal injury in patients with pre‐existing renal impairment As reported in the included trials Follow‐up: 1 to 7 days | Study population | OR 0.40 (0.22 to 0.76) | 979 | ⊕⊝⊝⊝ | Evidence is not strong and is of poor quality (although it might give a statistical edge) | |
| 62 per 1000 | 28 per 1000 | |||||
| Moderate | ||||||
| 40 per 1000 | 18 per 1000 (9 to 32) | |||||
| *The basis for the assumed risk (e.g. the median control group risk across studies) is provided in the footnotes. The corresponding risk (and its 95% confidence interval) is based on the assumed risk in the comparison group and the relative effect of the intervention (and its 95% CI). CI: Confidence interval; OR: Odds ratio. | ||||||
| GRADE Working Group grades of evidence: | ||||||
| aOnly six of the 10 studies showed low risk of bias. | ||||||
| Interventions to protect the kidneys during the perioperative period in patients undergoing surgery: low ROB studies only | ||||||
| Patient or population: patients undergoing surgery Comparison: placebo or no intervention | ||||||
| Outcomes | Illustrative comparative risks* (95% CI) | Relative effect | No. of participants | Quality of the evidence | Comments | |
| Assumed risk | Corresponding risk | |||||
| Control | Interventions to protect the kidneys: low ROB cases only | |||||
| Reported mortality, low risk of bias studies only | Study population | OR 1.01 | 1604 | ⊕⊝⊝⊝ | Evidence is not strong and is of poor quality | |
| 23 per 1000 | 23 per 1000 | |||||
| Moderate | ||||||
| 20 per 1000 | 20 per 1000 | |||||
| Acute renal injury, low‐risk studies only | Study population | OR 1.05 | 1550 | ⊕⊝⊝⊝ | Evidence is not strong and is of poor quality (although it might give a statistical edge) | |
| 23 per 1000 | 24 per 1000 | |||||
| Moderate | ||||||
| 0 per 1000 | 0 per 1000 | |||||
| *The basis for the assumed risk (e.g. the median control group risk across studies) is provided in the footnotes. The corresponding risk (and its 95% confidence interval) is based on the assumed risk in the comparison group and the relative effect of the intervention (and its 95% CI). | ||||||
| GRADE Working Group grades of evidence: | ||||||
| aOnly six of the 10 studies showed low risk of bias. | ||||||
| Study ID | Randomization | Allocation concealment | Blinding | Withdrawals recorded | Overall quality |
| Randomly assigned by the investigational pharmacist Block randomization (blocks of 10) | Participants, researchers and clinicians blinded to treatment assignment
| Participants, researchers and clinicians (including data collecting nurse) blinded Drug packets matched in volume, colour, consistency and transparency and given mixed with fruit juice to mask taste | Not reported | Good | |
| ‘Randomly assigned’ into two groups | None described | None described; control group had no treatment | Not described | Poor | |
| ‘Patients were randomized into either diltiazem or no treatment' | Not described | None described; control group had no treatment | Not described | Poor | |
| ‘Prospectively randomized by card allocation’ | ‘Prospectively randomized by card allocation’ | Not used | Not discussed | Moderate | |
| Randomization done by pharmacy department; method of randomization uncertain Not sure about adequacy of randomization | No specific mention of allocation concealment except to say ‘double‐blinded’ Allocation concealment inadequate | No specific mention of who all were blinded; ‘double‐blinded’, placebo‐controlled trial Not sure whether blinding was adequate | One withdrawal from study reported | Moderate | |
| ‘Placebo controlled prospective study’; no randomization | None described | None described | Not described | Poor | |
| ‘Consented and were randomized’ | Not described | Not used | 3 participants (2, 1) not operated upon; 2 participants excluded from final analysis because of clinical management changes | Poor | |
| Randomization done by pharmacy trial co‐ordinator using a permitted block strategy | Allocation concealment using central randomization with drugs prepared by pharmacy | Quadruple‐blinded (participants, clinicians, data collectors and data analyst) placebo‐controlled study | Clearly accounted for (5 in intervention group and 2 in control group) | Good | |
| ‘Prospective randomized double‐blinded and placebo‐controlled study’ Computer‐generated random number tables | Not specifically described, but quite likely it was concealed allocation | Blinded manner; drug or saline supplied by the department investigational pharmacy in a blinded manner + additive for the CPB circuit prime (mannitol or saline, supplied similarly) | All allocated participants completed the trial (withdrawals before allocation) | Good | |
| ‘Randomized’; no details provided ‘Double‐blind, placebo‐controlled proof of concept trial’ | No details provided ‘Double‐blind, placebo‐controlled proof of concept trial’ | No details provided ‘Double‐blind, placebo‐controlled proof of concept trial’ | Four withdrawals from trial reported
| Poor | |
| Computer‐generated randomization method used | Computer allocation, no further details given | Not described except by the statement, ‘investigator blinded to the study group evaluated the postoperative data’ | Not reported | Moderate | |
| Randomization from a computer list, in an envelope | Sealed envelope used ‘All personnel and patients were blinded to the assignment’ | Blinded nurse, not involved with study, prepared the drug/ placebo in identical 50 mL filled syringes ‘All personnel and patients were blinded to the assignment’ | 1 participant | Good | |
| Allocated in a randomized double‐blind fashion to 2 groups No details on randomization method | Allocated in a randomized double‐blind fashion to 2 groups No description of allocation concealment | No details on blinding except ‘double‐blind fashion’ | Not given | Poor | |
| Allocated in a randomized double‐blind fashion to 2 groups No details on randomization method | Allocated in a randomized double‐blind fashion to 2 groups No description of allocation concealment | No details on blinding except ‘double‐blind fashion’ | Not given | Poor | |
|
| Participants with renal dysfunction (CCl < 50 mL/min) ‘Randomly divided into 3 groups’; no description of randomization | No description of allocation | No description of blinding | Not given | Poor |
| ‘Randomly allocated’ into 3 groups; no description of randomization | No description of allocation | No description of blinding | Not given | Poor | |
| ‘Randomized to either treatment group’ by pulling a card from a previously prepared deck | No description of allocation concealment | No details on blinding | Not given | Poor | |
| ‘Randomly allocated into infusion of dopamine or placebo’ by one of the authors, who was unaware of the treatment allocation
| ‘Randomly allocated into infusion of dopamine or placebo’ by one of the authors, who was unaware of the treatment allocation; no description of allocation concealment
| No blinding described | Not given | Poor | |
| Randomization and drug or placebo preparation provided by drug company; method not described, but likely to be good | Not sure of any allocation concealment, but likely possible | Possible, but blinded tables not described | 1 participant had additional drugs but was not excluded | Moderate | |
| Randomly allocated into 2 groups, randomization method not described | Allocation concealment not described | Blinding not mentioned | All participants accounted for in calculations | Poor | |
| ‘Randomly allocated into 3 groups’; method of randomization not described | ‘Randomly allocated into 3 groups’; method of allocation concealment not described | ‘Randomly allocated into 3 groups’; method of blinding not described | Dropouts not described | Poor | |
| ‘Randomly allocated into 3 groups’; method of randomization not described | ‘Randomly allocated into 3 groups’; method of allocation concealment not described | ‘Randomly allocated into 3 groups’; method of blinding not described | Dropouts not described | Poor | |
| Randomization done by the last digit of the medical record number of participant (quasi‐randomization) | ‘Patients were prospectively allocated into 2 groups’ No details given | Not given | Not given | Poor | |
| Retrospective chart review of a randomized trial in 2003, which used computer‐generated allocation list (randomly permuted blocks of random size) provided by department of Medical Statistics | Computer‐generated allocation list (randomly permuted blocks of random size) provided by department of Medical Statistics | Drugs supplied in identical looking glass vials containing drug or placebo | Exclusions described in text | Good | |
|
| ’Prospectively randomized’; no details of method of randomization | ’Prospectively randomized’; no details of method of allocation | ’Prospectively randomized’; no details of method of blinding | Fate of participants discussed | Poor |
| Random assignment of participants using Microsoft Excel‐based random number generation to create a randomization list, in blocks of 10 | Allocation concealment ensured by quadruple‐blinding (participants, clinicians, data collectors and data analysers were unaware of groups or treatment) | Quadruple‐blinding (participants, clinicians, data collectors and data analysers were blinded) | 0 participants | Good | |
| Microsoft Excel‐based random number generation, with blocks of 10; central randomization by department of pharmacy | Allocation concealment achieved by central randomization, blinding to all researchers, participants and others. Allocation revealed only after data analysis | Both fluids in separate shrink‐wrapped black plastic bags that were identical in appearance (blinded to participants, anaesthetists, surgeons, ICU personnel, nurses and others) | 1 in each group | Good | |
| ‘Random allocation used’; method not given | ‘Random allocation used’; method not given | ‘Random allocation used’; method not given | 1 participant excluded from the trial | Poor | |
| ‘Randomized’, but no details given | Allocated to control and intervention groups using opaque envelopes immediately before surgery; not sure whether allocation was maintained | No blinding | 1 died before operation (intervention group) | Poor | |
| Random assignment in blocks of 10 done by hospital pharmacy, no details given | Allocation done by hospital pharmacy Clinical and study personnel not aware of study allocation | Blinding quite likely, although not detailed in text | 1 participant withdrew from study intraoperatively (does not mention which group, although most likely the intervention group-1 less in that group) | Moderate | |
| Computer‐generated randomization done by statistician | Sequentially numbered, sealed envelopes
| SNP and saline in uniformly appearing 50 mL syringes, blinded to surgeons, perfusionists and nurses; investigators did not know the details | None | Good | |
| Randomization by computer | Not described in detail | Not described in detail | No detailed description | Poor | |
| Participants randomly assigned to receive 1 of 2 treatments | No details given | No details given | Early termination of study in 33 of 56 participants; ITT used | Poor | |
| Allocated into 2 groups in a double‐blinded random fashion; no details of randomization given | Allocated into 2 groups in a double‐blinded random fashion; no details of allocation given | Allocated into 2 groups in a double‐blinded random fashion; no details of blinding given | 2 participants excluded | Poor | |
| Placebo‐controlled randomized double‐blind trial; block randomization done and sealed envelopes used | Placebo‐controlled randomized double‐blind trial; block randomizations done with the use of sealed envelopes; no further details on allocation concealment provided | Placebo‐controlled randomized double‐blind trial; no other details of blinding provided | 3 participants excluded from analysis | Moderate | |
| ‘Recruited patients were allocated to one of 2 groups’; no details on randomization | ‘Recruited patients were allocated to one of 2 groups’; no details on allocation concealment | ‘Recruited patients were allocated to one of 2 groups’; no details on blinding provided | 2 participants accounted for | Poor | |
| 'Patients were allocated in a randomized double‐blind manner’; no details of randomization given | 'Patients were allocated in a randomized double‐blind manner’; no details of allocation concealment given | 'Patients were allocated in a randomized double‐blind manner’; no details of blinding given | 2 participants excluded from the trial | Poor | |
| ‘Randomized in a double‐blind fashion’; no details of randomization given | ‘Randomized in a double‐blind fashion’; no details of allocation given | ‘Randomized in a double‐blind fashion’; no details of blinding given | All participants completed the trial | Poor | |
| Used a 2:1 ratio in randomization process, participants randomly assigned into groups; no other details of randomization given | Participants randomly assigned into groups; no other details of allocation given | Participants randomly assigned into groups; no other details of blinding given | Not given | Poor | |
| ‘Patients were randomized into 2 groups’; not sure what method of randomization was used | Not sure how allocation was performed | ‘Blind infusion was performed’; not sure about blinding | None indicated | Poor | |
| Designed as a prospective double‐blind placebo‐controlled randomized trial; no other details of randomization provided | Prospective double‐blind placebo‐controlled randomized trial; no other details of allocation concealment provided | Prospective double‐blind placebo‐controlled randomized trial; no other details of blinding provided | All participants competed the trial | Poor | |
| ‘Patients were randomized’; no other details given | ‘Patients were randomized’; no other details given | ‘Patients were randomized’; no other details given | 2 participants excluded from analysis | Poor | |
| Randomly assigned with the use of a table of random numbers; ‘prospective double‐blind randomized trial’ | Coded 50 mL syringes from the pharmacy, with contents remaining unknown to investigators until the end of the trial; allocation concealed | Coded 50 mL syringes from the pharmacy, with contents remaining unknown to investigators until the end of the trial; blinded | 3 withdrawals before start of trial | Good | |
| ‘Prospective randomized trial’; no further details on randomization | ‘Prospective randomized trial’; no further details on allocation | ‘Prospective randomized trial’; no details on blinding | None reported | Poor | |
| ‘Patients were randomized’; no further details | No indication of allocation concealment, but for statement, ‘To prevent bias, surgeons, nurses, and lab technicians were blinded to patient assignment’ | Possible: ‘To prevent bias, surgeons, nurses, and lab technicians were blinded to patient assignment’ | None indicated in text | Poor | |
| ‘Prospective randomized study’; no further details on randomization given | ‘Prospective randomized study’; no further details on allocation | ‘Prospective randomized study’; no further details on blinding | 11 of 35 excluded | Poor | |
| ‘Patients were randomly allocated into 2 groups’; no further details on randomization | ‘Patients were randomly allocated into 2 groups’; no further details on allocation | ‘Patients were randomly allocated into 2 groups’; no further details on blinding | Not disclosed | Poor | |
| Randomization performed by aleatorized numbers prepared in closed envelopes | No details on concealment of allocation except ‘Randomization performed by aleatorized numbers prepared in closed envelopes’ | Drug or placebo given with an identical container in a double‐blind manner with the same volume of drug or saline | 4 participants excluded | Moderate | |
| Randomized, prospective, open‐label study Random number generated from a random number table | No concealment of assignment | No blinding | 4 excluded after randomization? | Poor | |
| Random assignment by the hospital pharmacy clinical trials co‐ordinator Microsoft Excel–based random number generator permuted block strategy with blocks of 10 | Allocation stratified into 2 groups based on pre‐op use of statins Allocation concealed to participants, anaesthetists, cardiac surgeons, intensive care specialists, bedside nurses and investigators | 'Double‐blind'. Atorvastatin or placebo medication prepared in capsules of identical appearance
| 8 in intervention group and 7 in control group | Good | |
| Random assignment into 2 groups; no further details | Random assignment into 2 groups; no further details | Random assignment into 2 groups; no further details; the anaesthesiologist was aware of the allocation and treatment received | No details provided | Poor | |
| ‘Randomly allocated in a double‐blinded manner; the hospital pharmacy performed the randomization and prepared the study medications’ | ‘Randomly allocated in a double‐blinded manner; the hospital pharmacy performed the randomization and prepared the study medications’, but no details of allocation concealment provided | ‘Randomly allocated in a double‐blinded manner; the hospital pharmacy performed the randomization and prepared the study medications’; no details of blinding provided | 3 participants excluded | Moderate | |
| ‘Patients were allocated in a randomized double‐blind fashion to 2 groups’; no further details of randomization given | ‘Patients were allocated in a randomized double‐blind fashion to 2 groups’; no further details of allocation given | ‘Patients were allocated in a randomized double‐blind fashion to 2 groups’; no further details of blinding given | No dropouts detailed in text | Poor | |
| ‘Randomly allocated to two groups receiving blind infusion of drug or placebo’; no other details on randomization method | ‘Randomly allocated to two groups receiving blind infusion of drug or placebo’; no other details on allocation method | ‘Randomly allocated to two groups receiving blind infusion of drug or placebo’; no other details on blinding | Not described, but study probably had no dropouts | Poor | |
| Randomly allocated into 2 groups by drawing lots | ‘Randomly allocated by drawing lots’ No other details | No evidence of blinding | No mention in the text | Poor | |
| Randomly allocated into 2 groups by lottery method | 'Randomly allocated into 2 groups'; no evidence of concealment of allocation | No blinding discussed | Dropouts discussed | Poor | |
| Participants were assigned by random number to 1 of 2 groups; no details on randomization given | Participants were assigned by random number to 1 of 2 groups; no details on concealment of allocation given | Participants assigned by random number to 1 of 2 groups; no details on blinding | No dropouts | Poor | |
| Participants randomly allocated to 1 of 2 groups with use of a computer‐generated randomization table | Participants randomly allocated to 1 of 2 groups with use of a computer‐generated randomization table; no further details on allocation concealment given | All medical personnel involved in the study blinded to the contents of the infusion bottle | No dropouts recorded | Moderate | |
| Block randomization developed by research centre Randomization stratified by serum creatinine levels | Allocation via Internet using predetermined randomization | Participants, healthcare clinicians and researchers blinded | None | Good | |
| Prospectively randomly assigned | No details on allocation provided in text | No details of blinding provided in text | No dropouts recorded | Poor | |
| Participants randomly assigned; no further details on randomization given | Participants randomly assigned; no further details on allocation given | 2 different types of procedures; no blinding possible | 5 participants subsequently excluded from trial | Poor | |
| ‘Patients were randomized’; no more details | ‘Patients were randomized’; no more details | No details provided | ‘There were no withdrawals’ | Poor | |
| Random assignment done with use of computer‐generated randomization list | Computer‐generated randomization list placed in sealed envelopes and opened in numerical order by a third party, who prepared the study infusion | Third party prepared the infusion. Infusions were such that volumes were equal in the bag and of identical colour, and contents of the bag were indistinguishable; the infusion was done over 30 minutes to avoid haemodynamic effects of treatment | Yes, none lost | Good | |
| Participants randomly assigned into 1 of 2 groups, according to the last digit of their clinical history number (quasi‐randomization) | No description of concealment of allocation | No report of blinding | All participants completed | Poor | |
| ‘Patients were randomly allocated into 4 equal groups’; no further details on randomization | Patients were randomly allocated into 4 equal groups’; no further details on allocation | No description of blinding | None described | Poor | |
| ‘Patients were randomly assigned’; no further details on randomization method used | ‘Patients were randomly assigned’; no further details on allocation method used | No description of blinding | None described | Poor | |
| ‘Patients were randomized’; no further details on method of randomization used | ‘Patients were randomized’; no details on method of allocation used | No details on blinding | One death described | Poor | |
| Participants were ‘randomized’ It appears that the anaesthesiologist ‘randomly drew an envelope with the assigned treatment’ | Allocation concealment was possible only for participants and the statistician | No; control received no treatment Participants and the statistician were blinded | Not described | Poor | |
| ‘Patients were randomized’; no further details on method of randomization used | ‘Patients were randomized’; no details on method of allocation used | No details on blinding | 8 participants excluded because of death or major complications | Poor | |
| ‘Patients were prospectively randomized’; no details on method of randomization used | ‘Patients were prospectively randomized’; no details on method of allocation used | No description of blinding | States no deaths; no description of dropouts | Poor | |
| ‘Patients randomized into 4 groups’; no further details on randomization given | ‘Patients randomized into 4 groups’; no description of allocation used | No description of blinding | No mortality described, but no suggestion of dropouts | Poor | |
| ‘Randomly assigned’; no further details of randomization given | ‘Randomly assigned’; no further details of allocation given | No blinding described | No dropouts described | Poor |
| Outcome or subgroup title | No. of studies | No. of participants | Statistical method | Effect size |
| 1 Mortality Show forest plot | 11 | 583 | Peto Odds Ratio (Peto, Fixed, 95% CI) | 1.50 [0.48, 4.73] |
| 2 Acute renal injury Show forest plot | 10 | 541 | Peto Odds Ratio (Peto, Fixed, 95% CI) | 1.36 [0.44, 4.23] |
| 3 Urine output Show forest plot | 13 | Mean Difference (IV, Random, 95% CI) | Subtotals only | |
| 3.1 24 hours (mL/min) | 13 | 670 | Mean Difference (IV, Random, 95% CI) | 0.18 [‐0.19, 0.54] |
| 3.2 2 to 4 days (mL/min) | 7 | 380 | Mean Difference (IV, Random, 95% CI) | 0.51 [0.04, 0.97] |
| 3.3 5 to 7 days (mL/min) | 4 | 103 | Mean Difference (IV, Random, 95% CI) | 0.23 [‐0.06, 0.51] |
| 4 Creatinine clearance Show forest plot | 15 | Mean Difference (IV, Random, 95% CI) | Subtotals only | |
| 4.1 24 hours (mL/min) | 14 | 616 | Mean Difference (IV, Random, 95% CI) | 7.17 [‐5.53, 19.86] |
| 4.2 2 to 4 days (mL/min) | 9 | 459 | Mean Difference (IV, Random, 95% CI) | 7.31 [‐6.19, 20.82] |
| 4.3 5 to 7 days (mL/min) | 5 | 115 | Mean Difference (IV, Random, 95% CI) | ‐3.33 [‐13.63, 6.98] |
| 5 Free water clearance Show forest plot | 6 | Mean Difference (IV, Random, 95% CI) | Subtotals only | |
| 5.1 24 hours (mL/min) | 6 | 166 | Mean Difference (IV, Random, 95% CI) | 0.03 [‐0.17, 0.22] |
| 6 Fractional excretion of sodium Show forest plot | 5 | Mean Difference (IV, Random, 95% CI) | Totals not selected | |
| 6.1 24 hours (%) | 5 | Mean Difference (IV, Random, 95% CI) | 0.0 [0.0, 0.0] | |
| 7 Renal plasma flow (24 hours) Show forest plot | 2 | 48 | Mean Difference (IV, Random, 95% CI) | 75.36 [‐63.27, 213.98] |
| Outcome or subgroup title | No. of studies | No. of participants | Statistical method | Effect size |
| 1 Mortality Show forest plot | 4 | 255 | Peto Odds Ratio (Peto, Fixed, 95% CI) | 2.49 [0.80, 7.74] |
| 2 Acute renal injury Show forest plot | 5 | 305 | Peto Odds Ratio (Peto, Fixed, 95% CI) | 2.39 [0.68, 8.47] |
| 3 Urine output Show forest plot | 4 | Mean Difference (IV, Random, 95% CI) | Subtotals only | |
| 3.1 24 hours (mL/min) | 4 | 141 | Mean Difference (IV, Random, 95% CI) | 0.10 [‐0.12, 0.33] |
| 3.2 2 to 4 days (mlL/min) | 2 | 89 | Mean Difference (IV, Random, 95% CI) | 0.15 [‐0.14, 0.45] |
| 4 Creatinine clearance Show forest plot | 4 | Mean Difference (IV, Random, 95% CI) | Subtotals only | |
| 4.1 24 hours (mL/min) | 3 | 123 | Mean Difference (IV, Random, 95% CI) | ‐18.02 [‐41.78, 5.75] |
| 4.2 2 to 4 days (mL/min) | 3 | 120 | Mean Difference (IV, Random, 95% CI) | 2.33 [‐14.76, 19.42] |
| Outcome or subgroup title | No. of studies | No. of participants | Statistical method | Effect size |
| 1 Mortality Show forest plot | 2 | 68 | Peto Odds Ratio (Peto, Fixed, 95% CI) | 0.0 [0.0, 0.0] |
| 2 Acute renal injury Show forest plot | 6 | 172 | Peto Odds Ratio (Peto, Fixed, 95% CI) | 0.11 [0.01, 1.17] |
| 3 Urine output Show forest plot | 4 | Mean Difference (IV, Fixed, 95% CI) | Subtotals only | |
| 3.1 Urine output: 24 hours (mL/min) | 4 | 170 | Mean Difference (IV, Fixed, 95% CI) | 0.23 [0.02, 0.45] |
| 4 Creatinine clearance Show forest plot | 5 | Mean Difference (IV, Random, 95% CI) | Subtotals only | |
| 4.1 24 hours (mL/min) | 5 | 251 | Mean Difference (IV, Random, 95% CI) | 4.74 [‐3.30, 12.77] |
| 4.2 2 to 4 days (mL/min) | 2 | 130 | Mean Difference (IV, Random, 95% CI) | 13.92 [‐24.62, 52.46] |
| 5 Free water clearance Show forest plot | 3 | Mean Difference (IV, Random, 95% CI) | Subtotals only | |
| 5.1 24 hours (mL/min) | 3 | 91 | Mean Difference (IV, Random, 95% CI) | ‐0.09 [‐0.47, 0.29] |
| Outcome or subgroup title | No. of studies | No. of participants | Statistical method | Effect size |
| 1 Mortality Show forest plot | 1 | 14 | Peto Odds Ratio (Peto, Fixed, 95% CI) | 7.39 [0.15, 372.38] |
| 2 Acute renal injury Show forest plot | 3 | 64 | Peto Odds Ratio (Peto, Fixed, 95% CI) | 0.0 [0.0, 0.0] |
| 3 Renal plasma flow Show forest plot | 3 | Mean Difference (IV, Random, 95% CI) | Subtotals only | |
| 3.1 RPF: end of operation (mL/min) | 3 | 62 | Mean Difference (IV, Random, 95% CI) | 46.37 [‐68.61, 161.34] |
| Outcome or subgroup title | No. of studies | No. of participants | Statistical method | Effect size |
| 1 Mortality Show forest plot | 3 | 825 | Peto Odds Ratio (Peto, Fixed, 95% CI) | 0.52 [0.19, 1.44] |
| 2 Acute renal injury Show forest plot | 4 | 865 | Peto Odds Ratio (Peto, Fixed, 95% CI) | 0.23 [0.08, 0.64] |
| 3 Urine output at 24 hours Show forest plot | 3 | 584 | Mean Difference (IV, Random, 95% CI) | 0.42 [0.18, 0.67] |
| 4 Creatinine clearance, 24 hours Show forest plot | 5 | 905 | Mean Difference (IV, Random, 95% CI) | 35.23 [‐0.48, 70.94] |
| 5 Creatinine clearance, 2 to 3 days Show forest plot | 5 | 905 | Mean Difference (IV, Random, 95% CI) | 27.30 [4.36, 50.23] |
| Outcome or subgroup title | No. of studies | No. of participants | Statistical method | Effect size |
| 1 Mortality Show forest plot | 6 | 641 | Peto Odds Ratio (Peto, Fixed, 95% CI) | 1.01 [0.42, 2.42] |
| 2 Acute renal injury Show forest plot | 5 | 601 | Peto Odds Ratio (Peto, Fixed, 95% CI) | 0.91 [0.32, 2.62] |
| 3 Urine output, 24 hours Show forest plot | 2 | 146 | Mean Difference (IV, Random, 95% CI) | 0.18 [‐0.24, 0.60] |
| Outcome or subgroup title | No. of studies | No. of participants | Statistical method | Effect size |
| 1 Mortality Show forest plot | 1 | 71 | Peto Odds Ratio (Peto, Fixed, 95% CI) | 0.13 [0.00, 6.63] |
| 2 Acute renal injury Show forest plot | 1 | 71 | Peto Odds Ratio (Peto, Fixed, 95% CI) | 0.0 [0.0, 0.0] |
| 3 Urine output: 24 hours Show forest plot | 1 | 71 | Mean Difference (IV, Random, 95% CI) | ‐0.13 [‐0.47, 0.21] |
| 4 Urine output: 2 to 3 days Show forest plot | 1 | 71 | Mean Difference (IV, Random, 95% CI) | ‐0.19 [‐0.56, 0.18] |
| 5 Urine output: 5 to 7 days Show forest plot | 1 | 71 | Mean Difference (IV, Random, 95% CI) | ‐0.14 [‐0.50, 0.22] |
| Outcome or subgroup title | No. of studies | No. of participants | Statistical method | Effect size |
| 1 Mortality Show forest plot | 4 | 152 | Peto Odds Ratio (Peto, Fixed, 95% CI) | 0.75 [0.16, 3.42] |
| 2 Acute renal injury Show forest plot | 3 | 123 | Peto Odds Ratio (Peto, Fixed, 95% CI) | 0.22 [0.05, 0.96] |
| 3 Creatinine clearance Show forest plot | 2 | Mean Difference (IV, Random, 95% CI) | Subtotals only | |
| 3.1 24 hours (mL/min) | 2 | 77 | Mean Difference (IV, Random, 95% CI) | ‐10.34 [‐29.57, 8.88] |
| Outcome or subgroup title | No. of studies | No. of participants | Statistical method | Effect size |
| 1 Mortality Show forest plot | 26 | 2390 | Peto Odds Ratio (Peto, Fixed, 95% CI) | 0.96 [0.56, 1.64] |
| 2 Acute renal injury Show forest plot | 31 | 2504 | Peto Odds Ratio (Peto, Fixed, 95% CI) | 0.55 [0.32, 0.92] |
| 3 Urine output Show forest plot | 19 | Mean Difference (IV, Random, 95% CI) | Subtotals only | |
| 3.1 24 hours (mL/min) | 17 | 1475 | Mean Difference (IV, Random, 95% CI) | 0.26 [0.17, 0.36] |
| 3.2 2 to 3 days (mL/min) | 9 | 1058 | Mean Difference (IV, Random, 95% CI) | 0.21 [‐0.13, 0.54] |
| 4 Creatinine clearance Show forest plot | 27 | Mean Difference (IV, Random, 95% CI) | Subtotals only | |
| 4.1 24 hours (mL/min) | 24 | 2136 | Mean Difference (IV, Random, 95% CI) | 9.38 [‐5.99, 24.74] |
| 4.2 2 to 3 days (mL/min) | 17 | 1844 | Mean Difference (IV, Random, 95% CI) | 14.21 [3.58, 24.85] |
| 4.3 5 to 7 days (mL/min) | 7 | 949 | Mean Difference (IV, Random, 95% CI) | 14.99 [0.84, 29.13] |
| 5 Free water clearance Show forest plot | 8 | Mean Difference (IV, Random, 95% CI) | Subtotals only | |
| 5.1 24 hours (mL/min) | 7 | 700 | Mean Difference (IV, Random, 95% CI) | ‐0.02 [‐0.22, 0.19] |
| 5.2 2 to 3 days (mL/min) | 4 | 591 | Mean Difference (IV, Random, 95% CI) | ‐0.29 [‐0.30, ‐0.28] |
| 6 Fractional excretion of sodium Show forest plot | 9 | Mean Difference (IV, Random, 95% CI) | Totals not selected | |
| 6.1 24 hours (%) | 8 | Mean Difference (IV, Random, 95% CI) | 0.0 [0.0, 0.0] | |
| 6.2 2 to 4 days (%) | 3 | Mean Difference (IV, Random, 95% CI) | 0.0 [0.0, 0.0] | |
| Outcome or subgroup title | No. of studies | No. of participants | Statistical method | Effect size |
| 1 Mortality Show forest plot | 8 | 236 | Peto Odds Ratio (Peto, Fixed, 95% CI) | 0.76 [0.20, 2.89] |
| 2 Acute renal injury Show forest plot | 8 | 284 | Peto Odds Ratio (Peto, Fixed, 95% CI) | 0.62 [0.11, 3.70] |
| 3 Urine output Show forest plot | 7 | Mean Difference (IV, Random, 95% CI) | Subtotals only | |
| 3.1 24 hours (mL/min) | 7 | 227 | Mean Difference (IV, Random, 95% CI) | 0.04 [‐0.10, 0.19] |
| 3.2 2 to 3 days (mL/min) | 3 | 95 | Mean Difference (IV, Random, 95% CI) | 0.26 [‐0.06, 0.58] |
| 3.3 5 to 7 days (mL/min) | 2 | 55 | Mean Difference (IV, Random, 95% CI) | ‐0.09 [‐0.39, 0.21] |
| 4 Creatinine clearance Show forest plot | 9 | Mean Difference (IV, Random, 95% CI) | Subtotals only | |
| 4.1 24 hours (mL/min) | 9 | 323 | Mean Difference (IV, Random, 95% CI) | 7.99 [‐0.77, 16.74] |
| 4.2 2 to 3 days (mL/min) | 5 | 195 | Mean Difference (IV, Random, 95% CI) | 11.62 [‐6.13, 29.37] |
| 4.3 5 to 7 days (mL/min) | 4 | 116 | Mean Difference (IV, Random, 95% CI) | ‐12.85 [‐26.41, 0.72] |
| 5 Free water clearance Show forest plot | 5 | Mean Difference (IV, Random, 95% CI) | Subtotals only | |
| 5.1 24 hours (mL/min) | 5 | 154 | Mean Difference (IV, Random, 95% CI) | ‐0.25 [‐0.51, 0.01] |
| 5.2 2 to 4 days (mL/min) | 2 | 85 | Mean Difference (IV, Random, 95% CI) | 0.37 [‐0.12, 0.85] |
| 5.3 5 to 7 days (mL/min) | 2 | 85 | Mean Difference (IV, Random, 95% CI) | 0.24 [‐0.13, 0.61] |
| 6 Fractional excretion of sodium Show forest plot | 5 | Mean Difference (IV, Random, 95% CI) | Totals not selected | |
| 6.1 24 hours (%) | 5 | Mean Difference (IV, Random, 95% CI) | 0.0 [0.0, 0.0] | |
| 6.2 2 to 4 days (%) | 2 | Mean Difference (IV, Random, 95% CI) | 0.0 [0.0, 0.0] | |
| 7 Renal plasma flow Show forest plot | 4 | Mean Difference (IV, Random, 95% CI) | Subtotals only | |
| 7.1 End of operation (mL/min) | 2 | 44 | Mean Difference (IV, Random, 95% CI) | 50.29 [‐92.83, 193.40] |
| 7.2 24 hours (mL/min) | 2 | 47 | Mean Difference (IV, Random, 95% CI) | 45.86 [‐18.64, 110.36] |
| Outcome or subgroup title | No. of studies | No. of participants | Statistical method | Effect size |
| 1 Urine output Show forest plot | 2 | Mean Difference (IV, Random, 95% CI) | Subtotals only | |
| 1.1 Urine output: 24 hours (mL/min) | 2 | 43 | Mean Difference (IV, Random, 95% CI) | ‐0.59 [‐0.99, ‐0.19] |
| 1.2 Urine output: 2 to 4 days (mL/min) | 2 | 43 | Mean Difference (IV, Random, 95% CI) | 0.24 [‐0.22, 0.69] |
| 1.3 Urine output: 5 to 7 days (mL/min) | 2 | 43 | Mean Difference (IV, Random, 95% CI) | 0.23 [0.09, 0.37] |
| 2 Creatinine clearance Show forest plot | 4 | Mean Difference (IV, Random, 95% CI) | Subtotals only | |
| 2.1 24 hours (mL/min) | 3 | 83 | Mean Difference (IV, Random, 95% CI) | ‐2.84 [‐14.07, 8.39] |
| 2.2 2 to 4 days (mL/min) | 3 | 74 | Mean Difference (IV, Random, 95% CI) | 0.42 [‐16.68, 17.52] |
| 2.3 5 to 7 days (mL/min) | 2 | 43 | Mean Difference (IV, Random, 95% CI) | 0.58 [‐16.43, 17.60] |
| Outcome or subgroup title | No. of studies | No. of participants | Statistical method | Effect size |
| 1 Mortality Show forest plot | 10 | 959 | Peto Odds Ratio (Peto, Fixed, 95% CI) | 0.74 [0.36, 1.52] |
| 2 Acute renal injury Show forest plot | 11 | 979 | Peto Odds Ratio (Peto, Fixed, 95% CI) | 0.40 [0.22, 0.76] |
| 3 Urine output Show forest plot | 4 | 707 | Mean Difference (IV, Random, 95% CI) | 0.35 [‐0.16, 0.85] |
| 3.1 Urine output, 24 hours | 4 | 416 | Mean Difference (IV, Random, 95% CI) | 0.35 [‐0.12, 0.81] |
| 3.2 Urine output, 2 to 3 days | 2 | 291 | Mean Difference (IV, Random, 95% CI) | 0.43 [‐0.78, 1.65] |
| 4 Creatinine clearance Show forest plot | 4 | 646 | Mean Difference (IV, Random, 95% CI) | 10.65 [0.04, 21.27] |
| 4.1 Creatinine clearance, 24 hours | 4 | 347 | Mean Difference (IV, Random, 95% CI) | 7.78 [‐10.39, 25.94] |
| 4.2 Creatinine clearance, 2 to 3 days | 3 | 299 | Mean Difference (IV, Random, 95% CI) | 14.16 [‐6.20, 34.52] |
| Outcome or subgroup title | No. of studies | No. of participants | Statistical method | Effect size |
| 1 Reported mortality, low risk of bias studies only Show forest plot | 19 | 1604 | Peto Odds Ratio (Peto, Fixed, 95% CI) | 1.01 [0.52, 1.97] |
| 2 Acute renal injury, requiring dialysis, low risk of bias studies only Show forest plot | 16 | 1550 | Peto Odds Ratio (Peto, Fixed, 95% CI) | 1.05 [0.55, 2.03] |
| 3 Urine output at 24 hours, low risk of bias studies only Show forest plot | 11 | 798 | Mean Difference (IV, Random, 95% CI) | 0.20 [‐0.04, 0.44] |
| 4 Creatinine clearance at 24 hours, low risk of bias studies only Show forest plot | 9 | 817 | Mean Difference (IV, Random, 95% CI) | 6.59 [‐3.53, 16.72] |