Fluticasona en diferentes dosis para el asma crónica en adultos y niños
Referencias
References to studies included in this review
References to studies excluded from this review
References to studies awaiting assessment
Additional references
Characteristics of studies
Characteristics of included studies [ordered by study ID]
Ir a:
| Methods | Setting: Denmark, paediatric outpatient clinic Design: crossover, 2 week washout Length of intervention period: 2 weeks Randomisation: yes, computer generated random sequence with balanced blocks Masking: double‐blind Excluded: stated (none) Withdrawals: stated (one child from low dose group due to sore throat) Baseline characteristics: comparable between groups Jadad score: 5 | |
| Participants | 48 children: 27M 21F Age range: 6‐12 years Inclusion criteria: Pre‐pubertal children 'Mild' asthma requiring treatment with as needed beta2 agonists only Exclusion criteria: Inhaled or oral steroid use in last 2 months | |
| Interventions | 1. FP 200mcg/d 2. FP 400mcg/d Delivery device: Accuhaler DPI | |
| Outcomes | FEV1 Morning PEFR Evening PEFR Daily asthma symptom score Daily use of beta2agonist 24 hour urinary cortisol excretion Growth by lower leg knemometry | |
| Notes | Patients also received BUD and placebo in a randomised fashion: results not considered in this review | |
| Risk of bias | ||
| Bias | Authors' judgement | Support for judgement |
| Adequate sequence generation? | Low risk | Computer generated random sequence with balanced blocks |
| Allocation concealment? | Low risk | See Appendix 2 |
| Blinding? | Low risk | Identical inhaler devices |
| Methods | Setting: multicentre study USA, paediatric outpatient clinic | |
| Participants | 344 children enrolled, 325 randomised: 81M 244F Age range: M 4‐11 years, F 4‐9 years ) Inclusion criteria: Pre‐pubescent children with mild to moderate asthma (ATS criteria 1987) for at least 3 months FEV1 60 (% predicted) or greater Exclusion criteria: Systemic, intra‐nasal or opthalmic corticosteroids in last month More than 60 days of systemic corticosteroid use in last 2 years | |
| Interventions | 1. FP 50 mcg 2xdaily (100 mcg/d) 2. FP 100 mcg 2xdaily (200 mcg/d) Delivery device: Diskhaler DPI | |
| Outcomes | Height assessment | |
| Notes | Authors confirmed use of allocation concealment Criteria for withdrawal due to lack of efficacy: requirement for more than two seven day courses of oral corticosteroid Placebo treatment arm also included: results not considered in this review Data available from www.clinicalstudyresults.org | |
| Risk of bias | ||
| Bias | Authors' judgement | Support for judgement |
| Adequate sequence generation? | Low risk | See Appendix 2 |
| Allocation concealment? | Low risk | Randomisation code generated off site and concealed using sealed envelopes |
| Blinding? | Low risk | Double blind; identical inhaler devices |
| Methods | Randomised, double‐blind parallel group trial. Withdrawals: not stated. Jadad score: 2 | |
| Participants | N = 111. Distribution between groups not clear. Mean FEV1: 61% Inclusion criteria: adolescent/adult asthmatics; OCS dependent Exclusion criteria: not clear | |
| Interventions | i) FP 1000mcg BiD (2000); ii) FP500mcg BiD (1000); iii) Placebo. Inhaler device: Diskus. Study duration: 52 weeks. | |
| Outcomes | Steroid consumption; lung function; adverse events | |
| Notes | Conference abstract | |
| Risk of bias | ||
| Bias | Authors' judgement | Support for judgement |
| Adequate sequence generation? | Unclear risk | Described as randomised; no other information available |
| Allocation concealment? | Unclear risk | Information not available |
| Blinding? | Low risk | Double blind; identical inhaler devices |
| Methods | Setting: multicentre study worldwide, hospital outpatient clinics | |
| Participants | 862 adults enrolled, 671 randomised | |
| Interventions | 1. FP 125 mcg 4 puffs 2xdaily (1000 mcg/d) 2. FP 250 mcg 4 puffs 2xdaily (2000 mcg/d) Delivery device: MDI +/‐ spacer | |
| Outcomes | Outcomes reported as change compared to baseline: FEV1 Biochemical markers of bone turnover | |
| Notes | Details concerning randomisation method provided by Glaxo Wellcome 12.5% of patients randomised to FP treatment arms receiving oral prednisolone (< 10mg/d) at the time of enrolment. No attempt was made to reduce dose in these patients Patients were given the option of using spacer device BUD treatment arm also included: results not considered in this review | |
| Risk of bias | ||
| Bias | Authors' judgement | Support for judgement |
| Adequate sequence generation? | Low risk | Computer generated random sequence |
| Allocation concealment? | Low risk | Central coding by pharmaceutical company sponsor) |
| Blinding? | Low risk | Double blind; identical inhaler devices |
| Methods | Setting: multicentre study Europe and New Zealand | |
| Participants | 89 children | |
| Interventions | 1. FP 200 mcg/d 2. FP 400 mcg/d Delivery device: no details | |
| Outcomes | Methacholine BHR (PC20 FEV1) | |
| Notes | Study presented in abstract form only | |
| Risk of bias | ||
| Bias | Authors' judgement | Support for judgement |
| Adequate sequence generation? | Unclear risk | Described as randomised; no other information available |
| Allocation concealment? | Unclear risk | Information not available |
| Blinding? | Unclear risk | Information not available |
| Methods | Randomised, double‐blind parallel group trial. Method of randomisation: not reported Withdrawals: not stated Jadad score: 2 | |
| Participants | N=19 (FP500: N: 10; FP100: N: 9) | |
| Interventions | FP100 v FP500. Inhaler device not specified. Study duration: 24 weeks. Inhaler device: unclear. | |
| Outcomes | FEV1; PD20; am/pm PEF; ß‐2 agonist use; symptoms; blood eosinophils; sputum cell count; | |
| Notes | Conference abstract | |
| Risk of bias | ||
| Bias | Authors' judgement | Support for judgement |
| Adequate sequence generation? | Unclear risk | Described as randomised; no other information available |
| Allocation concealment? | Unclear risk | Information not available |
| Blinding? | Unclear risk | Information not available |
| Methods | Multicentre, single‐blind, randomised open label controlled trial. Method of randomisation not reported. Open label study with exception of flunisolide and placebo treatment groups. Withdrawals not described. Jadad score: 1 | |
| Participants | N=78 (PLA: 15; FP110: 14; FP220: 12; FP330: 20; FP440: 17); Mean age (SD): PLA: 31.5 (10.09); FP110: 36.1 (8.70); FP220: 32.2 (8.66); FP330: 29.1 (8.66); FP440: 29.4 (10.20); M/F (%): PLA: 47/53; FP110: 57/43; FP220: 50/50; FP330: 40/60; FP440: 35/65; Mean FEV1 (SD): PLA: 3.0 (0.66); FP110: 3.3 (0.86); FP220: 3.2 (0.67); FP330: 3.0 (0.69); FP440: 3.2 (0.77) Inclusion criteria: non‐smokers; 18‐50 years; diagnosis of persistent mild to moderate asthma confirmed within previous 12 months by response to SABA (increase in FEV1 >/= 12%)/methacholine challenge <8mg/mL); FEV1 >/=65% predicted; no OCS/nasal/ICS use in previous 6 months Exclusion criteria: significant pulmonary disease (e.g. COPD); exacerbation within 6 weeks; URTI within 30 days screening; oestrogen usage; current condition that might confound data interpretation | |
| Interventions | PLA versus FP220 versus FP440 versus FP660 versus FP880 . Study duration: 3 weeks. Inhaler device: pMDI | |
| Outcomes | HPA function | |
| Notes | ||
| Risk of bias | ||
| Bias | Authors' judgement | Support for judgement |
| Adequate sequence generation? | Unclear risk | Described as randomised; no other information available |
| Allocation concealment? | Unclear risk | Information not available |
| Blinding? | Low risk | Identical inhaler devices |
| Methods | Setting: multicentre study USA, hospital outpatient clinic | |
| Participants | 331 adults Mean age: 48‐59 years Inclusion criteria: Mild to moderate asthma (as defined by the Committee on Diagnositic standards for Non‐Tuberculous Respiratory Diseases 1962) Treatment with BDP for at least 1 month prior to study and daily beta2 agonist, or daily theophylline for at least 2 weeks prior to study FEV1 60‐90 (% predicted) Exclusion criteria: Not stated | |
| Interventions | 1. FP 50 mcg 2xdaily (100 mcg/d) 2. FP 100 mcg 2xdaily (200mcg/d) 3. FP 500 mcg 2xdaily (1000 mcg/d) Delivery device: MDI | |
| Outcomes | Probability of remaining in study All outcomes expressed as change compared to baseline: Physician‐rated global assessment of efficacy | |
| Notes | No reply from author to clarify details of randomisation method For continuous outcomes change scores from baseline to endpoint (i.e. point of withdrawal) were reported A priori criteria for withdrawal due to lack of efficacy were established based on FEV1, morning PEFR, night‐time awakenings or clinical exacerbation requiring emergency hospital treatment Placebo treatment arm also included: results not considered in this review | |
| Risk of bias | ||
| Bias | Authors' judgement | Support for judgement |
| Adequate sequence generation? | Low risk | See Appendix 2 |
| Allocation concealment? | Low risk | See Appendix 2 |
| Blinding? | Low risk | Identical inhaler devices |
| Methods | Randomised, double‐blind, parallel group trial. Method of randomisation: not reported. Withdrawals: 12. Non‐ITT Jadad score: 3 | |
| Participants | N=30 randomised. Data only presented on those completing the study. FP100: N=8; FP1000: N=8. Mean age (SD): FP100: 28 (8); FP1000: 26 (8); Atopic (%): 100/100; Mean duration of asthma (years): FP100: 11 (7); FP1000: 13 (9); Mean FEV1 (% predicted): FP100: 100 (SD 18); FP1000: 110 (22); Asthma severity score: FP100: 7 (2); FP1000: 6 (2). Inclusion criteria: mild to moderate asthma; well‐documented history of asthma; baseline FEV1>70% predicted Exclusion criteria: exacerbations within 2 months; CS within 6 months of study; free from respiratory infections in 4 weeks prior to study | |
| Interventions | FP100 (BID) versus FP500 (BID). Inhaler device: pMDI + spacer. Study duration: 6 weeks | |
| Outcomes | PD20; FEV1; Mast cells; eosinophils; vessels; membrane thickness; vascular area | |
| Notes | High attrition rate | |
| Risk of bias | ||
| Bias | Authors' judgement | Support for judgement |
| Adequate sequence generation? | Unclear risk | Described as randomised; no other information available |
| Allocation concealment? | Unclear risk | Information not available |
| Blinding? | Low risk | Identical inhaler devices |
| Methods | Setting: world‐wide multicentre study, hospital outpatient clinic Design: parallel group Length of intervention period: 4 weeks Randomisation: yes, computer generated sequence Allocation concealment: yes (central coding by pharmaceutical company sponsors) Masking: double blind Excluded: not stated Withdrawals: stated Baseline characteristics: comparable Jadad score: 4 | |
| Participants | 825 adults: 297M 528F Age range: 17‐74 years Inclusion criteria: Adults with moderately severe chronic asthma requiring BDP 1000 mcg/d or less. During run‐in period: Daytime or night‐time symptoms during at least 4 days or: Diurnal variation in PEFR of 20% or more Exclusion criteria: Systemic steroids within the last month Serious concurrent disease Baseline asthma control: See inclusion criteria | |
| Interventions | 1. FP 100 mcg/d 2. FP 200 mcg/d 3. FP 400 mcg/d 4. FP 800 mcg/d Delivery device: MDI | |
| Outcomes | Change in morning PEFR compared to baseline | |
| Notes | Details of randomisation method and SD values for FEV1 (% predicted) provided by Glaxo Wellcome A BDP treatment arm also included: results not considered in this review | |
| Risk of bias | ||
| Bias | Authors' judgement | Support for judgement |
| Adequate sequence generation? | Low risk | See Appendix 2 |
| Allocation concealment? | Low risk | See Appendix 2 |
| Blinding? | Low risk | Identical inhaler devices |
| Methods | Randomised, crossover double‐blind, placebo controlled trial. Withdrawals stated. Non‐ITT. Jadad score: 3 | |
| Participants | N = 23. 8F; Mean age: 33 (19‐57); FEV1: 2.95 (SD 0.83) (FEV1 % predicted: 80.0 (SD 21.4)); Mean FVC: 4.42 L (SD 0.94). Inclusion criteria: either sex; 18‐60 years of age; ATS defined asthma; >/=40% predicted value; Either post‐BD increase in FEV1 of at least 200ml or >/=12% of baseline, OR diurnal variation of PEF >/=15% on at least 2 days/week during run‐in. Exclusion criteria: Exacerbation 4 weeks before inclusion; use of oral steroids within 4 weeks; use of ICS within 6 months; other systemic steroids within 4 weeks. | |
| Interventions | FP 200mcg; FP 1000mcg; BUD: 200mcg; BUD 800mcg; Placebo administered over 1 week. Inhaler device: DPI Concomitant therapy: IP, xanthines, sodium cromoglycate permitted provided doses kept at constant level 4 weeks prior to inclusion | |
| Outcomes | FEV1; PEFR; Serum cortisol; White blood cell count; Neutrophils; Basophils | |
| Notes | Data reported for effects after 24hours @ 1 week | |
| Risk of bias | ||
| Bias | Authors' judgement | Support for judgement |
| Adequate sequence generation? | Unclear risk | Described as randomised; other information not available |
| Allocation concealment? | Unclear risk | Information not available |
| Blinding? | Low risk | Identical inhaler devices |
| Methods | Randomised double‐blind placebo‐controlled double dummy crossover trial. Jadad score: 2 | |
| Participants | N=25 | |
| Interventions | FP500 versus FP1000 versus PLA; washout period: 3 weeks. Study duration: 6 treatment periods unclear duration . Inhaler device: unclear | |
| Outcomes | Cortisol suppression; PC20 | |
| Notes | Conference abstract | |
| Risk of bias | ||
| Bias | Authors' judgement | Support for judgement |
| Adequate sequence generation? | Unclear risk | Described as randomised; other information not available |
| Allocation concealment? | Unclear risk | Information not available |
| Blinding? | Unclear risk | Information not available |
| Methods | Randomised, double‐blind, parallel group study, Non‐ITT. Jadad score 3. | |
| Participants | N randomised = 232 (230 evaluable: FP 100mcg: 78; FP 500mcg: 79; Placebo: 73); Mean age 38 years; Participants suffered from mild‐to‐moderate asthma Inclusion criteria: Mild‐to‐moderate asthma (defined as FEV1 50‐80%) Exclusion criteria: Not stated | |
| Interventions | 1) FP 100mcg | |
| Outcomes | Plasma concentrations | |
| Notes | Data taken only for study 1. Study 2 assessed equal dose of FP given via different inhalers | |
| Risk of bias | ||
| Bias | Authors' judgement | Support for judgement |
| Adequate sequence generation? | Unclear risk | Described as randomised; other information not available |
| Allocation concealment? | Unclear risk | Information not available |
| Blinding? | Low risk | Identical inhaler devices |
| Methods | Setting: multicentre study in USA | |
| Participants | N = 182. Mean age: 37‐39. Inclusion criteria: >12 years; ATS‐defined asthma; FEV1 >/=45% predicted; able to use MDI Exclusion criteria: History of life threatening asthma; systemic steroids within 6 months of study entry; immunosuppressive agents prior to study entry | |
| Interventions | Run‐in period: 1‐2 weeks 1) FP HFA 220mcg bid (440mcg/d) 2) FPHFA 440mcg bid (880mcg/d) Inhaler device: MDI | |
| Outcomes | Withdrawals | |
| Notes | Unpublished study downloaded from www.clinicalstudyresults.org | |
| Risk of bias | ||
| Bias | Authors' judgement | Support for judgement |
| Adequate sequence generation? | Low risk | See Appendix 2 |
| Allocation concealment? | Low risk | See Appendix 2 |
| Blinding? | Low risk | Identical inhaler devices |
| Methods | Setting: multicentre study in Italy | |
| Participants | 33 participants. Mean age 37‐44 years. Inclusion criteria: M/F participants; age 18‐60 years; persistent mild‐moderate asthma (ATS). Exclusion criteria: Preventer medication 4 weeks prior to study entry. | |
| Interventions | Run‐in period: 2 weeks i) FP100mcg bid (200mcg/d) ii) FP500mcg bid (1000mcg/d) iii) Placebo Inhaler device: DPI | |
| Outcomes | Withdrawals; FEV1; PEFR; FVC | |
| Notes | Unpublished study downloaded from www.clinicalstudyresults.org | |
| Risk of bias | ||
| Bias | Authors' judgement | Support for judgement |
| Adequate sequence generation? | Low risk | See Appendix 2 |
| Allocation concealment? | Low risk | See Appendix 2 |
| Blinding? | Low risk | Identical inhaler devices |
| Methods | Setting: multicentre study in Belgium, Netherlands, Germany, Switzerland | |
| Participants | 110 participants ‐ age not reported | |
| Interventions | i) FP 50mcg/d ii) FP 100mcg/d iii) FP 200mcg/d iv) BDP 100mcg/d v) BDP 200mcg/d Inhaler device: MDI | |
| Outcomes | Withdrawals; am & pm PEF; symptoms; adverse events | |
| Notes | Unpublished study | |
| Risk of bias | ||
| Bias | Authors' judgement | Support for judgement |
| Adequate sequence generation? | Low risk | See Appendix 2 |
| Allocation concealment? | Low risk | See Appendix 2 |
| Blinding? | Low risk | Identical inhaler devices |
| Methods | As Above | |
| Participants | As above | |
| Interventions | As above | |
| Outcomes | As above | |
| Notes | Unpublished study | |
| Risk of bias | ||
| Bias | Authors' judgement | Support for judgement |
| Adequate sequence generation? | Low risk | As for FLIP01 |
| Allocation concealment? | Low risk | As for FLIP01 |
| Blinding? | Low risk | As for FLIP01 |
| Methods | Setting: multicentre study in Europe | |
| Participants | 196 children. Median age: 10 (6‐17) Inclusion criteria: 6‐16 years of age; established history of childhood asthma; perennial symptoms requiring treatment with up to 400mcg/d ICS; history of recurrent episode of bronchoconstriction or cough; and >/=10% reversibility in FEV1 post‐SABA; Prior to randomisation, participants were required to show two fo the following in last 12 days of run‐in period: mean of 4 lowest PEFR </=85% predicted or mean PEFR </=95% predicted; ii) diurnal variation in PEFR at least 20% on >/=4 days; iii) asthma symptoms on >/=4 days; iv) bronchodilator use on at least 2 of 4 days. Exclusion criteria: systemic CS in previous 4 weeks/run‐in or on >3 times in last 6 months; acute lower RTI in last 14 days that would affect baseline lung function/symptoms | |
| Interventions | 2 week run‐in period (200mcg/d BDP) followed by randomisation to: 1. FP 50mcg BID (100mcg/d) 2. FP 100mcg BID (200mcg/d) Inhaler device: DPI | |
| Outcomes | am PEF | |
| Notes | Sourced from http://ctr.gsk.co.uk | |
| Risk of bias | ||
| Bias | Authors' judgement | Support for judgement |
| Adequate sequence generation? | Low risk | See Appendix 2 |
| Allocation concealment? | Low risk | See Appendix 2 |
| Blinding? | Low risk | Identical inhaler devices |
| Methods | Setting: 21 centres in USA | |
| Participants | 379 adults and adolescents. | |
| Interventions | 1. FP 100mcg BID (without spacer) 2. FP250mcg BID (with spacer) 3. FP250mcg BID (without spacer) 4. Placebo (with or without spacer) Inhaler device: MDI | |
| Outcomes | FEV1; am PEF; pm PEF; withdrawals; SABA usage; symptoms; adverse events; withdrawals | |
| Notes | Sourced from http://ctr.gsk.co.uk | |
| Risk of bias | ||
| Bias | Authors' judgement | Support for judgement |
| Adequate sequence generation? | Low risk | See Appendix 2 |
| Allocation concealment? | Low risk | See Appendix 2 |
| Blinding? | Low risk | Identical inhaler devices |
| Methods | Setting: 25 centres in USA | |
| Participants | 191 adults and adolescents Inclusion criteria: >/=12 years; 6 month history of asthma requiring pharmacotherapy; FEV1 50‐85%; use of SABA and/or ICS; pre‐BD FEV1% predicted 60‐90%; SABA prn or regular use only; effective use of MDI. Exclusion criteria: ICS within 30 days of screening; hospitalisation due to asthma on 2+ occasions in 12 months prior to screening; significant other medication within 30 days of screening | |
| Interventions | 1. HFA‐FP 110mcg BID 2. HFA‐FP 220mcg BID 3. CFC‐FP 110mcg BID 4. CFC‐FP 220mcg BID 5. Placebo Inhaler device: MDI | |
| Outcomes | FEV1; am PEF; pm PEF; withdrawals; symptoms; rescue medication usage; adverse events | |
| Notes | Sourced from www.clinicalstudyresults.org | |
| Risk of bias | ||
| Bias | Authors' judgement | Support for judgement |
| Adequate sequence generation? | Low risk | See Appendix 2 |
| Allocation concealment? | Low risk | See Appendix 2 |
| Blinding? | Low risk | Identical inhaler devices |
| Methods | As above | |
| Participants | As above | |
| Interventions | As above | |
| Outcomes | As above | |
| Notes | As above | |
| Risk of bias | ||
| Bias | Authors' judgement | Support for judgement |
| Adequate sequence generation? | Low risk | As for FLTA3020 |
| Allocation concealment? | Low risk | As for FLTA3020 |
| Blinding? | Low risk | As for FLTA3020 |
| Methods | Setting: 39 centres in USA | |
| Participants | 168 adolescents/adults: 78M/90F Age range: >12 (mean age: 50 years) | |
| Interventions | 1. FP440mcg CFC bid 2. FP880mcg CFC bid 3. FP440mcg HFA bid 4. FP880mcg HFA bid 5. Placebo Inhaler device: MDI | |
| Outcomes | Oral steroid reduction | |
| Notes | ||
| Risk of bias | ||
| Bias | Authors' judgement | Support for judgement |
| Adequate sequence generation? | Low risk | See Appendix 2 |
| Allocation concealment? | Low risk | See Appendix 2 |
| Blinding? | Low risk | Identical inhaler devices |
| Methods | As above | |
| Participants | As above | |
| Interventions | As above | |
| Outcomes | As above | |
| Notes | ||
| Risk of bias | ||
| Bias | Authors' judgement | Support for judgement |
| Adequate sequence generation? | Low risk | As for FLTA3022 |
| Allocation concealment? | Low risk | As for FLTA3022 |
| Blinding? | Low risk | As for FLTA3022 |
| Methods | Setting: multicentre study USA, hospital outpatient clinic | |
| Participants | 353 adolescents/adults: 236M 117F Age range: 12‐75 years Inclusion criteria: 12 years of age or older FEV1 45‐75 (% predicted) 15% or greater reversibility in FEV1 after inhaled beta2 agonist Significant asthma symptoms during run‐in period: e.g. daily asthma symptoms with > 8 puffs beta2 agonist/day or 2‐ 4 weekly nighttime awakenings due to asthma Exclusion criteria: History of life‐threatening asthma Smokers of 10 pack years or greater Previous use of inhaled, oral, injectable or intra‐nasal corticosteroids Pregnancy | |
| Interventions | 1. FP 25 mcg 2 puffs 2xdaily (100 mcg/d) 2. FP 50 mcg 2 puffs 2xdaily (200 mcg/d) Delivery device: MDI | |
| Outcomes | Probability of remaining in study All outcomes expressed as change compared to baseline: FEV1 'Effective or very effective' Physician rated global assessment of efficacy (No. of patients) Oropharyngeal side effects | |
| Notes | No reply from author to clarify details of randomisation method For continuous outcomes change scores from baseline to endpoint (i.e. point of withdrawal) were reported A priori criteria for withdrawal due to lack of efficacy were established based on diurnal variability in PEFR, night‐time awakenings, rescue beta2 agonist use and FEV1 Placebo treatment arm also included: results not considered in this review | |
| Risk of bias | ||
| Bias | Authors' judgement | Support for judgement |
| Adequate sequence generation? | Unclear risk | Described as randomised; other information not available |
| Allocation concealment? | Unclear risk | Information not available |
| Blinding? | Low risk | Identical inhaler devices |
| Methods | Randomised, double‐blind, single dummy, parallel group study. Participants randomised according to their entry in to the treatment phase. 2 participants withdrew from the low dose FP. ITT population Jadad score: 3 | |
| Participants | N = 24 (FP1000mcg group: 12; FP100mcg group: N = 12. FP1000: 3F/9M; FP100: 12M). 23/24 atopic asthma. Mean FEV1 (% pred): FP1000 group: 69; FP100 group: 66; FEF25‐75%: FP1000 group: 1.87 (SEM 0.17); FP100 group: 2.18 (SEM 0.22); PC20: FP1000 group: 0.95 (0.1 to 11.2); FP 100 group: 0.63 (0.3 to 2.5); ECP ng/mL: FP 1000 group: 84 (24 to 165); FP 100 group: 154 (24 to 282) | |
| Interventions | FP100mcg daily versus FP1000mcg daily. Duration: 6 weeks. Inhaler device: MDI+spacer | |
| Outcomes | Lung function (FEV1; PEF; FEF); PC20; ECP; Symptoms | |
| Notes | ||
| Risk of bias | ||
| Bias | Authors' judgement | Support for judgement |
| Adequate sequence generation? | Unclear risk | Described as randomised; other information not available |
| Allocation concealment? | Unclear risk | Information not available |
| Blinding? | Low risk | Identical inhaler devices |
| Methods | Randomised, double‐blind parallel group study. Method of randomisation: Not reported. Withdrawals: No withdrawals occurred. Jadad score: 3 | |
| Participants | N=27. Mean age: 38.67 (SD 16.97). M/F: 15/12; history of atopy: 18/6; FEV1: 3.23 (SD 0.91); FEV1 % predicted (median (range)): 96 (76‐122); PD20: 0.220 Inclusion criteria: diurnal/nocturnal symptoms=0, low PEF variability [maximal amplitude(‐MA) <10%). Exclusion criteria: no use of ß‐agonists throughout run‐in | |
| Interventions | FP100 versus FP250 versus PLA. Inhaler device: unclear | |
| Outcomes | FEV1; PD20; Sputum eosinophils; max amplitude; PEF; Symptoms; Rescue medication use | |
| Notes | ||
| Risk of bias | ||
| Bias | Authors' judgement | Support for judgement |
| Adequate sequence generation? | Unclear risk | Described as randomised; other information not available |
| Allocation concealment? | Unclear risk | Information not available |
| Blinding? | Unclear risk | Information not available |
| Methods | Randomised, double‐blind, placebo‐controlled, 3‐arm parallel group trial. Methods of randomisation: not reported. ITT population | |
| Participants | N = 37 (PLA: 12; FP100: 11; FP250: 14); Age: PLA: 9.8 (SD 2.4); FP100: 9.9 (SD 1.6); FP250: 11.1 (SD 2.4); FEV1 (% predicted): PLA: 92.1 (SD 12.5); FP100: 96.6 (SD 6.9); FP250: 93.2 (SD 13.3) | |
| Interventions | Inhaled FP100 BID (200mcg/d)versus inhaled FP250 BID (500mcg/d) versus placebo, via MDI with a volumatic spacer Duration: 6 weeks (FP100 versus FP250 versus PLA); subsequent 12 weeks, PLA group re‐allocated at random to FP100 or FP250 group. Data extracted up until 6 weeks (subsequent time points have data from participants who had been treated with PLA for preceding 6 weeks) | |
| Outcomes | FEV1 (% predicted); EIB; PD20 | |
| Notes | Patients were randomised to receive FP or placebo and treated for 6 weeks. After 6 weeks patients receiving placebo were re‐randomised to either dose of FP for a further 18 weeks. Placebo treatment arm also included: results not considered in this review. | |
| Risk of bias | ||
| Bias | Authors' judgement | Support for judgement |
| Adequate sequence generation? | Unclear risk | Described as randomised; other information not available |
| Allocation concealment? | Unclear risk | Information not available |
| Blinding? | Unclear risk | Information not available |
| Methods | Setting: multicentre study Canada, Denmark, Iceland, Italy, UK | |
| Participants | 496 adults | |
| Interventions | i) FSC (not covered in this review) ii) FP 500mcg/d iii) FP 1000mcg/d Inhaler device: MDI | |
| Outcomes | Withdrawals (n) am PEF pm PEF Exacerbations Symptoms Relief medication usage Clinic FEV1 Clinic FVC Physician assessment of effectiveness (n) Subjects assessment of effectiveness (n) Adverse events (n) | |
| Notes | Unpublished trial | |
| Risk of bias | ||
| Bias | Authors' judgement | Support for judgement |
| Adequate sequence generation? | Low risk | See Appendix 2 |
| Allocation concealment? | Low risk | See Appendix 2 |
| Blinding? | Low risk | Identical inhaler devices used |
| Methods | Setting: multicentre study, Europe, Middle East and Asia, hospital outpatient clinics | |
| Participants | 263 children: 166M 97F Age range: 4‐11 years Inclusion criteria: Diagnosis of asthma (not otherwise defined) Recurrent episodes of bronchoconstriction and cough Able to use delivery device and peak flow meter satisfactorily PEFR 75 (% predicted)or less, or PEFR 75‐90 (% predicted) with asthma symptoms during run‐in period Exclusion criteria: Treatment with inhaled corticosteroids within last 3 months Oral steroids in last month Continuous treatment with oral steroids over 2 months or more in past Hospital admission due to asthma in last 3 months | |
| Interventions | 1. FP 50 mcg 2 x daily (100 mcg/d) 2. FP 100 mcg 2 x daily (200 mcg/d) Delivery device: Diskhaler DPI | |
| Outcomes | Outcomes expressed as change compared to baseline: FEV1 FVC FEF 25‐75 Morning PEFR Evening PEFR Daily asthma symptom score Night‐time wakening score Daily use of beta2 agonists Probability of remaining in study | |
| Notes | Reply from author but unable to clarify details of randomisation method For continuous outcomes change scores from baseline to endpoint (i.e. point of withdrawal) were reported A priori criteria for withdrawal due to lack of efficacy were established based on FEV1, PEFR, sleep disturbance or rescue beta2 agonist use Placebo treatment arm also included: results not considered in this review | |
| Risk of bias | ||
| Bias | Authors' judgement | Support for judgement |
| Adequate sequence generation? | Low risk | See Appendix 2 |
| Allocation concealment? | Low risk | See Appendix 2 |
| Blinding? | Low risk | Identical inhaler devices used |
| Methods | Setting: multicentre study, USA Jadad score: 5 | |
| Participants | 190 adults and adolescents screened, 160 randomised (three arm study; PLA: N = 54; FP400: N = 55; FP1000: 51), Age range: 18‐50; Mean baseline FEV1 (% predicted): PLA: 83; FP100: 82; FP500: 85 Inclusion criteria: 18‐50 years (F: 18‐40); mild asthma (6 months); FEV1: 50‐100% predicted Exclusion criteria: Significant co‐morbidity of bone; alterations in body weight; reversal of nocturnal sleeping hours; substance abuse | |
| Interventions | FP200 BID (400) versus FP1000 BID (1000) versus PLA. Inhaler device: MDI | |
| Outcomes | Bome mineral density; withdrawals; adverse events | |
| Notes | ||
| Risk of bias | ||
| Bias | Authors' judgement | Support for judgement |
| Adequate sequence generation? | Low risk | See Appendix 2 |
| Allocation concealment? | Low risk | Randomisation code generated off‐site |
| Blinding? | Low risk | Idenitcal inhaler devices |
| Methods | Setting: multicentre study USA, hospital outpatient clinics | |
| Participants | 261 adults Age range: 18‐71 years Inclusion criteria: Diagnosis of asthma (ATS criteria 1987) Treatment with ICS for 3 months or longer Treatment with BDP 336 mcg/d or TA 800 mcg/d at stable dose for 2 weeks FEV1 50‐80 (% predicted) 15% or greater reversibility in FEV1 after inhaled beta2 agonist Exclusion criteria: Systemic, intra‐nasal or opthalmic corticosteroids in last 2 months Oral corticosteroids for > 2 months in last 6 months Pregnancy | |
| Interventions | 1. FP100 mcg 2xdaily (200 mcg/d) 2. FP 500 mcg 2xdaily (1000 mcg/d) Delivery device: Diskhaler DPI | |
| Outcomes | Probability of remaining in study Outcomes expressed as change compared to baseline: FEV1 Morning PEFR Daily asthma symptom score Daily use of beta2 agonist Morning plasma cortisol Oro‐pharyngeal side effects | |
| Notes | No reply from author to clarify details of randomisation method Results for continuous outcomes expressed as change to endpoint (point of withdrawal) A priori criteria for withdrawal due to lack of efficacy were established based on FEV1, morning PEFR, night‐time awakenings or clinical exacerbation requiring emergency hospital treatment Placebo treatment arm also included: results not considered in this review | |
| Risk of bias | ||
| Bias | Authors' judgement | Support for judgement |
| Adequate sequence generation? | Unclear risk | Described as randomised; no other information available |
| Allocation concealment? | Unclear risk | Information not available |
| Blinding? | Unclear risk | Information not available |
| Methods | Randomised, double‐blind, triple dummy, placebo‐controlled trial. Methods of randomisation not reported. Withdrawals: Placebo: 0; FP88: 1; FP220: 1. Non‐ITT. Jadad score: 4 | |
| Participants | N = 128 (N for treatments considered by this review: 63; Placebo: 17; FP88: 22; FP220: 24). M/F ratio (%): PLA: 82/18; FP88: 68/32; FP220: 58/42; Mean age (range): PLA: 31 (19‐41); FP88: 30 (19‐42); FP220: 33 (18‐53); Ethnic origin (%) (White/Other): PLA: 94/6; FP88: 95/5; FP220: 88/13; FEV1 % Predicted: PLA: 89.1; FP88: 82.5; FP220: 88.2; Concurrent medication: Salmeterol: PLA: 0; FP88: 0; FP220: 1; Theophylline: PLA: 2; FP88: 0; FP220: 3; Cromolyn: PLA: 0; FP88: 1; FP220: 1; Nedocromil: PLA: 0; FP88: 0; FP220: 1 Inclusion criteria: Non‐smokers; asthma according to ATS criteria; duration of disease >6 months; FEV1 >/=50% predicted Exclusion criteria: Pregnancy/lactation; use of methotrexate/gold salts; use of inhaled cromolyn/nedocromil; use of oral, intranasal, inhaled or injectable steroids <4 weeks of study commencement; use of >/= 140mg prednisone or equivalent dosage in past year; significant concomitant illness; immunotherapy requiring change in dosage regimen within 12 weeks; reversal of nocturnal sleeping hours; concurrent use of over‐the‐counter medication that might affect course of asthma or interact with sympathomimetic amines or confound cortisol assay | |
| Interventions | FP88 versus FP220 versus Placebo. Inhaler device: pMDI + spacer. Duration: 28 days. | |
| Outcomes | HPA axis function; plasma concentration; area under the curve; adverse events | |
| Notes | ||
| Risk of bias | ||
| Bias | Authors' judgement | Support for judgement |
| Adequate sequence generation? | Unclear risk | Described as randomised; other information not available |
| Allocation concealment? | Unclear risk | Information not available |
| Blinding? | Low risk | Identical inhaler devices |
| Methods | Randomised, double‐blind, parallel group study. Method of randomisation: not reported; blinding: not reported. Withdrawals ‐ Last observation carried forward. Missing: PLA: 2; FP88 BID: 3; FP220 BID: 1; FP440 BID: 2 Jadad score: 3 | |
| Participants | N=415 (PLA: 104; FP172: 103; FP440: 106; FP880: 102); Mean FEV1 % predicted: PLA: 65.6; FP172: 65.3; FP440: 65.5; FP880: 66.2; mean am PEF (l/min): PLA: 346; FP172: 334; FP440: 329; FP880: 333.1 Inclusion criteria: >/=12 years; asthma for >6 months requiring tx with ICS for >/=3 months; FEV1: 45‐80% predicted; >/=12% reversibility Exclusion criteria: not reported | |
| Interventions | HFA FP88 BID (172 mcg/d) versus HFA FP220 BID (440) versus HFA FP440 BID (880). Study duration: 12 weeks. Inhaler device: MDI | |
| Outcomes | am PEF; FEV1 (% predicted) | |
| Notes | ||
| Risk of bias | ||
| Bias | Authors' judgement | Support for judgement |
| Adequate sequence generation? | Low risk | See Appendix 2 |
| Allocation concealment? | Low risk | See Appendix 2 |
| Blinding? | Unclear risk | Identical inhaler devices used |
| Methods | Randomised, double‐blind, double‐dummy parallel group trial. Method of randomisation: computerised minimisation method. Participants stratified according to age, previous dose of ICS, FEV % pred, reversibility to 200mcg sal, smoking status, serum IgE and PC20 methacholine. ITT population (all participants who contributed one reading). ICS tapered down at least 3 weeks prior to randomisation. If symptoms deteriorated during tapering phase thy were asked to present earlier for randomisation. Jadad score: 4 | |
| Participants | N = 120 (Prednisolone: 40; FP2000: 40; FP500: 40; ); Median age: Prednisolone: 28 (18‐53); FP2000: 27 (18‐48); FP500: 27 (18‐56); M/F: Prednisolone: 14/26; FP2000: 14/26; FP500: 13/27; Smokers (%) (Current:Ex‐smoker:Non‐smoker): Prednisolone: 28:23:49; FP2000: 31:15:54; FP500: 28:23:49; FEV1 (% predicted): Prednisolone: 80 (65 to 91); FP2000: 79 (67 to 91); FP500: 81 (70 to 96); Reversibility (% pred): Prednisolone: 12 (9.2 to 17.8); FP2000: 11.4 (9 to 17.2); FP500: 12.3 (9.2 to 14.4); Log2 PC20 methacholine (mg/ml): Prednisolone: ‐0.86 (0.36); FP2000: ‐0.83 (0.37); FP500: ‐0.83 (0.36); Log2 PC20 AMP (mg/ml): Prednisolone: 1.89 (0.56); FP2000: 3.02 (0.54); FP500: 2.59 (0.67); IgE (IU/ml): Prednisolone: 251 (157 to 615); FP2000: 251 (85 to 550); FP500: 181 (97 to 631); Blood eosinophils (%): Prednisolone: 5.8 (3.6 to 8.0); FP2000: 5.0 (4.0 to 6.8); FP500: 5.1 (2.8 to 7.9); Sputum eosinophils (%): Prednisolone: 5.5 (2.0 to 14.7); FP2000: 5.0 (1.0 to 8.0); FP500: 5.0 (1.67 to 12); Serum ECP (mcg/l): Prednisolone: 19.5 (10.4 to 26.8); FP2000: 13.3 (9.9 to 22); FP500: 17.1 (9.3 to 24.9); Serum ECP Prednisolone (mcg/l): 78.4 (28 to 292); FP2000: 73.6 (33 to 250); FP500: 95.8 (46 to 233); Serum cortisol (nmol/l): Prednisolone: 420 (302 to 563); FP2000: 425 (320 to 725); FP500: 445 (265 to 740). Inclusion criteria: 18‐56 years; diagnosis of asthma; concentration of methacholine causing 20% fall in FEV1 (PC20) of 8mg/ml; 1 +ve skin prick test to 17 most common aeroallergens; reversibility to ß2 agonist (>/= 9% of predicted FEV1); ability to expectorate after hypertonic saline. Exclusion criteria: Participants who experienced exacerbation during run‐in phase which required course of oral steroids. | |
| Interventions | Inhaled FP 500mcg versus Inhaled FP 2000mcg versus oral prednisolone. Duration: 2 weeks. Inhaler device: DPI. | |
| Outcomes | FEV (% predicted); PC20 methacholine (DC); PC20 AMP (DC); PEF (L/min); Daytime symptoms; rescue medication (puffs/day); Sputum eosinophils (%); Serum ECP (mcg/l); Sputum ECP (mcg/l); Serum cortisol | |
| Notes | ||
| Risk of bias | ||
| Bias | Authors' judgement | Support for judgement |
| Adequate sequence generation? | Low risk | Computerised minimisation method. Participants stratified according to age, previous dose of ICS, FEV % predicted, reversibility to 200mcg SABA, smoking status, serum IgE and PC20 methacholine |
| Allocation concealment? | Unclear risk | Information not available |
| Blinding? | Low risk | Double dummy design |
| Methods | Randomised, double‐blind, placebo controlled multi‐centre trial. Method of randomisation not reported. Participants randomised according to baseline therapy: ICS or ß‐2. Withdrawals: PLA: 43; FP100: 34; FP200: 28; FP500: 20. Jadad score: 3 | |
| Participants | N = 330. (PLA: 84; FP100mcg: 79; FP200mcg: 81; FP500mcg: 86); Gender (% M:F): PLA: 56:44; FP100: 65:35; FP200: 56:44; FP500: 55:45; Age range: 12‐75; Mean age: PLA: 38; FP100: 34; FP200: 38; FP500: 37; FEV1 L: PLA: 2.22 (SEM 0.06); FP100: 2.40 (0.07); FP200: 2.21 (SEM 0.07); FP500: 2.26 (SEM 0.05); FEV1 % predicted: PLA: 62.6 (SEM 1.07); FP100: 64.3 (SEM 0.89); FP200: 63.3 (SEM 1.03); FP500: 63.7 (SEM 0.96); am PEF (L/min): PLA: 394 (SEM 10); FP100: 397 (SEM 10); FP200: 395 (SEM 10); FP500: 379 (SEM 10); pm PEF (L/min): PLA: 412 (SEM 10); FP100: 420 (SEM 10); FP200: 414 (SEM 10); FP500: 404 (SEM 10); Asthma symptom scores: PLA: 1.10 (SEM 0.07); FP100: 1.18 (SEM 0.06); FP200: 1.03 (SEM 0.07); FP500: 1.08 (SEM 0.07); Albuterol use (puffs/d): PLA: 3.05 (SEM 0.26); FP100: 3.43 (SEM 0.26); FP200: 2.62 (SEM 0.24); FP500: 3.18 (SEM 0.26); Nighttime awakenings, No. (%): PLA: 0.09 (SEM 0.02); FP100: 0.08 (SEM 0.02); FP200: 0.12 (SEM 0.02); FP500: 0.10 (SEM 0.02) . | |
| Interventions | Inhaled FP100mcg QD versus FP200mcg QD versus FP500mcg QD versus placebo. Diskus inhaler. Duration: 12 weeks (plus open label extension) | |
| Outcomes | Lung function (FEV1; am PEF; pm PEF); asthma symptoms; albuterol use; nighttime awakenings; withdrawals; safety; HPA axis function | |
| Notes | ||
| Risk of bias | ||
| Bias | Authors' judgement | Support for judgement |
| Adequate sequence generation? | Low risk | See Appendix 2 |
| Allocation concealment? | Low risk | See Appendix 2 |
| Blinding? | Low risk | Identical inhaler devices |
| Methods | Setting: multicentre study USA, hospital outpatient clinics | |
| Participants | 111 adults: 44M 67F Age range: 12‐77 years Inclusion criteria: 12 years of age or older Diagnosis of asthma (ATS criteria 1987) Dependent on oral corticosteroids for asthma control for 6 months or longer Requiring 5‐40 mg/day oral prednisolone FEV1 40‐80 (% predicted) 15% or greater reversibility in FEV1 after inhaled beta2 agonist Exclusion criteria: Life‐threatening asthma or other severe concurrent disease Use of intra‐nasal, injectable, topical corticosteroids Methotrexate, cyclosporin, azathioprine, troleandomycin within last 3 months | |
| Interventions | 1. FP 500 mcg 2xdaily (1000 mcg/d) 2. FP 1000 mcg 2xdaily (2000 mcg/d) Delivery device: Accuhaler DPI | |
| Outcomes | 100% reduction in daily dose oral prednisolone (No. of patients) 1‐49% reduction in daily dose oral prednisolone (No. of patients) 0% reduction or increase in daily dose oral prednisolone (No. of patients) Outcomes reported as a change compared to baseline: Daily dose oral prednisolone FEV1 Morning PEFR Evening PEFR Daily asthma symptom score Daily beta2 agonist use Night‐time awakenings Health status: asthma Quality of Life Questionnaire (AQLQ) Plasma cortisol < 5mcg/L (No. of patients) Peak plasma cortisol < 18 mcg/dL during 6 hour iv infusion with 250 mcg co‐syntropin (No. of patients) Change in plasma cortisol < 7 mcg/dL following co‐syntropin infusion (No. of patients) Change in morning plasma cortisol compared to baseline | |
| Notes | No reply from author to clarify details of randomisation method Usual ICS discontinued at randomisation A priori criteria for prednisolone dose reduction based on FEV1 (% predicted), PEFR (% predicted), number of night‐time awakenings, beta‐2 agonist use compared to run in period values Patients were withdrawn from the study if they experienced asthma exacerbation requiring hospital admission, or 3 bursts of oral prednisolone due to exacerbation Placebo treatment arm also included: results not considered in this review | |
| Risk of bias | ||
| Bias | Authors' judgement | Support for judgement |
| Adequate sequence generation? | Low risk | See Appendix 2 |
| Allocation concealment? | Low risk | See Appendix 2 |
| Blinding? | Low risk | Identical inhaler devices |
| Methods | Randomised controlled trial. Method of randomisation not reported; blinding not reported. Withdrawals not reported. Jadad score: 1 | |
| Participants | N=18 (distribution between groups unclear). M/F: 9/9; mean age: 30 (SD 8); PC20: 1.14 (1.38). Inclusion criteria: not reported. Exclusion criteria: not reported. | |
| Interventions | FP100 BID (200) versus FP250 BID (500). Inhaler device: unclear | |
| Outcomes | PC20; exhaled nitric oxide | |
| Notes | Unpublised conference abstract | |
| Risk of bias | ||
| Bias | Authors' judgement | Support for judgement |
| Adequate sequence generation? | Unclear risk | Described as randomised; other information not available |
| Allocation concealment? | Unclear risk | Information not available |
| Blinding? | Unclear risk | Information not available |
| Methods | Setting: multicentre study USA, hospital outpatient clinics | |
| Participants | 96 adults: 46M 50F Mean age: 50‐52 years Inclusion criteria: 12 years of age or older Diagnosis of asthma (ATS criteria 1987) Dependent on oral corticosteroids for asthma control for 6 months or longer FEV1 40‐80 (% predicted) Documented evidence of previous attempts to reduce oral steroid dose Exclusion criteria: Use of methotrexate, gold salts or troleandomycin in last 3 months Nasal corticosteroid use 10 pack year history of smoking or greater Pregnancy or lactation | |
| Interventions | 1. FP 750 mcg 2xdaily (1500 mcg/d) 2. FP 1000 mcg 2xdaily (2000 mcg/d) Delivery device: MDI | |
| Outcomes | 100% reduction in daily oral steroid use (% patients) 1‐49% reduction in daily oral steroid use (% patients) 0% or increase in daily oral steroid use (% patients) Outcomes expressed as change compared to baseline: Daily oral FEV1 Morning PEFR Evening PEFR Daily use of beta2 agonists Daily asthma symptom score Quailty of life: Medical Outcomes Study Short Form (SF‐36) | |
| Notes | No reply from author to clarify details of randomisation method Usual ICS discontinued at randomisation Daily dose oral prednisolone reduced according to pre‐defined criteria An uncontrolled one year open label study was undertaken following the randomised 16 week trial, when all patients received FP 2000 mcg/d. Results not considered in this review Placebo treatment arm also included: results not considered in this review | |
| Risk of bias | ||
| Bias | Authors' judgement | Support for judgement |
| Adequate sequence generation? | Unclear risk | Described as randomised; other information not available |
| Allocation concealment? | Unclear risk | Information not available |
| Blinding? | Low risk | Identical inhaler devices |
| Methods | Setting: multicentre study USA, hospital outpatient clinic | |
| Participants | 138 adults: 84M 54F Age range: 12‐59 years Inclusion criteria: 12 years of age or older Diagnosis of asthma (ATS criteria 1987) 6 months or longer FEV1 60 (% predicted) or greater 15% or greater reversibility in FEV1 after inhaled beta2 agonist Methacholine BHR (PD20 FEV1) < 18 mg Asthma stability during run in period based on a priori defined criteria related to PEFR, medication requirement and symptoms Exclusion criteria: Recent hospitalisation due to asthma exacerbation Treatment with corticosteroids, theophylline, sodium cromoglycate, nedocromil Pregnancy | |
| Interventions | 1. FP 50 mcg 2xdaily (100 mcg/d) 2. FP 100 mcg 2xdaily (200 mcg/d) Delivery device: MDI | |
| Outcomes | Outcomes expressed as change compared to baseline: FEV1 Morning PEFR Evening PEFR Methacholine BHR (log e PD20 FEV1) Daily asthma symptom score Daily use of beta2 agonist Night‐time awakenings Probability of remaining in study Oro‐pharyngeal side effects | |
| Notes | No reply from author to clarify details of randomisation method For continuous outcomes change scores from baseline to endpoint (i.e. point of withdrawal) were reported A priori criteria for withdrawal due to lack of efficacy were established based on FEV1, morning PEFR, night‐time awakenings or clinical exacerbation requiring emergency hospital treatment MDI's used for all interventions. Formulations of FP with 1% lecithin and 10% lecithin used. Only data for 1% formulation included in meta‐analysis Placebo treatment arm also included: results not considered in this review | |
| Risk of bias | ||
| Bias | Authors' judgement | Support for judgement |
| Adequate sequence generation? | Unclear risk | Described as randomised; other information not available |
| Allocation concealment? | Unclear risk | Information not available |
| Blinding? | Low risk | Identical inhaler devices |
| Methods | Randomised, double‐blind, parallel group trial. Method of randomisation not reported; blinding not reported. Withdrawals: N = 1. nonITT population Jadad score: 3 | |
| Participants | N=36. Mean age: FP100: 32 (SEM 2.8); FP500: 32 (SEM 2.1); FP2000: 34 (SEM 2.8); FEV1% predicted: FP100: 81 (SEM 4.2); FP500: 86 (SEM 2.7); FP2000: 79 (SEM 3.3); Mean PC20: FP100: 1.11 (0.41); FP500: 0.55 (SEM 0.18); FP2000: 0.86 (SEM 0.51). Inclusion criteria: Atopic asthma as determined by skin prick test; fev1 >/=60% predicted; change in FEV1 >/=12% post SABA; PC20 fall of 4mg/mL; all participants were steroid naive; SABA prn Exclusion criteria: RTI in previous 6 months; steroid (I/O) use in 6 weeks prior to enrolment | |
| Interventions | FP100 versus FP500 versus FP2000. Study duration: 2 weeks. 2 week run‐in period with placebo inhalers. Inhaler device: MDI | |
| Outcomes | FEV1; FEF; FEV1/FVC; PEF L/min; Symptoms; bronchial biopsy; PC20; adverse events | |
| Notes | ||
| Risk of bias | ||
| Bias | Authors' judgement | Support for judgement |
| Adequate sequence generation? | Unclear risk | Described as randomised; other information not available |
| Allocation concealment? | Unclear risk | Information not available |
| Blinding? | Low risk | Identical inhaler devices |
| Methods | Randomised, double‐blind, double‐dummy crossover study. Method of randomisation: not reported; blinding: not reported. Jadad score: 2 | |
| Participants | N=26, Other details not reported | |
| Interventions | Ciclesonide (400mcg QID; 800mcg QID; 800mcg QID), FP500 BID & FP1000 BID or PLA. Study duration: 6 x 1 week treatment period. Inhaler device: unclear | |
| Outcomes | % Cortisol suppression; PC20 | |
| Notes | Unpublished conference abstract | |
| Risk of bias | ||
| Bias | Authors' judgement | Support for judgement |
| Adequate sequence generation? | Unclear risk | Described as randomised; other information not available |
| Allocation concealment? | Unclear risk | Information not available |
| Blinding? | Unclear risk | Information not available |
| Methods | Setting: multicentre study USA, hospital outpatient clinic | |
| Participants | 342 subjects randomised Age range: 12‐72 years Inclusion criteria: Diagnosis of asthma (ATS criteria 1987) Required maintenance inhaled corticosteroids for at least 3 months FEV! 50‐80 (%predicted) 15% or greater reversibility in FEV1 after inhaled beta2 agonist During last 7 days of run‐in period: No more than 12 puffs per day of albuterol No more than 4 morning PEFR 20% less than previous evenings No more than 2 nights wakening due to asthma requiring inhaled albuterol adequate compliance with study medication Exclusion criteria: Previous use of gold or methotrexate for control of asthma Inhaled cromoglycate or oral steroids in the last 4 weeks Significant co‐existent illness Pregnancy or lactation | |
| Interventions | 1. FP 50 mcg 1 actuation 2xdaily (100 mcg/d) 2. FP 100mcg 1 actuation 2xdaily (200 mcg/d) 3. FP 250 mcg 1 actuation 2xdaily (500 mcg/d) Delivery device: Diskhaler DPI | |
| Outcomes | Outcomes expressed as change compared to baseline: FEV1 Morning PEFR Evening PEFR Daily asthma symptom score Night‐time awakenings Daily use of beta2 agonist Medical Outcomes Study Short Form (SF‐36A) Living with Asthma Questionnaire (LWA) Validated sleep scale Probability of remaining in study Physician global assessment of efficacy Serum cortisol Oro‐pharyngeal side effects | |
| Notes | No reply from author to clarify details of randomisation method For continuous outcomes change scores from baseline to endpoint (i.e. point of withdrawal) were reported A priori criteria for withdrawal due to lack of efficacy were established based on FEV1, morning PEFR, night‐time awakenings or clinical exacerbation requiring emergency hospital treatment Placebo treatment arm also included: results not considered in this review | |
| Risk of bias | ||
| Bias | Authors' judgement | Support for judgement |
| Adequate sequence generation? | Unclear risk | Described as randomised; other information not available |
| Allocation concealment? | Unclear risk | Information not available |
| Blinding? | Low risk | Identical inhaler devices used |
| Methods | Randomised, double‐blind, double‐dummy, parallel group multi‐centre trial. Method of randomisation not reported. ITT population. Withdrawals: PLA 1; SAL42mcg: 2; FP88mcg: 1; FP220mcg: 1; SL42mcg/FP88mcg: 2; SAL42mcg/FP220mcg: 21 Jadad score: 3 | |
| Participants | N = 136 (PLA: 23; FP88: 23; FP220: 23; SAL: 21; SAL/FP88: 25; SAL/FP220: 21).Mean age (range): PLA: 35 (12‐62); SAL: 29 (15‐57); FP88: 27 (13‐50); FP220: 32 (14‐61); SAL/FP88: 33 (14‐60); SAL/FP220: 26 (13‐52); Gender (M:F %): PLA: 43:57; SAL42: 67:33; FP88: 74:26; FP220: 57:43; SAL/FP88: 40:60; SAL/FP220: 67:33; Mean FEV1 (% predicted): PLA: 68; SAL: 70; FP88: 69; FP220: 65; SAL/FP88: 67; SAL/FP220: 69; Reversibility: PLA: 32; SAL: 27; FP88: Inclusion criteria: >/=12 years of age; ATS defined asthma (at least 6 months), requiring medical treatment; FEV1 between 50‐80% predicted; >/=15% increase in FEV1 post‐SABA; treatment with prn SABA; female participants had ‐ve pregnancy tests and either surgically sterile, postmenopausal at 1 year or using acceptable birth control for 1 month prior to participation Exclusion criteria: History of life‐threatening asthma; hypersensitivity reaction to beta‐agonists/corticosteroids; smoking within previous year/history >10 pack years; use of OCS/ICS or parenteral steroids (except for Flonase); use of steroid therapy in previous month; OCS treatment in previous 6 months; use of OTC medication that may affect the course of asthma; abnormal CXR; clinically significant abnormal 12‐lead ECG; history of concurrent disease (glaucoma, diabetes + hypertension) | |
| Interventions | PLA versus FP88mcg BID versus FP220mcg BID versus SAL42mcg/FP88mcg BID versus SAL42mcg/FP220mcg BID daily. Inhaler device: MDI. Duration: 4 weeks | |
| Outcomes | FEV1; Am PEF; Symptoms; % days without asthma; % nights awakening due to asthma; rescue medication use; adverse effects | |
| Notes | ||
| Risk of bias | ||
| Bias | Authors' judgement | Support for judgement |
| Adequate sequence generation? | Low risk | See Appendix 2 |
| Allocation concealment? | Low risk | See Appendix 2 |
| Blinding? | Low risk | Identical inhaler devices |
| Methods | Setting: multicentre study USA, paediatric outpatient clinic | |
| Participants | 177 children: 112M 65F | |
| Interventions | 1. FP 50mcg 2xdaily (100 mcg/d) via Accuhaler DPI 2. FP 100mcg 2xdaily (200mcg/d) via Accuhaler DPI | |
| Outcomes | Outcomes expressed as change compared to baseline: FEV1 FEV1 (% predicted) Morning PEFR Morning PEFR (% predicted) Evening PEFR Daily asthma symptom score Daily use of beta2 agonist Night‐time awakening score Morning plasma cortisol Total urinary free cortisol excretion (mcg/24 hours) Probability of remaining in study | |
| Notes | No reply from author to clarify details of randomisation method For continuous outcomes change scores from baseline to endpoint (i.e. point of withdrawal) were reported A placebo treatment arm was also included: results not considered in this review | |
| Risk of bias | ||
| Bias | Authors' judgement | Support for judgement |
| Adequate sequence generation? | Low risk | See Appendix 2 |
| Allocation concealment? | Low risk | See Appendix 2 |
| Blinding? | Low risk | Double dummy design |
| Methods | See Peden 1998 | |
| Participants | 174 children: 100M 74F | |
| Interventions | 1. FP 50 mcg 2xdaily (100 mcg/d) via Diskhaler DPI 2. 100 mcg 2xdaily (200 mcg/d) via Diskhaler DPI | |
| Outcomes | See Peden 1998 | |
| Notes | See Peden 1998 | |
| Risk of bias | ||
| Bias | Authors' judgement | Support for judgement |
| Adequate sequence generation? | Low risk | See Peden 1998 |
| Allocation concealment? | Low risk | See Peden 1998 |
| Blinding? | Low risk | See Peden 1998 |
| Methods | Setting: multicentre study USA. | |
| Participants | 397 adults randomised, 312 completed: 212F No run‐in period described. | |
| Interventions | FP: 2. 110mcg 2 x daily 2. 220mcg 2 x daily 3. Placebo Inhaler device: MDI | |
| Outcomes | Change in FEV1; am PEF; rescue medication usage; symptoms; quality of life; adverse events | |
| Notes | Conference abstract Sourced from www.clinicalstudyresults.org | |
| Risk of bias | ||
| Bias | Authors' judgement | Support for judgement |
| Adequate sequence generation? | Low risk | See Appendix 2 |
| Allocation concealment? | Low risk | See Appendix 2 |
| Blinding? | Low risk | Identical inhaler devices |
| Methods | Setting: multicentre study USA, primary care and hospital outpatient clinics Design: parallel group Length of intervention period: 12 weeks Randomisation: yes, computer generated sequence Allocation concealment: yes (central coding by pharmaceutical company sponsors) Masking: double blind Excluded: not stated Withdrawals: stated Baseline characteristics: comparable Jadad score: 5 | |
| Participants | 399 adolescents and adults: 167M 232F Age range: 12‐83 years Inclusion criteria: 12 years of age or older with established diagnosis of asthma (no further details) At end of run‐in period: FEV1 of 45‐65 (% predicted), or if FEV1 65‐80 (% predicted) additional evidence of sub‐optimal control (> 8 puffs rescue beta2 agonist/week, diurnal PEFR variability > 20%, any night‐time wakening due to asthma symptoms requiring beta2 agonist) 12% or greater increase in FEV1 after inhaled beta2 agonist Regular treatment with BDP or TA 8‐12 puffs/day for one month or longer Exclusion criteria: Use of systemic steroids, leukotriene modifiers, sodium cromoglycate or nedocromil within last month Smokers Asthma exacerbation during run‐in period Baseline asthma control: Reduced FEV1 of 45‐65 (% predicted) or significant symptoms (see above) | |
| Interventions | 1. FP 44 mcg 2 puffs 2xdaily (176 mcg/d) 2. FP 110 mcg 2 puffs 2xdaily (440 mcg/d) Delivery device: MDI | |
| Outcomes | Change in FEV1 compared to baseline Change in FEF25‐75 compared to baseline Change in FVC compared to baseline Change in morning PEFR compared to baseline Change in evening PEFR compared to baseline Change in rescue beta2 agonist use compared to baseline (puffs/day) Change in daily asthma symptom score compared to baseline Change % days with no rescue beta2 agonist use compared to baseline Change in % days with no symptoms compared to baseline Withdrawal due to asthma exacerbation (No. of patients) Oropharyngeal side effects Oropharyngeal Candidiasis | |
| Notes | Study also included two further treatment arms with BDP: results not considered in this review | |
| Risk of bias | ||
| Bias | Authors' judgement | Support for judgement |
| Adequate sequence generation? | Low risk | Computer generated sequence |
| Allocation concealment? | Low risk | Central coding by pharmaceutical company sponsors |
| Blinding? | Low risk | Identical inhaler devices |
| Methods | Setting: multicentre study Europe and Israel | |
| Participants | 367 children (ITT population: 355); 245M 110F | |
| Interventions | 1. FP100 BD (200mcg/d) 2. FP200 BD (400mcg/d) Inhaler device: DPI | |
| Outcomes | % symptom free days and nights; use of reliever medication; am PEF (L/min); pm PEF (L/min); Clinic PEF; exacerbations; adverse events | |
| Notes | Unpublished study ‐ data retrieved and extracted from study detailed online | |
| Risk of bias | ||
| Bias | Authors' judgement | Support for judgement |
| Adequate sequence generation? | Low risk | See Appendix 2 |
| Allocation concealment? | Low risk | See Appendix 2 |
| Blinding? | Low risk | Identical inhaler devices |
| Methods | Setting: multicentre study USA, hospital outpatient clinics | |
| Participants | 307 patients: 185M 122F | |
| Interventions | 1. FP 25 mcg 1 puff 2xdaily (50 mcg/d) 2. FP 50 mcg 1 puff 2xdaily (100 mcg/d) 3. FP 50 mcg 2 puffs 2xdaily (200 mcg/d) Delivery device: MDI | |
| Outcomes | Outcomes expressed as change compared to baseline: FEV1; Morning PEFR; Evening PEFR; Night‐time awakenings; Daily wheeze score; Daily cough score; Daily breathlessness score; Daily use of beta2 agonists; Probability of remaining in study | |
| Notes | Randomisation details confirmed by author For continuous outcomes change scores from baseline to endpoint (i.e. point of withdrawal) were reported A priori criteria for withdrawal due to lack of efficacy were established based on FEV1, morning and evening PEFR, diurnal variability in PEFR, night‐time awakenings or clinical exacerbation requiring emergency hospital treatment | |
| Risk of bias | ||
| Bias | Authors' judgement | Support for judgement |
| Adequate sequence generation? | Low risk | Computer generated sequence |
| Allocation concealment? | Low risk | Off site by third party |
| Blinding? | Low risk | Identical inhaler devices |
| Methods | Randomised, double‐blind, triple dummy, placebo controlled, parallel group study. Method of randomisation: computer‐generated randomisation. Blinding: matching inhalers. Withdrawals: Placebo: 0; FP100: 1; FP500: 1. ITT population. Jadad score: 5 | |
| Participants | N = 168 (N for treatment groups considered by the review: Placebo: 30; FP100: 27; FP500: 30); Mean age (SE): PLA: 27.9 (1.6); FP100: 27.7 (1.7); FP500: 28.2 (1.6); Gender (M/F): PLA: 26/4; FP100: 26/1; FP500: 24/6; Race (White/other %): PLA: 67/33; FP100: 81/19; FP500: 77/23; FEV1 % predicted (SE): PLA: 87 (2.5); FP100: 88 (3.1); FP500: 83 (3.9) Inclusion criteria: 18‐51 years of age; documented diagnosis of asthma (>/=6 months according to ATS criteria; FEV1 at least 50% predicted Exclusion criteria: Pregnancy or lactation; corticosteroid/immunosuppressive therapy for 3 months prior to study entry; use of 140mg prednisone or equivalent in any dosage or form in previous year; current/prior use of antiasthma medication other than beta‐agonists, theophylline or cromolyn sodium; historical or current evidence of significant concomitant disease; use of oral contraceptives or other hormonal therapy; current use of prescription or over the counter medication known to interact with corticosteroids or to cause an abnormal response to exogenous glucocorticoids or reversal of normal nocturnal sleeping hours | |
| Interventions | FP200 versus FP1000 versus Placebo. Delivery device: Rotadisk. Duration of study: 4 weeks | |
| Outcomes | AUC; Plasma cortisol; withdrawals; adverse events | |
| Notes | ||
| Risk of bias | ||
| Bias | Authors' judgement | Support for judgement |
| Adequate sequence generation? | Low risk | Computer‐generated randomisation. |
| Allocation concealment? | Unclear risk | Information not available |
| Blinding? | Low risk | Triple dummy design |
| Methods | Randomised, double‐blind, triple dummy, placebo controlled, parallel group study. Method of randomisation: computer‐generated randomisation. Blinding: matching inhalers. Withdrawals: PLA: 1; FP100: 3; FP500: 2. ITT population. Jadad score: 5 | |
| Participants | N = 119 (N for treatment groups considered by the review: PLA: 31; FP200: 29; FP500: 30); Mean age (SE): PLA: 32.1 (1.7); FP200: 31.4 (1.8); FP500: 33 (1.6); Gender (M/F): PLA: 25/6; FP200: 26/3; FP500: 26/4; Race (White/other %): PLA: 94/6; FP200: 93/7; FP500: 90/10; FEV1 % predicted (SE): PLA: 87 (2.7); FP200: 86 (2.7); FP500: 88 (3) Inclusion criteria: 18‐51 years of age; documented diagnosis of asthma (>/=6 months according to ATS criteria; FEV1 at least 50% predicted Exclusion criteria: Pregnancy or lactation; corticosteroid/immunosuppressive therapy for 3 months prior to study entry; use of 140mg prednisone or equivalent in any dosage or form in previous year; current/prior use of antiasthma medication other than beta‐agonists, theophylline or cromolyn sodium; historical or current evidence of significant concomitant disease; use of oral contraceptives or other hormonal therapy; current use of prescription or over the counter medication known to interact with corticosteroids or to cause an abnormal response to exogenous glucocorticoids or reversal of normal nocturnal sleeping hours | |
| Interventions | FP200 versus FP500 versus Placebo. Delivery device: Rotadisk. Duration of study: 4 weeks | |
| Outcomes | AUC; Plasma cortisol; withdrawals; adverse events | |
| Notes | ||
| Risk of bias | ||
| Bias | Authors' judgement | Support for judgement |
| Adequate sequence generation? | Low risk | Computer‐generated randomisation. |
| Allocation concealment? | Unclear risk | Information not available |
| Blinding? | Low risk | Identical inhaler devices |
| Methods | Randomised, double‐blind parallel group, multi‐centre (Eastern Europe) study. Method of randomisation: computer‐generated randomisation schedule; Blinding ‐ both FP doses administered via Diskus. Withdrawals: FP200: 97/267; FP400: 83/261 ‐ High withdrawal rate as some trial centres did not participate in extension beyond 16 weeks. Ns used based on correspondence with GSK. Jadad score: 5 | |
| Participants | N = 528 (FP200: 267; FP400: 261); Mean age: FP200: 7.8 (SD 2.1); FP400: 7.9 (SD 2); M/F (%): FP200: 72/28; FP400: 72/28; Ethnicity: White/non‐white (%): FP200: >99/<1; FP400: 100/0; mean duration of asthma symptoms (years): FP200: 3.82 (SD 2.2); FP400: 4.05 (SD 2.37); Treatment with BUD/FP/BDP/FLUN (%): FP200: 38/26/25/1; FP400: 41/33/24/<1; mean clinic PEF (% predicted): FP200: 105.1 (21.7); FP400: 101.6 (22.4); mean am PEF (L/min): FP200: 256.9 (SD 75); FP400: 255.4 (SD 72.2); pm PEF (L/min): 265.9 (SD 73.1); FP400: 261.3 (SD 72.2) | |
| Interventions | FP200 versus FP400 via Diskus inhaler. Study duration 52 weeks (2 week run‐in). Participants were allowed to take: oral theophylline, SABAs, DSCG or nedocromil sodium | |
| Outcomes | Asthma exacerbations; clinic PEF; diary PEF (am& pm); symptoms; adverse events | |
| Notes | GSK responded with data on Ns and means/SEMs 060904 | |
| Risk of bias | ||
| Bias | Authors' judgement | Support for judgement |
| Adequate sequence generation? | Low risk | See Appendix 2 |
| Allocation concealment? | Low risk | See Appendix 2 |
| Blinding? | Low risk | Identical inhaler devices |
| Methods | Randomised, double‐blind, parallel group trial. Method of randomisation: not reported. Blinding: identical inhalers. Withdrawals: FP400: N = 3; FP1000: N = 3. Unclear population for analysis ‐ assumed non‐ITT Jadad score: 4 | |
| Participants | N = 56 (FP400: 19; FP1000: 19; FP+SAL: 18 ‐ baseline characteristics reported only for FP groups); M/F: FP400: 8/11; FP1000: 9/10; Mean age: FP400: 42 (SEM 12); FP1000: 40 (SEM 15); Asthma duration (months): FP400: 206 (SEM 130); FP1000: 176 (SEM 169); FEV1 L: FP400: 3.0 (SEM 0.9); FP1000: 3.3 (SEM 0.9); FEV1 % predicted: FP400: 91 (SEM 20); FP1000: 92 (SEM 12); PC20 mg/mL: FP400: 1.86 (SEM 2.33); FP1000: 6.22 (SEM 7.54); Reversibility (%): FP400: FEV1: 12 (SEM 11); PEF: 24 (SEM 19); FP1000: FEV1: 12 (SEM 11); PEF: 20 (SEM 17). Run‐in treatment: FP400: BUD: 2; BDP: 2; FP: 5; FP1000: BUD: 14; BDP: 2; FP: 3 Inclusion criteria: Symptomatic asthma during run‐in period in spite of normal medication (frequent asthma symptoms, need for SABAs, >/=20% variation between am and pm PEF); Lung function: 15% increase in FEV1 post‐SABA; PC20 methacholine <4mg/mL Exclusion criteria: RTI in previous four weeks | |
| Interventions | FP200 BID (400mcg/d) versus FP500 BID (1000 mcg/d) via Diskus inhaler. SABA prn concomitant therapy. Study duration: 12 weeks (2 week run‐in period) | |
| Outcomes | PEF; FEV1; Bronchial lavage; immunohistochemistry | |
| Notes | ||
| Risk of bias | ||
| Bias | Authors' judgement | Support for judgement |
| Adequate sequence generation? | Low risk | See Appendix 2 |
| Allocation concealment? | Low risk | See Appendix 2 |
| Blinding? | Low risk | Identical inhaler devices |
| Methods | Setting: multicentre study USA, primary care and hospital outpatient clinics | |
| Participants | 331 adults randomised, 265 completed: 265M 66F Age range 12‐74 years Inclusion criteria: Diagnosis of asthma (ATS criteria 1987) for at least 6 months FEV1 50‐80 (% predicted) 15% or greater reversibility in FEV1 after inhaled beta2 agonist During run‐in: 12 or less puffs/day albuterol 4 or less mornings when PEFR decreased 20% or less than previous night PEFR 2 or less nights wakening requiring albuterol Good compliance Exclusion criteria: Smoking Use of any oral, inhaled or topical steroid within last month of study Oral steroids for 2 months or longer within last 6 month | |
| Interventions | 1. FP 50 mcg 1 actuation 2xdaily (100 mcg/d) 2. FP 100 mcg 1 actuation 2xdaily (200 mcg/d) 3. FP 250 mcg 1 actuation 2xdaily (500 mcg/d) Delivery device: Diskhaler DPI | |
| Outcomes | Outcomes expressed as change compared to baseline: FEV1 FVC FEF 25‐75% Morning PEFR Evening PEFR Daily asthma score Change in night time awakenings Daily use of beta2 agonist Probability of remaining in study Physician global assessment of efficacy Oro‐pharyngeal side effects | |
| Notes | No reply from author to clarify details of randomisation method For continuous outcomes change scores from baseline to endpoint (i.e. point of withdrawal) were reported A priori criteria for withdrawal due to lack of efficacy were established based on FEV1, morning PEFR, night‐time awakenings or clinical exacerbation requiring emergency hospital treatment Study also included a placebo treatment arm: results not considered in this review | |
| Risk of bias | ||
| Bias | Authors' judgement | Support for judgement |
| Adequate sequence generation? | Unclear risk | Described as randomised; other information not available |
| Allocation concealment? | Unclear risk | Information not available |
| Blinding? | Low risk | Identical inhaler devices |
| Methods | Setting: multicentre study USA, hospital outpatient clinics | |
| Participants | 304 adults: 169M 135F Age range: 12‐87 years Inclusion criteria: 12 years of age or older Diagnosis of moderate asthma, for at least 6 months Current treatment with inhaled corticosteroids and regular/as needed beta2 agonists Exclusion criteria: During run‐in period: More than 12 puffs albuterol daily for 3 or more days Diurnal variation in PEFR > 20% for 4 or more days Awakening more than 2 nights due to asthma symptoms And: Systemic steroids in last month Significant concurrent disease Pregnancy or lactation | |
| Interventions | 1. FP 100 mcg 2xdaily (200 mcg/d) 2. FP 250 mcg 2xdaily (500 mcg/d) 3. FP 500 mcg 2xdaily (1000 mcg/d) Delivery device: MDI | |
| Outcomes | Outcomes expressed as change compared to baseline: FEV1 Morning PEFR Evening PEFR Daily use of beta2 agonist Daily cough score Daily wheezing score Daily breathlessness score Daily asthma symptom score Probability of remaining in the study Physician related global assessment of efficacy Oro‐pharyngeal side effects Morning plasma cortisol | |
| Notes | No reply from author to clarify details of randomisation method For continuous outcomes change scores from baseline to endpoint (i.e. point of withdrawal) were reported A priori criteria for withdrawal due to lack of efficacy were established based on FEV1, morning PEFR, night‐time awakenings or clinical exacerbation requiring emergency hospital treatment Study also included a placebo treatment arm: results not considered in this review | |
| Risk of bias | ||
| Bias | Authors' judgement | Support for judgement |
| Adequate sequence generation? | Unclear risk | Described as randomised; no other information available |
| Allocation concealment? | Unclear risk | Information not available |
| Blinding? | Low risk | Identical inhaler devices |
ACTH: adrenocorticotropic hormone; ATS: American Thoracic Society; BDP: beclomethasone dipropionate; BHR: bronchial hyperresponsiveness; BUD: budesonide; DPI: dry powder inhaler; FEF25‐75: forced expiratory flow at 25 to 75% of FVC; FEV1: forced expired volume in one second; FP: fluticasone propionate; FSC: fluticasone/salmeterol combination; FVC: forced vital capacity; ICS: inhaled corticosteroid; ITT: intension‐to‐treat; mcg/d: micrograms per day; MDI: metered dose inhaler; PC20 FEV1: provocative concentration of inhalant required to produce a 20% fall in FEV1; PD20 FEV1: provocative dose of inhalant required to produce a 20% fall in FEV1; PEFR: peak expiratory flow rate; TA: triamcinolone acetonide
Characteristics of excluded studies [ordered by study ID]
Ir a:
| Study | Reason for exclusion |
| Delivery device comparison | |
| This study assessed a group of young children including infants under the age of two years | |
| Outcomes not relevant | |
| Placebo controlled study | |
| Wrong comparison | |
| Wrong comparison | |
| Varying dose of FP | |
| Wrong comparison | |
| Crossover study with intervention periods of only 4 days | |
| Delivery device comparison | |
| Delivery device comparison | |
| Outcomes not relevant | |
| Wrong comparison | |
| Delivery device comparison | |
| Wrong comparison | |
| Wrong comparison | |
| Comparison of QID versus BID administration of 200mcg FP | |
| Once versus twice daily administration of FP (same dosage with different dosing strategy compared) |
Data and analyses
| Outcome or subgroup title | No. of studies | No. of participants | Statistical method | Effect size |
| 1 Change in FEV1 compared to baseline (litres) Show forest plot | 1 | Mean Difference (IV, Fixed, 95% CI) | Totals not selected | |
| Analysis 1.1  Comparison 1 Parallel group studies, no oral steroids: 50 versus 100 mcg/d (all ages), Outcome 1 Change in FEV1 compared to baseline (litres). | ||||
| 1.1 Children | 0 | Mean Difference (IV, Fixed, 95% CI) | 0.0 [0.0, 0.0] | |
| 1.2 Adults | 1 | Mean Difference (IV, Fixed, 95% CI) | 0.0 [0.0, 0.0] | |
| 2 Change in morning PEFR compared to baseline (L/min) Show forest plot | 1 | Mean Difference (IV, Fixed, 95% CI) | Totals not selected | |
| Analysis 1.2  Comparison 1 Parallel group studies, no oral steroids: 50 versus 100 mcg/d (all ages), Outcome 2 Change in morning PEFR compared to baseline (L/min). | ||||
| 2.1 Children | 0 | Mean Difference (IV, Fixed, 95% CI) | 0.0 [0.0, 0.0] | |
| 2.2 Adults | 1 | Mean Difference (IV, Fixed, 95% CI) | 0.0 [0.0, 0.0] | |
| 3 Change in morning PEFR compared to baseline (L/min) Show forest plot | 1 | Mean Difference (IV, Fixed, 95% CI) | Totals not selected | |
| Analysis 1.3  Comparison 1 Parallel group studies, no oral steroids: 50 versus 100 mcg/d (all ages), Outcome 3 Change in morning PEFR compared to baseline (L/min). | ||||
| 3.1 Children | 0 | Mean Difference (IV, Fixed, 95% CI) | 0.0 [0.0, 0.0] | |
| 3.2 Adults | 1 | Mean Difference (IV, Fixed, 95% CI) | 0.0 [0.0, 0.0] | |
| 4 Change in daily asthma symptom score compared to baseline Show forest plot | 1 | Mean Difference (IV, Fixed, 95% CI) | Totals not selected | |
| Analysis 1.4  Comparison 1 Parallel group studies, no oral steroids: 50 versus 100 mcg/d (all ages), Outcome 4 Change in daily asthma symptom score compared to baseline. | ||||
| 4.1 Children | 0 | Mean Difference (IV, Fixed, 95% CI) | 0.0 [0.0, 0.0] | |
| 4.2 Adults | 1 | Mean Difference (IV, Fixed, 95% CI) | 0.0 [0.0, 0.0] | |
| 5 Change in number of night‐time awakenings/week compared to baseline Show forest plot | 1 | Mean Difference (IV, Fixed, 95% CI) | Totals not selected | |
| Analysis 1.5  Comparison 1 Parallel group studies, no oral steroids: 50 versus 100 mcg/d (all ages), Outcome 5 Change in number of night‐time awakenings/week compared to baseline. | ||||
| 5.1 Children | 0 | Mean Difference (IV, Fixed, 95% CI) | 0.0 [0.0, 0.0] | |
| 5.2 Adults | 1 | Mean Difference (IV, Fixed, 95% CI) | 0.0 [0.0, 0.0] | |
| 6 Change in daily use of beta2 agonist compared to baseline (puffs/d) Show forest plot | 1 | Mean Difference (IV, Fixed, 95% CI) | Totals not selected | |
| Analysis 1.6  Comparison 1 Parallel group studies, no oral steroids: 50 versus 100 mcg/d (all ages), Outcome 6 Change in daily use of beta2 agonist compared to baseline (puffs/d). | ||||
| 6.1 Children | 0 | Mean Difference (IV, Fixed, 95% CI) | 0.0 [0.0, 0.0] | |
| 6.2 Adults | 1 | Mean Difference (IV, Fixed, 95% CI) | 0.0 [0.0, 0.0] | |
| 7 Number of patients withdrawn due to lack of efficacy Show forest plot | 1 | Peto Odds Ratio (Peto, Fixed, 95% CI) | Totals not selected | |
| Analysis 1.7  Comparison 1 Parallel group studies, no oral steroids: 50 versus 100 mcg/d (all ages), Outcome 7 Number of patients withdrawn due to lack of efficacy. | ||||
| 7.1 Children | 0 | Peto Odds Ratio (Peto, Fixed, 95% CI) | 0.0 [0.0, 0.0] | |
| 7.2 Adults | 1 | Peto Odds Ratio (Peto, Fixed, 95% CI) | 0.0 [0.0, 0.0] | |
| Outcome or subgroup title | No. of studies | No. of participants | Statistical method | Effect size |
| 1 Change in FEV1 compared to baseline (litres) Show forest plot | 2 | Mean Difference (IV, Fixed, 95% CI) | Subtotals only | |
| Analysis 2.1  Comparison 2 Parallel group studies, no oral steroids: 50 versus 200 mcg/d (all ages), Outcome 1 Change in FEV1 compared to baseline (litres). | ||||
| 1.1 Children | 0 | 0 | Mean Difference (IV, Fixed, 95% CI) | 0.0 [0.0, 0.0] |
| 1.2 Adults | 2 | 313 | Mean Difference (IV, Fixed, 95% CI) | ‐0.04 [‐0.16, 0.08] |
| 2 Change in FVC compared to baseline (litres) Show forest plot | 1 | Mean Difference (IV, Fixed, 95% CI) | Totals not selected | |
| Analysis 2.2  Comparison 2 Parallel group studies, no oral steroids: 50 versus 200 mcg/d (all ages), Outcome 2 Change in FVC compared to baseline (litres). | ||||
| 2.1 Children | 0 | Mean Difference (IV, Fixed, 95% CI) | 0.0 [0.0, 0.0] | |
| 2.2 Adults | 1 | Mean Difference (IV, Fixed, 95% CI) | 0.0 [0.0, 0.0] | |
| 3 Change in FEF25‐75 compared to baseline (L/second) Show forest plot | 1 | Mean Difference (IV, Fixed, 95% CI) | Totals not selected | |
| Analysis 2.3  Comparison 2 Parallel group studies, no oral steroids: 50 versus 200 mcg/d (all ages), Outcome 3 Change in FEF25‐75 compared to baseline (L/second). | ||||
| 3.1 Children | 0 | Mean Difference (IV, Fixed, 95% CI) | 0.0 [0.0, 0.0] | |
| 3.2 Adults | 1 | Mean Difference (IV, Fixed, 95% CI) | 0.0 [0.0, 0.0] | |
| 4 Change in morning PEFR compared to baseline (L/min) Show forest plot | 2 | Mean Difference (IV, Fixed, 95% CI) | Subtotals only | |
| Analysis 2.4  Comparison 2 Parallel group studies, no oral steroids: 50 versus 200 mcg/d (all ages), Outcome 4 Change in morning PEFR compared to baseline (L/min). | ||||
| 4.1 Children | 0 | 0 | Mean Difference (IV, Fixed, 95% CI) | 0.0 [0.0, 0.0] |
| 4.2 Adults | 2 | 313 | Mean Difference (IV, Fixed, 95% CI) | ‐7.49 [‐17.31, 2.33] |
| 5 Change in evening PEFR compared to baseline (L/min) Show forest plot | 2 | Mean Difference (IV, Fixed, 95% CI) | Subtotals only | |
| Analysis 2.5  Comparison 2 Parallel group studies, no oral steroids: 50 versus 200 mcg/d (all ages), Outcome 5 Change in evening PEFR compared to baseline (L/min). | ||||
| 5.1 Children | 0 | 0 | Mean Difference (IV, Fixed, 95% CI) | 0.0 [0.0, 0.0] |
| 5.2 Adults | 2 | 313 | Mean Difference (IV, Fixed, 95% CI) | ‐7.95 [‐17.24, 1.34] |
| 6 Change in daily asthma symptom score compared to baseline Show forest plot | 2 | 313 | Std. Mean Difference (IV, Fixed, 95% CI) | 0.32 [0.10, 0.54] |
| Analysis 2.6  Comparison 2 Parallel group studies, no oral steroids: 50 versus 200 mcg/d (all ages), Outcome 6 Change in daily asthma symptom score compared to baseline. | ||||
| 6.1 Children | 0 | 0 | Std. Mean Difference (IV, Fixed, 95% CI) | 0.0 [0.0, 0.0] |
| 6.2 Adults | 2 | 313 | Std. Mean Difference (IV, Fixed, 95% CI) | 0.32 [0.10, 0.54] |
| 7 Change in number of night‐time awakenings/week compared to baseline Show forest plot | 2 | 313 | Mean Difference (IV, Fixed, 95% CI) | 0.09 [0.02, 0.16] |
| Analysis 2.7  Comparison 2 Parallel group studies, no oral steroids: 50 versus 200 mcg/d (all ages), Outcome 7 Change in number of night‐time awakenings/week compared to baseline. | ||||
| 7.1 Children | 0 | 0 | Mean Difference (IV, Fixed, 95% CI) | 0.0 [0.0, 0.0] |
| 7.2 Adults | 2 | 313 | Mean Difference (IV, Fixed, 95% CI) | 0.09 [0.02, 0.16] |
| 8 Change in daily use of beta2 agonist compared to baseline (puffs/d) Show forest plot | 2 | 313 | Mean Difference (IV, Fixed, 95% CI) | 0.07 [‐0.37, 0.51] |
| Analysis 2.8  Comparison 2 Parallel group studies, no oral steroids: 50 versus 200 mcg/d (all ages), Outcome 8 Change in daily use of beta2 agonist compared to baseline (puffs/d). | ||||
| 8.1 Children | 0 | 0 | Mean Difference (IV, Fixed, 95% CI) | 0.0 [0.0, 0.0] |
| 8.2 Adults | 2 | 313 | Mean Difference (IV, Fixed, 95% CI) | 0.07 [‐0.37, 0.51] |
| 9 Number of patients withdrawn due to lack of efficacy Show forest plot | 2 | 313 | Peto Odds Ratio (Peto, Fixed, 95% CI) | 1.48 [0.88, 2.46] |
| Analysis 2.9  Comparison 2 Parallel group studies, no oral steroids: 50 versus 200 mcg/d (all ages), Outcome 9 Number of patients withdrawn due to lack of efficacy. | ||||
| 9.1 Children | 0 | 0 | Peto Odds Ratio (Peto, Fixed, 95% CI) | 0.0 [0.0, 0.0] |
| 9.2 Adults | 2 | 313 | Peto Odds Ratio (Peto, Fixed, 95% CI) | 1.48 [0.88, 2.46] |
| 10 Hoarseness or dysphonia (No. of patients) Show forest plot | 2 | 322 | Peto Odds Ratio (Peto, Fixed, 95% CI) | 0.52 [0.14, 1.97] |
| Analysis 2.10  Comparison 2 Parallel group studies, no oral steroids: 50 versus 200 mcg/d (all ages), Outcome 10 Hoarseness or dysphonia (No. of patients). | ||||
| 10.1 Children | 0 | 0 | Peto Odds Ratio (Peto, Fixed, 95% CI) | 0.0 [0.0, 0.0] |
| 10.2 Adults | 2 | 322 | Peto Odds Ratio (Peto, Fixed, 95% CI) | 0.52 [0.14, 1.97] |
| 11 Oral Candidiasis (No. of patients) Show forest plot | 2 | 322 | Peto Odds Ratio (Peto, Fixed, 95% CI) | 0.27 [0.05, 1.35] |
| Analysis 2.11  Comparison 2 Parallel group studies, no oral steroids: 50 versus 200 mcg/d (all ages), Outcome 11 Oral Candidiasis (No. of patients). | ||||
| 11.1 Children | 0 | 0 | Peto Odds Ratio (Peto, Fixed, 95% CI) | 0.0 [0.0, 0.0] |
| 11.2 Adults | 2 | 322 | Peto Odds Ratio (Peto, Fixed, 95% CI) | 0.27 [0.05, 1.35] |
| 12 Physician global rated efficacy: ineffective Show forest plot | 1 | Peto Odds Ratio (Peto, Fixed, 95% CI) | Totals not selected | |
| Analysis 2.12  Comparison 2 Parallel group studies, no oral steroids: 50 versus 200 mcg/d (all ages), Outcome 12 Physician global rated efficacy: ineffective. | ||||
| 12.1 Children | 0 | Peto Odds Ratio (Peto, Fixed, 95% CI) | 0.0 [0.0, 0.0] | |
| 12.2 Adults | 1 | Peto Odds Ratio (Peto, Fixed, 95% CI) | 0.0 [0.0, 0.0] | |
| Outcome or subgroup title | No. of studies | No. of participants | Statistical method | Effect size |
| 1 Change in FEV1 compared to baseline (litres) Show forest plot | 10 | Litres (Fixed, 95% CI) | Subtotals only | |
| Analysis 3.1  Comparison 3 Parallel group studies, no oral steroids: 100 versus 200 mcg/d (all ages), Outcome 1 Change in FEV1 compared to baseline (litres). | ||||
| 1.1 Children | 4 | 656 | Litres (Fixed, 95% CI) | ‐0.04 [‐0.09, 0.01] |
| 1.2 Adults | 6 | 887 | Litres (Fixed, 95% CI) | 0.03 [‐0.02, 0.07] |
| 2 Change in FEV1 compared to baseline (litres) Show forest plot | 10 | Mean Difference (IV, Fixed, 95% CI) | Subtotals only | |
| Analysis 3.2  Comparison 3 Parallel group studies, no oral steroids: 100 versus 200 mcg/d (all ages), Outcome 2 Change in FEV1 compared to baseline (litres). | ||||
| 2.1 Children | 4 | 656 | Mean Difference (IV, Fixed, 95% CI) | ‐0.03 [‐0.08, 0.02] |
| 2.2 Adults | 6 | 887 | Mean Difference (IV, Fixed, 95% CI) | 0.01 [‐0.05, 0.07] |
| 3 FEV1 (% predicted) Show forest plot | 2 | Mean Difference (IV, Fixed, 95% CI) | Totals not selected | |
| Analysis 3.3  Comparison 3 Parallel group studies, no oral steroids: 100 versus 200 mcg/d (all ages), Outcome 3 FEV1 (% predicted). | ||||
| 3.1 Children | 1 | Mean Difference (IV, Fixed, 95% CI) | 0.0 [0.0, 0.0] | |
| 3.2 Adults | 1 | Mean Difference (IV, Fixed, 95% CI) | 0.0 [0.0, 0.0] | |
| 4 FEV1 (% predicted) Show forest plot | 2 | 432 | % (Fixed, 95% CI) | ‐0.52 [‐3.83, 2.79] |
| Analysis 3.4  Comparison 3 Parallel group studies, no oral steroids: 100 versus 200 mcg/d (all ages), Outcome 4 FEV1 (% predicted). | ||||
| 4.1 Children | 1 | 179 | % (Fixed, 95% CI) | ‐2.0 [‐6.00, 2.00] |
| 4.2 Adults | 1 | 253 | % (Fixed, 95% CI) | 2.70 [‐3.19, 8.59] |
| 5 FEV1 Litres Show forest plot | 1 | Mean Difference (IV, Fixed, 95% CI) | Totals not selected | |
| Analysis 3.5  Comparison 3 Parallel group studies, no oral steroids: 100 versus 200 mcg/d (all ages), Outcome 5 FEV1 Litres. | ||||
| 5.1 Children | 0 | Mean Difference (IV, Fixed, 95% CI) | 0.0 [0.0, 0.0] | |
| 5.2 Adults | 1 | Mean Difference (IV, Fixed, 95% CI) | 0.0 [0.0, 0.0] | |
| 6 PEF (L/min) Show forest plot | 1 | Mean Difference (IV, Fixed, 95% CI) | Totals not selected | |
| Analysis 3.6  Comparison 3 Parallel group studies, no oral steroids: 100 versus 200 mcg/d (all ages), Outcome 6 PEF (L/min). | ||||
| 6.1 Children | 0 | Mean Difference (IV, Fixed, 95% CI) | 0.0 [0.0, 0.0] | |
| 6.2 Adults | 1 | Mean Difference (IV, Fixed, 95% CI) | 0.0 [0.0, 0.0] | |
| 7 Change in clinic PEFR compared to baseline (L/min) Show forest plot | 2 | Mean Difference (IV, Fixed, 95% CI) | Subtotals only | |
| Analysis 3.7  Comparison 3 Parallel group studies, no oral steroids: 100 versus 200 mcg/d (all ages), Outcome 7 Change in clinic PEFR compared to baseline (L/min). | ||||
| 7.1 Children | 2 | 351 | Mean Difference (IV, Fixed, 95% CI) | 3.00 [‐6.84, 12.84] |
| 7.2 Adults | 0 | 0 | Mean Difference (IV, Fixed, 95% CI) | 0.0 [0.0, 0.0] |
| 8 Change in morning PEFR compared to baseline (L/min) Show forest plot | 11 | Mean Difference (IV, Fixed, 95% CI) | Subtotals only | |
| Analysis 3.8  Comparison 3 Parallel group studies, no oral steroids: 100 versus 200 mcg/d (all ages), Outcome 8 Change in morning PEFR compared to baseline (L/min). | ||||
| 8.1 Children | 4 | 710 | Mean Difference (IV, Fixed, 95% CI) | ‐3.67 [‐9.81, 2.46] |
| 8.2 Adults | 7 | 1148 | Mean Difference (IV, Fixed, 95% CI) | ‐7.04 [‐11.87, ‐2.20] |
| 9 Change in evening PEFR compared to baseline (L/min) Show forest plot | 6 | Mean Difference (IV, Fixed, 95% CI) | Subtotals only | |
| Analysis 3.9  Comparison 3 Parallel group studies, no oral steroids: 100 versus 200 mcg/d (all ages), Outcome 9 Change in evening PEFR compared to baseline (L/min). | ||||
| 9.1 Children | 2 | 351 | Mean Difference (IV, Fixed, 95% CI) | ‐4.50 [‐11.77, 2.77] |
| 9.2 Adults | 4 | 648 | Mean Difference (IV, Fixed, 95% CI) | ‐7.04 [‐12.66, ‐1.43] |
| 10 Rescue medication usage Show forest plot | 1 | Mean Difference (IV, Fixed, 95% CI) | Totals not selected | |
| Analysis 3.10  Comparison 3 Parallel group studies, no oral steroids: 100 versus 200 mcg/d (all ages), Outcome 10 Rescue medication usage. | ||||
| 10.1 Children | 0 | Mean Difference (IV, Fixed, 95% CI) | 0.0 [0.0, 0.0] | |
| 10.2 Adults | 1 | Mean Difference (IV, Fixed, 95% CI) | 0.0 [0.0, 0.0] | |
| 11 Change in daily use of beta2 agonist compared to baseline (puffs/d) Show forest plot | 9 | 1409 | Mean Difference (IV, Fixed, 95% CI) | 0.14 [‐0.09, 0.37] |
| Analysis 3.11  Comparison 3 Parallel group studies, no oral steroids: 100 versus 200 mcg/d (all ages), Outcome 11 Change in daily use of beta2 agonist compared to baseline (puffs/d). | ||||
| 11.1 Children | 3 | 522 | Mean Difference (IV, Fixed, 95% CI) | 0.18 [‐0.14, 0.49] |
| 11.2 Adults | 6 | 887 | Mean Difference (IV, Fixed, 95% CI) | 0.10 [‐0.21, 0.42] |
| 12 Symptom scores Show forest plot | 1 | Mean Difference (IV, Fixed, 95% CI) | Totals not selected | |
| Analysis 3.12  Comparison 3 Parallel group studies, no oral steroids: 100 versus 200 mcg/d (all ages), Outcome 12 Symptom scores. | ||||
| 12.1 Children | 0 | Mean Difference (IV, Fixed, 95% CI) | 0.0 [0.0, 0.0] | |
| 12.2 Adults | 1 | Mean Difference (IV, Fixed, 95% CI) | 0.0 [0.0, 0.0] | |
| 13 Change in daily asthma symptom score compared to baseline Show forest plot | 8 | 1252 | Std. Mean Difference (IV, Fixed, 95% CI) | 0.04 [‐0.07, 0.15] |
| Analysis 3.13  Comparison 3 Parallel group studies, no oral steroids: 100 versus 200 mcg/d (all ages), Outcome 13 Change in daily asthma symptom score compared to baseline. | ||||
| 13.1 Children | 3 | 522 | Std. Mean Difference (IV, Fixed, 95% CI) | 0.01 [‐0.17, 0.18] |
| 13.2 Adults | 5 | 730 | Std. Mean Difference (IV, Fixed, 95% CI) | 0.06 [‐0.08, 0.21] |
| 14 Change in number of night‐time awakenings/week compared to baseline Show forest plot | 4 | 661 | Mean Difference (IV, Fixed, 95% CI) | 0.05 [0.01, 0.09] |
| Analysis 3.14  Comparison 3 Parallel group studies, no oral steroids: 100 versus 200 mcg/d (all ages), Outcome 14 Change in number of night‐time awakenings/week compared to baseline. | ||||
| 14.1 Children | 0 | 0 | Mean Difference (IV, Fixed, 95% CI) | 0.0 [0.0, 0.0] |
| 14.2 Adults | 4 | 661 | Mean Difference (IV, Fixed, 95% CI) | 0.05 [0.01, 0.09] |
| 15 Percentage of symptom‐free days Show forest plot | 1 | Mean Difference (IV, Fixed, 95% CI) | Totals not selected | |
| Analysis 3.15  Comparison 3 Parallel group studies, no oral steroids: 100 versus 200 mcg/d (all ages), Outcome 15 Percentage of symptom‐free days. | ||||
| 15.1 Children | 0 | Mean Difference (IV, Fixed, 95% CI) | 0.0 [0.0, 0.0] | |
| 15.2 Adults | 1 | Mean Difference (IV, Fixed, 95% CI) | 0.0 [0.0, 0.0] | |
| 16 Change in night‐time awakening score compared to baseline Show forest plot | 6 | 921 | Std. Mean Difference (IV, Fixed, 95% CI) | 0.17 [0.04, 0.30] |
| Analysis 3.16  Comparison 3 Parallel group studies, no oral steroids: 100 versus 200 mcg/d (all ages), Outcome 16 Change in night‐time awakening score compared to baseline. | ||||
| 16.1 Children | 2 | 351 | Std. Mean Difference (IV, Fixed, 95% CI) | 0.17 [‐0.04, 0.38] |
| 16.2 Adults | 4 | 570 | Std. Mean Difference (IV, Fixed, 95% CI) | 0.17 [0.01, 0.34] |
| 17 HRQOL: Functional Status IIR questionaire (short version) Show forest plot | 1 | Mean Difference (IV, Fixed, 95% CI) | Totals not selected | |
| Analysis 3.17  Comparison 3 Parallel group studies, no oral steroids: 100 versus 200 mcg/d (all ages), Outcome 17 HRQOL: Functional Status IIR questionaire (short version). | ||||
| 17.1 Children | 1 | Mean Difference (IV, Fixed, 95% CI) | 0.0 [0.0, 0.0] | |
| 17.2 Adults | 0 | Mean Difference (IV, Fixed, 95% CI) | 0.0 [0.0, 0.0] | |
| 18 HRQOL: Sleep Scale Children questionnaire Show forest plot | 1 | Mean Difference (IV, Fixed, 95% CI) | Totals not selected | |
| Analysis 3.18  Comparison 3 Parallel group studies, no oral steroids: 100 versus 200 mcg/d (all ages), Outcome 18 HRQOL: Sleep Scale Children questionnaire. | ||||
| 18.1 Children | 1 | Mean Difference (IV, Fixed, 95% CI) | 0.0 [0.0, 0.0] | |
| 18.2 Adults | 0 | Mean Difference (IV, Fixed, 95% CI) | 0.0 [0.0, 0.0] | |
| 19 HRQOL: Quality of Life of Parents of Asthmatic Children questionnaire, burden dimension Show forest plot | 1 | Mean Difference (IV, Fixed, 95% CI) | Totals not selected | |
| Analysis 3.19  Comparison 3 Parallel group studies, no oral steroids: 100 versus 200 mcg/d (all ages), Outcome 19 HRQOL: Quality of Life of Parents of Asthmatic Children questionnaire, burden dimension. | ||||
| 19.1 Children | 1 | Mean Difference (IV, Fixed, 95% CI) | 0.0 [0.0, 0.0] | |
| 19.2 Adults | 0 | Mean Difference (IV, Fixed, 95% CI) | 0.0 [0.0, 0.0] | |
| 20 HRQOL: Quality of Life of Parents of Asthmatic Children questionnaire, subjective norms dimension Show forest plot | 1 | Mean Difference (IV, Fixed, 95% CI) | Totals not selected | |
| Analysis 3.20  Comparison 3 Parallel group studies, no oral steroids: 100 versus 200 mcg/d (all ages), Outcome 20 HRQOL: Quality of Life of Parents of Asthmatic Children questionnaire, subjective norms dimension. | ||||
| 20.1 Children | 1 | Mean Difference (IV, Fixed, 95% CI) | 0.0 [0.0, 0.0] | |
| 20.2 Adults | 0 | Mean Difference (IV, Fixed, 95% CI) | 0.0 [0.0, 0.0] | |
| 21 HRQOL: Quality of Life of Parents of Asthmatic Children questionnaire, subjective norms dimension Show forest plot | 1 | Mean Difference (IV, Fixed, 95% CI) | Totals not selected | |
| Analysis 3.21  Comparison 3 Parallel group studies, no oral steroids: 100 versus 200 mcg/d (all ages), Outcome 21 HRQOL: Quality of Life of Parents of Asthmatic Children questionnaire, subjective norms dimension. | ||||
| 21.1 Children | 1 | Mean Difference (IV, Fixed, 95% CI) | 0.0 [0.0, 0.0] | |
| 21.2 Adults | 0 | Mean Difference (IV, Fixed, 95% CI) | 0.0 [0.0, 0.0] | |
| 22 Physician global rated efficacy: ineffective Show forest plot | 2 | 357 | Peto Odds Ratio (Peto, Fixed, 95% CI) | 1.37 [0.77, 2.44] |
| Analysis 3.22  Comparison 3 Parallel group studies, no oral steroids: 100 versus 200 mcg/d (all ages), Outcome 22 Physician global rated efficacy: ineffective. | ||||
| 22.1 Children | 0 | 0 | Peto Odds Ratio (Peto, Fixed, 95% CI) | 0.0 [0.0, 0.0] |
| 22.2 Adults | 2 | 357 | Peto Odds Ratio (Peto, Fixed, 95% CI) | 1.37 [0.77, 2.44] |
| 23 Withdrawal due to asthma exacerbation (No. of patients) Show forest plot | 1 | Peto Odds Ratio (Peto, Fixed, 95% CI) | Totals not selected | |
| Analysis 3.23  Comparison 3 Parallel group studies, no oral steroids: 100 versus 200 mcg/d (all ages), Outcome 23 Withdrawal due to asthma exacerbation (No. of patients). | ||||
| 23.1 Children | 1 | Peto Odds Ratio (Peto, Fixed, 95% CI) | 0.0 [0.0, 0.0] | |
| 23.2 Adults | 0 | Peto Odds Ratio (Peto, Fixed, 95% CI) | 0.0 [0.0, 0.0] | |
| 24 Withdrawals due to adverse events Show forest plot | 3 | 627 | Odds Ratio (M‐H, Fixed, 95% CI) | 1.16 [0.54, 2.47] |
| Analysis 3.24  Comparison 3 Parallel group studies, no oral steroids: 100 versus 200 mcg/d (all ages), Outcome 24 Withdrawals due to adverse events. | ||||
| 24.1 Children | 0 | 0 | Odds Ratio (M‐H, Fixed, 95% CI) | 0.0 [0.0, 0.0] |
| 24.2 Adults | 3 | 627 | Odds Ratio (M‐H, Fixed, 95% CI) | 1.16 [0.54, 2.47] |
| 25 Number of patients withdrawn due to lack of efficacy Show forest plot | 9 | 1657 | Peto Odds Ratio (Peto, Fixed, 95% CI) | 1.01 [0.76, 1.35] |
| Analysis 3.25  Comparison 3 Parallel group studies, no oral steroids: 100 versus 200 mcg/d (all ages), Outcome 25 Number of patients withdrawn due to lack of efficacy. | ||||
| 25.1 Children | 3 | 522 | Peto Odds Ratio (Peto, Fixed, 95% CI) | 1.25 [0.79, 1.97] |
| 25.2 Adults | 6 | 1135 | Peto Odds Ratio (Peto, Fixed, 95% CI) | 0.88 [0.61, 1.28] |
| 26 Oral Candidiasis (No. of patients) Show forest plot | 6 | 1150 | Peto Odds Ratio (Peto, Fixed, 95% CI) | 0.98 [0.46, 2.08] |
| Analysis 3.26  Comparison 3 Parallel group studies, no oral steroids: 100 versus 200 mcg/d (all ages), Outcome 26 Oral Candidiasis (No. of patients). | ||||
| 26.1 Children | 2 | 391 | Peto Odds Ratio (Peto, Fixed, 95% CI) | 1.33 [0.30, 5.90] |
| 26.2 Adults | 4 | 759 | Peto Odds Ratio (Peto, Fixed, 95% CI) | 0.88 [0.37, 2.11] |
| 27 Headaches Show forest plot | 3 | 511 | Peto Odds Ratio (Peto, Fixed, 95% CI) | 0.62 [0.15, 2.60] |
| Analysis 3.27  Comparison 3 Parallel group studies, no oral steroids: 100 versus 200 mcg/d (all ages), Outcome 27 Headaches. | ||||
| 27.1 Children | 0 | 0 | Peto Odds Ratio (Peto, Fixed, 95% CI) | 0.0 [0.0, 0.0] |
| 27.2 Adults | 3 | 511 | Peto Odds Ratio (Peto, Fixed, 95% CI) | 0.62 [0.15, 2.60] |
| 28 Sore throat or pharyngitis (No. of patients) Show forest plot | 5 | 841 | Peto Odds Ratio (Peto, Fixed, 95% CI) | 1.87 [0.71, 4.93] |
| Analysis 3.28  Comparison 3 Parallel group studies, no oral steroids: 100 versus 200 mcg/d (all ages), Outcome 28 Sore throat or pharyngitis (No. of patients). | ||||
| 28.1 Children | 0 | 0 | Peto Odds Ratio (Peto, Fixed, 95% CI) | 0.0 [0.0, 0.0] |
| 28.2 Adults | 5 | 841 | Peto Odds Ratio (Peto, Fixed, 95% CI) | 1.87 [0.71, 4.93] |
| 29 Hoarseness or dysphonia (No. of patients) Show forest plot | 7 | 1365 | Peto Odds Ratio (Peto, Fixed, 95% CI) | 0.65 [0.27, 1.57] |
| Analysis 3.29  Comparison 3 Parallel group studies, no oral steroids: 100 versus 200 mcg/d (all ages), Outcome 29 Hoarseness or dysphonia (No. of patients). | ||||
| 29.1 Children | 2 | 391 | Peto Odds Ratio (Peto, Fixed, 95% CI) | 1.00 [0.20, 4.99] |
| 29.2 Adults | 5 | 974 | Peto Odds Ratio (Peto, Fixed, 95% CI) | 0.54 [0.19, 1.55] |
| 30 Urinary free cortisol excretion (mcg/24 hours) Show forest plot | 2 | 228 | Mean Difference (IV, Fixed, 95% CI) | ‐0.70 [‐3.73, 2.32] |
| Analysis 3.30  Comparison 3 Parallel group studies, no oral steroids: 100 versus 200 mcg/d (all ages), Outcome 30 Urinary free cortisol excretion (mcg/24 hours). | ||||
| 30.1 Children | 2 | 228 | Mean Difference (IV, Fixed, 95% CI) | ‐0.70 [‐3.73, 2.32] |
| 30.2 Adults | 0 | 0 | Mean Difference (IV, Fixed, 95% CI) | 0.0 [0.0, 0.0] |
| 31 Morning plasma cortisol (mcg/dL) Show forest plot | 3 | 377 | Mean Difference (IV, Fixed, 95% CI) | ‐0.06 [‐1.01, 0.89] |
| Analysis 3.31  Comparison 3 Parallel group studies, no oral steroids: 100 versus 200 mcg/d (all ages), Outcome 31 Morning plasma cortisol (mcg/dL). | ||||
| 31.1 Children | 2 | 333 | Mean Difference (IV, Fixed, 95% CI) | ‐0.07 [‐1.14, 0.99] |
| 31.2 Adults | 1 | 44 | Mean Difference (IV, Fixed, 95% CI) | 0.0 [‐2.09, 2.09] |
| Outcome or subgroup title | No. of studies | No. of participants | Statistical method | Effect size |
| 1 Change in FEV1 compared to baseline based on study duration(litres) ‐ children Show forest plot | 3 | 490 | Litres (Fixed, 95% CI) | ‐0.01 [‐0.07, 0.05] |
| Analysis 4.1  Comparison 4 Parallel group studies, no oral steroids: 100 versus 200 mcg/d (subgroups), Outcome 1 Change in FEV1 compared to baseline based on study duration(litres) ‐ children. | ||||
| 1.1 1‐4 weeks | 0 | 0 | Litres (Fixed, 95% CI) | 0.0 [0.0, 0.0] |
| 1.2 1‐5 months | 3 | 490 | Litres (Fixed, 95% CI) | ‐0.01 [‐0.07, 0.05] |
| 1.3 6 months or more | 0 | 0 | Litres (Fixed, 95% CI) | 0.0 [0.0, 0.0] |
| 2 Change in FEV1 compared to baseline based on study duration (litres) ‐ adults Show forest plot | 6 | Litres (Fixed, 95% CI) | 0.03 [‐0.02, 0.07] | |
| Analysis 4.2  Comparison 4 Parallel group studies, no oral steroids: 100 versus 200 mcg/d (subgroups), Outcome 2 Change in FEV1 compared to baseline based on study duration (litres) ‐ adults. | ||||
| 2.1 1‐4 weeks | 0 | Litres (Fixed, 95% CI) | 0.0 [0.0, 0.0] | |
| 2.2 1‐5 months | 6 | Litres (Fixed, 95% CI) | 0.03 [‐0.02, 0.07] | |
| 2.3 6 months or more | 0 | Litres (Fixed, 95% CI) | 0.0 [0.0, 0.0] | |
| 3 Change in FEV1 compared to baseline (litres) based on delivery devices ‐ children Show forest plot | 3 | Litres (Fixed, 95% CI) | ‐0.01 [‐0.07, 0.05] | |
| Analysis 4.3  Comparison 4 Parallel group studies, no oral steroids: 100 versus 200 mcg/d (subgroups), Outcome 3 Change in FEV1 compared to baseline (litres) based on delivery devices ‐ children. | ||||
| 3.1 MDI | 0 | Litres (Fixed, 95% CI) | 0.0 [0.0, 0.0] | |
| 3.2 DPI | 3 | Litres (Fixed, 95% CI) | ‐0.01 [‐0.07, 0.05] | |
| 4 Change in FEV1 compared to baseline based on delivery devices (litres) ‐ adults Show forest plot | 6 | Litres (Fixed, 95% CI) | 0.03 [‐0.02, 0.07] | |
| Analysis 4.4  Comparison 4 Parallel group studies, no oral steroids: 100 versus 200 mcg/d (subgroups), Outcome 4 Change in FEV1 compared to baseline based on delivery devices (litres) ‐ adults. | ||||
| 4.1 MDI | 3 | Litres (Fixed, 95% CI) | 0.02 [‐0.08, 0.12] | |
| 4.2 DPI | 3 | Litres (Fixed, 95% CI) | 0.03 [‐0.02, 0.08] | |
| 5 Change in FEV1 compared to baseline based on degrees of severity (litres) ‐ children Show forest plot | 3 | Litres (Fixed, 95% CI) | ‐0.01 [‐0.07, 0.05] | |
| Analysis 4.5  Comparison 4 Parallel group studies, no oral steroids: 100 versus 200 mcg/d (subgroups), Outcome 5 Change in FEV1 compared to baseline based on degrees of severity (litres) ‐ children. | ||||
| 5.1 Mild to moderate | 0 | Litres (Fixed, 95% CI) | 0.0 [0.0, 0.0] | |
| 5.2 Moderate | 3 | Litres (Fixed, 95% CI) | ‐0.01 [‐0.07, 0.05] | |
| 6 Change in FEV1 compared to baseline based on degrees of severity (litres) ‐ adults Show forest plot | 6 | Litres (Fixed, 95% CI) | 0.03 [‐0.02, 0.07] | |
| Analysis 4.6  Comparison 4 Parallel group studies, no oral steroids: 100 versus 200 mcg/d (subgroups), Outcome 6 Change in FEV1 compared to baseline based on degrees of severity (litres) ‐ adults. | ||||
| 6.1 Mild to moderate | 0 | Litres (Fixed, 95% CI) | 0.0 [0.0, 0.0] | |
| 6.2 Moderate | 6 | Litres (Fixed, 95% CI) | 0.03 [‐0.02, 0.07] | |
| Outcome or subgroup title | No. of studies | No. of participants | Statistical method | Effect size |
| 1 FEV1 (% predicted) Show forest plot | 4 | 551 | Mean Difference (IV, Fixed, 95% CI) | ‐0.96 [‐3.45, 1.53] |
| Analysis 5.1  Comparison 5 Parallel group studies, no oral steroids: 200 versus 400‐500 mcg/d (all ages), Outcome 1 FEV1 (% predicted). | ||||
| 1.1 Children | 2 | 114 | Mean Difference (IV, Fixed, 95% CI) | ‐2.48 [‐8.60, 3.64] |
| 1.2 Adults | 2 | 437 | Mean Difference (IV, Fixed, 95% CI) | ‐0.66 [‐3.39, 2.06] |
| 2 Change in FEV1 compared to baseline (litres) Show forest plot | 9 | 1283 | Mean Difference (IV, Fixed, 95% CI) | ‐0.01 [‐0.06, 0.04] |
| Analysis 5.2  Comparison 5 Parallel group studies, no oral steroids: 200 versus 400‐500 mcg/d (all ages), Outcome 2 Change in FEV1 compared to baseline (litres). | ||||
| 2.1 Children | 0 | 0 | Mean Difference (IV, Fixed, 95% CI) | 0.0 [0.0, 0.0] |
| 2.2 Adults | 9 | 1283 | Mean Difference (IV, Fixed, 95% CI) | ‐0.01 [‐0.06, 0.04] |
| 3 Change in FEV1 compared to baseline (litres ‐ imputed estimates) Show forest plot | 11 | 1720 | Mean Difference (IV, Fixed, 95% CI) | 0.01 [‐0.04, 0.05] |
| Analysis 5.3  Comparison 5 Parallel group studies, no oral steroids: 200 versus 400‐500 mcg/d (all ages), Outcome 3 Change in FEV1 compared to baseline (litres ‐ imputed estimates). | ||||
| 3.1 Children | 0 | 0 | Mean Difference (IV, Fixed, 95% CI) | 0.0 [0.0, 0.0] |
| 3.2 Adults | 11 | 1720 | Mean Difference (IV, Fixed, 95% CI) | 0.01 [‐0.04, 0.05] |
| 4 Change in FVC compared to baseline (litres) Show forest plot | 1 | Mean Difference (IV, Fixed, 95% CI) | Totals not selected | |
| Analysis 5.4  Comparison 5 Parallel group studies, no oral steroids: 200 versus 400‐500 mcg/d (all ages), Outcome 4 Change in FVC compared to baseline (litres). | ||||
| 4.1 Children | 0 | Mean Difference (IV, Fixed, 95% CI) | 0.0 [0.0, 0.0] | |
| 4.2 Adults | 1 | Mean Difference (IV, Fixed, 95% CI) | 0.0 [0.0, 0.0] | |
| 5 Change in FEF25‐75 compared to baseline (L/second) Show forest plot | 1 | Mean Difference (IV, Fixed, 95% CI) | Totals not selected | |
| Analysis 5.5  Comparison 5 Parallel group studies, no oral steroids: 200 versus 400‐500 mcg/d (all ages), Outcome 5 Change in FEF25‐75 compared to baseline (L/second). | ||||
| 5.1 Children | 0 | Mean Difference (IV, Fixed, 95% CI) | 0.0 [0.0, 0.0] | |
| 5.2 Adults | 1 | Mean Difference (IV, Fixed, 95% CI) | 0.0 [0.0, 0.0] | |
| 6 Change in morning PEFR compared to baseline (L/min ‐ imputed/estimated values) Show forest plot | 13 | Litres/min (Fixed, 95% CI) | Subtotals only | |
| Analysis 5.6  Comparison 5 Parallel group studies, no oral steroids: 200 versus 400‐500 mcg/d (all ages), Outcome 6 Change in morning PEFR compared to baseline (L/min ‐ imputed/estimated values). | ||||
| 6.1 Children | 2 | 876 | Litres/min (Fixed, 95% CI) | ‐7.92 [‐12.93, ‐2.91] |
| 6.2 Adults | 11 | 1713 | Litres/min (Fixed, 95% CI) | ‐1.97 [‐5.77, 1.82] |
| 7 Change in morning PEFR compared to baseline (L/min) Show forest plot | 13 | Mean Difference (IV, Fixed, 95% CI) | Subtotals only | |
| Analysis 5.7  Comparison 5 Parallel group studies, no oral steroids: 200 versus 400‐500 mcg/d (all ages), Outcome 7 Change in morning PEFR compared to baseline (L/min). | ||||
| 7.1 Children | 2 | 876 | Mean Difference (IV, Fixed, 95% CI) | ‐7.92 [‐12.93, ‐2.91] |
| 7.2 Adults | 11 | 1703 | Mean Difference (IV, Fixed, 95% CI) | ‐4.84 [‐9.37, ‐0.31] |
| 8 Change in evening PEFR compared to baseline (L/min) Show forest plot | 7 | Mean Difference (IV, Fixed, 95% CI) | Subtotals only | |
| Analysis 5.8  Comparison 5 Parallel group studies, no oral steroids: 200 versus 400‐500 mcg/d (all ages), Outcome 8 Change in evening PEFR compared to baseline (L/min). | ||||
| 8.1 Children | 2 | 874 | Mean Difference (IV, Fixed, 95% CI) | ‐9.36 [‐14.37, ‐4.35] |
| 8.2 Adults | 5 | 776 | Mean Difference (IV, Fixed, 95% CI) | ‐3.76 [‐9.18, 1.66] |
| 9 PC20 Show forest plot | 1 | Mean Difference (IV, Fixed, 95% CI) | Totals not selected | |
| Analysis 5.9  Comparison 5 Parallel group studies, no oral steroids: 200 versus 400‐500 mcg/d (all ages), Outcome 9 PC20. | ||||
| 9.1 Children | 0 | Mean Difference (IV, Fixed, 95% CI) | 0.0 [0.0, 0.0] | |
| 9.2 Adults | 1 | Mean Difference (IV, Fixed, 95% CI) | 0.0 [0.0, 0.0] | |
| 10 PD20 Show forest plot | 1 | Mean Difference (IV, Fixed, 95% CI) | Totals not selected | |
| Analysis 5.10  Comparison 5 Parallel group studies, no oral steroids: 200 versus 400‐500 mcg/d (all ages), Outcome 10 PD20. | ||||
| 10.1 Children | 1 | Mean Difference (IV, Fixed, 95% CI) | 0.0 [0.0, 0.0] | |
| 10.2 Adults | 0 | Mean Difference (IV, Fixed, 95% CI) | 0.0 [0.0, 0.0] | |
| 11 Change in daily use of beta2 agonist compared to baseline (puffs/d) Show forest plot | 7 | 931 | Mean Difference (IV, Fixed, 95% CI) | 0.18 [‐0.08, 0.43] |
| Analysis 5.11  Comparison 5 Parallel group studies, no oral steroids: 200 versus 400‐500 mcg/d (all ages), Outcome 11 Change in daily use of beta2 agonist compared to baseline (puffs/d). | ||||
| 11.1 Children | 0 | 0 | Mean Difference (IV, Fixed, 95% CI) | 0.0 [0.0, 0.0] |
| 11.2 Adults | 7 | 931 | Mean Difference (IV, Fixed, 95% CI) | 0.18 [‐0.08, 0.43] |
| 12 Change in number of night‐time awakenings/week compared to baseline Show forest plot | 2 | 334 | Mean Difference (IV, Fixed, 95% CI) | ‐0.01 [‐0.05, 0.04] |
| Analysis 5.12  Comparison 5 Parallel group studies, no oral steroids: 200 versus 400‐500 mcg/d (all ages), Outcome 12 Change in number of night‐time awakenings/week compared to baseline. | ||||
| 12.1 Children | 0 | 0 | Mean Difference (IV, Fixed, 95% CI) | 0.0 [0.0, 0.0] |
| 12.2 Adults | 2 | 334 | Mean Difference (IV, Fixed, 95% CI) | ‐0.01 [‐0.05, 0.04] |
| 13 Change in % nights without waking Show forest plot | 1 | Mean Difference (IV, Fixed, 95% CI) | Totals not selected | |
| Analysis 5.13  Comparison 5 Parallel group studies, no oral steroids: 200 versus 400‐500 mcg/d (all ages), Outcome 13 Change in % nights without waking. | ||||
| 13.1 Children | 0 | Mean Difference (IV, Fixed, 95% CI) | 0.0 [0.0, 0.0] | |
| 13.2 Adults | 1 | Mean Difference (IV, Fixed, 95% CI) | 0.0 [0.0, 0.0] | |
| 14 Change in daily asthma symptom score compared to baseline Show forest plot | 7 | 930 | Std. Mean Difference (IV, Fixed, 95% CI) | 0.11 [‐0.02, 0.24] |
| Analysis 5.14  Comparison 5 Parallel group studies, no oral steroids: 200 versus 400‐500 mcg/d (all ages), Outcome 14 Change in daily asthma symptom score compared to baseline. | ||||
| 14.1 Children | 0 | 0 | Std. Mean Difference (IV, Fixed, 95% CI) | 0.0 [0.0, 0.0] |
| 14.2 Adults | 7 | 930 | Std. Mean Difference (IV, Fixed, 95% CI) | 0.11 [‐0.02, 0.24] |
| 15 Percentage of symptom‐free days Show forest plot | 1 | Mean Difference (IV, Fixed, 95% CI) | Totals not selected | |
| Analysis 5.15  Comparison 5 Parallel group studies, no oral steroids: 200 versus 400‐500 mcg/d (all ages), Outcome 15 Percentage of symptom‐free days. | ||||
| 15.1 Children | 0 | Mean Difference (IV, Fixed, 95% CI) | 0.0 [0.0, 0.0] | |
| 15.2 Adults | 1 | Mean Difference (IV, Fixed, 95% CI) | 0.0 [0.0, 0.0] | |
| 16 Health related quality of life ‐ AQLQ (absolute scores) | 0 | Mean Difference (IV, Fixed, 95% CI) | Totals not selected | |
| 16.1 Children | 0 | Mean Difference (IV, Fixed, 95% CI) | 0.0 [0.0, 0.0] | |
| 16.2 Adults | 0 | Mean Difference (IV, Fixed, 95% CI) | 0.0 [0.0, 0.0] | |
| 17 Number of patients withdrawn due to lack of efficacy Show forest plot | 7 | 1294 | Peto Odds Ratio (Peto, Fixed, 95% CI) | 1.41 [1.01, 1.98] |
| Analysis 5.17  Comparison 5 Parallel group studies, no oral steroids: 200 versus 400‐500 mcg/d (all ages), Outcome 17 Number of patients withdrawn due to lack of efficacy. | ||||
| 17.1 Children | 0 | 0 | Peto Odds Ratio (Peto, Fixed, 95% CI) | 0.0 [0.0, 0.0] |
| 17.2 Adults | 7 | 1294 | Peto Odds Ratio (Peto, Fixed, 95% CI) | 1.41 [1.01, 1.98] |
| 18 Exacerbations requiring oral steroids Show forest plot | 2 | 883 | Peto Odds Ratio (Peto, Fixed, 95% CI) | 1.21 [0.72, 2.05] |
| Analysis 5.18  Comparison 5 Parallel group studies, no oral steroids: 200 versus 400‐500 mcg/d (all ages), Outcome 18 Exacerbations requiring oral steroids. | ||||
| 18.1 Children | 2 | 883 | Peto Odds Ratio (Peto, Fixed, 95% CI) | 1.21 [0.72, 2.05] |
| 18.2 Adults | 0 | 0 | Peto Odds Ratio (Peto, Fixed, 95% CI) | 0.0 [0.0, 0.0] |
| 19 Exacerbations requiring hospitalisation Show forest plot | 1 | Odds Ratio (M‐H, Fixed, 95% CI) | Totals not selected | |
| Analysis 5.19  Comparison 5 Parallel group studies, no oral steroids: 200 versus 400‐500 mcg/d (all ages), Outcome 19 Exacerbations requiring hospitalisation. | ||||
| 19.1 Children | 1 | Odds Ratio (M‐H, Fixed, 95% CI) | 0.0 [0.0, 0.0] | |
| 19.2 Adults | 0 | Odds Ratio (M‐H, Fixed, 95% CI) | 0.0 [0.0, 0.0] | |
| 20 Oral Candidiasis (No. of patients) Show forest plot | 8 | 1752 | Peto Odds Ratio (Peto, Fixed, 95% CI) | 0.87 [0.47, 1.61] |
| Analysis 5.20  Comparison 5 Parallel group studies, no oral steroids: 200 versus 400‐500 mcg/d (all ages), Outcome 20 Oral Candidiasis (No. of patients). | ||||
| 20.1 Children | 1 | 528 | Peto Odds Ratio (Peto, Fixed, 95% CI) | 0.65 [0.19, 2.27] |
| 20.2 Adults | 7 | 1224 | Peto Odds Ratio (Peto, Fixed, 95% CI) | 0.95 [0.47, 1.95] |
| 21 Sore throat or pharyngitis (No. of patients) Show forest plot | 8 | 1825 | Peto Odds Ratio (Peto, Fixed, 95% CI) | 0.98 [0.60, 1.63] |
| Analysis 5.21  Comparison 5 Parallel group studies, no oral steroids: 200 versus 400‐500 mcg/d (all ages), Outcome 21 Sore throat or pharyngitis (No. of patients). | ||||
| 21.1 Children | 2 | 883 | Peto Odds Ratio (Peto, Fixed, 95% CI) | 1.34 [0.58, 3.08] |
| 21.2 Adults | 6 | 942 | Peto Odds Ratio (Peto, Fixed, 95% CI) | 0.83 [0.44, 1.55] |
| 22 Hoarseness or dysphonia (No. of patients) Show forest plot | 7 | 1693 | Peto Odds Ratio (Peto, Fixed, 95% CI) | 0.76 [0.40, 1.46] |
| Analysis 5.22  Comparison 5 Parallel group studies, no oral steroids: 200 versus 400‐500 mcg/d (all ages), Outcome 22 Hoarseness or dysphonia (No. of patients). | ||||
| 22.1 Children | 1 | 528 | Peto Odds Ratio (Peto, Fixed, 95% CI) | 1.30 [0.29, 5.79] |
| 22.2 Adults | 6 | 1165 | Peto Odds Ratio (Peto, Fixed, 95% CI) | 0.67 [0.32, 1.38] |
| 23 Withdrawals due to adverse events Show forest plot | 5 | 1161 | Odds Ratio (M‐H, Fixed, 95% CI) | 0.65 [0.22, 1.92] |
| Analysis 5.23  Comparison 5 Parallel group studies, no oral steroids: 200 versus 400‐500 mcg/d (all ages), Outcome 23 Withdrawals due to adverse events. | ||||
| 23.1 Children | 1 | 528 | Odds Ratio (M‐H, Fixed, 95% CI) | 0.98 [0.14, 6.99] |
| 23.2 Adults | 4 | 633 | Odds Ratio (M‐H, Fixed, 95% CI) | 0.55 [0.15, 2.03] |
| 24 No. patients with </=18 mcg/dL poststimulation cortisol Show forest plot | 2 | Odds Ratio (M‐H, Fixed, 95% CI) | Totals not selected | |
| Analysis 5.24  Comparison 5 Parallel group studies, no oral steroids: 200 versus 400‐500 mcg/d (all ages), Outcome 24 No. patients with </=18 mcg/dL poststimulation cortisol. | ||||
| 24.1 Children | 0 | Odds Ratio (M‐H, Fixed, 95% CI) | 0.0 [0.0, 0.0] | |
| 24.2 Adults | 2 | Odds Ratio (M‐H, Fixed, 95% CI) | 0.0 [0.0, 0.0] | |
| 25 AUC serum cortisol Show forest plot | 1 | Mean Difference (IV, Fixed, 95% CI) | Totals not selected | |
| Analysis 5.25  Comparison 5 Parallel group studies, no oral steroids: 200 versus 400‐500 mcg/d (all ages), Outcome 25 AUC serum cortisol. | ||||
| 25.1 Children | 0 | Mean Difference (IV, Fixed, 95% CI) | 0.0 [0.0, 0.0] | |
| 25.2 Adults | 1 | Mean Difference (IV, Fixed, 95% CI) | 0.0 [0.0, 0.0] | |
| 26 Change in peak plasma cortisol expression Show forest plot | 1 | Mean Difference (IV, Fixed, 95% CI) | Totals not selected | |
| Analysis 5.26  Comparison 5 Parallel group studies, no oral steroids: 200 versus 400‐500 mcg/d (all ages), Outcome 26 Change in peak plasma cortisol expression. | ||||
| 26.1 Children | 0 | Mean Difference (IV, Fixed, 95% CI) | 0.0 [0.0, 0.0] | |
| 26.2 Adults | 1 | Mean Difference (IV, Fixed, 95% CI) | 0.0 [0.0, 0.0] | |
| Outcome or subgroup title | No. of studies | No. of participants | Statistical method | Effect size |
| 1 Change in FEV1 compared to baseline based on study duration (litres) ‐ adults Show forest plot | 11 | 1720 | Mean Difference (IV, Fixed, 95% CI) | 0.01 [‐0.04, 0.05] |
| Analysis 6.1  Comparison 6 Parallel group studies, no oral steroids: 200 versus 400‐500 mcg/d (subgroups), Outcome 1 Change in FEV1 compared to baseline based on study duration (litres) ‐ adults. | ||||
| 1.1 1‐4 weeks | 2 | 293 | Mean Difference (IV, Fixed, 95% CI) | 0.09 [‐0.01, 0.19] |
| 1.2 1‐5 months | 8 | 1237 | Mean Difference (IV, Fixed, 95% CI) | ‐0.03 [‐0.08, 0.02] |
| 1.3 6 months or longer | 1 | 190 | Mean Difference (IV, Fixed, 95% CI) | 0.08 [‐0.03, 0.19] |
| 2 Change in FEV1 compared to baseline based on delivery devices (litres) ‐ adults Show forest plot | 11 | 1720 | Mean Difference (IV, Fixed, 95% CI) | 0.01 [‐0.04, 0.05] |
| Analysis 6.2  Comparison 6 Parallel group studies, no oral steroids: 200 versus 400‐500 mcg/d (subgroups), Outcome 2 Change in FEV1 compared to baseline based on delivery devices (litres) ‐ adults. | ||||
| 2.1 MDI | 8 | 1226 | Mean Difference (IV, Fixed, 95% CI) | 0.02 [‐0.03, 0.07] |
| 2.2 DPI | 3 | 494 | Mean Difference (IV, Fixed, 95% CI) | ‐0.02 [‐0.11, 0.06] |
| 3 Change in FEV1 compared to baseline based on degrees of severity (litres) ‐ adults Show forest plot | 11 | 1720 | Mean Difference (IV, Fixed, 95% CI) | 0.01 [‐0.04, 0.05] |
| Analysis 6.3  Comparison 6 Parallel group studies, no oral steroids: 200 versus 400‐500 mcg/d (subgroups), Outcome 3 Change in FEV1 compared to baseline based on degrees of severity (litres) ‐ adults. | ||||
| 3.1 Mild to moderate | 3 | 194 | Mean Difference (IV, Fixed, 95% CI) | ‐0.05 [‐0.18, 0.08] |
| 3.2 Moderate | 6 | 1136 | Mean Difference (IV, Fixed, 95% CI) | 0.01 [‐0.05, 0.06] |
| 3.3 Mixed | 1 | 200 | Mean Difference (IV, Fixed, 95% CI) | ‐0.05 [‐0.19, 0.09] |
| 3.4 Unclear | 1 | 190 | Mean Difference (IV, Fixed, 95% CI) | 0.08 [‐0.03, 0.19] |
| Outcome or subgroup title | No. of studies | No. of participants | Statistical method | Effect size |
| 1 Change in FEV1 compared to baseline (litres) Show forest plot | 3 | 351 | Mean Difference (IV, Fixed, 95% CI) | ‐0.01 [‐0.10, 0.09] |
| Analysis 7.1  Comparison 7 Parallel group studies, no oral steroids: 100 versus 400‐500 mcg/d (all ages), Outcome 1 Change in FEV1 compared to baseline (litres). | ||||
| 1.1 Children | 0 | 0 | Mean Difference (IV, Fixed, 95% CI) | 0.0 [0.0, 0.0] |
| 1.2 Adults | 3 | 351 | Mean Difference (IV, Fixed, 95% CI) | ‐0.01 [‐0.10, 0.09] |
| 2 FEV1 (% predicted) Show forest plot | 1 | Mean Difference (IV, Fixed, 95% CI) | Totals not selected | |
| Analysis 7.2  Comparison 7 Parallel group studies, no oral steroids: 100 versus 400‐500 mcg/d (all ages), Outcome 2 FEV1 (% predicted). | ||||
| 2.1 Children | 0 | Mean Difference (IV, Fixed, 95% CI) | 0.0 [0.0, 0.0] | |
| 2.2 Adults | 1 | Mean Difference (IV, Fixed, 95% CI) | 0.0 [0.0, 0.0] | |
| 3 Change in morning PEFR compared to baseline (L/min) Show forest plot | 3 | 593 | Mean Difference (IV, Fixed, 95% CI) | ‐7.97 [‐14.58, ‐1.35] |
| Analysis 7.3  Comparison 7 Parallel group studies, no oral steroids: 100 versus 400‐500 mcg/d (all ages), Outcome 3 Change in morning PEFR compared to baseline (L/min). | ||||
| 3.1 Children | 0 | 0 | Mean Difference (IV, Fixed, 95% CI) | 0.0 [0.0, 0.0] |
| 3.2 Adults | 3 | 593 | Mean Difference (IV, Fixed, 95% CI) | ‐7.97 [‐14.58, ‐1.35] |
| 4 Change in evening PEFR compared to baseline (L/min) Show forest plot | 1 | Mean Difference (IV, Fixed, 95% CI) | Totals not selected | |
| Analysis 7.4  Comparison 7 Parallel group studies, no oral steroids: 100 versus 400‐500 mcg/d (all ages), Outcome 4 Change in evening PEFR compared to baseline (L/min). | ||||
| 4.1 Children | 0 | Mean Difference (IV, Fixed, 95% CI) | 0.0 [0.0, 0.0] | |
| 4.2 Adults | 1 | Mean Difference (IV, Fixed, 95% CI) | 0.0 [0.0, 0.0] | |
| 5 Percentage of symptom‐free days Show forest plot | 1 | Mean Difference (IV, Fixed, 95% CI) | Totals not selected | |
| Analysis 7.5  Comparison 7 Parallel group studies, no oral steroids: 100 versus 400‐500 mcg/d (all ages), Outcome 5 Percentage of symptom‐free days. | ||||
| 5.1 Children | 0 | Mean Difference (IV, Fixed, 95% CI) | 0.0 [0.0, 0.0] | |
| 5.2 Adults | 1 | Mean Difference (IV, Fixed, 95% CI) | 0.0 [0.0, 0.0] | |
| 6 Change in daily asthma symptom score compared to baseline Show forest plot | 2 | 194 | Std. Mean Difference (IV, Fixed, 95% CI) | 0.31 [0.03, 0.60] |
| Analysis 7.6  Comparison 7 Parallel group studies, no oral steroids: 100 versus 400‐500 mcg/d (all ages), Outcome 6 Change in daily asthma symptom score compared to baseline. | ||||
| 6.1 Children | 0 | 0 | Std. Mean Difference (IV, Fixed, 95% CI) | 0.0 [0.0, 0.0] |
| 6.2 Adults | 2 | 194 | Std. Mean Difference (IV, Fixed, 95% CI) | 0.31 [0.03, 0.60] |
| 7 Change in number of night‐time awakenings/week compared to baseline Show forest plot | 1 | Mean Difference (IV, Fixed, 95% CI) | Totals not selected | |
| Analysis 7.7  Comparison 7 Parallel group studies, no oral steroids: 100 versus 400‐500 mcg/d (all ages), Outcome 7 Change in number of night‐time awakenings/week compared to baseline. | ||||
| 7.1 Children | 0 | Mean Difference (IV, Fixed, 95% CI) | 0.0 [0.0, 0.0] | |
| 7.2 Adults | 1 | Mean Difference (IV, Fixed, 95% CI) | 0.0 [0.0, 0.0] | |
| 8 Change in daily use of beta2 agonist compared to baseline (puffs/d) Show forest plot | 1 | Mean Difference (IV, Fixed, 95% CI) | Totals not selected | |
| Analysis 7.8  Comparison 7 Parallel group studies, no oral steroids: 100 versus 400‐500 mcg/d (all ages), Outcome 8 Change in daily use of beta2 agonist compared to baseline (puffs/d). | ||||
| 8.1 Children | 0 | Mean Difference (IV, Fixed, 95% CI) | 0.0 [0.0, 0.0] | |
| 8.2 Adults | 1 | Mean Difference (IV, Fixed, 95% CI) | 0.0 [0.0, 0.0] | |
| 9 Physician global rated efficacy: ineffective Show forest plot | 2 | 400 | Peto Odds Ratio (Peto, Fixed, 95% CI) | 1.25 [0.81, 1.93] |
| Analysis 7.9  Comparison 7 Parallel group studies, no oral steroids: 100 versus 400‐500 mcg/d (all ages), Outcome 9 Physician global rated efficacy: ineffective. | ||||
| 9.1 Children | 0 | 0 | Peto Odds Ratio (Peto, Fixed, 95% CI) | 0.0 [0.0, 0.0] |
| 9.2 Adults | 2 | 400 | Peto Odds Ratio (Peto, Fixed, 95% CI) | 1.25 [0.81, 1.93] |
| 10 Number of patients withdrawn due to lack of efficacy Show forest plot | 2 | 454 | Peto Odds Ratio (Peto, Fixed, 95% CI) | 2.30 [0.90, 5.90] |
| Analysis 7.10  Comparison 7 Parallel group studies, no oral steroids: 100 versus 400‐500 mcg/d (all ages), Outcome 10 Number of patients withdrawn due to lack of efficacy. | ||||
| 10.1 Children | 0 | 0 | Peto Odds Ratio (Peto, Fixed, 95% CI) | 0.0 [0.0, 0.0] |
| 10.2 Adults | 2 | 454 | Peto Odds Ratio (Peto, Fixed, 95% CI) | 2.30 [0.90, 5.90] |
| 11 Sore throat or pharyngitis (No. of patients) Show forest plot | 3 | 615 | Peto Odds Ratio (Peto, Fixed, 95% CI) | 1.02 [0.29, 3.56] |
| Analysis 7.11  Comparison 7 Parallel group studies, no oral steroids: 100 versus 400‐500 mcg/d (all ages), Outcome 11 Sore throat or pharyngitis (No. of patients). | ||||
| 11.1 Children | 0 | 0 | Peto Odds Ratio (Peto, Fixed, 95% CI) | 0.0 [0.0, 0.0] |
| 11.2 Adults | 3 | 615 | Peto Odds Ratio (Peto, Fixed, 95% CI) | 1.02 [0.29, 3.56] |
| 12 Hoarseness or dysphonia (No. of patients) Show forest plot | 3 | 615 | Peto Odds Ratio (Peto, Fixed, 95% CI) | 0.28 [0.08, 0.92] |
| Analysis 7.12  Comparison 7 Parallel group studies, no oral steroids: 100 versus 400‐500 mcg/d (all ages), Outcome 12 Hoarseness or dysphonia (No. of patients). | ||||
| 12.1 Children | 0 | 0 | Peto Odds Ratio (Peto, Fixed, 95% CI) | 0.0 [0.0, 0.0] |
| 12.2 Adults | 3 | 615 | Peto Odds Ratio (Peto, Fixed, 95% CI) | 0.28 [0.08, 0.92] |
| 13 Oral Candidiasis (No. of patients) Show forest plot | 3 | 615 | Peto Odds Ratio (Peto, Fixed, 95% CI) | 0.89 [0.32, 2.49] |
| Analysis 7.13  Comparison 7 Parallel group studies, no oral steroids: 100 versus 400‐500 mcg/d (all ages), Outcome 13 Oral Candidiasis (No. of patients). | ||||
| 13.1 Children | 0 | 0 | Peto Odds Ratio (Peto, Fixed, 95% CI) | 0.0 [0.0, 0.0] |
| 13.2 Adults | 3 | 615 | Peto Odds Ratio (Peto, Fixed, 95% CI) | 0.89 [0.32, 2.49] |
| 14 Plasma Cortisol (AUC) Show forest plot | 1 | Mean Difference (IV, Fixed, 95% CI) | Totals not selected | |
| Analysis 7.14  Comparison 7 Parallel group studies, no oral steroids: 100 versus 400‐500 mcg/d (all ages), Outcome 14 Plasma Cortisol (AUC). | ||||
| 14.1 Children | 0 | Mean Difference (IV, Fixed, 95% CI) | 0.0 [0.0, 0.0] | |
| 14.2 Adults | 1 | Mean Difference (IV, Fixed, 95% CI) | 0.0 [0.0, 0.0] | |
| 15 Clinic PEF (L/min ‐ change from baseline) Show forest plot | 1 | Mean Difference (IV, Fixed, 95% CI) | Totals not selected | |
| Analysis 7.15  Comparison 7 Parallel group studies, no oral steroids: 100 versus 400‐500 mcg/d (all ages), Outcome 15 Clinic PEF (L/min ‐ change from baseline). | ||||
| 15.1 Children | 0 | Mean Difference (IV, Fixed, 95% CI) | 0.0 [0.0, 0.0] | |
| 15.2 Adults | 1 | Mean Difference (IV, Fixed, 95% CI) | 0.0 [0.0, 0.0] | |
| Outcome or subgroup title | No. of studies | No. of participants | Statistical method | Effect size |
| 1 Change in FEV1 compared to baseline based on study duration (litres) ‐ adults Show forest plot | 3 | 351 | Mean Difference (IV, Fixed, 95% CI) | ‐0.01 [‐0.10, 0.09] |
| Analysis 8.1  Comparison 8 Parallel group studies, no oral steroids: 100 versus 400‐500 mcg/d (subgroups), Outcome 1 Change in FEV1 compared to baseline based on study duration (litres) ‐ adults. | ||||
| 1.1 1‐4 weeks | 1 | 23 | Mean Difference (IV, Fixed, 95% CI) | ‐0.45 [‐0.88, ‐0.02] |
| 1.2 1‐5 months | 2 | 328 | Mean Difference (IV, Fixed, 95% CI) | 0.02 [‐0.08, 0.11] |
| 1.3 6 months or longer | 0 | 0 | Mean Difference (IV, Fixed, 95% CI) | 0.0 [0.0, 0.0] |
| 2 Change in FEV1 compared to baseline based on delivery devices (litres) ‐ adults Show forest plot | 3 | 351 | Mean Difference (IV, Fixed, 95% CI) | ‐0.01 [‐0.10, 0.09] |
| Analysis 8.2  Comparison 8 Parallel group studies, no oral steroids: 100 versus 400‐500 mcg/d (subgroups), Outcome 2 Change in FEV1 compared to baseline based on delivery devices (litres) ‐ adults. | ||||
| 2.1 MDI | 1 | 23 | Mean Difference (IV, Fixed, 95% CI) | ‐0.45 [‐0.88, ‐0.02] |
| 2.2 DPI | 2 | 328 | Mean Difference (IV, Fixed, 95% CI) | 0.02 [‐0.08, 0.11] |
| 3 Change in FEV1 compared to baseline based on degrees of severity (litres) ‐ adults Show forest plot | 3 | 351 | Mean Difference (IV, Fixed, 95% CI) | ‐0.01 [‐0.10, 0.09] |
| Analysis 8.3  Comparison 8 Parallel group studies, no oral steroids: 100 versus 400‐500 mcg/d (subgroups), Outcome 3 Change in FEV1 compared to baseline based on degrees of severity (litres) ‐ adults. | ||||
| 3.1 Mild to moderate | 1 | 23 | Mean Difference (IV, Fixed, 95% CI) | ‐0.45 [‐0.88, ‐0.02] |
| 3.2 Moderate | 2 | 328 | Mean Difference (IV, Fixed, 95% CI) | 0.02 [‐0.08, 0.11] |
| Outcome or subgroup title | No. of studies | No. of participants | Statistical method | Effect size |
| 1 FEV1 (Change from baseline ‐ litres) Show forest plot | 5 | 900 | Mean Difference (IV, Fixed, 95% CI) | ‐0.01 [‐0.06, 0.04] |
| Analysis 9.1  Comparison 9 Parallel group studies, no oral steroids: 400‐500 versus 800‐1000 mcg/d (all ages), Outcome 1 FEV1 (Change from baseline ‐ litres). | ||||
| 1.1 Children | 0 | 0 | Mean Difference (IV, Fixed, 95% CI) | 0.0 [0.0, 0.0] |
| 1.2 Adults | 5 | 900 | Mean Difference (IV, Fixed, 95% CI) | ‐0.01 [‐0.06, 0.04] |
| 2 Change in morning PEF (L/min) Show forest plot | 4 | 905 | Mean Difference (IV, Fixed, 95% CI) | ‐2.30 [‐7.94, 3.35] |
| Analysis 9.2  Comparison 9 Parallel group studies, no oral steroids: 400‐500 versus 800‐1000 mcg/d (all ages), Outcome 2 Change in morning PEF (L/min). | ||||
| 2.1 Children | 0 | 0 | Mean Difference (IV, Fixed, 95% CI) | 0.0 [0.0, 0.0] |
| 2.2 Adults | 4 | 905 | Mean Difference (IV, Fixed, 95% CI) | ‐2.30 [‐7.94, 3.35] |
| 3 Change in evening PEF (L/min) Show forest plot | 2 | 505 | Mean Difference (IV, Fixed, 95% CI) | 5.83 [‐2.94, 14.60] |
| Analysis 9.3  Comparison 9 Parallel group studies, no oral steroids: 400‐500 versus 800‐1000 mcg/d (all ages), Outcome 3 Change in evening PEF (L/min). | ||||
| 3.1 Children | 0 | 0 | Mean Difference (IV, Fixed, 95% CI) | 0.0 [0.0, 0.0] |
| 3.2 Adults | 2 | 505 | Mean Difference (IV, Fixed, 95% CI) | 5.83 [‐2.94, 14.60] |
| 4 Change in rescue medication (puffs/d) Show forest plot | 1 | Mean Difference (IV, Fixed, 95% CI) | Totals not selected | |
| Analysis 9.4  Comparison 9 Parallel group studies, no oral steroids: 400‐500 versus 800‐1000 mcg/d (all ages), Outcome 4 Change in rescue medication (puffs/d). | ||||
| 4.1 Children | 0 | Mean Difference (IV, Fixed, 95% CI) | 0.0 [0.0, 0.0] | |
| 4.2 Adults | 1 | Mean Difference (IV, Fixed, 95% CI) | 0.0 [0.0, 0.0] | |
| 5 Health‐related quality of life ‐ AQLQ (absolute scores) | 0 | Mean Difference (IV, Fixed, 95% CI) | Totals not selected | |
| 5.1 Children | 0 | Mean Difference (IV, Fixed, 95% CI) | 0.0 [0.0, 0.0] | |
| 5.2 Adults | 0 | Mean Difference (IV, Fixed, 95% CI) | 0.0 [0.0, 0.0] | |
| 6 Change in daily symptoms compared with baseline Show forest plot | 1 | Mean Difference (IV, Fixed, 95% CI) | Totals not selected | |
| Analysis 9.6  Comparison 9 Parallel group studies, no oral steroids: 400‐500 versus 800‐1000 mcg/d (all ages), Outcome 6 Change in daily symptoms compared with baseline. | ||||
| 6.1 Children | 0 | Mean Difference (IV, Fixed, 95% CI) | 0.0 [0.0, 0.0] | |
| 6.2 Adults | 1 | Mean Difference (IV, Fixed, 95% CI) | 0.0 [0.0, 0.0] | |
| 7 Nocturnal awakenings (awakenings per night) | 0 | Mean Difference (IV, Fixed, 95% CI) | Totals not selected | |
| 7.1 Children | 0 | Mean Difference (IV, Fixed, 95% CI) | 0.0 [0.0, 0.0] | |
| 7.2 Adults | 0 | Mean Difference (IV, Fixed, 95% CI) | 0.0 [0.0, 0.0] | |
| 8 Exacerbations requiring hospitalisation Show forest plot | 1 | Peto Odds Ratio (Peto, Fixed, 95% CI) | Totals not selected | |
| Analysis 9.8  Comparison 9 Parallel group studies, no oral steroids: 400‐500 versus 800‐1000 mcg/d (all ages), Outcome 8 Exacerbations requiring hospitalisation. | ||||
| 8.1 Children | 0 | Peto Odds Ratio (Peto, Fixed, 95% CI) | 0.0 [0.0, 0.0] | |
| 8.2 Adults | 1 | Peto Odds Ratio (Peto, Fixed, 95% CI) | 0.0 [0.0, 0.0] | |
| 9 Exacerbations requiring OCS treatment Show forest plot | 2 | 363 | Peto Odds Ratio (Peto, Fixed, 95% CI) | 1.24 [0.77, 1.98] |
| Analysis 9.9  Comparison 9 Parallel group studies, no oral steroids: 400‐500 versus 800‐1000 mcg/d (all ages), Outcome 9 Exacerbations requiring OCS treatment. | ||||
| 9.1 Children | 0 | 0 | Peto Odds Ratio (Peto, Fixed, 95% CI) | 0.0 [0.0, 0.0] |
| 9.2 Adults | 2 | 363 | Peto Odds Ratio (Peto, Fixed, 95% CI) | 1.24 [0.77, 1.98] |
| 10 Withdrawals (total) Show forest plot | 5 | 1039 | Peto Odds Ratio (Peto, Fixed, 95% CI) | 1.27 [0.88, 1.83] |
| Analysis 9.10  Comparison 9 Parallel group studies, no oral steroids: 400‐500 versus 800‐1000 mcg/d (all ages), Outcome 10 Withdrawals (total). | ||||
| 10.1 Children | 0 | 0 | Peto Odds Ratio (Peto, Fixed, 95% CI) | 0.0 [0.0, 0.0] |
| 10.2 Adults | 5 | 1039 | Peto Odds Ratio (Peto, Fixed, 95% CI) | 1.27 [0.88, 1.83] |
| 11 Withdrawals (adverse events) Show forest plot | 4 | 841 | Peto Odds Ratio (Peto, Fixed, 95% CI) | 0.46 [0.17, 1.25] |
| Analysis 9.11  Comparison 9 Parallel group studies, no oral steroids: 400‐500 versus 800‐1000 mcg/d (all ages), Outcome 11 Withdrawals (adverse events). | ||||
| 11.1 Children | 0 | 0 | Peto Odds Ratio (Peto, Fixed, 95% CI) | 0.0 [0.0, 0.0] |
| 11.2 Adults | 4 | 841 | Peto Odds Ratio (Peto, Fixed, 95% CI) | 0.46 [0.17, 1.25] |
| 12 Withdrawals (lack of efficacy) Show forest plot | 2 | 537 | Peto Odds Ratio (Peto, Fixed, 95% CI) | 1.67 [0.73, 3.81] |
| Analysis 9.12  Comparison 9 Parallel group studies, no oral steroids: 400‐500 versus 800‐1000 mcg/d (all ages), Outcome 12 Withdrawals (lack of efficacy). | ||||
| 12.1 Children | 0 | 0 | Peto Odds Ratio (Peto, Fixed, 95% CI) | 0.0 [0.0, 0.0] |
| 12.2 Adults | 2 | 537 | Peto Odds Ratio (Peto, Fixed, 95% CI) | 1.67 [0.73, 3.81] |
| 13 Drug‐related adverse events | 0 | Peto Odds Ratio (Peto, Fixed, 95% CI) | Totals not selected | |
| 13.1 Children | 0 | Peto Odds Ratio (Peto, Fixed, 95% CI) | 0.0 [0.0, 0.0] | |
| 13.2 Adults | 0 | Peto Odds Ratio (Peto, Fixed, 95% CI) | 0.0 [0.0, 0.0] | |
| 14 HPA function data (am cortisol <5mcg/dL) | 0 | Peto Odds Ratio (Peto, Fixed, 95% CI) | Totals not selected | |
| 14.1 Children | 0 | Peto Odds Ratio (Peto, Fixed, 95% CI) | 0.0 [0.0, 0.0] | |
| 14.2 Adults | 0 | Peto Odds Ratio (Peto, Fixed, 95% CI) | 0.0 [0.0, 0.0] | |
| Outcome or subgroup title | No. of studies | No. of participants | Statistical method | Effect size |
| 1 Change from baseline in FEV1 based on study duration (litres) ‐ adults Show forest plot | 5 | 900 | Mean Difference (IV, Fixed, 95% CI) | ‐0.01 [‐0.06, 0.04] |
| Analysis 10.1  Comparison 10 Parallel group studies, no oral steroids: 400‐500 versus 800‐1000 mcg/d (subgroups), Outcome 1 Change from baseline in FEV1 based on study duration (litres) ‐ adults. | ||||
| 1.1 1‐4 weeks | 0 | 0 | Mean Difference (IV, Fixed, 95% CI) | 0.0 [0.0, 0.0] |
| 1.2 1‐5 months | 3 | 435 | Mean Difference (IV, Fixed, 95% CI) | ‐0.02 [‐0.09, 0.05] |
| 1.3 6 months or longer | 2 | 465 | Mean Difference (IV, Fixed, 95% CI) | 0.0 [‐0.07, 0.07] |
| 2 Change from baseline in FEV1 based on delivery devices (litres) ‐ adults Show forest plot | 5 | 900 | Mean Difference (IV, Fixed, 95% CI) | ‐0.01 [‐0.06, 0.04] |
| Analysis 10.2  Comparison 10 Parallel group studies, no oral steroids: 400‐500 versus 800‐1000 mcg/d (subgroups), Outcome 2 Change from baseline in FEV1 based on delivery devices (litres) ‐ adults. | ||||
| 2.1 MDI | 3 | 435 | Mean Difference (IV, Fixed, 95% CI) | ‐0.02 [‐0.09, 0.05] |
| 2.2 DPI | 2 | 465 | Mean Difference (IV, Fixed, 95% CI) | 0.0 [‐0.07, 0.07] |
| 3 Change from baseline in FEV1 based on degree of severity (litres) ‐ adults Show forest plot | 5 | 900 | Mean Difference (IV, Fixed, 95% CI) | ‐0.01 [‐0.06, 0.04] |
| Analysis 10.3  Comparison 10 Parallel group studies, no oral steroids: 400‐500 versus 800‐1000 mcg/d (subgroups), Outcome 3 Change from baseline in FEV1 based on degree of severity (litres) ‐ adults. | ||||
| 3.1 Mild to moderate | 1 | 38 | Mean Difference (IV, Fixed, 95% CI) | 0.1 [‐0.08, 0.28] |
| 3.2 Moderate | 3 | 575 | Mean Difference (IV, Fixed, 95% CI) | ‐0.03 [‐0.10, 0.04] |
| 3.3 Moderate to severe | 1 | 287 | Mean Difference (IV, Fixed, 95% CI) | 0.0 [‐0.09, 0.09] |
| Outcome or subgroup title | No. of studies | No. of participants | Statistical method | Effect size |
| 1 Change in FEV1 compared to baseline (litres) Show forest plot | 1 | Mean Difference (IV, Fixed, 95% CI) | Totals not selected | |
| Analysis 11.1  Comparison 11 Parallel group studies, no oral steroids: 50‐100 versus 800‐1000 mcg/d (all ages), Outcome 1 Change in FEV1 compared to baseline (litres). | ||||
| 1.1 Children | 0 | Mean Difference (IV, Fixed, 95% CI) | 0.0 [0.0, 0.0] | |
| 1.2 Adults | 1 | Mean Difference (IV, Fixed, 95% CI) | 0.0 [0.0, 0.0] | |
| 2 FEV1 (% predicted) Show forest plot | 2 | 283 | Mean Difference (IV, Fixed, 95% CI) | ‐0.43 [‐5.72, 4.87] |
| Analysis 11.2  Comparison 11 Parallel group studies, no oral steroids: 50‐100 versus 800‐1000 mcg/d (all ages), Outcome 2 FEV1 (% predicted). | ||||
| 2.1 Children | 0 | 0 | Mean Difference (IV, Fixed, 95% CI) | 0.0 [0.0, 0.0] |
| 2.2 Adults | 2 | 283 | Mean Difference (IV, Fixed, 95% CI) | ‐0.43 [‐5.72, 4.87] |
| 3 FEV1 (Litres) Show forest plot | 1 | Mean Difference (IV, Fixed, 95% CI) | Totals not selected | |
| Analysis 11.3  Comparison 11 Parallel group studies, no oral steroids: 50‐100 versus 800‐1000 mcg/d (all ages), Outcome 3 FEV1 (Litres). | ||||
| 3.1 Children | 0 | Mean Difference (IV, Fixed, 95% CI) | 0.0 [0.0, 0.0] | |
| 3.2 Adults | 1 | Mean Difference (IV, Fixed, 95% CI) | 0.0 [0.0, 0.0] | |
| 4 Change in FVC compared to baseline (litres) Show forest plot | 1 | Mean Difference (IV, Fixed, 95% CI) | Totals not selected | |
| Analysis 11.4  Comparison 11 Parallel group studies, no oral steroids: 50‐100 versus 800‐1000 mcg/d (all ages), Outcome 4 Change in FVC compared to baseline (litres). | ||||
| 4.1 Children | 0 | Mean Difference (IV, Fixed, 95% CI) | 0.0 [0.0, 0.0] | |
| 4.2 Adults | 1 | Mean Difference (IV, Fixed, 95% CI) | 0.0 [0.0, 0.0] | |
| 5 FEF25‐75 Show forest plot | 1 | Mean Difference (IV, Fixed, 95% CI) | Totals not selected | |
| Analysis 11.5  Comparison 11 Parallel group studies, no oral steroids: 50‐100 versus 800‐1000 mcg/d (all ages), Outcome 5 FEF25‐75. | ||||
| 5.1 Children | 0 | Mean Difference (IV, Fixed, 95% CI) | 0.0 [0.0, 0.0] | |
| 5.2 Adults | 1 | Mean Difference (IV, Fixed, 95% CI) | 0.0 [0.0, 0.0] | |
| 6 Change in FEF25‐75 compared to baseline (L/second) Show forest plot | 1 | Mean Difference (IV, Fixed, 95% CI) | Totals not selected | |
| Analysis 11.6  Comparison 11 Parallel group studies, no oral steroids: 50‐100 versus 800‐1000 mcg/d (all ages), Outcome 6 Change in FEF25‐75 compared to baseline (L/second). | ||||
| 6.1 Children | 0 | Mean Difference (IV, Fixed, 95% CI) | 0.0 [0.0, 0.0] | |
| 6.2 Adults | 1 | Mean Difference (IV, Fixed, 95% CI) | 0.0 [0.0, 0.0] | |
| 7 am PEF (Litres/min) Show forest plot | 1 | Mean Difference (IV, Fixed, 95% CI) | Totals not selected | |
| Analysis 11.7  Comparison 11 Parallel group studies, no oral steroids: 50‐100 versus 800‐1000 mcg/d (all ages), Outcome 7 am PEF (Litres/min). | ||||
| 7.1 Children | 0 | Mean Difference (IV, Fixed, 95% CI) | 0.0 [0.0, 0.0] | |
| 7.2 Adults | 1 | Mean Difference (IV, Fixed, 95% CI) | 0.0 [0.0, 0.0] | |
| 8 Change in morning PEFR compared to baseline (L/min) Show forest plot | 2 | 419 | Mean Difference (IV, Fixed, 95% CI) | ‐21.86 [‐29.19, ‐14.53] |
| Analysis 11.8  Comparison 11 Parallel group studies, no oral steroids: 50‐100 versus 800‐1000 mcg/d (all ages), Outcome 8 Change in morning PEFR compared to baseline (L/min). | ||||
| 8.1 Children | 0 | 0 | Mean Difference (IV, Fixed, 95% CI) | 0.0 [0.0, 0.0] |
| 8.2 Adults | 2 | 419 | Mean Difference (IV, Fixed, 95% CI) | ‐21.86 [‐29.19, ‐14.53] |
| 9 Change in evening PEFR compared to baseline (L/min) Show forest plot | 2 | 419 | Mean Difference (IV, Fixed, 95% CI) | ‐12.66 [‐19.32, ‐5.99] |
| Analysis 11.9  Comparison 11 Parallel group studies, no oral steroids: 50‐100 versus 800‐1000 mcg/d (all ages), Outcome 9 Change in evening PEFR compared to baseline (L/min). | ||||
| 9.1 Children | 0 | 0 | Mean Difference (IV, Fixed, 95% CI) | 0.0 [0.0, 0.0] |
| 9.2 Adults | 2 | 419 | Mean Difference (IV, Fixed, 95% CI) | ‐12.66 [‐19.32, ‐5.99] |
| 10 Physician global rated efficacy: ineffective Show forest plot | 1 | Peto Odds Ratio (Peto, Fixed, 95% CI) | Totals not selected | |
| Analysis 11.10  Comparison 11 Parallel group studies, no oral steroids: 50‐100 versus 800‐1000 mcg/d (all ages), Outcome 10 Physician global rated efficacy: ineffective. | ||||
| 10.1 Children | 0 | Peto Odds Ratio (Peto, Fixed, 95% CI) | 0.0 [0.0, 0.0] | |
| 10.2 Adults | 1 | Peto Odds Ratio (Peto, Fixed, 95% CI) | 0.0 [0.0, 0.0] | |
| 11 Symptoms Show forest plot | 1 | Mean Difference (IV, Fixed, 95% CI) | Totals not selected | |
| Analysis 11.11  Comparison 11 Parallel group studies, no oral steroids: 50‐100 versus 800‐1000 mcg/d (all ages), Outcome 11 Symptoms. | ||||
| 11.1 Children | 0 | Mean Difference (IV, Fixed, 95% CI) | 0.0 [0.0, 0.0] | |
| 11.2 Adults | 1 | Mean Difference (IV, Fixed, 95% CI) | 0.0 [0.0, 0.0] | |
| 12 Percentage of symptom‐free days Show forest plot | 1 | Mean Difference (IV, Fixed, 95% CI) | Totals not selected | |
| Analysis 11.12  Comparison 11 Parallel group studies, no oral steroids: 50‐100 versus 800‐1000 mcg/d (all ages), Outcome 12 Percentage of symptom‐free days. | ||||
| 12.1 Children | 0 | Mean Difference (IV, Fixed, 95% CI) | 0.0 [0.0, 0.0] | |
| 12.2 Adults | 1 | Mean Difference (IV, Fixed, 95% CI) | 0.0 [0.0, 0.0] | |
| 13 Change in daily asthma symptom score compared to baseline Show forest plot | 1 | Std. Mean Difference (IV, Fixed, 95% CI) | Totals not selected | |
| Analysis 11.13  Comparison 11 Parallel group studies, no oral steroids: 50‐100 versus 800‐1000 mcg/d (all ages), Outcome 13 Change in daily asthma symptom score compared to baseline. | ||||
| 13.1 Children | 0 | Std. Mean Difference (IV, Fixed, 95% CI) | 0.0 [0.0, 0.0] | |
| 13.2 Adults | 1 | Std. Mean Difference (IV, Fixed, 95% CI) | 0.0 [0.0, 0.0] | |
| 14 Change in number of night‐time awakenings/week compared to baseline Show forest plot | 1 | Mean Difference (IV, Fixed, 95% CI) | Totals not selected | |
| Analysis 11.14  Comparison 11 Parallel group studies, no oral steroids: 50‐100 versus 800‐1000 mcg/d (all ages), Outcome 14 Change in number of night‐time awakenings/week compared to baseline. | ||||
| 14.1 Children | 0 | Mean Difference (IV, Fixed, 95% CI) | 0.0 [0.0, 0.0] | |
| 14.2 Adults | 1 | Mean Difference (IV, Fixed, 95% CI) | 0.0 [0.0, 0.0] | |
| 15 Rescue medication usage Show forest plot | 1 | Mean Difference (IV, Fixed, 95% CI) | Totals not selected | |
| Analysis 11.15  Comparison 11 Parallel group studies, no oral steroids: 50‐100 versus 800‐1000 mcg/d (all ages), Outcome 15 Rescue medication usage. | ||||
| 15.1 Children | 0 | Mean Difference (IV, Fixed, 95% CI) | 0.0 [0.0, 0.0] | |
| 15.2 Adults | 1 | Mean Difference (IV, Fixed, 95% CI) | 0.0 [0.0, 0.0] | |
| 16 Change in daily use of beta2 agonist compared to baseline (puffs/d) Show forest plot | 1 | Mean Difference (IV, Fixed, 95% CI) | Totals not selected | |
| Analysis 11.16  Comparison 11 Parallel group studies, no oral steroids: 50‐100 versus 800‐1000 mcg/d (all ages), Outcome 16 Change in daily use of beta2 agonist compared to baseline (puffs/d). | ||||
| 16.1 Children | 0 | Mean Difference (IV, Fixed, 95% CI) | 0.0 [0.0, 0.0] | |
| 16.2 Adults | 1 | Mean Difference (IV, Fixed, 95% CI) | 0.0 [0.0, 0.0] | |
| 17 Oral Candidiasis (No. of patients) Show forest plot | 2 | 433 | Peto Odds Ratio (Peto, Fixed, 95% CI) | 0.32 [0.11, 0.97] |
| Analysis 11.17  Comparison 11 Parallel group studies, no oral steroids: 50‐100 versus 800‐1000 mcg/d (all ages), Outcome 17 Oral Candidiasis (No. of patients). | ||||
| 17.1 Children | 0 | 0 | Peto Odds Ratio (Peto, Fixed, 95% CI) | 0.0 [0.0, 0.0] |
| 17.2 Adults | 2 | 433 | Peto Odds Ratio (Peto, Fixed, 95% CI) | 0.32 [0.11, 0.97] |
| 18 Hoarseness or dysphonia (No. of patients) Show forest plot | 2 | 433 | Peto Odds Ratio (Peto, Fixed, 95% CI) | 0.18 [0.05, 0.59] |
| Analysis 11.18  Comparison 11 Parallel group studies, no oral steroids: 50‐100 versus 800‐1000 mcg/d (all ages), Outcome 18 Hoarseness or dysphonia (No. of patients). | ||||
| 18.1 Children | 0 | 0 | Peto Odds Ratio (Peto, Fixed, 95% CI) | 0.0 [0.0, 0.0] |
| 18.2 Adults | 2 | 433 | Peto Odds Ratio (Peto, Fixed, 95% CI) | 0.18 [0.05, 0.59] |
| 19 Withdrawals (total) Show forest plot | 2 | 294 | Peto Odds Ratio (Peto, Fixed, 95% CI) | 5.29 [1.59, 17.60] |
| Analysis 11.19  Comparison 11 Parallel group studies, no oral steroids: 50‐100 versus 800‐1000 mcg/d (all ages), Outcome 19 Withdrawals (total). | ||||
| 19.1 Children | 0 | 0 | Peto Odds Ratio (Peto, Fixed, 95% CI) | 0.0 [0.0, 0.0] |
| 19.2 Adults | 2 | 294 | Peto Odds Ratio (Peto, Fixed, 95% CI) | 5.29 [1.59, 17.60] |
| 20 Number of patients withdrawn due to lack of efficacy Show forest plot | 2 | 427 | Peto Odds Ratio (Peto, Fixed, 95% CI) | 5.31 [2.18, 12.96] |
| Analysis 11.20  Comparison 11 Parallel group studies, no oral steroids: 50‐100 versus 800‐1000 mcg/d (all ages), Outcome 20 Number of patients withdrawn due to lack of efficacy. | ||||
| 20.1 Children | 0 | 0 | Peto Odds Ratio (Peto, Fixed, 95% CI) | 0.0 [0.0, 0.0] |
| 20.2 Adults | 2 | 427 | Peto Odds Ratio (Peto, Fixed, 95% CI) | 5.31 [2.18, 12.96] |
| Outcome or subgroup title | No. of studies | No. of participants | Statistical method | Effect size |
| 1 Change in FEV1 compared to baseline (litres) Show forest plot | 3 | 489 | Mean Difference (IV, Fixed, 95% CI) | ‐0.11 [‐0.19, ‐0.04] |
| Analysis 12.1  Comparison 12 Parallel group studies, no oral steroids: 200 versus 800‐1000 mcg/d (all ages), Outcome 1 Change in FEV1 compared to baseline (litres). | ||||
| 1.1 Children | 0 | 0 | Mean Difference (IV, Fixed, 95% CI) | 0.0 [0.0, 0.0] |
| 1.2 Adults | 3 | 489 | Mean Difference (IV, Fixed, 95% CI) | ‐0.11 [‐0.19, ‐0.04] |
| 2 Change in FEV1 compared to baseline (%) Show forest plot | 1 | Std. Mean Difference (IV, Fixed, 95% CI) | Totals not selected | |
| Analysis 12.2  Comparison 12 Parallel group studies, no oral steroids: 200 versus 800‐1000 mcg/d (all ages), Outcome 2 Change in FEV1 compared to baseline (%). | ||||
| 2.1 Children | 0 | Std. Mean Difference (IV, Fixed, 95% CI) | 0.0 [0.0, 0.0] | |
| 2.2 Adults | 1 | Std. Mean Difference (IV, Fixed, 95% CI) | 0.0 [0.0, 0.0] | |
| 3 Change in FEV1 % predicted Show forest plot | 1 | Mean Difference (IV, Fixed, 95% CI) | Totals not selected | |
| Analysis 12.3  Comparison 12 Parallel group studies, no oral steroids: 200 versus 800‐1000 mcg/d (all ages), Outcome 3 Change in FEV1 % predicted. | ||||
| 3.1 Children | 0 | Mean Difference (IV, Fixed, 95% CI) | 0.0 [0.0, 0.0] | |
| 3.2 Adults | 1 | Mean Difference (IV, Fixed, 95% CI) | 0.0 [0.0, 0.0] | |
| 4 FEV1 (% predicted) Show forest plot | 1 | Mean Difference (IV, Fixed, 95% CI) | Totals not selected | |
| Analysis 12.4  Comparison 12 Parallel group studies, no oral steroids: 200 versus 800‐1000 mcg/d (all ages), Outcome 4 FEV1 (% predicted). | ||||
| 4.1 Children | 0 | Mean Difference (IV, Fixed, 95% CI) | 0.0 [0.0, 0.0] | |
| 4.2 Adults | 1 | Mean Difference (IV, Fixed, 95% CI) | 0.0 [0.0, 0.0] | |
| 5 Change in morning PEFR compared to baseline (L/min) Show forest plot | 4 | 763 | Mean Difference (IV, Random, 95% CI) | ‐8.32 [‐18.02, 1.37] |
| Analysis 12.5  Comparison 12 Parallel group studies, no oral steroids: 200 versus 800‐1000 mcg/d (all ages), Outcome 5 Change in morning PEFR compared to baseline (L/min). | ||||
| 5.1 Children | 0 | 0 | Mean Difference (IV, Random, 95% CI) | 0.0 [0.0, 0.0] |
| 5.2 Adults | 4 | 763 | Mean Difference (IV, Random, 95% CI) | ‐8.32 [‐18.02, 1.37] |
| 6 Change in evening PEFR compared to baseline (L/min) Show forest plot | 2 | 424 | Mean Difference (IV, Fixed, 95% CI) | ‐7.81 [‐14.66, ‐0.95] |
| Analysis 12.6  Comparison 12 Parallel group studies, no oral steroids: 200 versus 800‐1000 mcg/d (all ages), Outcome 6 Change in evening PEFR compared to baseline (L/min). | ||||
| 6.1 Children | 0 | 0 | Mean Difference (IV, Fixed, 95% CI) | 0.0 [0.0, 0.0] |
| 6.2 Adults | 2 | 424 | Mean Difference (IV, Fixed, 95% CI) | ‐7.81 [‐14.66, ‐0.95] |
| 7 Change in FVC compared to baseline (litres) Show forest plot | 1 | Mean Difference (IV, Fixed, 95% CI) | Totals not selected | |
| Analysis 12.7  Comparison 12 Parallel group studies, no oral steroids: 200 versus 800‐1000 mcg/d (all ages), Outcome 7 Change in FVC compared to baseline (litres). | ||||
| 7.1 Children | 0 | Mean Difference (IV, Fixed, 95% CI) | 0.0 [0.0, 0.0] | |
| 7.2 Adults | 1 | Mean Difference (IV, Fixed, 95% CI) | 0.0 [0.0, 0.0] | |
| 8 Change in FEF25‐75 compared to baseline (L/second) Show forest plot | 1 | Mean Difference (IV, Fixed, 95% CI) | Totals not selected | |
| Analysis 12.8  Comparison 12 Parallel group studies, no oral steroids: 200 versus 800‐1000 mcg/d (all ages), Outcome 8 Change in FEF25‐75 compared to baseline (L/second). | ||||
| 8.1 Children | 0 | Mean Difference (IV, Fixed, 95% CI) | 0.0 [0.0, 0.0] | |
| 8.2 Adults | 1 | Mean Difference (IV, Fixed, 95% CI) | 0.0 [0.0, 0.0] | |
| 9 PD20 Show forest plot | 1 | Mean Difference (IV, Fixed, 95% CI) | Totals not selected | |
| Analysis 12.9  Comparison 12 Parallel group studies, no oral steroids: 200 versus 800‐1000 mcg/d (all ages), Outcome 9 PD20. | ||||
| 9.1 Children | 0 | Mean Difference (IV, Fixed, 95% CI) | 0.0 [0.0, 0.0] | |
| 9.2 Adults | 1 | Mean Difference (IV, Fixed, 95% CI) | 0.0 [0.0, 0.0] | |
| 10 Change in daily asthma symptom score compared to baseline Show forest plot | 2 | 291 | Std. Mean Difference (IV, Fixed, 95% CI) | 0.06 [‐0.17, 0.29] |
| Analysis 12.10  Comparison 12 Parallel group studies, no oral steroids: 200 versus 800‐1000 mcg/d (all ages), Outcome 10 Change in daily asthma symptom score compared to baseline. | ||||
| 10.1 Children | 0 | 0 | Std. Mean Difference (IV, Fixed, 95% CI) | 0.0 [0.0, 0.0] |
| 10.2 Adults | 2 | 291 | Std. Mean Difference (IV, Fixed, 95% CI) | 0.06 [‐0.17, 0.29] |
| 11 Change in number of night‐time awakenings/week compared to baseline Show forest plot | 1 | Mean Difference (IV, Fixed, 95% CI) | Totals not selected | |
| Analysis 12.11  Comparison 12 Parallel group studies, no oral steroids: 200 versus 800‐1000 mcg/d (all ages), Outcome 11 Change in number of night‐time awakenings/week compared to baseline. | ||||
| 11.1 Children | 0 | Mean Difference (IV, Fixed, 95% CI) | 0.0 [0.0, 0.0] | |
| 11.2 Adults | 1 | Mean Difference (IV, Fixed, 95% CI) | 0.0 [0.0, 0.0] | |
| 12 Physician global rated efficacy: ineffective Show forest plot | 2 | 400 | Peto Odds Ratio (Peto, Fixed, 95% CI) | 1.34 [0.85, 2.12] |
| Analysis 12.12  Comparison 12 Parallel group studies, no oral steroids: 200 versus 800‐1000 mcg/d (all ages), Outcome 12 Physician global rated efficacy: ineffective. | ||||
| 12.1 Children | 0 | 0 | Peto Odds Ratio (Peto, Fixed, 95% CI) | 0.0 [0.0, 0.0] |
| 12.2 Adults | 2 | 400 | Peto Odds Ratio (Peto, Fixed, 95% CI) | 1.34 [0.85, 2.12] |
| 13 Change in daily use of beta2 agonist compared to baseline (puffs/d) Show forest plot | 2 | 291 | Mean Difference (IV, Fixed, 95% CI) | 0.11 [‐0.29, 0.50] |
| Analysis 12.13  Comparison 12 Parallel group studies, no oral steroids: 200 versus 800‐1000 mcg/d (all ages), Outcome 13 Change in daily use of beta2 agonist compared to baseline (puffs/d). | ||||
| 13.1 Children | 0 | 0 | Mean Difference (IV, Fixed, 95% CI) | 0.0 [0.0, 0.0] |
| 13.2 Adults | 2 | 291 | Mean Difference (IV, Fixed, 95% CI) | 0.11 [‐0.29, 0.50] |
| 14 Number of patients withdrawn due to lack of efficacy Show forest plot | 4 | 554 | Peto Odds Ratio (Peto, Fixed, 95% CI) | 1.32 [0.73, 2.40] |
| Analysis 12.14  Comparison 12 Parallel group studies, no oral steroids: 200 versus 800‐1000 mcg/d (all ages), Outcome 14 Number of patients withdrawn due to lack of efficacy. | ||||
| 14.1 Children | 0 | 0 | Peto Odds Ratio (Peto, Fixed, 95% CI) | 0.0 [0.0, 0.0] |
| 14.2 Adults | 4 | 554 | Peto Odds Ratio (Peto, Fixed, 95% CI) | 1.32 [0.73, 2.40] |
| 15 Oral Candidiasis (No. of patients) Show forest plot | 5 | 618 | Peto Odds Ratio (Peto, Fixed, 95% CI) | 0.33 [0.16, 0.70] |
| Analysis 12.15  Comparison 12 Parallel group studies, no oral steroids: 200 versus 800‐1000 mcg/d (all ages), Outcome 15 Oral Candidiasis (No. of patients). | ||||
| 15.1 Children | 0 | 0 | Peto Odds Ratio (Peto, Fixed, 95% CI) | 0.0 [0.0, 0.0] |
| 15.2 Adults | 5 | 618 | Peto Odds Ratio (Peto, Fixed, 95% CI) | 0.33 [0.16, 0.70] |
| 16 Sore throat or pharyngitis (No. of patients) Show forest plot | 4 | 452 | Peto Odds Ratio (Peto, Fixed, 95% CI) | 0.49 [0.18, 1.39] |
| Analysis 12.16  Comparison 12 Parallel group studies, no oral steroids: 200 versus 800‐1000 mcg/d (all ages), Outcome 16 Sore throat or pharyngitis (No. of patients). | ||||
| 16.1 Children | 0 | 0 | Peto Odds Ratio (Peto, Fixed, 95% CI) | 0.0 [0.0, 0.0] |
| 16.2 Adults | 4 | 452 | Peto Odds Ratio (Peto, Fixed, 95% CI) | 0.49 [0.18, 1.39] |
| 17 Hoarseness or dysphonia (No. of patients) Show forest plot | 4 | 561 | Peto Odds Ratio (Peto, Fixed, 95% CI) | 0.51 [0.24, 1.08] |
| Analysis 12.17  Comparison 12 Parallel group studies, no oral steroids: 200 versus 800‐1000 mcg/d (all ages), Outcome 17 Hoarseness or dysphonia (No. of patients). | ||||
| 17.1 Children | 0 | 0 | Peto Odds Ratio (Peto, Fixed, 95% CI) | 0.0 [0.0, 0.0] |
| 17.2 Adults | 4 | 561 | Peto Odds Ratio (Peto, Fixed, 95% CI) | 0.51 [0.24, 1.08] |
| 18 Change in peak plasma cortisol compared to baseline (mcg/dL) Show forest plot | 1 | Mean Difference (IV, Fixed, 95% CI) | Totals not selected | |
| Analysis 12.18  Comparison 12 Parallel group studies, no oral steroids: 200 versus 800‐1000 mcg/d (all ages), Outcome 18 Change in peak plasma cortisol compared to baseline (mcg/dL). | ||||
| 18.1 Children | 0 | Mean Difference (IV, Fixed, 95% CI) | 0.0 [0.0, 0.0] | |
| 18.2 Adults | 1 | Mean Difference (IV, Fixed, 95% CI) | 0.0 [0.0, 0.0] | |
| 19 Change in morning plasma cortisol compared to baseline (mcg/dL) Show forest plot | 1 | Mean Difference (IV, Fixed, 95% CI) | Totals not selected | |
| Analysis 12.19  Comparison 12 Parallel group studies, no oral steroids: 200 versus 800‐1000 mcg/d (all ages), Outcome 19 Change in morning plasma cortisol compared to baseline (mcg/dL). | ||||
| 19.1 Children | 0 | Mean Difference (IV, Fixed, 95% CI) | 0.0 [0.0, 0.0] | |
| 19.2 Adults | 1 | Mean Difference (IV, Fixed, 95% CI) | 0.0 [0.0, 0.0] | |
| Outcome or subgroup title | No. of studies | No. of participants | Statistical method | Effect size |
| 1 Change in FEV1 compared to baseline based on study duration (litres) ‐ adults Show forest plot | 3 | 489 | Mean Difference (IV, Fixed, 95% CI) | ‐0.11 [‐0.19, ‐0.04] |
| Analysis 13.1  Comparison 13 Parallel group studies, no oral steroids: 200 versus 800‐1000 mcg/d (subgroups), Outcome 1 Change in FEV1 compared to baseline based on study duration (litres) ‐ adults. | ||||
| 1.1 1‐4 weeks | 0 | 0 | Mean Difference (IV, Fixed, 95% CI) | 0.0 [0.0, 0.0] |
| 1.2 1‐5 months | 3 | 489 | Mean Difference (IV, Fixed, 95% CI) | ‐0.11 [‐0.19, ‐0.04] |
| 1.3 6 months or longer | 0 | 0 | Mean Difference (IV, Fixed, 95% CI) | 0.0 [0.0, 0.0] |
| 2 Change in FEV1 compared to baseline based on delivery devices (litres) ‐ adults Show forest plot | 3 | 489 | Mean Difference (IV, Fixed, 95% CI) | ‐0.11 [‐0.19, ‐0.04] |
| Analysis 13.2  Comparison 13 Parallel group studies, no oral steroids: 200 versus 800‐1000 mcg/d (subgroups), Outcome 2 Change in FEV1 compared to baseline based on delivery devices (litres) ‐ adults. | ||||
| 2.1 MDI | 2 | 357 | Mean Difference (IV, Fixed, 95% CI) | ‐0.10 [‐0.19, ‐0.02] |
| 2.2 DPI | 1 | 132 | Mean Difference (IV, Fixed, 95% CI) | ‐0.15 [‐0.32, 0.02] |
| 3 Change in FEV1 compared to baseline based on degrees of severity (litres) ‐ adults Show forest plot | 3 | 489 | Mean Difference (IV, Fixed, 95% CI) | ‐0.11 [‐0.19, ‐0.04] |
| Analysis 13.3  Comparison 13 Parallel group studies, no oral steroids: 200 versus 800‐1000 mcg/d (subgroups), Outcome 3 Change in FEV1 compared to baseline based on degrees of severity (litres) ‐ adults. | ||||
| 3.1 Mild to moderate | 1 | 159 | Mean Difference (IV, Fixed, 95% CI) | ‐0.12 [‐0.26, 0.02] |
| 3.2 Moderate | 2 | 330 | Mean Difference (IV, Fixed, 95% CI) | ‐0.11 [‐0.20, ‐0.02] |
| Outcome or subgroup title | No. of studies | No. of participants | Statistical method | Effect size |
| 1 FEV1 (Change from baseline ‐ litres) Show forest plot | 1 | Mean Difference (IV, Fixed, 95% CI) | Totals not selected | |
| Analysis 14.1  Comparison 14 Parallel group studies, no oral steroids: 4‐500 versus 1500‐2000mcg/d (all ages), Outcome 1 FEV1 (Change from baseline ‐ litres). | ||||
| 1.1 Children | 0 | Mean Difference (IV, Fixed, 95% CI) | 0.0 [0.0, 0.0] | |
| 1.2 Adults | 1 | Mean Difference (IV, Fixed, 95% CI) | 0.0 [0.0, 0.0] | |
| 2 Clinic PEF (L/min ‐ change from baseline) Show forest plot | 1 | Mean Difference (IV, Fixed, 95% CI) | Totals not selected | |
| Analysis 14.2  Comparison 14 Parallel group studies, no oral steroids: 4‐500 versus 1500‐2000mcg/d (all ages), Outcome 2 Clinic PEF (L/min ‐ change from baseline). | ||||
| 2.1 Children | 0 | Mean Difference (IV, Fixed, 95% CI) | 0.0 [0.0, 0.0] | |
| 2.2 Adults | 1 | Mean Difference (IV, Fixed, 95% CI) | 0.0 [0.0, 0.0] | |
| 3 PC20 (methacholine) Show forest plot | 1 | Mean Difference (IV, Fixed, 95% CI) | Totals not selected | |
| Analysis 14.3  Comparison 14 Parallel group studies, no oral steroids: 4‐500 versus 1500‐2000mcg/d (all ages), Outcome 3 PC20 (methacholine). | ||||
| 3.1 Children | 0 | Mean Difference (IV, Fixed, 95% CI) | 0.0 [0.0, 0.0] | |
| 3.2 Adults | 1 | Mean Difference (IV, Fixed, 95% CI) | 0.0 [0.0, 0.0] | |
| 4 PC20 AMP Show forest plot | 1 | Mean Difference (IV, Fixed, 95% CI) | Totals not selected | |
| Analysis 14.4  Comparison 14 Parallel group studies, no oral steroids: 4‐500 versus 1500‐2000mcg/d (all ages), Outcome 4 PC20 AMP. | ||||
| 4.1 Children | 0 | Mean Difference (IV, Fixed, 95% CI) | 0.0 [0.0, 0.0] | |
| 4.2 Adults | 1 | Mean Difference (IV, Fixed, 95% CI) | 0.0 [0.0, 0.0] | |
| 5 Symptoms (change from baseline) Show forest plot | 1 | Mean Difference (IV, Fixed, 95% CI) | Totals not selected | |
| Analysis 14.5  Comparison 14 Parallel group studies, no oral steroids: 4‐500 versus 1500‐2000mcg/d (all ages), Outcome 5 Symptoms (change from baseline). | ||||
| 5.1 Children | 0 | Mean Difference (IV, Fixed, 95% CI) | 0.0 [0.0, 0.0] | |
| 5.2 Adults | 1 | Mean Difference (IV, Fixed, 95% CI) | 0.0 [0.0, 0.0] | |
| Outcome or subgroup title | No. of studies | No. of participants | Statistical method | Effect size |
| 1 Change in daily dose of oral prednisolone compared to baseline (mg) Show forest plot | 4 | 274 | Mean Difference (IV, Fixed, 95% CI) | 1.00 [‐0.45, 2.45] |
| Analysis 15.1  Comparison 15 Parallel studies, oral steroid treated: 1000‐1500 versus 2000 mcg/d, Outcome 1 Change in daily dose of oral prednisolone compared to baseline (mg). | ||||
| 2 Number of patients unable to discontinue OCS completely Show forest plot | 4 | 274 | Peto Odds Ratio (Peto, Fixed, 95% CI) | 1.53 [0.88, 2.68] |
| Analysis 15.2  Comparison 15 Parallel studies, oral steroid treated: 1000‐1500 versus 2000 mcg/d, Outcome 2 Number of patients unable to discontinue OCS completely. | ||||
| 3 Change in FEV1 compared to baseline (litres) Show forest plot | 4 | 274 | Mean Difference (IV, Fixed, 95% CI) | ‐0.13 [‐0.24, ‐0.01] |
| Analysis 15.3  Comparison 15 Parallel studies, oral steroid treated: 1000‐1500 versus 2000 mcg/d, Outcome 3 Change in FEV1 compared to baseline (litres). | ||||
| 4 Change in morning PEFR compared to baseline (L/min) Show forest plot | 4 | 274 | Mean Difference (IV, Fixed, 95% CI) | ‐19.63 [‐34.98, ‐4.27] |
| Analysis 15.4  Comparison 15 Parallel studies, oral steroid treated: 1000‐1500 versus 2000 mcg/d, Outcome 4 Change in morning PEFR compared to baseline (L/min). | ||||
| 5 Change in evening PEFR compared to baseline (L/min) Show forest plot | 4 | 274 | Mean Difference (IV, Fixed, 95% CI) | ‐21.58 [‐35.20, ‐7.97] |
| Analysis 15.5  Comparison 15 Parallel studies, oral steroid treated: 1000‐1500 versus 2000 mcg/d, Outcome 5 Change in evening PEFR compared to baseline (L/min). | ||||
| 6 Change in daily asthma symptom score compared to baseline Show forest plot | 4 | 274 | Std. Mean Difference (IV, Fixed, 95% CI) | 0.15 [‐0.09, 0.39] |
| Analysis 15.6  Comparison 15 Parallel studies, oral steroid treated: 1000‐1500 versus 2000 mcg/d, Outcome 6 Change in daily asthma symptom score compared to baseline. | ||||
| 7 Change in rescue beta2 agonist use compared to baseline (puffs/d) Show forest plot | 4 | 274 | Mean Difference (IV, Fixed, 95% CI) | ‐0.14 [‐1.05, 0.78] |
| Analysis 15.7  Comparison 15 Parallel studies, oral steroid treated: 1000‐1500 versus 2000 mcg/d, Outcome 7 Change in rescue beta2 agonist use compared to baseline (puffs/d). | ||||
| 8 Asthma Quality of Life Questionnaire: change in overall score compared to baseline Show forest plot | 3 | 187 | Mean Difference (IV, Fixed, 95% CI) | ‐0.12 [‐0.48, 0.23] |
| Analysis 15.8  Comparison 15 Parallel studies, oral steroid treated: 1000‐1500 versus 2000 mcg/d, Outcome 8 Asthma Quality of Life Questionnaire: change in overall score compared to baseline. | ||||
| 9 Asthma Quality of Life Questionnaire: change in activity limitation domain compared to baseline Show forest plot | 1 | Mean Difference (IV, Fixed, 95% CI) | Totals not selected | |
| Analysis 15.9  Comparison 15 Parallel studies, oral steroid treated: 1000‐1500 versus 2000 mcg/d, Outcome 9 Asthma Quality of Life Questionnaire: change in activity limitation domain compared to baseline. | ||||
| 10 Asthma Quality of Life Questionnaire: change in symptom domain compared to baseline Show forest plot | 1 | Mean Difference (IV, Fixed, 95% CI) | Totals not selected | |
| Analysis 15.10  Comparison 15 Parallel studies, oral steroid treated: 1000‐1500 versus 2000 mcg/d, Outcome 10 Asthma Quality of Life Questionnaire: change in symptom domain compared to baseline. | ||||
| 11 Asthma Quality of Life Questionnaire: change in emotional function domain compared to baseline Show forest plot | 1 | Mean Difference (IV, Fixed, 95% CI) | Totals not selected | |
| Analysis 15.11  Comparison 15 Parallel studies, oral steroid treated: 1000‐1500 versus 2000 mcg/d, Outcome 11 Asthma Quality of Life Questionnaire: change in emotional function domain compared to baseline. | ||||
| 12 Asthma Quality of Life Questionnaire: change in environmental exposure domain compared to baseline Show forest plot | 1 | Mean Difference (IV, Fixed, 95% CI) | Totals not selected | |
| Analysis 15.12  Comparison 15 Parallel studies, oral steroid treated: 1000‐1500 versus 2000 mcg/d, Outcome 12 Asthma Quality of Life Questionnaire: change in environmental exposure domain compared to baseline. | ||||
| 13 Sore throat (No. of patients) Show forest plot | 2 | 141 | Peto Odds Ratio (Peto, Fixed, 95% CI) | 0.70 [0.15, 3.18] |
| Analysis 15.13  Comparison 15 Parallel studies, oral steroid treated: 1000‐1500 versus 2000 mcg/d, Outcome 13 Sore throat (No. of patients). | ||||
| 14 Hoarseness/dysphonia (No. of patients) Show forest plot | 2 | 141 | Peto Odds Ratio (Peto, Fixed, 95% CI) | 0.92 [0.28, 2.99] |
| Analysis 15.14  Comparison 15 Parallel studies, oral steroid treated: 1000‐1500 versus 2000 mcg/d, Outcome 14 Hoarseness/dysphonia (No. of patients). | ||||
| 15 Oral Candidiasis (No. of patients) Show forest plot | 2 | 141 | Peto Odds Ratio (Peto, Fixed, 95% CI) | 0.96 [0.41, 2.24] |
| Analysis 15.15  Comparison 15 Parallel studies, oral steroid treated: 1000‐1500 versus 2000 mcg/d, Outcome 15 Oral Candidiasis (No. of patients). | ||||
| Outcome or subgroup title | No. of studies | No. of participants | Statistical method | Effect size |
| 1 FEV1 Show forest plot | 1 | Litres (Fixed, 95% CI) | Totals not selected | |
| Analysis 16.1  Comparison 16 Crossover studies, no oral steroids: 200 versus 1000 mcg (all ages), Outcome 1 FEV1. | ||||
| 2 PEF Show forest plot | 1 | Litres/min (Fixed, 95% CI) | Totals not selected | |
| Analysis 16.2  Comparison 16 Crossover studies, no oral steroids: 200 versus 1000 mcg (all ages), Outcome 2 PEF. | ||||

Methodological quality summary: review authors' judgements about each methodological quality item for each included study.

Comparison 1 Parallel group studies, no oral steroids: 50 versus 100 mcg/d (all ages), Outcome 1 Change in FEV1 compared to baseline (litres).
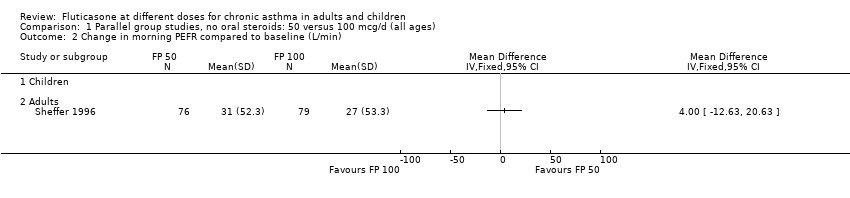
Comparison 1 Parallel group studies, no oral steroids: 50 versus 100 mcg/d (all ages), Outcome 2 Change in morning PEFR compared to baseline (L/min).

Comparison 1 Parallel group studies, no oral steroids: 50 versus 100 mcg/d (all ages), Outcome 3 Change in morning PEFR compared to baseline (L/min).
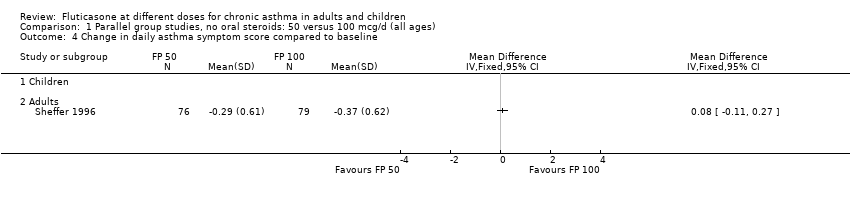
Comparison 1 Parallel group studies, no oral steroids: 50 versus 100 mcg/d (all ages), Outcome 4 Change in daily asthma symptom score compared to baseline.

Comparison 1 Parallel group studies, no oral steroids: 50 versus 100 mcg/d (all ages), Outcome 5 Change in number of night‐time awakenings/week compared to baseline.

Comparison 1 Parallel group studies, no oral steroids: 50 versus 100 mcg/d (all ages), Outcome 6 Change in daily use of beta2 agonist compared to baseline (puffs/d).
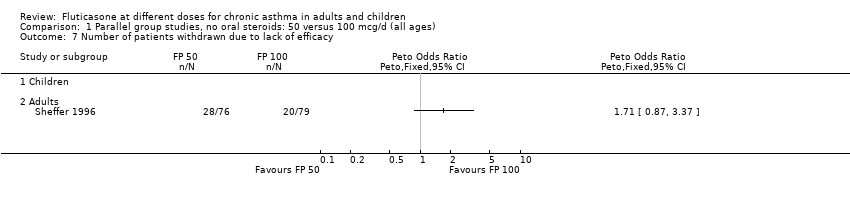
Comparison 1 Parallel group studies, no oral steroids: 50 versus 100 mcg/d (all ages), Outcome 7 Number of patients withdrawn due to lack of efficacy.
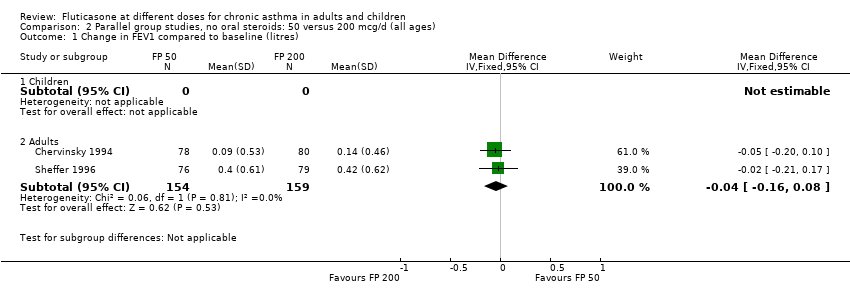
Comparison 2 Parallel group studies, no oral steroids: 50 versus 200 mcg/d (all ages), Outcome 1 Change in FEV1 compared to baseline (litres).
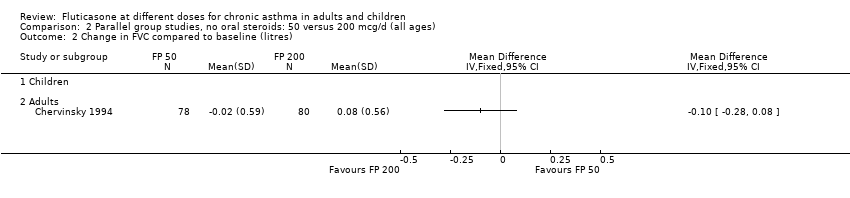
Comparison 2 Parallel group studies, no oral steroids: 50 versus 200 mcg/d (all ages), Outcome 2 Change in FVC compared to baseline (litres).

Comparison 2 Parallel group studies, no oral steroids: 50 versus 200 mcg/d (all ages), Outcome 3 Change in FEF25‐75 compared to baseline (L/second).

Comparison 2 Parallel group studies, no oral steroids: 50 versus 200 mcg/d (all ages), Outcome 4 Change in morning PEFR compared to baseline (L/min).
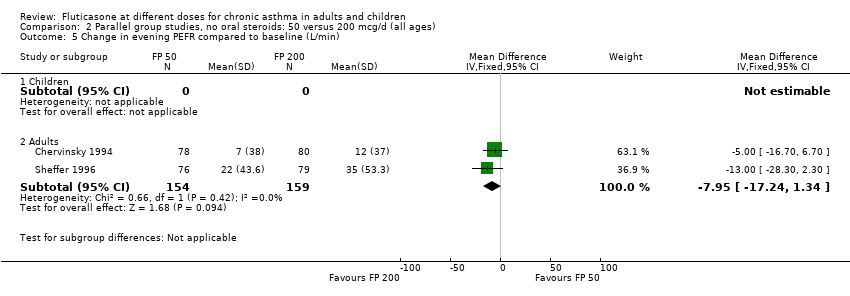
Comparison 2 Parallel group studies, no oral steroids: 50 versus 200 mcg/d (all ages), Outcome 5 Change in evening PEFR compared to baseline (L/min).

Comparison 2 Parallel group studies, no oral steroids: 50 versus 200 mcg/d (all ages), Outcome 6 Change in daily asthma symptom score compared to baseline.
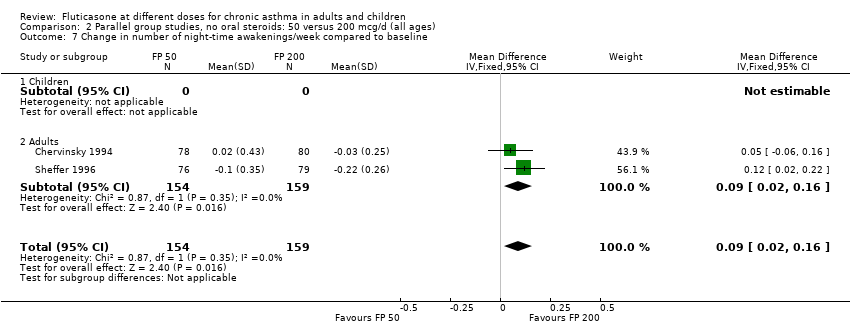
Comparison 2 Parallel group studies, no oral steroids: 50 versus 200 mcg/d (all ages), Outcome 7 Change in number of night‐time awakenings/week compared to baseline.

Comparison 2 Parallel group studies, no oral steroids: 50 versus 200 mcg/d (all ages), Outcome 8 Change in daily use of beta2 agonist compared to baseline (puffs/d).
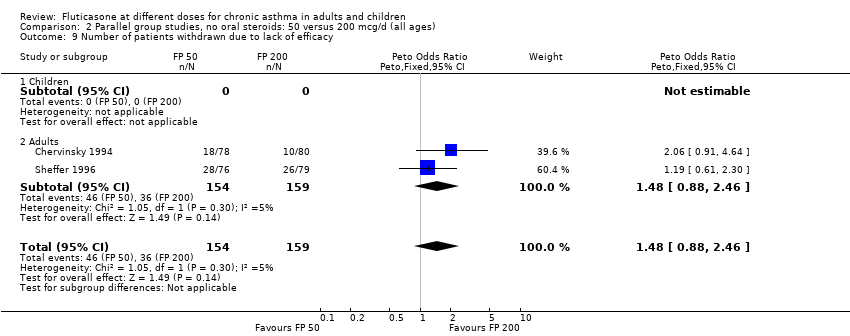
Comparison 2 Parallel group studies, no oral steroids: 50 versus 200 mcg/d (all ages), Outcome 9 Number of patients withdrawn due to lack of efficacy.

Comparison 2 Parallel group studies, no oral steroids: 50 versus 200 mcg/d (all ages), Outcome 10 Hoarseness or dysphonia (No. of patients).
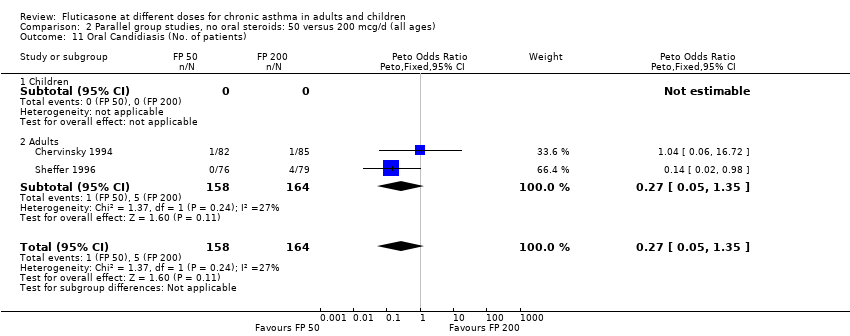
Comparison 2 Parallel group studies, no oral steroids: 50 versus 200 mcg/d (all ages), Outcome 11 Oral Candidiasis (No. of patients).

Comparison 2 Parallel group studies, no oral steroids: 50 versus 200 mcg/d (all ages), Outcome 12 Physician global rated efficacy: ineffective.

Comparison 3 Parallel group studies, no oral steroids: 100 versus 200 mcg/d (all ages), Outcome 1 Change in FEV1 compared to baseline (litres).
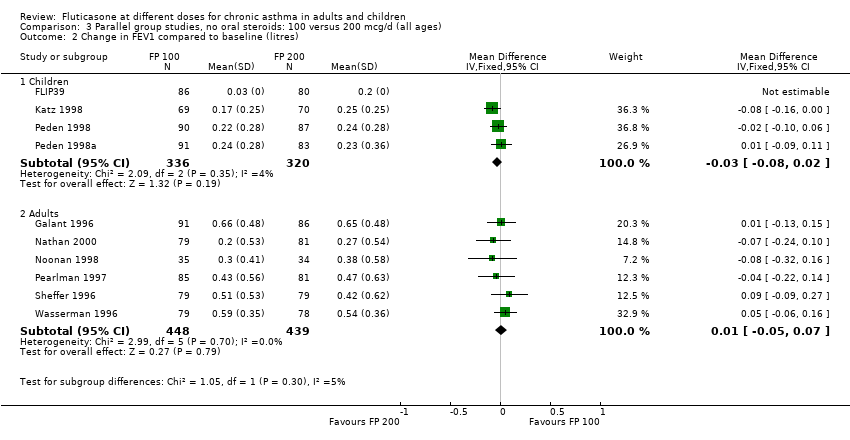
Comparison 3 Parallel group studies, no oral steroids: 100 versus 200 mcg/d (all ages), Outcome 2 Change in FEV1 compared to baseline (litres).

Comparison 3 Parallel group studies, no oral steroids: 100 versus 200 mcg/d (all ages), Outcome 3 FEV1 (% predicted).

Comparison 3 Parallel group studies, no oral steroids: 100 versus 200 mcg/d (all ages), Outcome 4 FEV1 (% predicted).
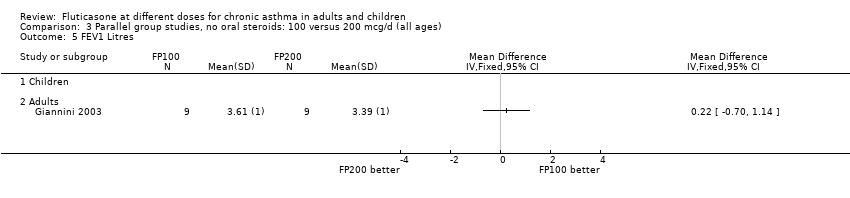
Comparison 3 Parallel group studies, no oral steroids: 100 versus 200 mcg/d (all ages), Outcome 5 FEV1 Litres.
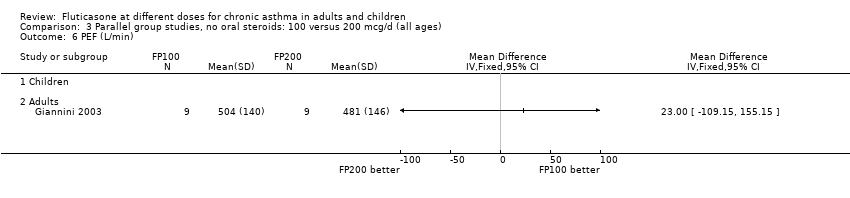
Comparison 3 Parallel group studies, no oral steroids: 100 versus 200 mcg/d (all ages), Outcome 6 PEF (L/min).
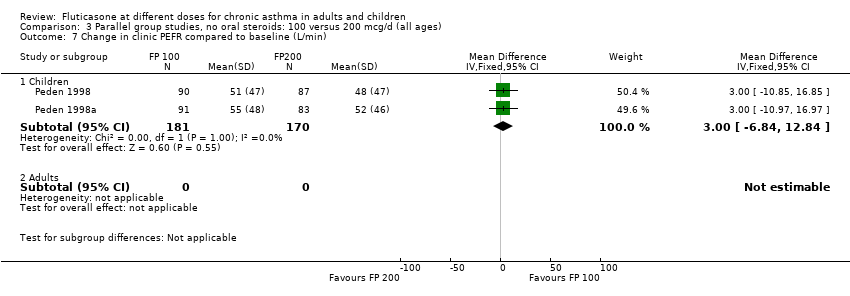
Comparison 3 Parallel group studies, no oral steroids: 100 versus 200 mcg/d (all ages), Outcome 7 Change in clinic PEFR compared to baseline (L/min).
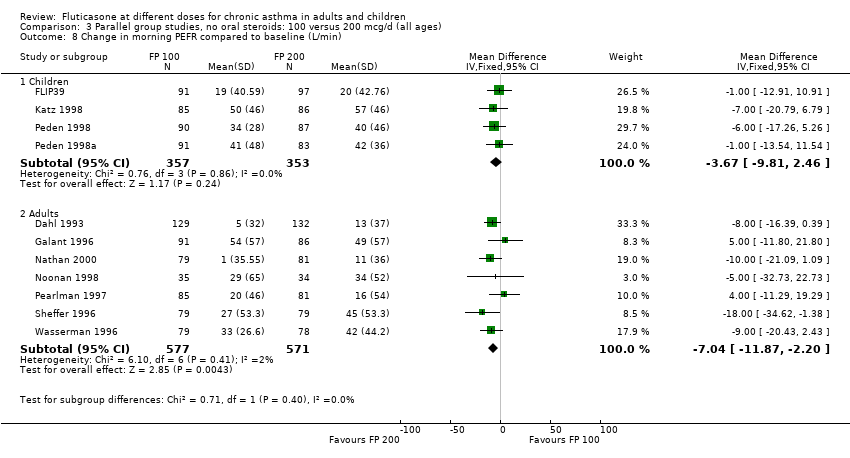
Comparison 3 Parallel group studies, no oral steroids: 100 versus 200 mcg/d (all ages), Outcome 8 Change in morning PEFR compared to baseline (L/min).
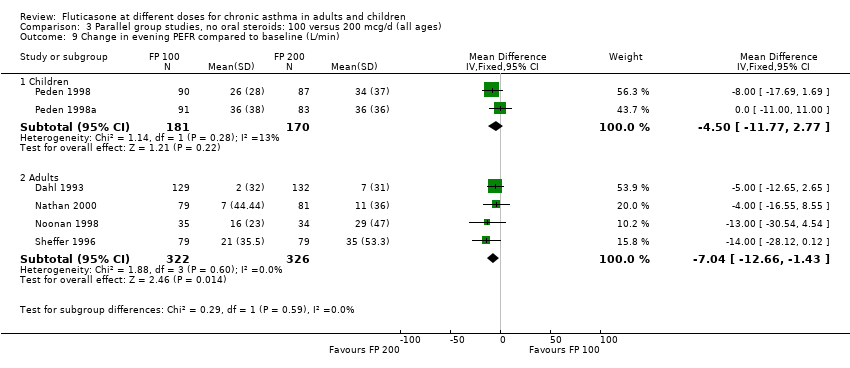
Comparison 3 Parallel group studies, no oral steroids: 100 versus 200 mcg/d (all ages), Outcome 9 Change in evening PEFR compared to baseline (L/min).
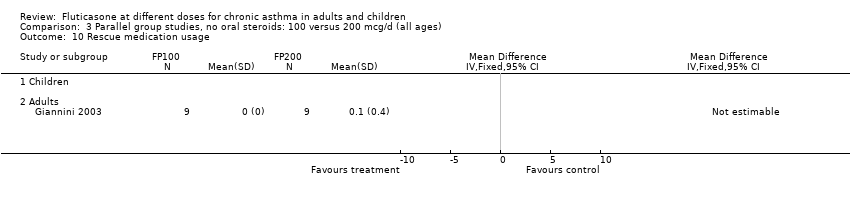
Comparison 3 Parallel group studies, no oral steroids: 100 versus 200 mcg/d (all ages), Outcome 10 Rescue medication usage.
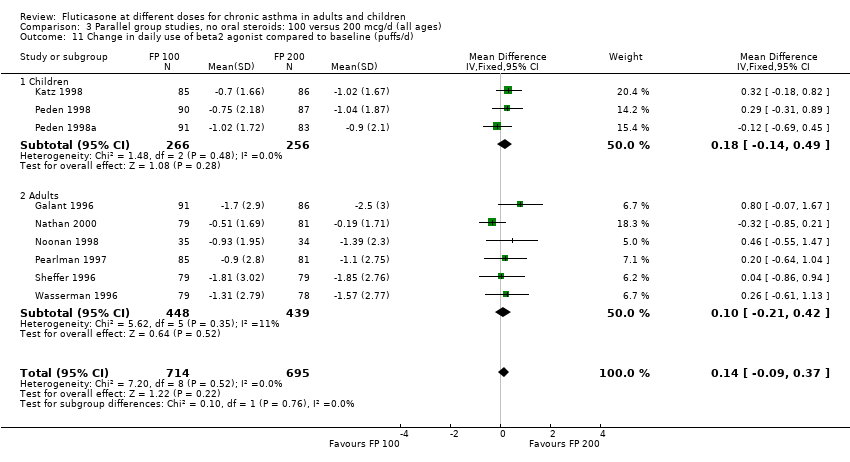
Comparison 3 Parallel group studies, no oral steroids: 100 versus 200 mcg/d (all ages), Outcome 11 Change in daily use of beta2 agonist compared to baseline (puffs/d).
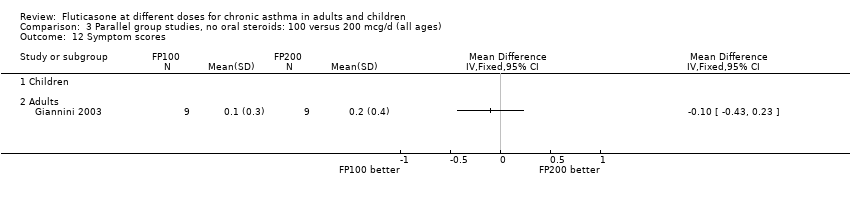
Comparison 3 Parallel group studies, no oral steroids: 100 versus 200 mcg/d (all ages), Outcome 12 Symptom scores.
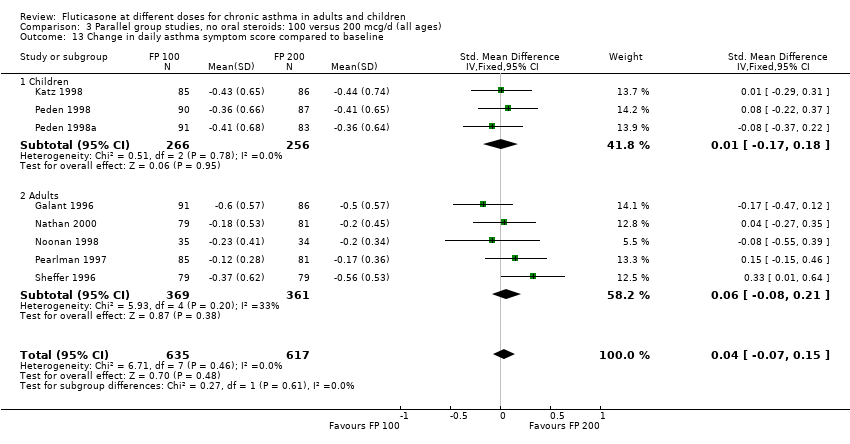
Comparison 3 Parallel group studies, no oral steroids: 100 versus 200 mcg/d (all ages), Outcome 13 Change in daily asthma symptom score compared to baseline.

Comparison 3 Parallel group studies, no oral steroids: 100 versus 200 mcg/d (all ages), Outcome 14 Change in number of night‐time awakenings/week compared to baseline.

Comparison 3 Parallel group studies, no oral steroids: 100 versus 200 mcg/d (all ages), Outcome 15 Percentage of symptom‐free days.

Comparison 3 Parallel group studies, no oral steroids: 100 versus 200 mcg/d (all ages), Outcome 16 Change in night‐time awakening score compared to baseline.
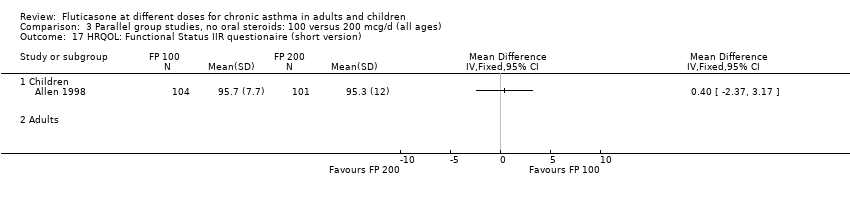
Comparison 3 Parallel group studies, no oral steroids: 100 versus 200 mcg/d (all ages), Outcome 17 HRQOL: Functional Status IIR questionaire (short version).

Comparison 3 Parallel group studies, no oral steroids: 100 versus 200 mcg/d (all ages), Outcome 18 HRQOL: Sleep Scale Children questionnaire.

Comparison 3 Parallel group studies, no oral steroids: 100 versus 200 mcg/d (all ages), Outcome 19 HRQOL: Quality of Life of Parents of Asthmatic Children questionnaire, burden dimension.

Comparison 3 Parallel group studies, no oral steroids: 100 versus 200 mcg/d (all ages), Outcome 20 HRQOL: Quality of Life of Parents of Asthmatic Children questionnaire, subjective norms dimension.

Comparison 3 Parallel group studies, no oral steroids: 100 versus 200 mcg/d (all ages), Outcome 21 HRQOL: Quality of Life of Parents of Asthmatic Children questionnaire, subjective norms dimension.

Comparison 3 Parallel group studies, no oral steroids: 100 versus 200 mcg/d (all ages), Outcome 22 Physician global rated efficacy: ineffective.
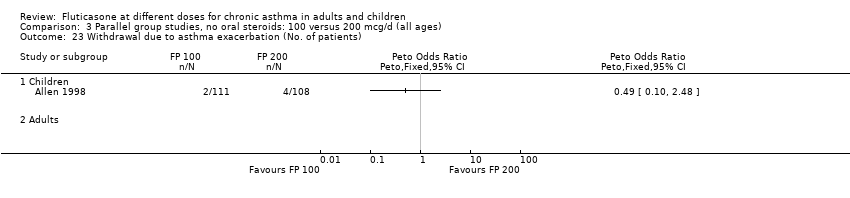
Comparison 3 Parallel group studies, no oral steroids: 100 versus 200 mcg/d (all ages), Outcome 23 Withdrawal due to asthma exacerbation (No. of patients).

Comparison 3 Parallel group studies, no oral steroids: 100 versus 200 mcg/d (all ages), Outcome 24 Withdrawals due to adverse events.

Comparison 3 Parallel group studies, no oral steroids: 100 versus 200 mcg/d (all ages), Outcome 25 Number of patients withdrawn due to lack of efficacy.

Comparison 3 Parallel group studies, no oral steroids: 100 versus 200 mcg/d (all ages), Outcome 26 Oral Candidiasis (No. of patients).

Comparison 3 Parallel group studies, no oral steroids: 100 versus 200 mcg/d (all ages), Outcome 27 Headaches.

Comparison 3 Parallel group studies, no oral steroids: 100 versus 200 mcg/d (all ages), Outcome 28 Sore throat or pharyngitis (No. of patients).

Comparison 3 Parallel group studies, no oral steroids: 100 versus 200 mcg/d (all ages), Outcome 29 Hoarseness or dysphonia (No. of patients).
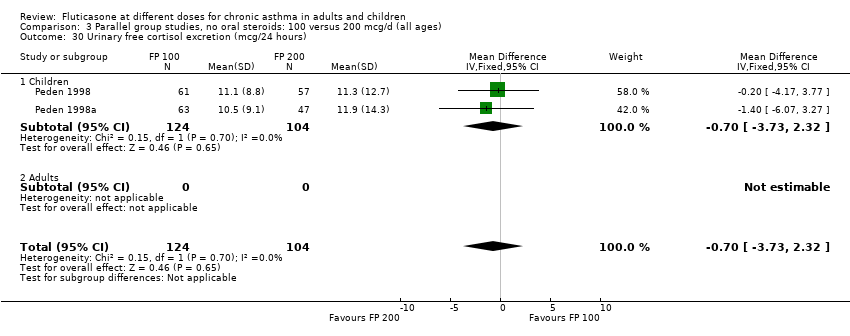
Comparison 3 Parallel group studies, no oral steroids: 100 versus 200 mcg/d (all ages), Outcome 30 Urinary free cortisol excretion (mcg/24 hours).

Comparison 3 Parallel group studies, no oral steroids: 100 versus 200 mcg/d (all ages), Outcome 31 Morning plasma cortisol (mcg/dL).

Comparison 4 Parallel group studies, no oral steroids: 100 versus 200 mcg/d (subgroups), Outcome 1 Change in FEV1 compared to baseline based on study duration(litres) ‐ children.
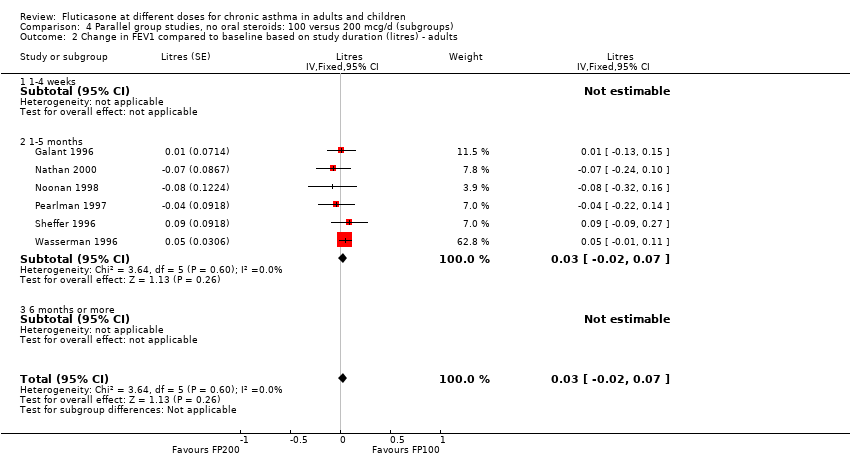
Comparison 4 Parallel group studies, no oral steroids: 100 versus 200 mcg/d (subgroups), Outcome 2 Change in FEV1 compared to baseline based on study duration (litres) ‐ adults.

Comparison 4 Parallel group studies, no oral steroids: 100 versus 200 mcg/d (subgroups), Outcome 3 Change in FEV1 compared to baseline (litres) based on delivery devices ‐ children.
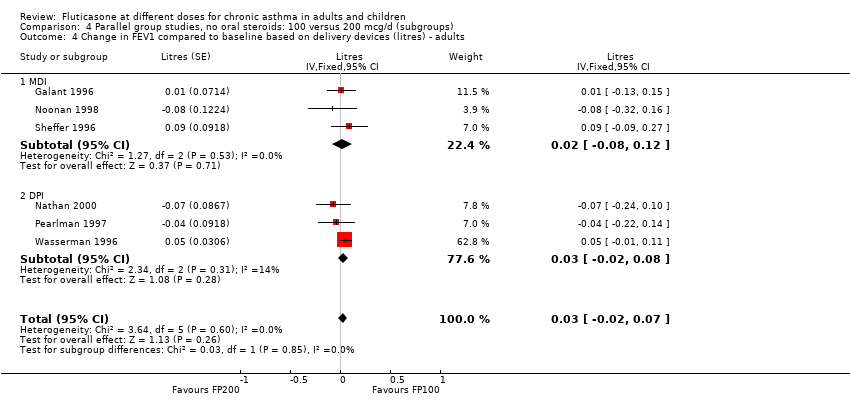
Comparison 4 Parallel group studies, no oral steroids: 100 versus 200 mcg/d (subgroups), Outcome 4 Change in FEV1 compared to baseline based on delivery devices (litres) ‐ adults.
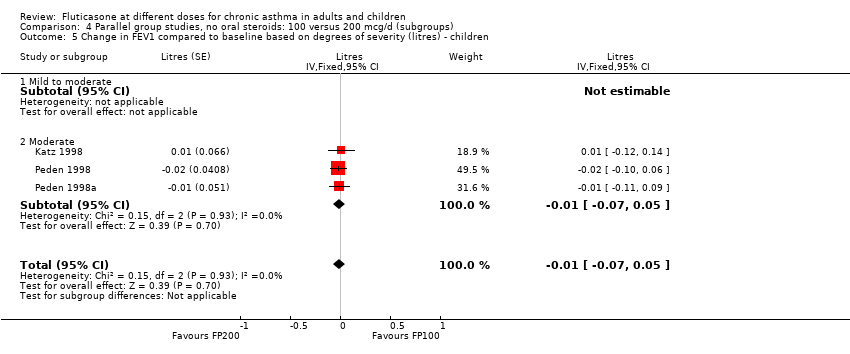
Comparison 4 Parallel group studies, no oral steroids: 100 versus 200 mcg/d (subgroups), Outcome 5 Change in FEV1 compared to baseline based on degrees of severity (litres) ‐ children.

Comparison 4 Parallel group studies, no oral steroids: 100 versus 200 mcg/d (subgroups), Outcome 6 Change in FEV1 compared to baseline based on degrees of severity (litres) ‐ adults.

Comparison 5 Parallel group studies, no oral steroids: 200 versus 400‐500 mcg/d (all ages), Outcome 1 FEV1 (% predicted).
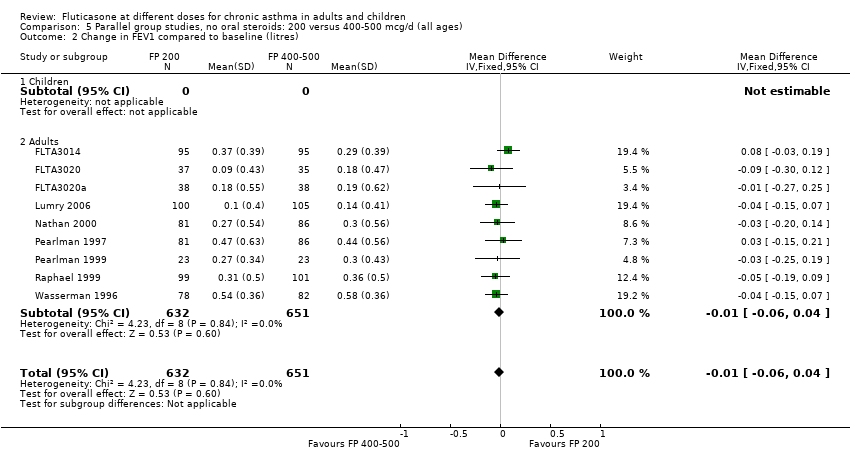
Comparison 5 Parallel group studies, no oral steroids: 200 versus 400‐500 mcg/d (all ages), Outcome 2 Change in FEV1 compared to baseline (litres).

Comparison 5 Parallel group studies, no oral steroids: 200 versus 400‐500 mcg/d (all ages), Outcome 3 Change in FEV1 compared to baseline (litres ‐ imputed estimates).

Comparison 5 Parallel group studies, no oral steroids: 200 versus 400‐500 mcg/d (all ages), Outcome 4 Change in FVC compared to baseline (litres).

Comparison 5 Parallel group studies, no oral steroids: 200 versus 400‐500 mcg/d (all ages), Outcome 5 Change in FEF25‐75 compared to baseline (L/second).
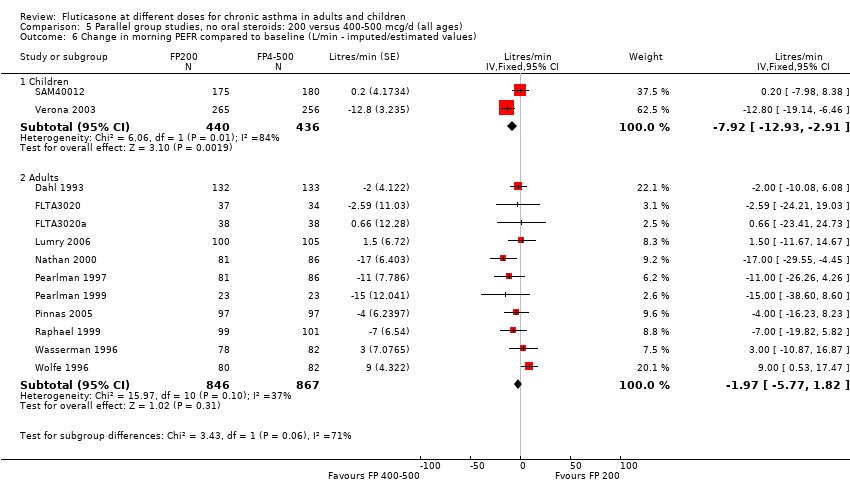
Comparison 5 Parallel group studies, no oral steroids: 200 versus 400‐500 mcg/d (all ages), Outcome 6 Change in morning PEFR compared to baseline (L/min ‐ imputed/estimated values).

Comparison 5 Parallel group studies, no oral steroids: 200 versus 400‐500 mcg/d (all ages), Outcome 7 Change in morning PEFR compared to baseline (L/min).
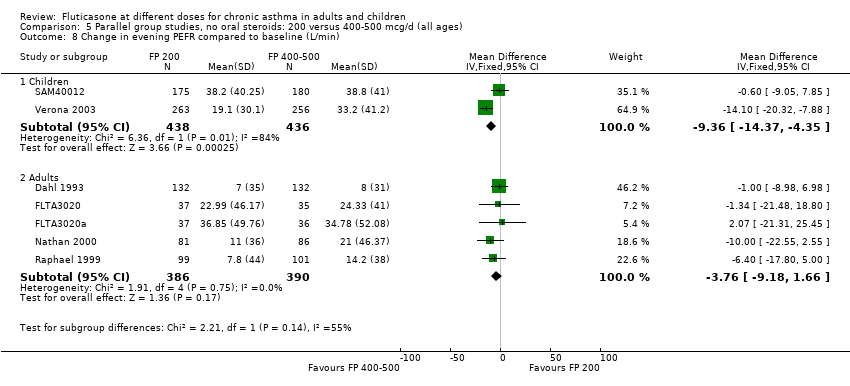
Comparison 5 Parallel group studies, no oral steroids: 200 versus 400‐500 mcg/d (all ages), Outcome 8 Change in evening PEFR compared to baseline (L/min).

Comparison 5 Parallel group studies, no oral steroids: 200 versus 400‐500 mcg/d (all ages), Outcome 9 PC20.

Comparison 5 Parallel group studies, no oral steroids: 200 versus 400‐500 mcg/d (all ages), Outcome 10 PD20.
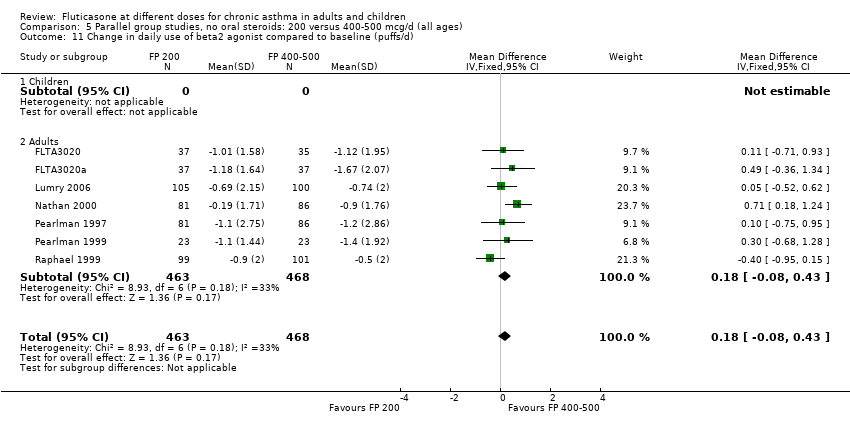
Comparison 5 Parallel group studies, no oral steroids: 200 versus 400‐500 mcg/d (all ages), Outcome 11 Change in daily use of beta2 agonist compared to baseline (puffs/d).
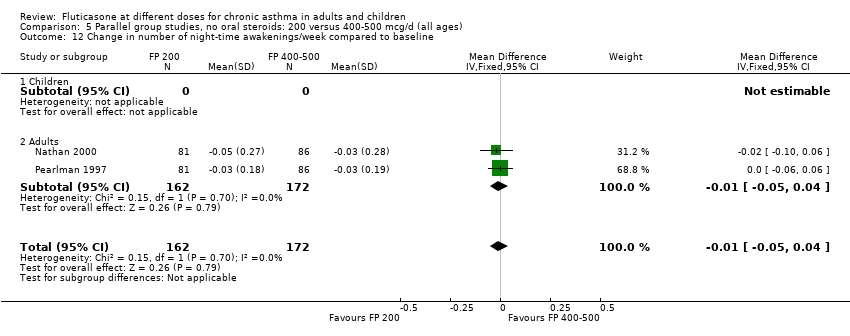
Comparison 5 Parallel group studies, no oral steroids: 200 versus 400‐500 mcg/d (all ages), Outcome 12 Change in number of night‐time awakenings/week compared to baseline.
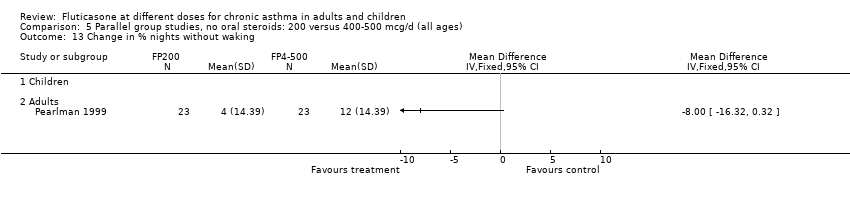
Comparison 5 Parallel group studies, no oral steroids: 200 versus 400‐500 mcg/d (all ages), Outcome 13 Change in % nights without waking.

Comparison 5 Parallel group studies, no oral steroids: 200 versus 400‐500 mcg/d (all ages), Outcome 14 Change in daily asthma symptom score compared to baseline.

Comparison 5 Parallel group studies, no oral steroids: 200 versus 400‐500 mcg/d (all ages), Outcome 15 Percentage of symptom‐free days.
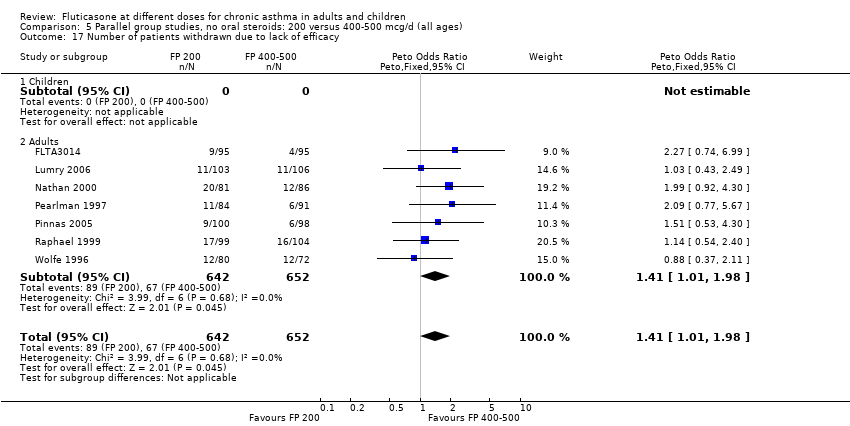
Comparison 5 Parallel group studies, no oral steroids: 200 versus 400‐500 mcg/d (all ages), Outcome 17 Number of patients withdrawn due to lack of efficacy.

Comparison 5 Parallel group studies, no oral steroids: 200 versus 400‐500 mcg/d (all ages), Outcome 18 Exacerbations requiring oral steroids.
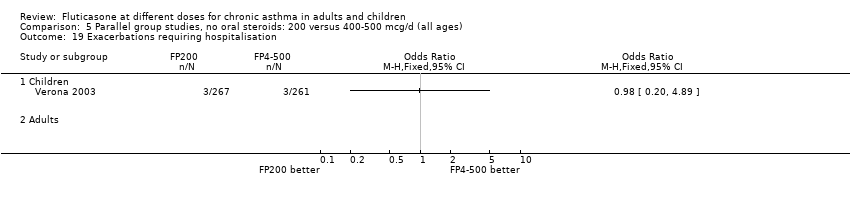
Comparison 5 Parallel group studies, no oral steroids: 200 versus 400‐500 mcg/d (all ages), Outcome 19 Exacerbations requiring hospitalisation.
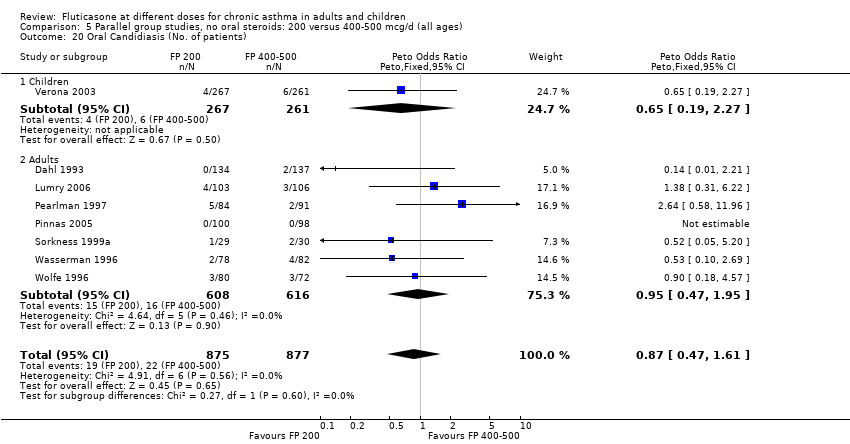
Comparison 5 Parallel group studies, no oral steroids: 200 versus 400‐500 mcg/d (all ages), Outcome 20 Oral Candidiasis (No. of patients).

Comparison 5 Parallel group studies, no oral steroids: 200 versus 400‐500 mcg/d (all ages), Outcome 21 Sore throat or pharyngitis (No. of patients).

Comparison 5 Parallel group studies, no oral steroids: 200 versus 400‐500 mcg/d (all ages), Outcome 22 Hoarseness or dysphonia (No. of patients).

Comparison 5 Parallel group studies, no oral steroids: 200 versus 400‐500 mcg/d (all ages), Outcome 23 Withdrawals due to adverse events.
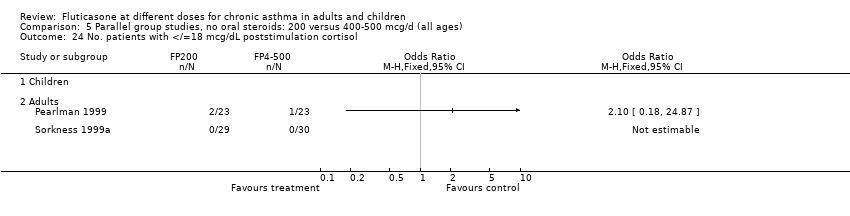
Comparison 5 Parallel group studies, no oral steroids: 200 versus 400‐500 mcg/d (all ages), Outcome 24 No. patients with </=18 mcg/dL poststimulation cortisol.
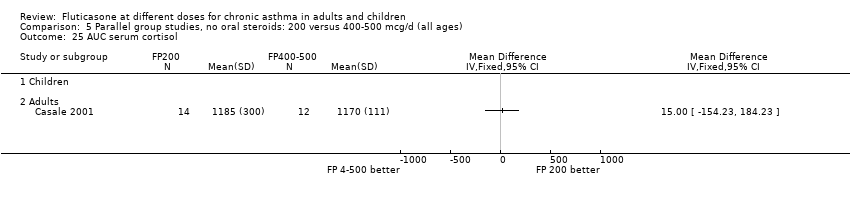
Comparison 5 Parallel group studies, no oral steroids: 200 versus 400‐500 mcg/d (all ages), Outcome 25 AUC serum cortisol.
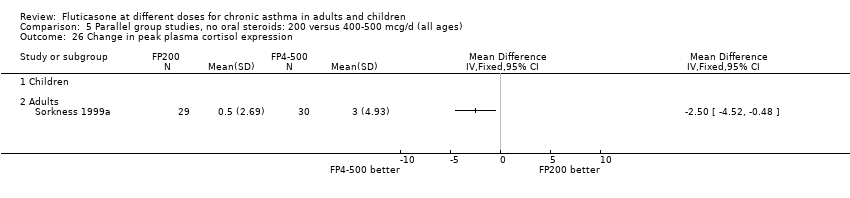
Comparison 5 Parallel group studies, no oral steroids: 200 versus 400‐500 mcg/d (all ages), Outcome 26 Change in peak plasma cortisol expression.
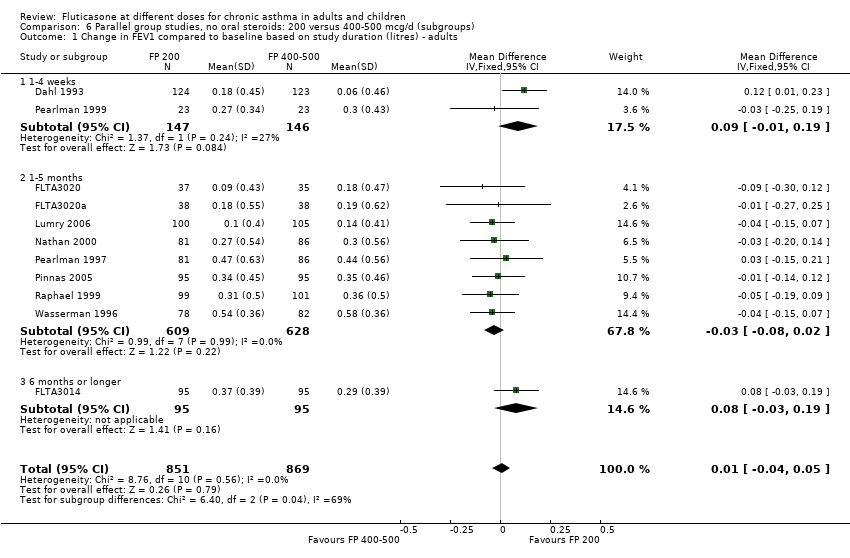
Comparison 6 Parallel group studies, no oral steroids: 200 versus 400‐500 mcg/d (subgroups), Outcome 1 Change in FEV1 compared to baseline based on study duration (litres) ‐ adults.
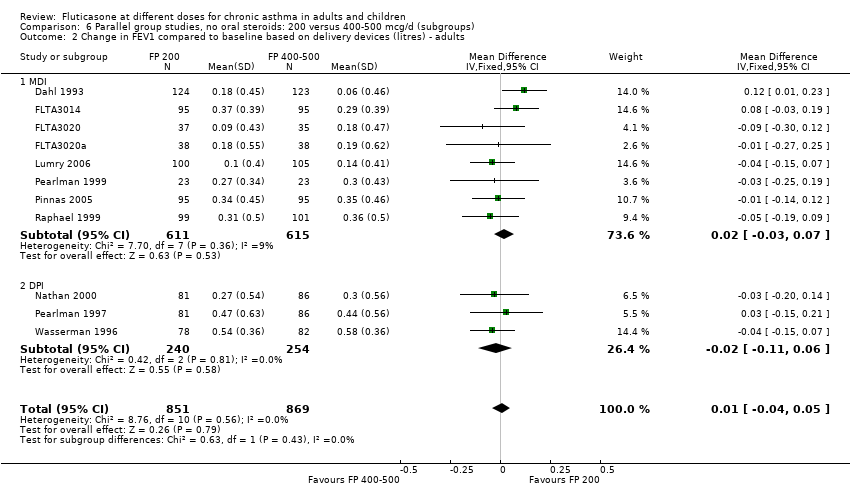
Comparison 6 Parallel group studies, no oral steroids: 200 versus 400‐500 mcg/d (subgroups), Outcome 2 Change in FEV1 compared to baseline based on delivery devices (litres) ‐ adults.

Comparison 6 Parallel group studies, no oral steroids: 200 versus 400‐500 mcg/d (subgroups), Outcome 3 Change in FEV1 compared to baseline based on degrees of severity (litres) ‐ adults.

Comparison 7 Parallel group studies, no oral steroids: 100 versus 400‐500 mcg/d (all ages), Outcome 1 Change in FEV1 compared to baseline (litres).
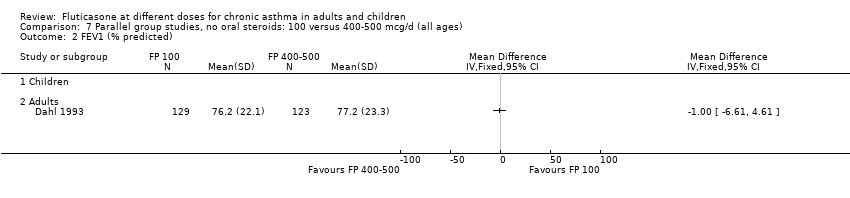
Comparison 7 Parallel group studies, no oral steroids: 100 versus 400‐500 mcg/d (all ages), Outcome 2 FEV1 (% predicted).

Comparison 7 Parallel group studies, no oral steroids: 100 versus 400‐500 mcg/d (all ages), Outcome 3 Change in morning PEFR compared to baseline (L/min).
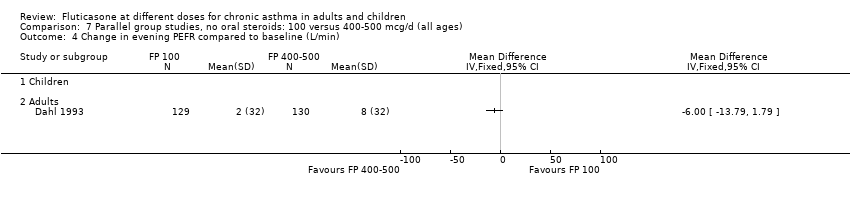
Comparison 7 Parallel group studies, no oral steroids: 100 versus 400‐500 mcg/d (all ages), Outcome 4 Change in evening PEFR compared to baseline (L/min).
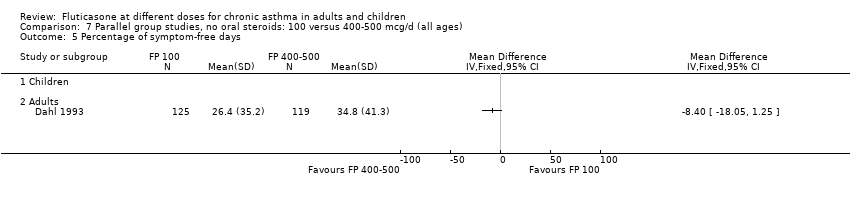
Comparison 7 Parallel group studies, no oral steroids: 100 versus 400‐500 mcg/d (all ages), Outcome 5 Percentage of symptom‐free days.
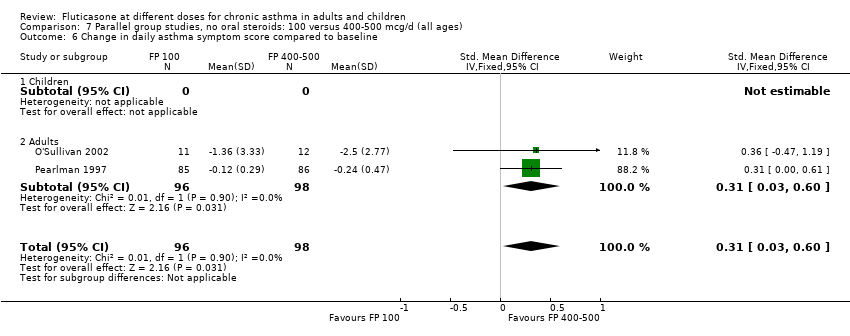
Comparison 7 Parallel group studies, no oral steroids: 100 versus 400‐500 mcg/d (all ages), Outcome 6 Change in daily asthma symptom score compared to baseline.
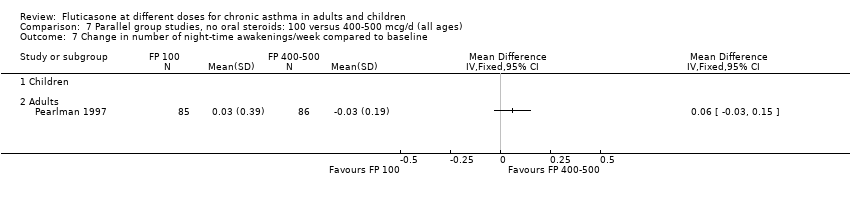
Comparison 7 Parallel group studies, no oral steroids: 100 versus 400‐500 mcg/d (all ages), Outcome 7 Change in number of night‐time awakenings/week compared to baseline.

Comparison 7 Parallel group studies, no oral steroids: 100 versus 400‐500 mcg/d (all ages), Outcome 8 Change in daily use of beta2 agonist compared to baseline (puffs/d).
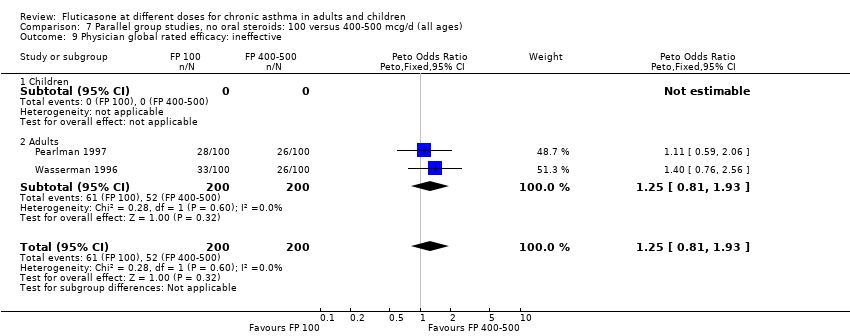
Comparison 7 Parallel group studies, no oral steroids: 100 versus 400‐500 mcg/d (all ages), Outcome 9 Physician global rated efficacy: ineffective.
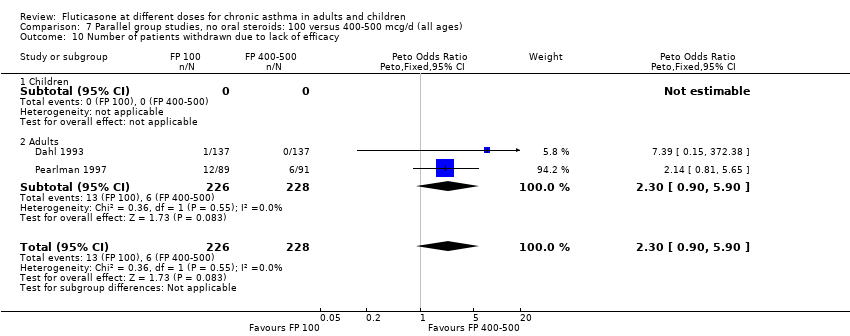
Comparison 7 Parallel group studies, no oral steroids: 100 versus 400‐500 mcg/d (all ages), Outcome 10 Number of patients withdrawn due to lack of efficacy.

Comparison 7 Parallel group studies, no oral steroids: 100 versus 400‐500 mcg/d (all ages), Outcome 11 Sore throat or pharyngitis (No. of patients).
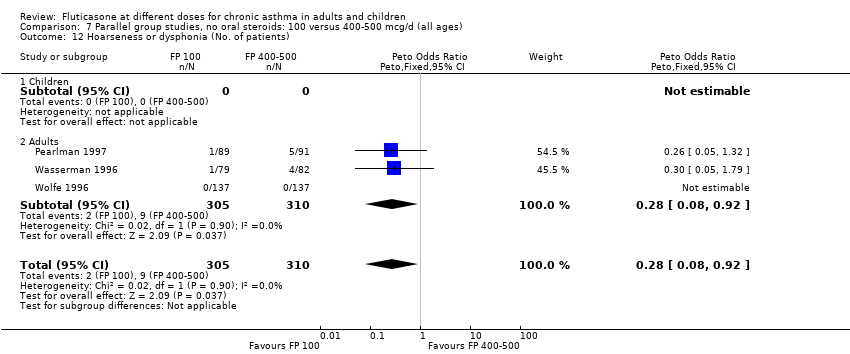
Comparison 7 Parallel group studies, no oral steroids: 100 versus 400‐500 mcg/d (all ages), Outcome 12 Hoarseness or dysphonia (No. of patients).

Comparison 7 Parallel group studies, no oral steroids: 100 versus 400‐500 mcg/d (all ages), Outcome 13 Oral Candidiasis (No. of patients).
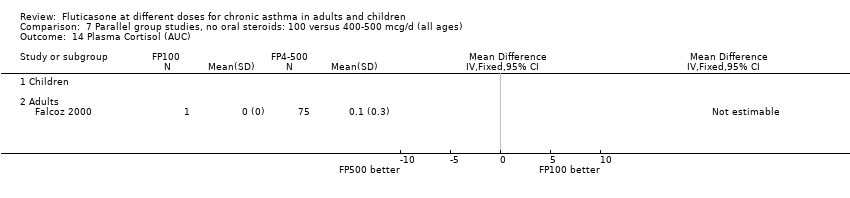
Comparison 7 Parallel group studies, no oral steroids: 100 versus 400‐500 mcg/d (all ages), Outcome 14 Plasma Cortisol (AUC).

Comparison 7 Parallel group studies, no oral steroids: 100 versus 400‐500 mcg/d (all ages), Outcome 15 Clinic PEF (L/min ‐ change from baseline).

Comparison 8 Parallel group studies, no oral steroids: 100 versus 400‐500 mcg/d (subgroups), Outcome 1 Change in FEV1 compared to baseline based on study duration (litres) ‐ adults.

Comparison 8 Parallel group studies, no oral steroids: 100 versus 400‐500 mcg/d (subgroups), Outcome 2 Change in FEV1 compared to baseline based on delivery devices (litres) ‐ adults.

Comparison 8 Parallel group studies, no oral steroids: 100 versus 400‐500 mcg/d (subgroups), Outcome 3 Change in FEV1 compared to baseline based on degrees of severity (litres) ‐ adults.

Comparison 9 Parallel group studies, no oral steroids: 400‐500 versus 800‐1000 mcg/d (all ages), Outcome 1 FEV1 (Change from baseline ‐ litres).

Comparison 9 Parallel group studies, no oral steroids: 400‐500 versus 800‐1000 mcg/d (all ages), Outcome 2 Change in morning PEF (L/min).
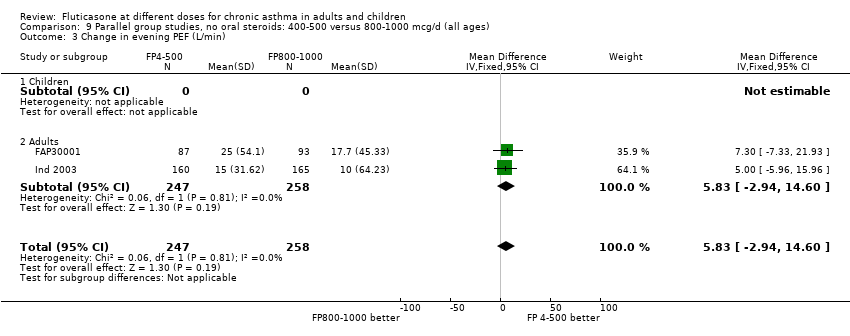
Comparison 9 Parallel group studies, no oral steroids: 400‐500 versus 800‐1000 mcg/d (all ages), Outcome 3 Change in evening PEF (L/min).

Comparison 9 Parallel group studies, no oral steroids: 400‐500 versus 800‐1000 mcg/d (all ages), Outcome 4 Change in rescue medication (puffs/d).

Comparison 9 Parallel group studies, no oral steroids: 400‐500 versus 800‐1000 mcg/d (all ages), Outcome 6 Change in daily symptoms compared with baseline.
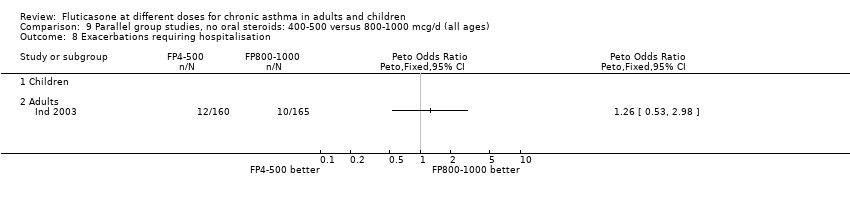
Comparison 9 Parallel group studies, no oral steroids: 400‐500 versus 800‐1000 mcg/d (all ages), Outcome 8 Exacerbations requiring hospitalisation.
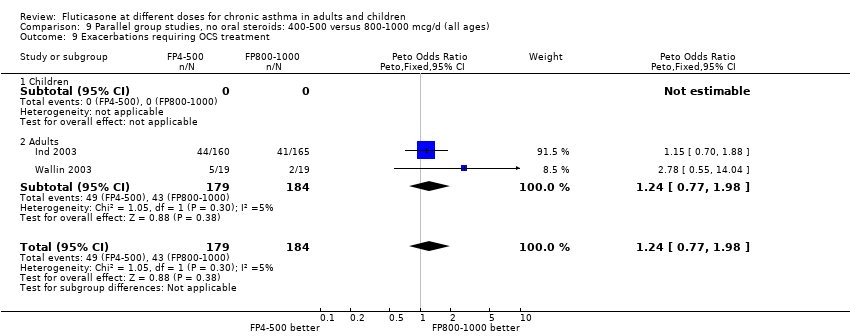
Comparison 9 Parallel group studies, no oral steroids: 400‐500 versus 800‐1000 mcg/d (all ages), Outcome 9 Exacerbations requiring OCS treatment.

Comparison 9 Parallel group studies, no oral steroids: 400‐500 versus 800‐1000 mcg/d (all ages), Outcome 10 Withdrawals (total).

Comparison 9 Parallel group studies, no oral steroids: 400‐500 versus 800‐1000 mcg/d (all ages), Outcome 11 Withdrawals (adverse events).

Comparison 9 Parallel group studies, no oral steroids: 400‐500 versus 800‐1000 mcg/d (all ages), Outcome 12 Withdrawals (lack of efficacy).

Comparison 10 Parallel group studies, no oral steroids: 400‐500 versus 800‐1000 mcg/d (subgroups), Outcome 1 Change from baseline in FEV1 based on study duration (litres) ‐ adults.
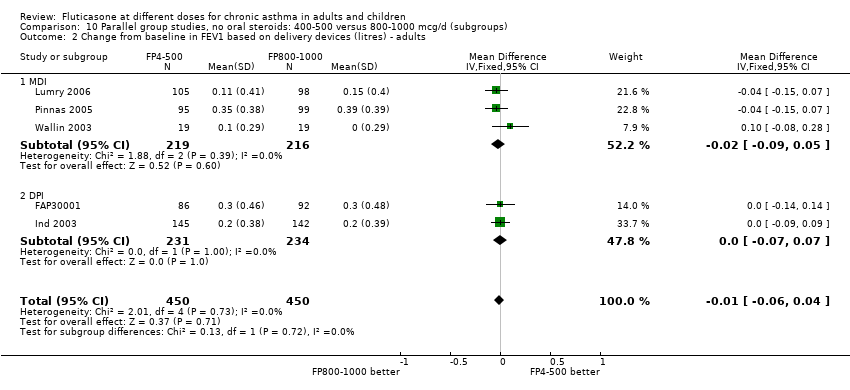
Comparison 10 Parallel group studies, no oral steroids: 400‐500 versus 800‐1000 mcg/d (subgroups), Outcome 2 Change from baseline in FEV1 based on delivery devices (litres) ‐ adults.

Comparison 10 Parallel group studies, no oral steroids: 400‐500 versus 800‐1000 mcg/d (subgroups), Outcome 3 Change from baseline in FEV1 based on degree of severity (litres) ‐ adults.
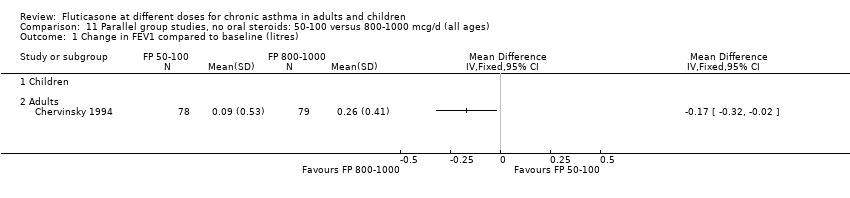
Comparison 11 Parallel group studies, no oral steroids: 50‐100 versus 800‐1000 mcg/d (all ages), Outcome 1 Change in FEV1 compared to baseline (litres).
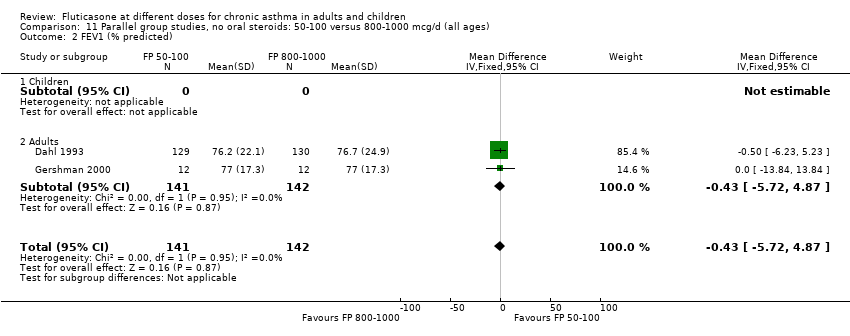
Comparison 11 Parallel group studies, no oral steroids: 50‐100 versus 800‐1000 mcg/d (all ages), Outcome 2 FEV1 (% predicted).
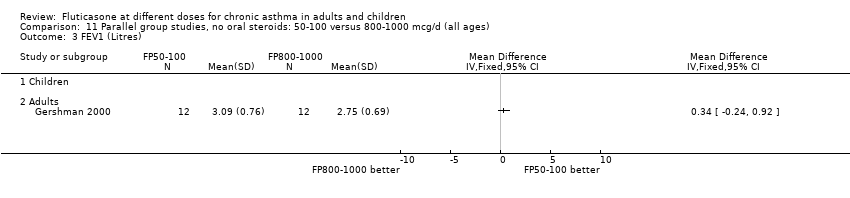
Comparison 11 Parallel group studies, no oral steroids: 50‐100 versus 800‐1000 mcg/d (all ages), Outcome 3 FEV1 (Litres).

Comparison 11 Parallel group studies, no oral steroids: 50‐100 versus 800‐1000 mcg/d (all ages), Outcome 4 Change in FVC compared to baseline (litres).

Comparison 11 Parallel group studies, no oral steroids: 50‐100 versus 800‐1000 mcg/d (all ages), Outcome 5 FEF25‐75.

Comparison 11 Parallel group studies, no oral steroids: 50‐100 versus 800‐1000 mcg/d (all ages), Outcome 6 Change in FEF25‐75 compared to baseline (L/second).

Comparison 11 Parallel group studies, no oral steroids: 50‐100 versus 800‐1000 mcg/d (all ages), Outcome 7 am PEF (Litres/min).
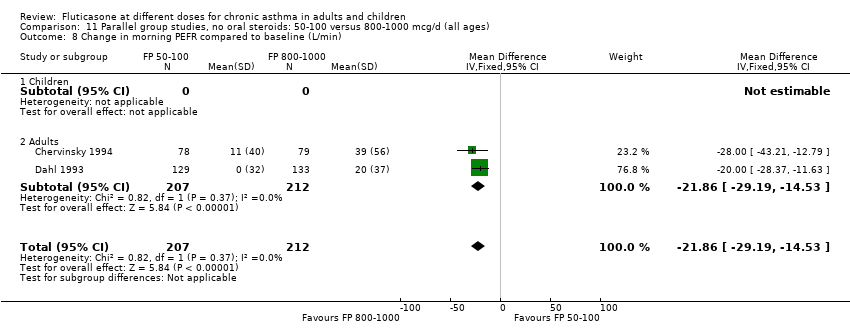
Comparison 11 Parallel group studies, no oral steroids: 50‐100 versus 800‐1000 mcg/d (all ages), Outcome 8 Change in morning PEFR compared to baseline (L/min).
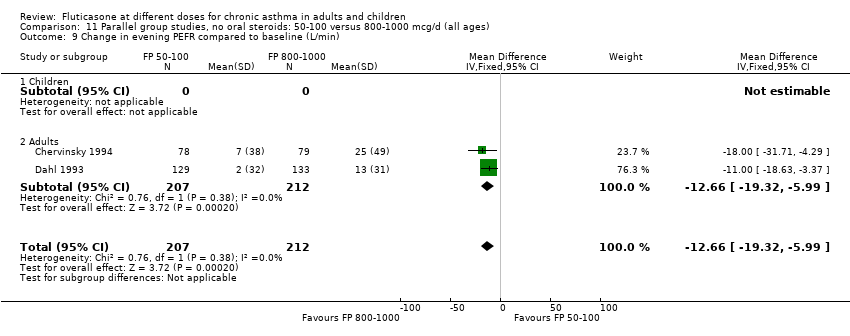
Comparison 11 Parallel group studies, no oral steroids: 50‐100 versus 800‐1000 mcg/d (all ages), Outcome 9 Change in evening PEFR compared to baseline (L/min).

Comparison 11 Parallel group studies, no oral steroids: 50‐100 versus 800‐1000 mcg/d (all ages), Outcome 10 Physician global rated efficacy: ineffective.
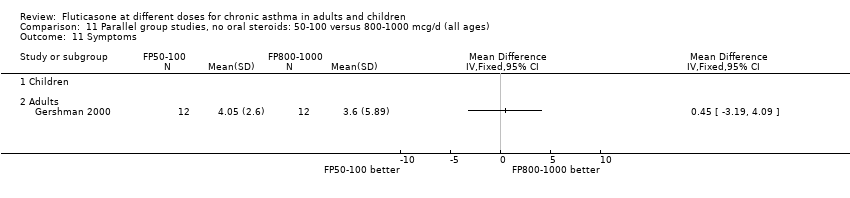
Comparison 11 Parallel group studies, no oral steroids: 50‐100 versus 800‐1000 mcg/d (all ages), Outcome 11 Symptoms.
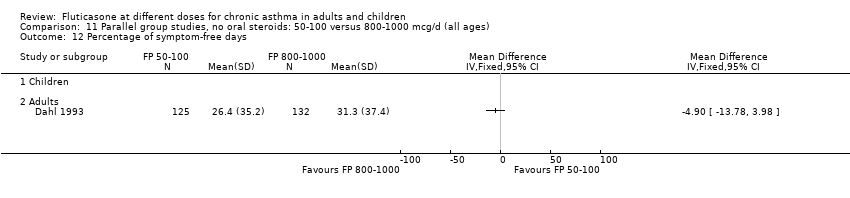
Comparison 11 Parallel group studies, no oral steroids: 50‐100 versus 800‐1000 mcg/d (all ages), Outcome 12 Percentage of symptom‐free days.

Comparison 11 Parallel group studies, no oral steroids: 50‐100 versus 800‐1000 mcg/d (all ages), Outcome 13 Change in daily asthma symptom score compared to baseline.
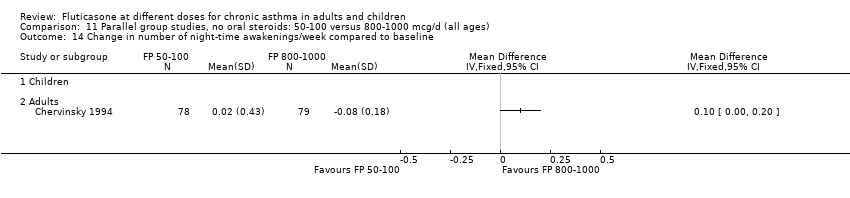
Comparison 11 Parallel group studies, no oral steroids: 50‐100 versus 800‐1000 mcg/d (all ages), Outcome 14 Change in number of night‐time awakenings/week compared to baseline.
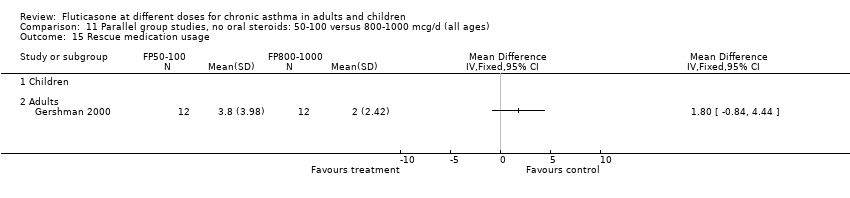
Comparison 11 Parallel group studies, no oral steroids: 50‐100 versus 800‐1000 mcg/d (all ages), Outcome 15 Rescue medication usage.

Comparison 11 Parallel group studies, no oral steroids: 50‐100 versus 800‐1000 mcg/d (all ages), Outcome 16 Change in daily use of beta2 agonist compared to baseline (puffs/d).
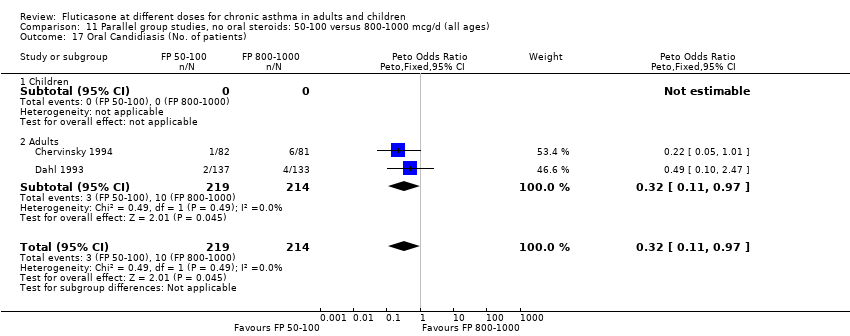
Comparison 11 Parallel group studies, no oral steroids: 50‐100 versus 800‐1000 mcg/d (all ages), Outcome 17 Oral Candidiasis (No. of patients).
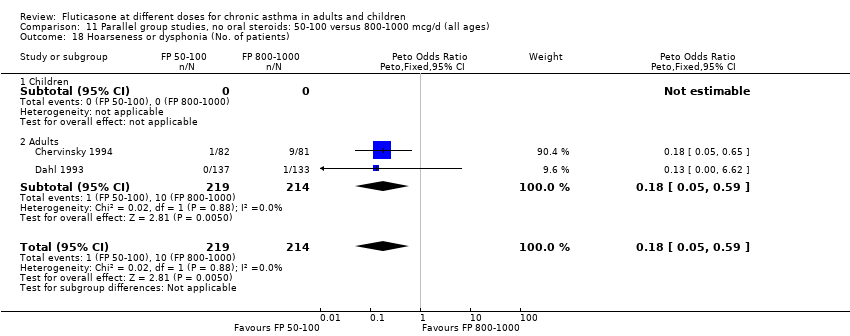
Comparison 11 Parallel group studies, no oral steroids: 50‐100 versus 800‐1000 mcg/d (all ages), Outcome 18 Hoarseness or dysphonia (No. of patients).

Comparison 11 Parallel group studies, no oral steroids: 50‐100 versus 800‐1000 mcg/d (all ages), Outcome 19 Withdrawals (total).
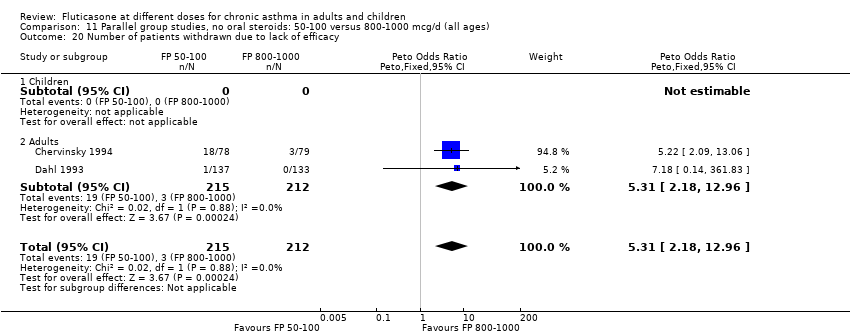
Comparison 11 Parallel group studies, no oral steroids: 50‐100 versus 800‐1000 mcg/d (all ages), Outcome 20 Number of patients withdrawn due to lack of efficacy.
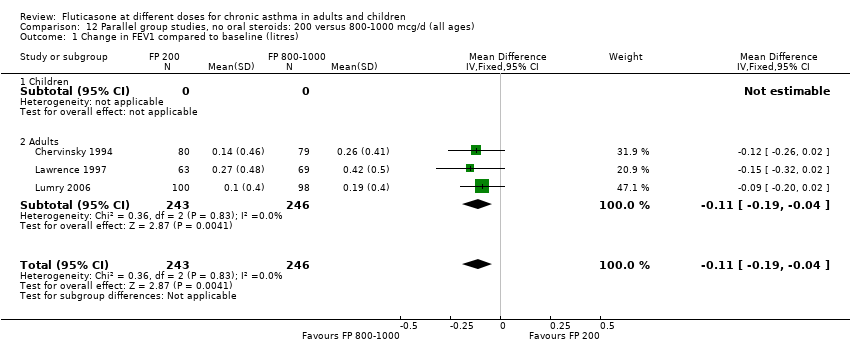
Comparison 12 Parallel group studies, no oral steroids: 200 versus 800‐1000 mcg/d (all ages), Outcome 1 Change in FEV1 compared to baseline (litres).

Comparison 12 Parallel group studies, no oral steroids: 200 versus 800‐1000 mcg/d (all ages), Outcome 2 Change in FEV1 compared to baseline (%).

Comparison 12 Parallel group studies, no oral steroids: 200 versus 800‐1000 mcg/d (all ages), Outcome 3 Change in FEV1 % predicted.

Comparison 12 Parallel group studies, no oral steroids: 200 versus 800‐1000 mcg/d (all ages), Outcome 4 FEV1 (% predicted).

Comparison 12 Parallel group studies, no oral steroids: 200 versus 800‐1000 mcg/d (all ages), Outcome 5 Change in morning PEFR compared to baseline (L/min).
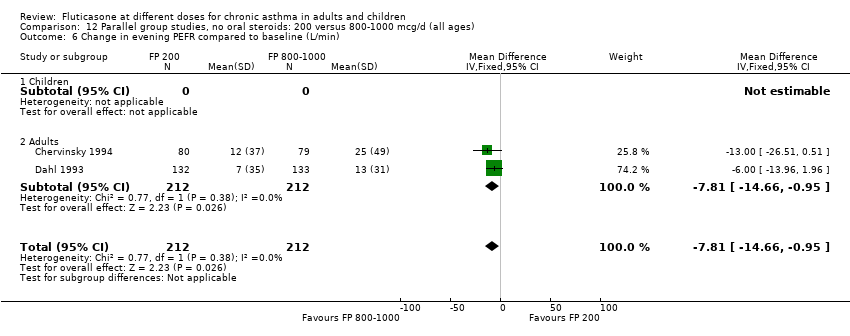
Comparison 12 Parallel group studies, no oral steroids: 200 versus 800‐1000 mcg/d (all ages), Outcome 6 Change in evening PEFR compared to baseline (L/min).

Comparison 12 Parallel group studies, no oral steroids: 200 versus 800‐1000 mcg/d (all ages), Outcome 7 Change in FVC compared to baseline (litres).
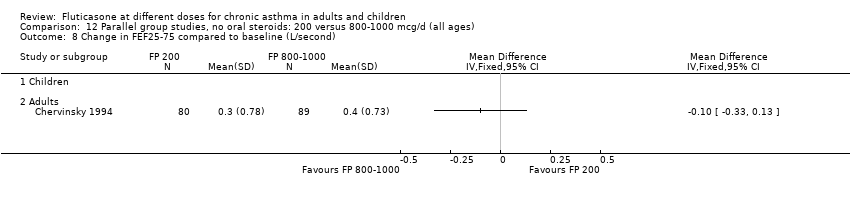
Comparison 12 Parallel group studies, no oral steroids: 200 versus 800‐1000 mcg/d (all ages), Outcome 8 Change in FEF25‐75 compared to baseline (L/second).
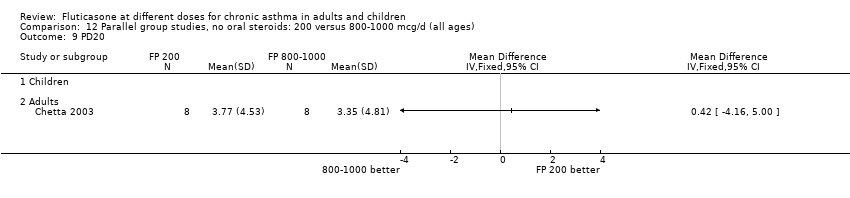
Comparison 12 Parallel group studies, no oral steroids: 200 versus 800‐1000 mcg/d (all ages), Outcome 9 PD20.

Comparison 12 Parallel group studies, no oral steroids: 200 versus 800‐1000 mcg/d (all ages), Outcome 10 Change in daily asthma symptom score compared to baseline.

Comparison 12 Parallel group studies, no oral steroids: 200 versus 800‐1000 mcg/d (all ages), Outcome 11 Change in number of night‐time awakenings/week compared to baseline.

Comparison 12 Parallel group studies, no oral steroids: 200 versus 800‐1000 mcg/d (all ages), Outcome 12 Physician global rated efficacy: ineffective.
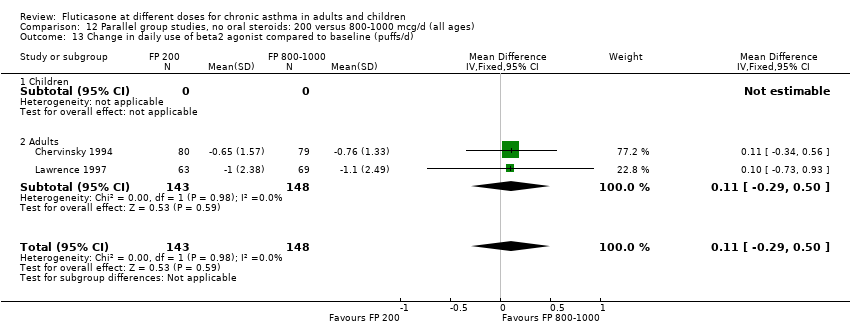
Comparison 12 Parallel group studies, no oral steroids: 200 versus 800‐1000 mcg/d (all ages), Outcome 13 Change in daily use of beta2 agonist compared to baseline (puffs/d).

Comparison 12 Parallel group studies, no oral steroids: 200 versus 800‐1000 mcg/d (all ages), Outcome 14 Number of patients withdrawn due to lack of efficacy.
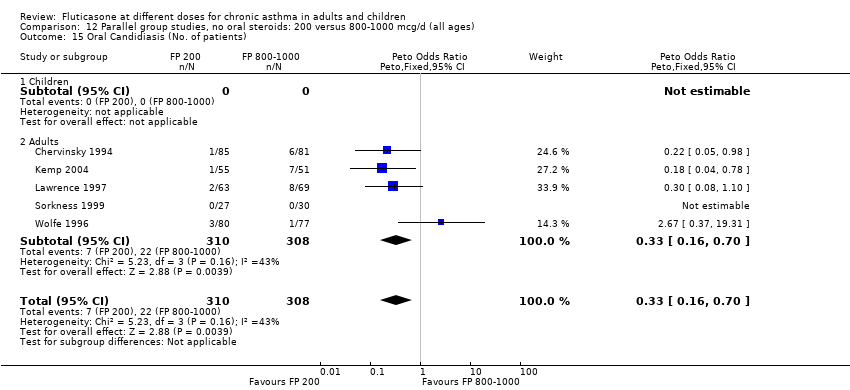
Comparison 12 Parallel group studies, no oral steroids: 200 versus 800‐1000 mcg/d (all ages), Outcome 15 Oral Candidiasis (No. of patients).
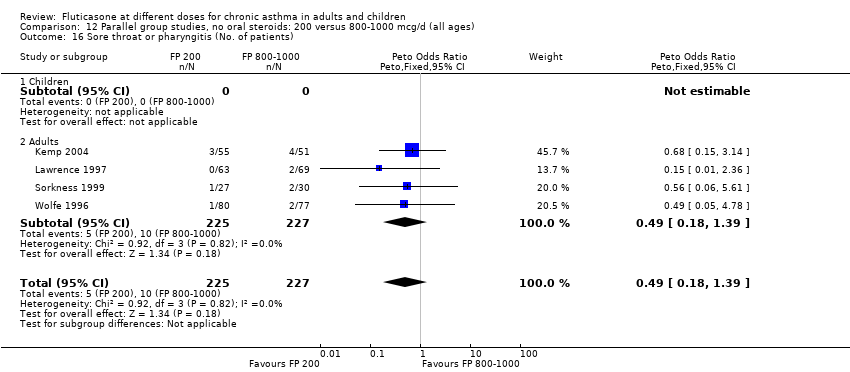
Comparison 12 Parallel group studies, no oral steroids: 200 versus 800‐1000 mcg/d (all ages), Outcome 16 Sore throat or pharyngitis (No. of patients).
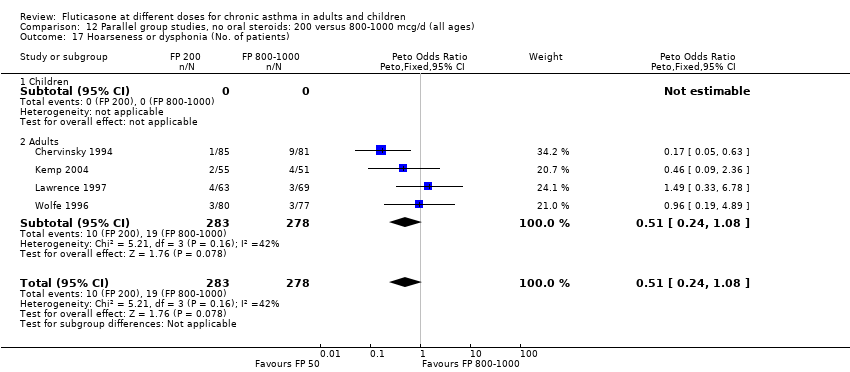
Comparison 12 Parallel group studies, no oral steroids: 200 versus 800‐1000 mcg/d (all ages), Outcome 17 Hoarseness or dysphonia (No. of patients).

Comparison 12 Parallel group studies, no oral steroids: 200 versus 800‐1000 mcg/d (all ages), Outcome 18 Change in peak plasma cortisol compared to baseline (mcg/dL).
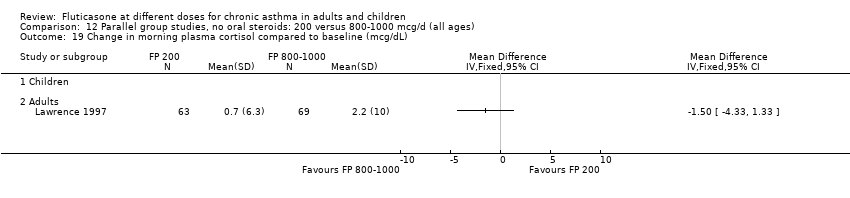
Comparison 12 Parallel group studies, no oral steroids: 200 versus 800‐1000 mcg/d (all ages), Outcome 19 Change in morning plasma cortisol compared to baseline (mcg/dL).
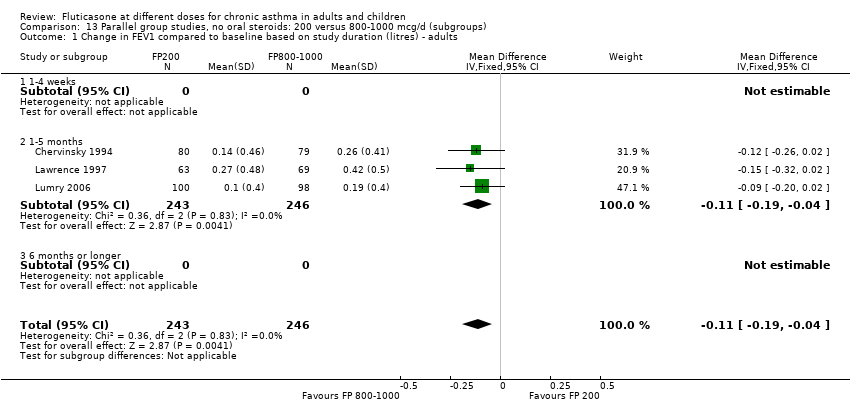
Comparison 13 Parallel group studies, no oral steroids: 200 versus 800‐1000 mcg/d (subgroups), Outcome 1 Change in FEV1 compared to baseline based on study duration (litres) ‐ adults.

Comparison 13 Parallel group studies, no oral steroids: 200 versus 800‐1000 mcg/d (subgroups), Outcome 2 Change in FEV1 compared to baseline based on delivery devices (litres) ‐ adults.

Comparison 13 Parallel group studies, no oral steroids: 200 versus 800‐1000 mcg/d (subgroups), Outcome 3 Change in FEV1 compared to baseline based on degrees of severity (litres) ‐ adults.

Comparison 14 Parallel group studies, no oral steroids: 4‐500 versus 1500‐2000mcg/d (all ages), Outcome 1 FEV1 (Change from baseline ‐ litres).

Comparison 14 Parallel group studies, no oral steroids: 4‐500 versus 1500‐2000mcg/d (all ages), Outcome 2 Clinic PEF (L/min ‐ change from baseline).
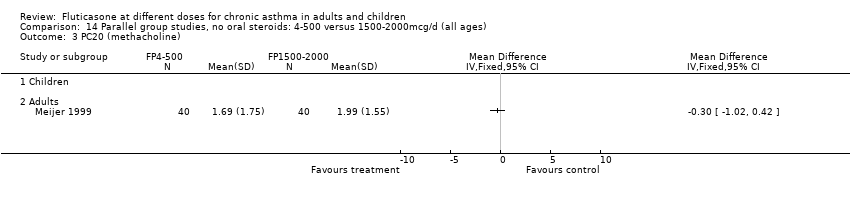
Comparison 14 Parallel group studies, no oral steroids: 4‐500 versus 1500‐2000mcg/d (all ages), Outcome 3 PC20 (methacholine).

Comparison 14 Parallel group studies, no oral steroids: 4‐500 versus 1500‐2000mcg/d (all ages), Outcome 4 PC20 AMP.

Comparison 14 Parallel group studies, no oral steroids: 4‐500 versus 1500‐2000mcg/d (all ages), Outcome 5 Symptoms (change from baseline).
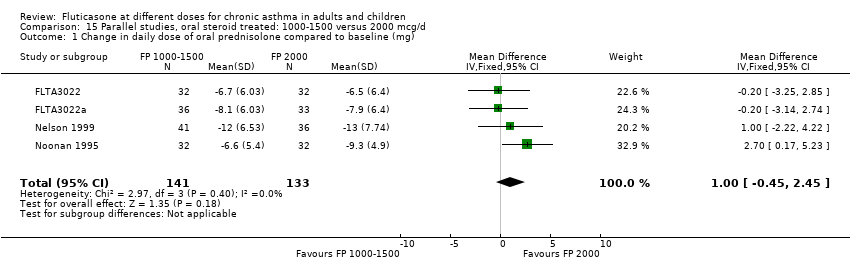
Comparison 15 Parallel studies, oral steroid treated: 1000‐1500 versus 2000 mcg/d, Outcome 1 Change in daily dose of oral prednisolone compared to baseline (mg).
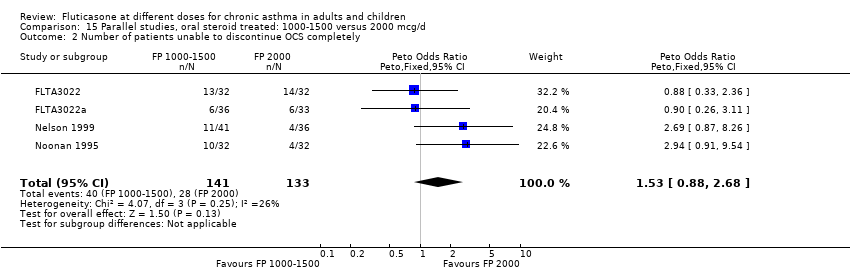
Comparison 15 Parallel studies, oral steroid treated: 1000‐1500 versus 2000 mcg/d, Outcome 2 Number of patients unable to discontinue OCS completely.
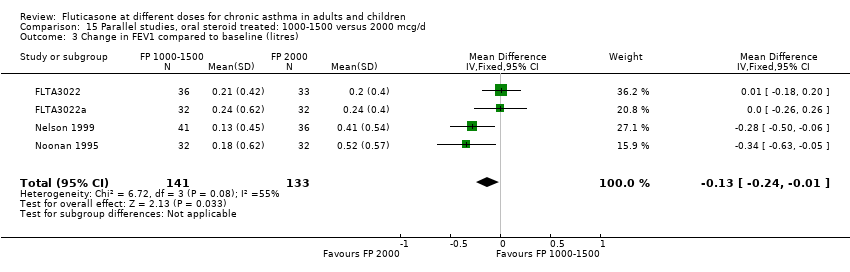
Comparison 15 Parallel studies, oral steroid treated: 1000‐1500 versus 2000 mcg/d, Outcome 3 Change in FEV1 compared to baseline (litres).

Comparison 15 Parallel studies, oral steroid treated: 1000‐1500 versus 2000 mcg/d, Outcome 4 Change in morning PEFR compared to baseline (L/min).
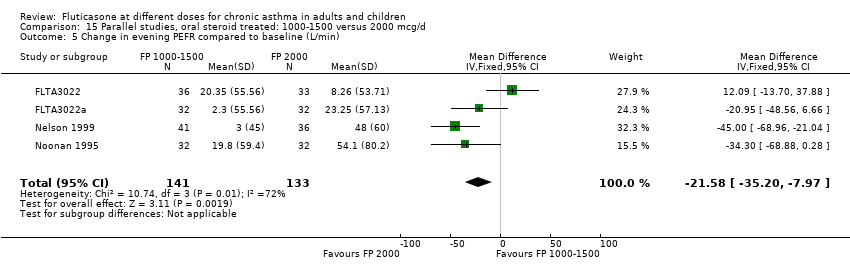
Comparison 15 Parallel studies, oral steroid treated: 1000‐1500 versus 2000 mcg/d, Outcome 5 Change in evening PEFR compared to baseline (L/min).

Comparison 15 Parallel studies, oral steroid treated: 1000‐1500 versus 2000 mcg/d, Outcome 6 Change in daily asthma symptom score compared to baseline.
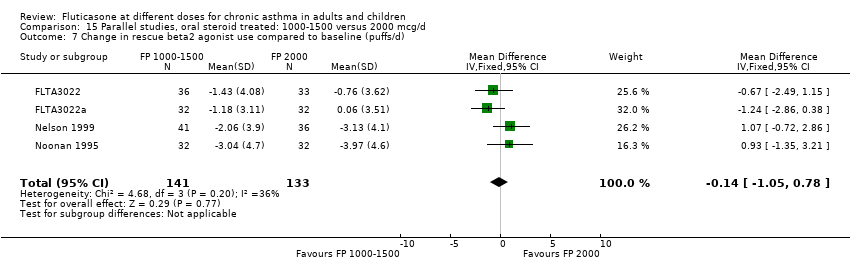
Comparison 15 Parallel studies, oral steroid treated: 1000‐1500 versus 2000 mcg/d, Outcome 7 Change in rescue beta2 agonist use compared to baseline (puffs/d).
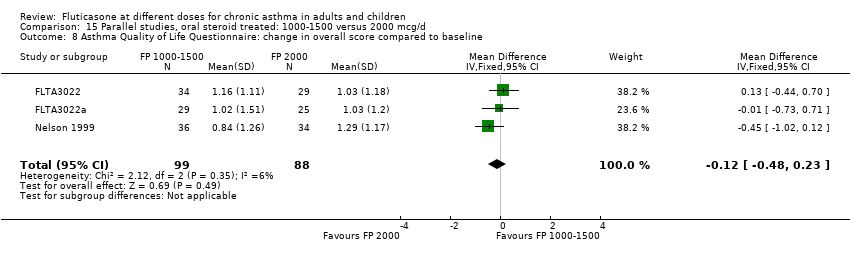
Comparison 15 Parallel studies, oral steroid treated: 1000‐1500 versus 2000 mcg/d, Outcome 8 Asthma Quality of Life Questionnaire: change in overall score compared to baseline.
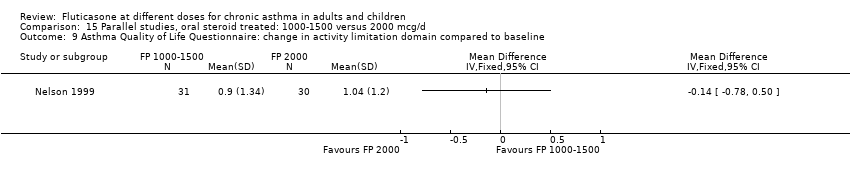
Comparison 15 Parallel studies, oral steroid treated: 1000‐1500 versus 2000 mcg/d, Outcome 9 Asthma Quality of Life Questionnaire: change in activity limitation domain compared to baseline.
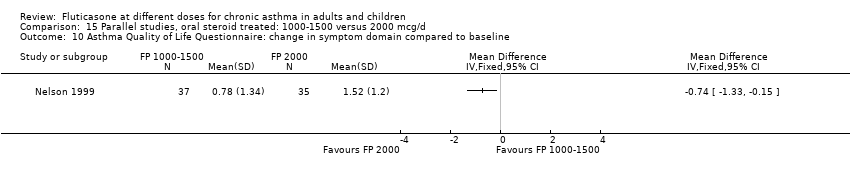
Comparison 15 Parallel studies, oral steroid treated: 1000‐1500 versus 2000 mcg/d, Outcome 10 Asthma Quality of Life Questionnaire: change in symptom domain compared to baseline.

Comparison 15 Parallel studies, oral steroid treated: 1000‐1500 versus 2000 mcg/d, Outcome 11 Asthma Quality of Life Questionnaire: change in emotional function domain compared to baseline.
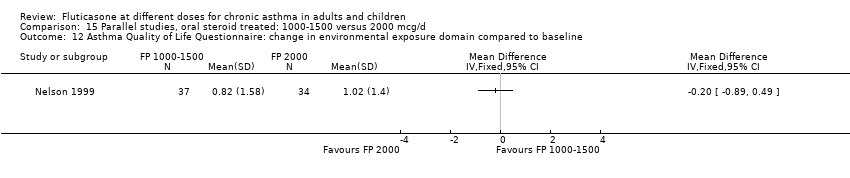
Comparison 15 Parallel studies, oral steroid treated: 1000‐1500 versus 2000 mcg/d, Outcome 12 Asthma Quality of Life Questionnaire: change in environmental exposure domain compared to baseline.
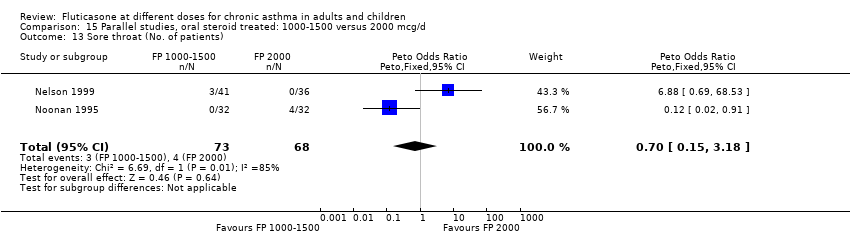
Comparison 15 Parallel studies, oral steroid treated: 1000‐1500 versus 2000 mcg/d, Outcome 13 Sore throat (No. of patients).
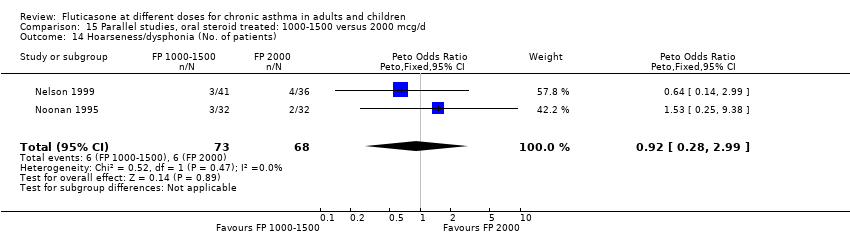
Comparison 15 Parallel studies, oral steroid treated: 1000‐1500 versus 2000 mcg/d, Outcome 14 Hoarseness/dysphonia (No. of patients).

Comparison 15 Parallel studies, oral steroid treated: 1000‐1500 versus 2000 mcg/d, Outcome 15 Oral Candidiasis (No. of patients).

Comparison 16 Crossover studies, no oral steroids: 200 versus 1000 mcg (all ages), Outcome 1 FEV1.

Comparison 16 Crossover studies, no oral steroids: 200 versus 1000 mcg (all ages), Outcome 2 PEF.
| Study ID | Data |
| Allen 2000 | Steroid consumption |
| Ayres 1995 | Symptom free days and nights |
| Boner 1999 | Methacholine BHR (PC20 FEV1) |
| Bukovskis 2002 | FEV1 change from baseline |
| Chervinsky 1994 | Change in urinary free cortisol compared to baseline |
| Chetta 2002 | FEV1 |
| Dahl 1993 | Morning plasma cortisol |
| Derom 1999 | Cortisol suppression |
| Derom 2001 | Cortisol suppression |
| Gershman 2000 | PC20 |
| Hofstra 2000 | PD20 |
| Ind 2003 | Medication usage |
| Katz 1998 | Change in FEV1 compared to baseline |
| Meijer 1999 | FEV1 |
| Nieto 2001 | PC20 |
| Noonan 1998 | Change in log e methacholine bronchial responsiveness PD20 FEV1 |
| Pauwels 2002 | Cortisol suppression |
| Pearlman 1997 | Change in evening PEFR compared to baseline |
| SAM40012 | % symptom free days |
| Verona 2003 | Medication usage |
| Wallin 2003 | am PEF/pm PEF |
| Wasserman 1996 | Physician‐rated global assessment of effectiveness |
| Wolfe 1996 | Change FEV1 compared to baseline |
| Outcome | WMD/GIV | Study | Method |
| 07:03 | WMD | Pinnas 2005 | Published means. SDs based on other studies. |
| 07:07 | GIV | Pinnas 2005 | Published means. SDs based on other studies. |
| 07:07 | GIV | Wolfe 1996 | Published P values (versus placebo), assumed same SEM between two FP groups. |
| 20:01 | WMD | Pinnas 2005 | Published means. SDs based on other studies. |
| 20:03 | WMD | Ind 2003; Pinnas 2005 | Published means. SDs based on other studies. |
| Date | N included/excluded |
| All Years searching to March 1999 | Initial version of the review (All Years searching to March 1999): 6494 citations retrieved, 2162 unique citations imported to Inhaled Steroid Register. From this a fluticasone register was created consisting of 258 citations. 180 excluded on basis of abstract: 150 not RCT; 30 not chronic asthma in humans; 78 papers retrieved in full text form; 57 excluded on basis of full paper: 6 not RCT; 1 infants; 3 delivery device comparison; 1 treatment period < 1 week; 46 not a comparison of 2 or more doses of FP; 21 publications meeting inclusion criteria; 16 unique studies meeting inclusion criteria |
| Update (March 1999‐January 2005) | From hand searching the updated inhaled steroids search results (additional 1301 references), a 'fluticasone' register was created consisting of 196 citations (121 references excluded from abstracts as irrelevant comparisons). Forty‐six references pertaining to 34 studies were retrieved in full for this review. One study reported findings from two data‐sets and these studies have been given two identifiers (Sorkness 1999; Sorkness 1999a). We excluded 11 studies for the following reasons: Wrong comparator (9), outcomes not relevant (2) and varying dose of FP (1). |
| January 2005‐January 2006 | References identified: 411 |
| Study ID | FEV1: incl. criteria | Basline FEV1 | Symptom frequency | OCS treatment | ICS treatment | Author opinion | Overall estimation |
| Agertoft 1997 | Not stated | Not stated | No | No | Not stated | Mild | Mild |
| Allen 1998 | >60 | 88‐89% | Not stated | No | Approx. 50% patients ICS naive at baseline, 50% previous regular ICS use | Mild to moderate | Mild to moderate |
| Allen 2000 | Not stated | 61% | Not stated | Yes (non‐OCS dependents excluded) | Not stated | Severe | Severe |
| Ayres 1995 | Not stated | Mean baseline morning PEFR 73‐77 (% predicted) | Need for 2 or more doses beta2 agonist on 2 out of 7 days of run in period | Proportion of patients using OCS (<10 mg/d) | Yes: BDP 1‐2 mg/d or BUD 0.8‐1.6 mg/d | moderate to severe | Moderate to severe |
| Boner 1999 | Not stated | Not stated | Not stated | No | Not stated | Not stated | Unclear |
| Bukovkis 2002 | Not stated | Not stated | Not stated | Not stated | Not stated | Not stated | Unclear |
| Casale 2001 | >/=65% | 3‐3.2 L | Not stated | No | Not stated | Mild to moderate | Mild to moderate |
| Chervinsky 1994 | 60‐90 | 71‐73% | Not stated | No | Yes: at least 1 month regular treatment with BDP prior to study | Mild to moderate | Mild to moderate |
| Chetta 2002 | >70% | 100‐110% | Well documented history of asthma | No | Not stated | Mild to moderate | Mild |
| Dahl 1993 | Not stated | 73‐75% | daytime wheezing or night‐time symptoms on at least 4 days of 7 day run‐in period or PEFR variability 20% or greater | No | Yes: BDP 1000 mcg/d or less | Moderate | Moderate |
| Derom 1999 | >/=40% | 80% | Not stated | No | Not within 6 months | Not stated | Mild |
| Derom 2001 | Not stated | Not stated | Not stated | Not stated | Not stated | Unclear | Unclear |
| Falcoz 2000 | 50‐80% | Not stated | Not stated | Not stated | Not stated | Mild‐to‐moderate | Unclear |
| FAP30001 | >/=45% | 74‐5% | Not stated | No | Yes | Not stated | Moderate |
| FLIC15 | >/=60% predicted | Not stated | Not stated | No | No | Mild to moderate | Mild |
| FLIP01/a | Not reported | Not reported | Not reported | No | Yes | Not reported | Moderate |
| FLIP39 | Not reported | Not reported | Perennial symptoms requiring ICS | No | Yes ‐ up to 400mcg/d | Not stated | Moderate |
| FLTA3014 | 50‐85% | Not reported | Not reported | No | Yes | Not stated | Unclear |
| FLTA3020/a | 60‐90% | Not reported | Not reported | No | No (low dose ceased 30 days prior to study entry) | Not stated | Mild to moderate |
| FLTA3022/a | 40‐85% predicted | Not reported | Not stated | Yes | Yes | Not stated | Severe |
| FLTA4030 | 50‐80% | Not stated | Stable during 7 day run‐in, controlled with SABA alone | No | No | Not stated | Mild to moderate |
| Galant 1996 | 45‐75 | 60‐62% | > 8 puffs/d beta2 agonist or 2‐4 night‐time awakenings in week run‐in | No | No | Mild to moderate | Moderate |
| Gershman 2000 | Not stated | 66‐69% | Not stated | Not stated | Not stated | Not stated | Unclear |
| Giannini 2003 | Not stated | 3.23 L | Requirement for beta‐agonist treatment during run‐in | Not stated | Not stated | Moderate | Mild to moderate |
| Hofstra 2000 | Not stated | 96.6‐93.2% | Not stated | No | No | Not stated | Unclear |
| Ind 2003 | FEV1 not stipulated at inclusion | No details | Symptomatic despite ICS treatment. History of exacerbations | No | Yes: 1000‐1600 mcg/d of BDP or BUD | Moderate‐severe | Moderate‐severe |
| Katz 1998 | Not stated | PEFR 75 (% predicted) or less | Asthma symptoms on at least 4 out of 10 days of run in period or at least one night‐time awakening in 10 days or 4 or puffs beta2 agonist on at least 4 days | No | No | Not stated | Moderate |
| Kemp 2004 | 50‐100% predicted | 82‐85% predicted | Mild stable asthma | No | No | Mild | Mild |
| Lawrence 1997 | 50‐80 | 65‐68% | "Mean beta2 agonist use 3.2 ‐ 4.2 puffs/d " | No | Yes: 3 months treatment or longer prior to study | Not stated | Moderate |
| Li 1999 | FEV1 </=50% predicted | 82.5‐88.2% | Not stated | No | No | Not stated | Mild |
| Lumry 2006 | 45‐80% | 65.3‐65.5 | Not stated | No | Yes | Not stated | Moderate |
| Meijer 1999 | Not stipulated | 79‐81% | Participants who exacerbated needing OCS during run‐in were excluded | No | Yes ‐ treatment tapered prior to randomisation | Mild‐moderate | Mild to moderate |
| Nathan 2000 | 45‐75% predicted | 63.3‐64.3 | Not stated | No | Yes | Moderate | Moderate |
| Nelson 1999 | 40‐80 | 60‐62% | Not stated | Yes | Almost 100% of patients receiving ICS | Severe | Severe |
| Nieto 2001 | Not stated | Not stated | Not stated | Not stated | Not stated | Not stated | Unclear |
| Noonan 1998 | 60‐85 | 73‐76% | "No more than 12 puffs/d beta2 agonist and no more than 3 nights with awakening due to asthma" | No | No | Mild to moderate | Moderate |
| Noonan 1995 | 40‐80 | 56‐57.4% | Requirement for rescue beta2 agonist for 2 weeks prior to study due to symptoms | Yes | 87% of patients receiving ICS | Severe | Severe |
| O'Sullivan 2002 | >/=60% | 79‐86% | Not stated | No | No | Mild‐moderate | Mild to moderate |
| Pauwels 2002 | Not stated | Not stated | Not stated | Not stated | Not stated | Not stated | Unclear |
| Pearlman 1997 | 50‐80 | 66‐67% | "Mean beta2 agonist use 3.4‐4.1 puffs/dNo more than 12 puffs/d beta2 agonist and no more than 2 nights with awakening due to asthma symptoms in last 7 days" | No | Yes: at least 3 months | Moderate | Moderate |
| Pearlman 1999 | 50‐80% | 65‐69% | Not stated | No | No | Mild‐moderate | Mild to moderate |
| Peden 1998 | 50‐85 | 72‐73% | "No more than 12 puffs/d beta2 agonist and no more than 3 nights with awakening due to asthmaMean awakenings per night due to asthma 0.05 to 0.09Mean beta2 agonist use 1.4 to 2.0 puffs/d" | No | Some patients: amount and type of ICS not stated | Not stated | Moderate |
| Pinnas 2005 | 45‐80 | 67% | 'during the week before | No | No | Moderate to severe | Moderate |
| Raphael 1999 | 45‐65 | 64.7‐65.7% | > 8 puffs/week beta 2 agonist or diurnal variability in PEFR > 20% during run‐in if FEV > 65‐80 (% predicted) | No | Yes: BDP or TA 8‐12 puffs/d | mild/moderate and severe | mild/moderate and severe |
| SAM40012 | Not stated | Not stated | Symptom score greater than 2 on at least 3 of previous 7 days | Not stated | Yes | Not stated | Moderate |
| Sheffer 1996 | 45‐75 | 62‐64% | "During 7 day run‐in:> 2 night‐time awakenings due to asthma in last 7 days20% or greater PEFR diurnal variability at least one day in which 8 puffs beta2 agonist used " | No | No | Mild to moderate | Moderate |
| Sorkness 1999a | >/=50% | 86‐88% | Not stated | No | No | Mild to moderate | Mild to moderate |
| Sorkness 1999 | >/=50% | 83‐88% | Not stated | No | No | Mild to moderate | Mild to moderate |
| Verona 2003 | Not stated | Not stated | Exacerbation in last year requiring hospitalisation | No | Yes | Moderate to severe | Moderate to severe |
| Wallin 2003 | Not stated | 91‐2% | Symptomatoic during run‐in period despite medication | Not stated | Yes | Mild to moderate | Mild to moderate |
| Wasserman 1996 | 50‐80% | Not stated | "Mean beta2 agonist use 3.1 to 3.3 puffs/dDuring last 7 days run‐in no more than 12 puffs/d beta2 agonist and no more than 2 nights with awakening due to asthma" | No | No | Not stated | Moderate |
| Wolfe 1996 | 50‐80% | 64‐66% | During 2 week run‐in period no more than 12 puffs/d beta2 agonist and no more than 2 nights with awakening due to asthma | No | Yes: dose not stated | Moderate | Moderate |
| Study ID | FEV1 | PEFR | Beta2 agonist use | Night‐time awakening | Exacerbations |
| Chervinsky 1994 | 20% or greater decrease compared to baseline | 20% decrease in morning or evening PEFR on 4 or more days out of 7 in week prior to clinic visit | 12 or more puffs on 3 or more days out of 7 in week prior to clinic visit | 2 or more nights with 2 awakening out of 7 in week prior to clinic visit | Any clinical exacerbation requiring emergency treatment, hospital admission or additional asthma medication other than rescue beta 2 agonist |
| Galant 1996 | 15% or greater decrease compared to baseline | 20% or greater decrease in morning PEFR on 3 or more days out of 7 in week prior to clinic visit | 12 or more puffs on 3 or more days out of 7 in week prior to clinic visit | 3 or more awakening in week prior to clinic visit | |
| Katz 1997 | 15% or greater decrease compared to baseline | 15% or greater decrease in morning PEFR on 3 or more days out of 7 in week prior to clinic visit | 8 or more puffs on 2 or more days out of 7 in week prior to clinic visit | 2 or more nights with awakening out of 7 in week prior to clinic visit | |
| Lawrence 1997 | 20% or greater decrease compared to baseline | 20% or greater decrease in morning PEFR on 3 or more days out of 7 in week prior to clinic visit | 12 or more puffs on 2 or more days out of 7 in week prior to clinic visit | 2 or more nights with awakening out of 7 in week prior to clinic visit | any clinical exacerbation requiring emergency treatment, hospital admission or additional asthma medication other than rescue beta 2 agonist |
| Nathan 2000 | 20% or greater decrease compared to baseline | 20% or greater decrease compared to baseline | 12 or more puffs on 2 or more days out of 7 in week prior to clinic visit | 2 or more awakening in week prior to clinic visit | Any clinical exacerbation requiring emergency treatment, hospital admission or additional asthma medication other than rescue beta 2 agonist |
| Pearlman 1997 | 20% or greater decrease compared to baseline | 20% or greater decrease in morning PEFR on 3 or more days out of 7 in week prior to clinic visit | 12 or more puffs on 2 or more days out of 7 in week prior to clinic visit | 2 or more awakening in week prior to clinic visit | Any clinical exacerbation requiring emergency treatment, hospital admission or additional asthma medication other than rescue beta 2 agonist |
| Peden 1997 | 15% or greater decrease compared to baseline | 20% or greater decrease in morning PEFR on 3 or more days out of 7 in week prior to clinic visit | 12 or more puffs on 3 or more days out of 7 in week prior to clinic visit | 3 or more awakening in week prior to clinic visit | Any clinical exacerbation requiring emergency treatment, hospital admission or additional asthma medication other than rescue beta 2 agonist |
| Raphael 1999 | 20% or greater decrease compared to baseline | 20% or greater decrease in morning PEFR on 3 or more days out of 7 in week prior to clinic visit | 12 or more puffs on 3 or more days out of 7 in week prior to clinic visit | 3 or more nights with awakening out of 7 in week prior to clinic visit | |
| Sheffer 1996 | 15% or greater decrease compared to baseline | 20% or greater decrease in morning PEFR on 3 or more days out of 7 in week prior to clinic visit | 12 or more puffs on 3 or more days out of 7 in week prior to clinic visit | 3 or more nights with awakening out of 7 in week prior to clinic visit | Any clinical exacerbation requiring emergency treatment, hospital admission or additional asthma medication other than rescue beta 2 agonist |
| Wasserman 1996 | 20% or greater decrease compared to baseline | 20% or greater decrease in morning PEFR on 3 or more days out of 7 in week prior to clinic visit | 12 or more puffs on 3 or more days out of 7 in week prior to clinic visit | 2 or more nights with awakening out of 7 in week prior to clinic visit | any clinical exacerbation requiring emergency treatment, hospital admission or additional asthma medication other than rescue beta 2 agonist |
| Wolfe 1996 | 20% or greater decrease compared to baseline | 20% or greater decrease in morning PEFR on 3 or more days out of 7 in week prior to clinic visit | 12 or more puffs on 3 or more days out of 7 in week prior to clinic visit | 2 or more nights with awakening out of 7 in week prior to clinic visit | Any clinical exacerbation requiring emergency treatment, hospital admission or additional asthma medication other than rescue beta 2 agonist |
| Outcome or subgroup title | No. of studies | No. of participants | Statistical method | Effect size |
| 1 Change in FEV1 compared to baseline (litres) Show forest plot | 1 | Mean Difference (IV, Fixed, 95% CI) | Totals not selected | |
| 1.1 Children | 0 | Mean Difference (IV, Fixed, 95% CI) | 0.0 [0.0, 0.0] | |
| 1.2 Adults | 1 | Mean Difference (IV, Fixed, 95% CI) | 0.0 [0.0, 0.0] | |
| 2 Change in morning PEFR compared to baseline (L/min) Show forest plot | 1 | Mean Difference (IV, Fixed, 95% CI) | Totals not selected | |
| 2.1 Children | 0 | Mean Difference (IV, Fixed, 95% CI) | 0.0 [0.0, 0.0] | |
| 2.2 Adults | 1 | Mean Difference (IV, Fixed, 95% CI) | 0.0 [0.0, 0.0] | |
| 3 Change in morning PEFR compared to baseline (L/min) Show forest plot | 1 | Mean Difference (IV, Fixed, 95% CI) | Totals not selected | |
| 3.1 Children | 0 | Mean Difference (IV, Fixed, 95% CI) | 0.0 [0.0, 0.0] | |
| 3.2 Adults | 1 | Mean Difference (IV, Fixed, 95% CI) | 0.0 [0.0, 0.0] | |
| 4 Change in daily asthma symptom score compared to baseline Show forest plot | 1 | Mean Difference (IV, Fixed, 95% CI) | Totals not selected | |
| 4.1 Children | 0 | Mean Difference (IV, Fixed, 95% CI) | 0.0 [0.0, 0.0] | |
| 4.2 Adults | 1 | Mean Difference (IV, Fixed, 95% CI) | 0.0 [0.0, 0.0] | |
| 5 Change in number of night‐time awakenings/week compared to baseline Show forest plot | 1 | Mean Difference (IV, Fixed, 95% CI) | Totals not selected | |
| 5.1 Children | 0 | Mean Difference (IV, Fixed, 95% CI) | 0.0 [0.0, 0.0] | |
| 5.2 Adults | 1 | Mean Difference (IV, Fixed, 95% CI) | 0.0 [0.0, 0.0] | |
| 6 Change in daily use of beta2 agonist compared to baseline (puffs/d) Show forest plot | 1 | Mean Difference (IV, Fixed, 95% CI) | Totals not selected | |
| 6.1 Children | 0 | Mean Difference (IV, Fixed, 95% CI) | 0.0 [0.0, 0.0] | |
| 6.2 Adults | 1 | Mean Difference (IV, Fixed, 95% CI) | 0.0 [0.0, 0.0] | |
| 7 Number of patients withdrawn due to lack of efficacy Show forest plot | 1 | Peto Odds Ratio (Peto, Fixed, 95% CI) | Totals not selected | |
| 7.1 Children | 0 | Peto Odds Ratio (Peto, Fixed, 95% CI) | 0.0 [0.0, 0.0] | |
| 7.2 Adults | 1 | Peto Odds Ratio (Peto, Fixed, 95% CI) | 0.0 [0.0, 0.0] | |
| Outcome or subgroup title | No. of studies | No. of participants | Statistical method | Effect size |
| 1 Change in FEV1 compared to baseline (litres) Show forest plot | 2 | Mean Difference (IV, Fixed, 95% CI) | Subtotals only | |
| 1.1 Children | 0 | 0 | Mean Difference (IV, Fixed, 95% CI) | 0.0 [0.0, 0.0] |
| 1.2 Adults | 2 | 313 | Mean Difference (IV, Fixed, 95% CI) | ‐0.04 [‐0.16, 0.08] |
| 2 Change in FVC compared to baseline (litres) Show forest plot | 1 | Mean Difference (IV, Fixed, 95% CI) | Totals not selected | |
| 2.1 Children | 0 | Mean Difference (IV, Fixed, 95% CI) | 0.0 [0.0, 0.0] | |
| 2.2 Adults | 1 | Mean Difference (IV, Fixed, 95% CI) | 0.0 [0.0, 0.0] | |
| 3 Change in FEF25‐75 compared to baseline (L/second) Show forest plot | 1 | Mean Difference (IV, Fixed, 95% CI) | Totals not selected | |
| 3.1 Children | 0 | Mean Difference (IV, Fixed, 95% CI) | 0.0 [0.0, 0.0] | |
| 3.2 Adults | 1 | Mean Difference (IV, Fixed, 95% CI) | 0.0 [0.0, 0.0] | |
| 4 Change in morning PEFR compared to baseline (L/min) Show forest plot | 2 | Mean Difference (IV, Fixed, 95% CI) | Subtotals only | |
| 4.1 Children | 0 | 0 | Mean Difference (IV, Fixed, 95% CI) | 0.0 [0.0, 0.0] |
| 4.2 Adults | 2 | 313 | Mean Difference (IV, Fixed, 95% CI) | ‐7.49 [‐17.31, 2.33] |
| 5 Change in evening PEFR compared to baseline (L/min) Show forest plot | 2 | Mean Difference (IV, Fixed, 95% CI) | Subtotals only | |
| 5.1 Children | 0 | 0 | Mean Difference (IV, Fixed, 95% CI) | 0.0 [0.0, 0.0] |
| 5.2 Adults | 2 | 313 | Mean Difference (IV, Fixed, 95% CI) | ‐7.95 [‐17.24, 1.34] |
| 6 Change in daily asthma symptom score compared to baseline Show forest plot | 2 | 313 | Std. Mean Difference (IV, Fixed, 95% CI) | 0.32 [0.10, 0.54] |
| 6.1 Children | 0 | 0 | Std. Mean Difference (IV, Fixed, 95% CI) | 0.0 [0.0, 0.0] |
| 6.2 Adults | 2 | 313 | Std. Mean Difference (IV, Fixed, 95% CI) | 0.32 [0.10, 0.54] |
| 7 Change in number of night‐time awakenings/week compared to baseline Show forest plot | 2 | 313 | Mean Difference (IV, Fixed, 95% CI) | 0.09 [0.02, 0.16] |
| 7.1 Children | 0 | 0 | Mean Difference (IV, Fixed, 95% CI) | 0.0 [0.0, 0.0] |
| 7.2 Adults | 2 | 313 | Mean Difference (IV, Fixed, 95% CI) | 0.09 [0.02, 0.16] |
| 8 Change in daily use of beta2 agonist compared to baseline (puffs/d) Show forest plot | 2 | 313 | Mean Difference (IV, Fixed, 95% CI) | 0.07 [‐0.37, 0.51] |
| 8.1 Children | 0 | 0 | Mean Difference (IV, Fixed, 95% CI) | 0.0 [0.0, 0.0] |
| 8.2 Adults | 2 | 313 | Mean Difference (IV, Fixed, 95% CI) | 0.07 [‐0.37, 0.51] |
| 9 Number of patients withdrawn due to lack of efficacy Show forest plot | 2 | 313 | Peto Odds Ratio (Peto, Fixed, 95% CI) | 1.48 [0.88, 2.46] |
| 9.1 Children | 0 | 0 | Peto Odds Ratio (Peto, Fixed, 95% CI) | 0.0 [0.0, 0.0] |
| 9.2 Adults | 2 | 313 | Peto Odds Ratio (Peto, Fixed, 95% CI) | 1.48 [0.88, 2.46] |
| 10 Hoarseness or dysphonia (No. of patients) Show forest plot | 2 | 322 | Peto Odds Ratio (Peto, Fixed, 95% CI) | 0.52 [0.14, 1.97] |
| 10.1 Children | 0 | 0 | Peto Odds Ratio (Peto, Fixed, 95% CI) | 0.0 [0.0, 0.0] |
| 10.2 Adults | 2 | 322 | Peto Odds Ratio (Peto, Fixed, 95% CI) | 0.52 [0.14, 1.97] |
| 11 Oral Candidiasis (No. of patients) Show forest plot | 2 | 322 | Peto Odds Ratio (Peto, Fixed, 95% CI) | 0.27 [0.05, 1.35] |
| 11.1 Children | 0 | 0 | Peto Odds Ratio (Peto, Fixed, 95% CI) | 0.0 [0.0, 0.0] |
| 11.2 Adults | 2 | 322 | Peto Odds Ratio (Peto, Fixed, 95% CI) | 0.27 [0.05, 1.35] |
| 12 Physician global rated efficacy: ineffective Show forest plot | 1 | Peto Odds Ratio (Peto, Fixed, 95% CI) | Totals not selected | |
| 12.1 Children | 0 | Peto Odds Ratio (Peto, Fixed, 95% CI) | 0.0 [0.0, 0.0] | |
| 12.2 Adults | 1 | Peto Odds Ratio (Peto, Fixed, 95% CI) | 0.0 [0.0, 0.0] | |
| Outcome or subgroup title | No. of studies | No. of participants | Statistical method | Effect size |
| 1 Change in FEV1 compared to baseline (litres) Show forest plot | 10 | Litres (Fixed, 95% CI) | Subtotals only | |
| 1.1 Children | 4 | 656 | Litres (Fixed, 95% CI) | ‐0.04 [‐0.09, 0.01] |
| 1.2 Adults | 6 | 887 | Litres (Fixed, 95% CI) | 0.03 [‐0.02, 0.07] |
| 2 Change in FEV1 compared to baseline (litres) Show forest plot | 10 | Mean Difference (IV, Fixed, 95% CI) | Subtotals only | |
| 2.1 Children | 4 | 656 | Mean Difference (IV, Fixed, 95% CI) | ‐0.03 [‐0.08, 0.02] |
| 2.2 Adults | 6 | 887 | Mean Difference (IV, Fixed, 95% CI) | 0.01 [‐0.05, 0.07] |
| 3 FEV1 (% predicted) Show forest plot | 2 | Mean Difference (IV, Fixed, 95% CI) | Totals not selected | |
| 3.1 Children | 1 | Mean Difference (IV, Fixed, 95% CI) | 0.0 [0.0, 0.0] | |
| 3.2 Adults | 1 | Mean Difference (IV, Fixed, 95% CI) | 0.0 [0.0, 0.0] | |
| 4 FEV1 (% predicted) Show forest plot | 2 | 432 | % (Fixed, 95% CI) | ‐0.52 [‐3.83, 2.79] |
| 4.1 Children | 1 | 179 | % (Fixed, 95% CI) | ‐2.0 [‐6.00, 2.00] |
| 4.2 Adults | 1 | 253 | % (Fixed, 95% CI) | 2.70 [‐3.19, 8.59] |
| 5 FEV1 Litres Show forest plot | 1 | Mean Difference (IV, Fixed, 95% CI) | Totals not selected | |
| 5.1 Children | 0 | Mean Difference (IV, Fixed, 95% CI) | 0.0 [0.0, 0.0] | |
| 5.2 Adults | 1 | Mean Difference (IV, Fixed, 95% CI) | 0.0 [0.0, 0.0] | |
| 6 PEF (L/min) Show forest plot | 1 | Mean Difference (IV, Fixed, 95% CI) | Totals not selected | |
| 6.1 Children | 0 | Mean Difference (IV, Fixed, 95% CI) | 0.0 [0.0, 0.0] | |
| 6.2 Adults | 1 | Mean Difference (IV, Fixed, 95% CI) | 0.0 [0.0, 0.0] | |
| 7 Change in clinic PEFR compared to baseline (L/min) Show forest plot | 2 | Mean Difference (IV, Fixed, 95% CI) | Subtotals only | |
| 7.1 Children | 2 | 351 | Mean Difference (IV, Fixed, 95% CI) | 3.00 [‐6.84, 12.84] |
| 7.2 Adults | 0 | 0 | Mean Difference (IV, Fixed, 95% CI) | 0.0 [0.0, 0.0] |
| 8 Change in morning PEFR compared to baseline (L/min) Show forest plot | 11 | Mean Difference (IV, Fixed, 95% CI) | Subtotals only | |
| 8.1 Children | 4 | 710 | Mean Difference (IV, Fixed, 95% CI) | ‐3.67 [‐9.81, 2.46] |
| 8.2 Adults | 7 | 1148 | Mean Difference (IV, Fixed, 95% CI) | ‐7.04 [‐11.87, ‐2.20] |
| 9 Change in evening PEFR compared to baseline (L/min) Show forest plot | 6 | Mean Difference (IV, Fixed, 95% CI) | Subtotals only | |
| 9.1 Children | 2 | 351 | Mean Difference (IV, Fixed, 95% CI) | ‐4.50 [‐11.77, 2.77] |
| 9.2 Adults | 4 | 648 | Mean Difference (IV, Fixed, 95% CI) | ‐7.04 [‐12.66, ‐1.43] |
| 10 Rescue medication usage Show forest plot | 1 | Mean Difference (IV, Fixed, 95% CI) | Totals not selected | |
| 10.1 Children | 0 | Mean Difference (IV, Fixed, 95% CI) | 0.0 [0.0, 0.0] | |
| 10.2 Adults | 1 | Mean Difference (IV, Fixed, 95% CI) | 0.0 [0.0, 0.0] | |
| 11 Change in daily use of beta2 agonist compared to baseline (puffs/d) Show forest plot | 9 | 1409 | Mean Difference (IV, Fixed, 95% CI) | 0.14 [‐0.09, 0.37] |
| 11.1 Children | 3 | 522 | Mean Difference (IV, Fixed, 95% CI) | 0.18 [‐0.14, 0.49] |
| 11.2 Adults | 6 | 887 | Mean Difference (IV, Fixed, 95% CI) | 0.10 [‐0.21, 0.42] |
| 12 Symptom scores Show forest plot | 1 | Mean Difference (IV, Fixed, 95% CI) | Totals not selected | |
| 12.1 Children | 0 | Mean Difference (IV, Fixed, 95% CI) | 0.0 [0.0, 0.0] | |
| 12.2 Adults | 1 | Mean Difference (IV, Fixed, 95% CI) | 0.0 [0.0, 0.0] | |
| 13 Change in daily asthma symptom score compared to baseline Show forest plot | 8 | 1252 | Std. Mean Difference (IV, Fixed, 95% CI) | 0.04 [‐0.07, 0.15] |
| 13.1 Children | 3 | 522 | Std. Mean Difference (IV, Fixed, 95% CI) | 0.01 [‐0.17, 0.18] |
| 13.2 Adults | 5 | 730 | Std. Mean Difference (IV, Fixed, 95% CI) | 0.06 [‐0.08, 0.21] |
| 14 Change in number of night‐time awakenings/week compared to baseline Show forest plot | 4 | 661 | Mean Difference (IV, Fixed, 95% CI) | 0.05 [0.01, 0.09] |
| 14.1 Children | 0 | 0 | Mean Difference (IV, Fixed, 95% CI) | 0.0 [0.0, 0.0] |
| 14.2 Adults | 4 | 661 | Mean Difference (IV, Fixed, 95% CI) | 0.05 [0.01, 0.09] |
| 15 Percentage of symptom‐free days Show forest plot | 1 | Mean Difference (IV, Fixed, 95% CI) | Totals not selected | |
| 15.1 Children | 0 | Mean Difference (IV, Fixed, 95% CI) | 0.0 [0.0, 0.0] | |
| 15.2 Adults | 1 | Mean Difference (IV, Fixed, 95% CI) | 0.0 [0.0, 0.0] | |
| 16 Change in night‐time awakening score compared to baseline Show forest plot | 6 | 921 | Std. Mean Difference (IV, Fixed, 95% CI) | 0.17 [0.04, 0.30] |
| 16.1 Children | 2 | 351 | Std. Mean Difference (IV, Fixed, 95% CI) | 0.17 [‐0.04, 0.38] |
| 16.2 Adults | 4 | 570 | Std. Mean Difference (IV, Fixed, 95% CI) | 0.17 [0.01, 0.34] |
| 17 HRQOL: Functional Status IIR questionaire (short version) Show forest plot | 1 | Mean Difference (IV, Fixed, 95% CI) | Totals not selected | |
| 17.1 Children | 1 | Mean Difference (IV, Fixed, 95% CI) | 0.0 [0.0, 0.0] | |
| 17.2 Adults | 0 | Mean Difference (IV, Fixed, 95% CI) | 0.0 [0.0, 0.0] | |
| 18 HRQOL: Sleep Scale Children questionnaire Show forest plot | 1 | Mean Difference (IV, Fixed, 95% CI) | Totals not selected | |
| 18.1 Children | 1 | Mean Difference (IV, Fixed, 95% CI) | 0.0 [0.0, 0.0] | |
| 18.2 Adults | 0 | Mean Difference (IV, Fixed, 95% CI) | 0.0 [0.0, 0.0] | |
| 19 HRQOL: Quality of Life of Parents of Asthmatic Children questionnaire, burden dimension Show forest plot | 1 | Mean Difference (IV, Fixed, 95% CI) | Totals not selected | |
| 19.1 Children | 1 | Mean Difference (IV, Fixed, 95% CI) | 0.0 [0.0, 0.0] | |
| 19.2 Adults | 0 | Mean Difference (IV, Fixed, 95% CI) | 0.0 [0.0, 0.0] | |
| 20 HRQOL: Quality of Life of Parents of Asthmatic Children questionnaire, subjective norms dimension Show forest plot | 1 | Mean Difference (IV, Fixed, 95% CI) | Totals not selected | |
| 20.1 Children | 1 | Mean Difference (IV, Fixed, 95% CI) | 0.0 [0.0, 0.0] | |
| 20.2 Adults | 0 | Mean Difference (IV, Fixed, 95% CI) | 0.0 [0.0, 0.0] | |
| 21 HRQOL: Quality of Life of Parents of Asthmatic Children questionnaire, subjective norms dimension Show forest plot | 1 | Mean Difference (IV, Fixed, 95% CI) | Totals not selected | |
| 21.1 Children | 1 | Mean Difference (IV, Fixed, 95% CI) | 0.0 [0.0, 0.0] | |
| 21.2 Adults | 0 | Mean Difference (IV, Fixed, 95% CI) | 0.0 [0.0, 0.0] | |
| 22 Physician global rated efficacy: ineffective Show forest plot | 2 | 357 | Peto Odds Ratio (Peto, Fixed, 95% CI) | 1.37 [0.77, 2.44] |
| 22.1 Children | 0 | 0 | Peto Odds Ratio (Peto, Fixed, 95% CI) | 0.0 [0.0, 0.0] |
| 22.2 Adults | 2 | 357 | Peto Odds Ratio (Peto, Fixed, 95% CI) | 1.37 [0.77, 2.44] |
| 23 Withdrawal due to asthma exacerbation (No. of patients) Show forest plot | 1 | Peto Odds Ratio (Peto, Fixed, 95% CI) | Totals not selected | |
| 23.1 Children | 1 | Peto Odds Ratio (Peto, Fixed, 95% CI) | 0.0 [0.0, 0.0] | |
| 23.2 Adults | 0 | Peto Odds Ratio (Peto, Fixed, 95% CI) | 0.0 [0.0, 0.0] | |
| 24 Withdrawals due to adverse events Show forest plot | 3 | 627 | Odds Ratio (M‐H, Fixed, 95% CI) | 1.16 [0.54, 2.47] |
| 24.1 Children | 0 | 0 | Odds Ratio (M‐H, Fixed, 95% CI) | 0.0 [0.0, 0.0] |
| 24.2 Adults | 3 | 627 | Odds Ratio (M‐H, Fixed, 95% CI) | 1.16 [0.54, 2.47] |
| 25 Number of patients withdrawn due to lack of efficacy Show forest plot | 9 | 1657 | Peto Odds Ratio (Peto, Fixed, 95% CI) | 1.01 [0.76, 1.35] |
| 25.1 Children | 3 | 522 | Peto Odds Ratio (Peto, Fixed, 95% CI) | 1.25 [0.79, 1.97] |
| 25.2 Adults | 6 | 1135 | Peto Odds Ratio (Peto, Fixed, 95% CI) | 0.88 [0.61, 1.28] |
| 26 Oral Candidiasis (No. of patients) Show forest plot | 6 | 1150 | Peto Odds Ratio (Peto, Fixed, 95% CI) | 0.98 [0.46, 2.08] |
| 26.1 Children | 2 | 391 | Peto Odds Ratio (Peto, Fixed, 95% CI) | 1.33 [0.30, 5.90] |
| 26.2 Adults | 4 | 759 | Peto Odds Ratio (Peto, Fixed, 95% CI) | 0.88 [0.37, 2.11] |
| 27 Headaches Show forest plot | 3 | 511 | Peto Odds Ratio (Peto, Fixed, 95% CI) | 0.62 [0.15, 2.60] |
| 27.1 Children | 0 | 0 | Peto Odds Ratio (Peto, Fixed, 95% CI) | 0.0 [0.0, 0.0] |
| 27.2 Adults | 3 | 511 | Peto Odds Ratio (Peto, Fixed, 95% CI) | 0.62 [0.15, 2.60] |
| 28 Sore throat or pharyngitis (No. of patients) Show forest plot | 5 | 841 | Peto Odds Ratio (Peto, Fixed, 95% CI) | 1.87 [0.71, 4.93] |
| 28.1 Children | 0 | 0 | Peto Odds Ratio (Peto, Fixed, 95% CI) | 0.0 [0.0, 0.0] |
| 28.2 Adults | 5 | 841 | Peto Odds Ratio (Peto, Fixed, 95% CI) | 1.87 [0.71, 4.93] |
| 29 Hoarseness or dysphonia (No. of patients) Show forest plot | 7 | 1365 | Peto Odds Ratio (Peto, Fixed, 95% CI) | 0.65 [0.27, 1.57] |
| 29.1 Children | 2 | 391 | Peto Odds Ratio (Peto, Fixed, 95% CI) | 1.00 [0.20, 4.99] |
| 29.2 Adults | 5 | 974 | Peto Odds Ratio (Peto, Fixed, 95% CI) | 0.54 [0.19, 1.55] |
| 30 Urinary free cortisol excretion (mcg/24 hours) Show forest plot | 2 | 228 | Mean Difference (IV, Fixed, 95% CI) | ‐0.70 [‐3.73, 2.32] |
| 30.1 Children | 2 | 228 | Mean Difference (IV, Fixed, 95% CI) | ‐0.70 [‐3.73, 2.32] |
| 30.2 Adults | 0 | 0 | Mean Difference (IV, Fixed, 95% CI) | 0.0 [0.0, 0.0] |
| 31 Morning plasma cortisol (mcg/dL) Show forest plot | 3 | 377 | Mean Difference (IV, Fixed, 95% CI) | ‐0.06 [‐1.01, 0.89] |
| 31.1 Children | 2 | 333 | Mean Difference (IV, Fixed, 95% CI) | ‐0.07 [‐1.14, 0.99] |
| 31.2 Adults | 1 | 44 | Mean Difference (IV, Fixed, 95% CI) | 0.0 [‐2.09, 2.09] |
| Outcome or subgroup title | No. of studies | No. of participants | Statistical method | Effect size |
| 1 Change in FEV1 compared to baseline based on study duration(litres) ‐ children Show forest plot | 3 | 490 | Litres (Fixed, 95% CI) | ‐0.01 [‐0.07, 0.05] |
| 1.1 1‐4 weeks | 0 | 0 | Litres (Fixed, 95% CI) | 0.0 [0.0, 0.0] |
| 1.2 1‐5 months | 3 | 490 | Litres (Fixed, 95% CI) | ‐0.01 [‐0.07, 0.05] |
| 1.3 6 months or more | 0 | 0 | Litres (Fixed, 95% CI) | 0.0 [0.0, 0.0] |
| 2 Change in FEV1 compared to baseline based on study duration (litres) ‐ adults Show forest plot | 6 | Litres (Fixed, 95% CI) | 0.03 [‐0.02, 0.07] | |
| 2.1 1‐4 weeks | 0 | Litres (Fixed, 95% CI) | 0.0 [0.0, 0.0] | |
| 2.2 1‐5 months | 6 | Litres (Fixed, 95% CI) | 0.03 [‐0.02, 0.07] | |
| 2.3 6 months or more | 0 | Litres (Fixed, 95% CI) | 0.0 [0.0, 0.0] | |
| 3 Change in FEV1 compared to baseline (litres) based on delivery devices ‐ children Show forest plot | 3 | Litres (Fixed, 95% CI) | ‐0.01 [‐0.07, 0.05] | |
| 3.1 MDI | 0 | Litres (Fixed, 95% CI) | 0.0 [0.0, 0.0] | |
| 3.2 DPI | 3 | Litres (Fixed, 95% CI) | ‐0.01 [‐0.07, 0.05] | |
| 4 Change in FEV1 compared to baseline based on delivery devices (litres) ‐ adults Show forest plot | 6 | Litres (Fixed, 95% CI) | 0.03 [‐0.02, 0.07] | |
| 4.1 MDI | 3 | Litres (Fixed, 95% CI) | 0.02 [‐0.08, 0.12] | |
| 4.2 DPI | 3 | Litres (Fixed, 95% CI) | 0.03 [‐0.02, 0.08] | |
| 5 Change in FEV1 compared to baseline based on degrees of severity (litres) ‐ children Show forest plot | 3 | Litres (Fixed, 95% CI) | ‐0.01 [‐0.07, 0.05] | |
| 5.1 Mild to moderate | 0 | Litres (Fixed, 95% CI) | 0.0 [0.0, 0.0] | |
| 5.2 Moderate | 3 | Litres (Fixed, 95% CI) | ‐0.01 [‐0.07, 0.05] | |
| 6 Change in FEV1 compared to baseline based on degrees of severity (litres) ‐ adults Show forest plot | 6 | Litres (Fixed, 95% CI) | 0.03 [‐0.02, 0.07] | |
| 6.1 Mild to moderate | 0 | Litres (Fixed, 95% CI) | 0.0 [0.0, 0.0] | |
| 6.2 Moderate | 6 | Litres (Fixed, 95% CI) | 0.03 [‐0.02, 0.07] | |
| Outcome or subgroup title | No. of studies | No. of participants | Statistical method | Effect size |
| 1 FEV1 (% predicted) Show forest plot | 4 | 551 | Mean Difference (IV, Fixed, 95% CI) | ‐0.96 [‐3.45, 1.53] |
| 1.1 Children | 2 | 114 | Mean Difference (IV, Fixed, 95% CI) | ‐2.48 [‐8.60, 3.64] |
| 1.2 Adults | 2 | 437 | Mean Difference (IV, Fixed, 95% CI) | ‐0.66 [‐3.39, 2.06] |
| 2 Change in FEV1 compared to baseline (litres) Show forest plot | 9 | 1283 | Mean Difference (IV, Fixed, 95% CI) | ‐0.01 [‐0.06, 0.04] |
| 2.1 Children | 0 | 0 | Mean Difference (IV, Fixed, 95% CI) | 0.0 [0.0, 0.0] |
| 2.2 Adults | 9 | 1283 | Mean Difference (IV, Fixed, 95% CI) | ‐0.01 [‐0.06, 0.04] |
| 3 Change in FEV1 compared to baseline (litres ‐ imputed estimates) Show forest plot | 11 | 1720 | Mean Difference (IV, Fixed, 95% CI) | 0.01 [‐0.04, 0.05] |
| 3.1 Children | 0 | 0 | Mean Difference (IV, Fixed, 95% CI) | 0.0 [0.0, 0.0] |
| 3.2 Adults | 11 | 1720 | Mean Difference (IV, Fixed, 95% CI) | 0.01 [‐0.04, 0.05] |
| 4 Change in FVC compared to baseline (litres) Show forest plot | 1 | Mean Difference (IV, Fixed, 95% CI) | Totals not selected | |
| 4.1 Children | 0 | Mean Difference (IV, Fixed, 95% CI) | 0.0 [0.0, 0.0] | |
| 4.2 Adults | 1 | Mean Difference (IV, Fixed, 95% CI) | 0.0 [0.0, 0.0] | |
| 5 Change in FEF25‐75 compared to baseline (L/second) Show forest plot | 1 | Mean Difference (IV, Fixed, 95% CI) | Totals not selected | |
| 5.1 Children | 0 | Mean Difference (IV, Fixed, 95% CI) | 0.0 [0.0, 0.0] | |
| 5.2 Adults | 1 | Mean Difference (IV, Fixed, 95% CI) | 0.0 [0.0, 0.0] | |
| 6 Change in morning PEFR compared to baseline (L/min ‐ imputed/estimated values) Show forest plot | 13 | Litres/min (Fixed, 95% CI) | Subtotals only | |
| 6.1 Children | 2 | 876 | Litres/min (Fixed, 95% CI) | ‐7.92 [‐12.93, ‐2.91] |
| 6.2 Adults | 11 | 1713 | Litres/min (Fixed, 95% CI) | ‐1.97 [‐5.77, 1.82] |
| 7 Change in morning PEFR compared to baseline (L/min) Show forest plot | 13 | Mean Difference (IV, Fixed, 95% CI) | Subtotals only | |
| 7.1 Children | 2 | 876 | Mean Difference (IV, Fixed, 95% CI) | ‐7.92 [‐12.93, ‐2.91] |
| 7.2 Adults | 11 | 1703 | Mean Difference (IV, Fixed, 95% CI) | ‐4.84 [‐9.37, ‐0.31] |
| 8 Change in evening PEFR compared to baseline (L/min) Show forest plot | 7 | Mean Difference (IV, Fixed, 95% CI) | Subtotals only | |
| 8.1 Children | 2 | 874 | Mean Difference (IV, Fixed, 95% CI) | ‐9.36 [‐14.37, ‐4.35] |
| 8.2 Adults | 5 | 776 | Mean Difference (IV, Fixed, 95% CI) | ‐3.76 [‐9.18, 1.66] |
| 9 PC20 Show forest plot | 1 | Mean Difference (IV, Fixed, 95% CI) | Totals not selected | |
| 9.1 Children | 0 | Mean Difference (IV, Fixed, 95% CI) | 0.0 [0.0, 0.0] | |
| 9.2 Adults | 1 | Mean Difference (IV, Fixed, 95% CI) | 0.0 [0.0, 0.0] | |
| 10 PD20 Show forest plot | 1 | Mean Difference (IV, Fixed, 95% CI) | Totals not selected | |
| 10.1 Children | 1 | Mean Difference (IV, Fixed, 95% CI) | 0.0 [0.0, 0.0] | |
| 10.2 Adults | 0 | Mean Difference (IV, Fixed, 95% CI) | 0.0 [0.0, 0.0] | |
| 11 Change in daily use of beta2 agonist compared to baseline (puffs/d) Show forest plot | 7 | 931 | Mean Difference (IV, Fixed, 95% CI) | 0.18 [‐0.08, 0.43] |
| 11.1 Children | 0 | 0 | Mean Difference (IV, Fixed, 95% CI) | 0.0 [0.0, 0.0] |
| 11.2 Adults | 7 | 931 | Mean Difference (IV, Fixed, 95% CI) | 0.18 [‐0.08, 0.43] |
| 12 Change in number of night‐time awakenings/week compared to baseline Show forest plot | 2 | 334 | Mean Difference (IV, Fixed, 95% CI) | ‐0.01 [‐0.05, 0.04] |
| 12.1 Children | 0 | 0 | Mean Difference (IV, Fixed, 95% CI) | 0.0 [0.0, 0.0] |
| 12.2 Adults | 2 | 334 | Mean Difference (IV, Fixed, 95% CI) | ‐0.01 [‐0.05, 0.04] |
| 13 Change in % nights without waking Show forest plot | 1 | Mean Difference (IV, Fixed, 95% CI) | Totals not selected | |
| 13.1 Children | 0 | Mean Difference (IV, Fixed, 95% CI) | 0.0 [0.0, 0.0] | |
| 13.2 Adults | 1 | Mean Difference (IV, Fixed, 95% CI) | 0.0 [0.0, 0.0] | |
| 14 Change in daily asthma symptom score compared to baseline Show forest plot | 7 | 930 | Std. Mean Difference (IV, Fixed, 95% CI) | 0.11 [‐0.02, 0.24] |
| 14.1 Children | 0 | 0 | Std. Mean Difference (IV, Fixed, 95% CI) | 0.0 [0.0, 0.0] |
| 14.2 Adults | 7 | 930 | Std. Mean Difference (IV, Fixed, 95% CI) | 0.11 [‐0.02, 0.24] |
| 15 Percentage of symptom‐free days Show forest plot | 1 | Mean Difference (IV, Fixed, 95% CI) | Totals not selected | |
| 15.1 Children | 0 | Mean Difference (IV, Fixed, 95% CI) | 0.0 [0.0, 0.0] | |
| 15.2 Adults | 1 | Mean Difference (IV, Fixed, 95% CI) | 0.0 [0.0, 0.0] | |
| 16 Health related quality of life ‐ AQLQ (absolute scores) | 0 | Mean Difference (IV, Fixed, 95% CI) | Totals not selected | |
| 16.1 Children | 0 | Mean Difference (IV, Fixed, 95% CI) | 0.0 [0.0, 0.0] | |
| 16.2 Adults | 0 | Mean Difference (IV, Fixed, 95% CI) | 0.0 [0.0, 0.0] | |
| 17 Number of patients withdrawn due to lack of efficacy Show forest plot | 7 | 1294 | Peto Odds Ratio (Peto, Fixed, 95% CI) | 1.41 [1.01, 1.98] |
| 17.1 Children | 0 | 0 | Peto Odds Ratio (Peto, Fixed, 95% CI) | 0.0 [0.0, 0.0] |
| 17.2 Adults | 7 | 1294 | Peto Odds Ratio (Peto, Fixed, 95% CI) | 1.41 [1.01, 1.98] |
| 18 Exacerbations requiring oral steroids Show forest plot | 2 | 883 | Peto Odds Ratio (Peto, Fixed, 95% CI) | 1.21 [0.72, 2.05] |
| 18.1 Children | 2 | 883 | Peto Odds Ratio (Peto, Fixed, 95% CI) | 1.21 [0.72, 2.05] |
| 18.2 Adults | 0 | 0 | Peto Odds Ratio (Peto, Fixed, 95% CI) | 0.0 [0.0, 0.0] |
| 19 Exacerbations requiring hospitalisation Show forest plot | 1 | Odds Ratio (M‐H, Fixed, 95% CI) | Totals not selected | |
| 19.1 Children | 1 | Odds Ratio (M‐H, Fixed, 95% CI) | 0.0 [0.0, 0.0] | |
| 19.2 Adults | 0 | Odds Ratio (M‐H, Fixed, 95% CI) | 0.0 [0.0, 0.0] | |
| 20 Oral Candidiasis (No. of patients) Show forest plot | 8 | 1752 | Peto Odds Ratio (Peto, Fixed, 95% CI) | 0.87 [0.47, 1.61] |
| 20.1 Children | 1 | 528 | Peto Odds Ratio (Peto, Fixed, 95% CI) | 0.65 [0.19, 2.27] |
| 20.2 Adults | 7 | 1224 | Peto Odds Ratio (Peto, Fixed, 95% CI) | 0.95 [0.47, 1.95] |
| 21 Sore throat or pharyngitis (No. of patients) Show forest plot | 8 | 1825 | Peto Odds Ratio (Peto, Fixed, 95% CI) | 0.98 [0.60, 1.63] |
| 21.1 Children | 2 | 883 | Peto Odds Ratio (Peto, Fixed, 95% CI) | 1.34 [0.58, 3.08] |
| 21.2 Adults | 6 | 942 | Peto Odds Ratio (Peto, Fixed, 95% CI) | 0.83 [0.44, 1.55] |
| 22 Hoarseness or dysphonia (No. of patients) Show forest plot | 7 | 1693 | Peto Odds Ratio (Peto, Fixed, 95% CI) | 0.76 [0.40, 1.46] |
| 22.1 Children | 1 | 528 | Peto Odds Ratio (Peto, Fixed, 95% CI) | 1.30 [0.29, 5.79] |
| 22.2 Adults | 6 | 1165 | Peto Odds Ratio (Peto, Fixed, 95% CI) | 0.67 [0.32, 1.38] |
| 23 Withdrawals due to adverse events Show forest plot | 5 | 1161 | Odds Ratio (M‐H, Fixed, 95% CI) | 0.65 [0.22, 1.92] |
| 23.1 Children | 1 | 528 | Odds Ratio (M‐H, Fixed, 95% CI) | 0.98 [0.14, 6.99] |
| 23.2 Adults | 4 | 633 | Odds Ratio (M‐H, Fixed, 95% CI) | 0.55 [0.15, 2.03] |
| 24 No. patients with </=18 mcg/dL poststimulation cortisol Show forest plot | 2 | Odds Ratio (M‐H, Fixed, 95% CI) | Totals not selected | |
| 24.1 Children | 0 | Odds Ratio (M‐H, Fixed, 95% CI) | 0.0 [0.0, 0.0] | |
| 24.2 Adults | 2 | Odds Ratio (M‐H, Fixed, 95% CI) | 0.0 [0.0, 0.0] | |
| 25 AUC serum cortisol Show forest plot | 1 | Mean Difference (IV, Fixed, 95% CI) | Totals not selected | |
| 25.1 Children | 0 | Mean Difference (IV, Fixed, 95% CI) | 0.0 [0.0, 0.0] | |
| 25.2 Adults | 1 | Mean Difference (IV, Fixed, 95% CI) | 0.0 [0.0, 0.0] | |
| 26 Change in peak plasma cortisol expression Show forest plot | 1 | Mean Difference (IV, Fixed, 95% CI) | Totals not selected | |
| 26.1 Children | 0 | Mean Difference (IV, Fixed, 95% CI) | 0.0 [0.0, 0.0] | |
| 26.2 Adults | 1 | Mean Difference (IV, Fixed, 95% CI) | 0.0 [0.0, 0.0] | |
| Outcome or subgroup title | No. of studies | No. of participants | Statistical method | Effect size |
| 1 Change in FEV1 compared to baseline based on study duration (litres) ‐ adults Show forest plot | 11 | 1720 | Mean Difference (IV, Fixed, 95% CI) | 0.01 [‐0.04, 0.05] |
| 1.1 1‐4 weeks | 2 | 293 | Mean Difference (IV, Fixed, 95% CI) | 0.09 [‐0.01, 0.19] |
| 1.2 1‐5 months | 8 | 1237 | Mean Difference (IV, Fixed, 95% CI) | ‐0.03 [‐0.08, 0.02] |
| 1.3 6 months or longer | 1 | 190 | Mean Difference (IV, Fixed, 95% CI) | 0.08 [‐0.03, 0.19] |
| 2 Change in FEV1 compared to baseline based on delivery devices (litres) ‐ adults Show forest plot | 11 | 1720 | Mean Difference (IV, Fixed, 95% CI) | 0.01 [‐0.04, 0.05] |
| 2.1 MDI | 8 | 1226 | Mean Difference (IV, Fixed, 95% CI) | 0.02 [‐0.03, 0.07] |
| 2.2 DPI | 3 | 494 | Mean Difference (IV, Fixed, 95% CI) | ‐0.02 [‐0.11, 0.06] |
| 3 Change in FEV1 compared to baseline based on degrees of severity (litres) ‐ adults Show forest plot | 11 | 1720 | Mean Difference (IV, Fixed, 95% CI) | 0.01 [‐0.04, 0.05] |
| 3.1 Mild to moderate | 3 | 194 | Mean Difference (IV, Fixed, 95% CI) | ‐0.05 [‐0.18, 0.08] |
| 3.2 Moderate | 6 | 1136 | Mean Difference (IV, Fixed, 95% CI) | 0.01 [‐0.05, 0.06] |
| 3.3 Mixed | 1 | 200 | Mean Difference (IV, Fixed, 95% CI) | ‐0.05 [‐0.19, 0.09] |
| 3.4 Unclear | 1 | 190 | Mean Difference (IV, Fixed, 95% CI) | 0.08 [‐0.03, 0.19] |
| Outcome or subgroup title | No. of studies | No. of participants | Statistical method | Effect size |
| 1 Change in FEV1 compared to baseline (litres) Show forest plot | 3 | 351 | Mean Difference (IV, Fixed, 95% CI) | ‐0.01 [‐0.10, 0.09] |
| 1.1 Children | 0 | 0 | Mean Difference (IV, Fixed, 95% CI) | 0.0 [0.0, 0.0] |
| 1.2 Adults | 3 | 351 | Mean Difference (IV, Fixed, 95% CI) | ‐0.01 [‐0.10, 0.09] |
| 2 FEV1 (% predicted) Show forest plot | 1 | Mean Difference (IV, Fixed, 95% CI) | Totals not selected | |
| 2.1 Children | 0 | Mean Difference (IV, Fixed, 95% CI) | 0.0 [0.0, 0.0] | |
| 2.2 Adults | 1 | Mean Difference (IV, Fixed, 95% CI) | 0.0 [0.0, 0.0] | |
| 3 Change in morning PEFR compared to baseline (L/min) Show forest plot | 3 | 593 | Mean Difference (IV, Fixed, 95% CI) | ‐7.97 [‐14.58, ‐1.35] |
| 3.1 Children | 0 | 0 | Mean Difference (IV, Fixed, 95% CI) | 0.0 [0.0, 0.0] |
| 3.2 Adults | 3 | 593 | Mean Difference (IV, Fixed, 95% CI) | ‐7.97 [‐14.58, ‐1.35] |
| 4 Change in evening PEFR compared to baseline (L/min) Show forest plot | 1 | Mean Difference (IV, Fixed, 95% CI) | Totals not selected | |
| 4.1 Children | 0 | Mean Difference (IV, Fixed, 95% CI) | 0.0 [0.0, 0.0] | |
| 4.2 Adults | 1 | Mean Difference (IV, Fixed, 95% CI) | 0.0 [0.0, 0.0] | |
| 5 Percentage of symptom‐free days Show forest plot | 1 | Mean Difference (IV, Fixed, 95% CI) | Totals not selected | |
| 5.1 Children | 0 | Mean Difference (IV, Fixed, 95% CI) | 0.0 [0.0, 0.0] | |
| 5.2 Adults | 1 | Mean Difference (IV, Fixed, 95% CI) | 0.0 [0.0, 0.0] | |
| 6 Change in daily asthma symptom score compared to baseline Show forest plot | 2 | 194 | Std. Mean Difference (IV, Fixed, 95% CI) | 0.31 [0.03, 0.60] |
| 6.1 Children | 0 | 0 | Std. Mean Difference (IV, Fixed, 95% CI) | 0.0 [0.0, 0.0] |
| 6.2 Adults | 2 | 194 | Std. Mean Difference (IV, Fixed, 95% CI) | 0.31 [0.03, 0.60] |
| 7 Change in number of night‐time awakenings/week compared to baseline Show forest plot | 1 | Mean Difference (IV, Fixed, 95% CI) | Totals not selected | |
| 7.1 Children | 0 | Mean Difference (IV, Fixed, 95% CI) | 0.0 [0.0, 0.0] | |
| 7.2 Adults | 1 | Mean Difference (IV, Fixed, 95% CI) | 0.0 [0.0, 0.0] | |
| 8 Change in daily use of beta2 agonist compared to baseline (puffs/d) Show forest plot | 1 | Mean Difference (IV, Fixed, 95% CI) | Totals not selected | |
| 8.1 Children | 0 | Mean Difference (IV, Fixed, 95% CI) | 0.0 [0.0, 0.0] | |
| 8.2 Adults | 1 | Mean Difference (IV, Fixed, 95% CI) | 0.0 [0.0, 0.0] | |
| 9 Physician global rated efficacy: ineffective Show forest plot | 2 | 400 | Peto Odds Ratio (Peto, Fixed, 95% CI) | 1.25 [0.81, 1.93] |
| 9.1 Children | 0 | 0 | Peto Odds Ratio (Peto, Fixed, 95% CI) | 0.0 [0.0, 0.0] |
| 9.2 Adults | 2 | 400 | Peto Odds Ratio (Peto, Fixed, 95% CI) | 1.25 [0.81, 1.93] |
| 10 Number of patients withdrawn due to lack of efficacy Show forest plot | 2 | 454 | Peto Odds Ratio (Peto, Fixed, 95% CI) | 2.30 [0.90, 5.90] |
| 10.1 Children | 0 | 0 | Peto Odds Ratio (Peto, Fixed, 95% CI) | 0.0 [0.0, 0.0] |
| 10.2 Adults | 2 | 454 | Peto Odds Ratio (Peto, Fixed, 95% CI) | 2.30 [0.90, 5.90] |
| 11 Sore throat or pharyngitis (No. of patients) Show forest plot | 3 | 615 | Peto Odds Ratio (Peto, Fixed, 95% CI) | 1.02 [0.29, 3.56] |
| 11.1 Children | 0 | 0 | Peto Odds Ratio (Peto, Fixed, 95% CI) | 0.0 [0.0, 0.0] |
| 11.2 Adults | 3 | 615 | Peto Odds Ratio (Peto, Fixed, 95% CI) | 1.02 [0.29, 3.56] |
| 12 Hoarseness or dysphonia (No. of patients) Show forest plot | 3 | 615 | Peto Odds Ratio (Peto, Fixed, 95% CI) | 0.28 [0.08, 0.92] |
| 12.1 Children | 0 | 0 | Peto Odds Ratio (Peto, Fixed, 95% CI) | 0.0 [0.0, 0.0] |
| 12.2 Adults | 3 | 615 | Peto Odds Ratio (Peto, Fixed, 95% CI) | 0.28 [0.08, 0.92] |
| 13 Oral Candidiasis (No. of patients) Show forest plot | 3 | 615 | Peto Odds Ratio (Peto, Fixed, 95% CI) | 0.89 [0.32, 2.49] |
| 13.1 Children | 0 | 0 | Peto Odds Ratio (Peto, Fixed, 95% CI) | 0.0 [0.0, 0.0] |
| 13.2 Adults | 3 | 615 | Peto Odds Ratio (Peto, Fixed, 95% CI) | 0.89 [0.32, 2.49] |
| 14 Plasma Cortisol (AUC) Show forest plot | 1 | Mean Difference (IV, Fixed, 95% CI) | Totals not selected | |
| 14.1 Children | 0 | Mean Difference (IV, Fixed, 95% CI) | 0.0 [0.0, 0.0] | |
| 14.2 Adults | 1 | Mean Difference (IV, Fixed, 95% CI) | 0.0 [0.0, 0.0] | |
| 15 Clinic PEF (L/min ‐ change from baseline) Show forest plot | 1 | Mean Difference (IV, Fixed, 95% CI) | Totals not selected | |
| 15.1 Children | 0 | Mean Difference (IV, Fixed, 95% CI) | 0.0 [0.0, 0.0] | |
| 15.2 Adults | 1 | Mean Difference (IV, Fixed, 95% CI) | 0.0 [0.0, 0.0] | |
| Outcome or subgroup title | No. of studies | No. of participants | Statistical method | Effect size |
| 1 Change in FEV1 compared to baseline based on study duration (litres) ‐ adults Show forest plot | 3 | 351 | Mean Difference (IV, Fixed, 95% CI) | ‐0.01 [‐0.10, 0.09] |
| 1.1 1‐4 weeks | 1 | 23 | Mean Difference (IV, Fixed, 95% CI) | ‐0.45 [‐0.88, ‐0.02] |
| 1.2 1‐5 months | 2 | 328 | Mean Difference (IV, Fixed, 95% CI) | 0.02 [‐0.08, 0.11] |
| 1.3 6 months or longer | 0 | 0 | Mean Difference (IV, Fixed, 95% CI) | 0.0 [0.0, 0.0] |
| 2 Change in FEV1 compared to baseline based on delivery devices (litres) ‐ adults Show forest plot | 3 | 351 | Mean Difference (IV, Fixed, 95% CI) | ‐0.01 [‐0.10, 0.09] |
| 2.1 MDI | 1 | 23 | Mean Difference (IV, Fixed, 95% CI) | ‐0.45 [‐0.88, ‐0.02] |
| 2.2 DPI | 2 | 328 | Mean Difference (IV, Fixed, 95% CI) | 0.02 [‐0.08, 0.11] |
| 3 Change in FEV1 compared to baseline based on degrees of severity (litres) ‐ adults Show forest plot | 3 | 351 | Mean Difference (IV, Fixed, 95% CI) | ‐0.01 [‐0.10, 0.09] |
| 3.1 Mild to moderate | 1 | 23 | Mean Difference (IV, Fixed, 95% CI) | ‐0.45 [‐0.88, ‐0.02] |
| 3.2 Moderate | 2 | 328 | Mean Difference (IV, Fixed, 95% CI) | 0.02 [‐0.08, 0.11] |
| Outcome or subgroup title | No. of studies | No. of participants | Statistical method | Effect size |
| 1 FEV1 (Change from baseline ‐ litres) Show forest plot | 5 | 900 | Mean Difference (IV, Fixed, 95% CI) | ‐0.01 [‐0.06, 0.04] |
| 1.1 Children | 0 | 0 | Mean Difference (IV, Fixed, 95% CI) | 0.0 [0.0, 0.0] |
| 1.2 Adults | 5 | 900 | Mean Difference (IV, Fixed, 95% CI) | ‐0.01 [‐0.06, 0.04] |
| 2 Change in morning PEF (L/min) Show forest plot | 4 | 905 | Mean Difference (IV, Fixed, 95% CI) | ‐2.30 [‐7.94, 3.35] |
| 2.1 Children | 0 | 0 | Mean Difference (IV, Fixed, 95% CI) | 0.0 [0.0, 0.0] |
| 2.2 Adults | 4 | 905 | Mean Difference (IV, Fixed, 95% CI) | ‐2.30 [‐7.94, 3.35] |
| 3 Change in evening PEF (L/min) Show forest plot | 2 | 505 | Mean Difference (IV, Fixed, 95% CI) | 5.83 [‐2.94, 14.60] |
| 3.1 Children | 0 | 0 | Mean Difference (IV, Fixed, 95% CI) | 0.0 [0.0, 0.0] |
| 3.2 Adults | 2 | 505 | Mean Difference (IV, Fixed, 95% CI) | 5.83 [‐2.94, 14.60] |
| 4 Change in rescue medication (puffs/d) Show forest plot | 1 | Mean Difference (IV, Fixed, 95% CI) | Totals not selected | |
| 4.1 Children | 0 | Mean Difference (IV, Fixed, 95% CI) | 0.0 [0.0, 0.0] | |
| 4.2 Adults | 1 | Mean Difference (IV, Fixed, 95% CI) | 0.0 [0.0, 0.0] | |
| 5 Health‐related quality of life ‐ AQLQ (absolute scores) | 0 | Mean Difference (IV, Fixed, 95% CI) | Totals not selected | |
| 5.1 Children | 0 | Mean Difference (IV, Fixed, 95% CI) | 0.0 [0.0, 0.0] | |
| 5.2 Adults | 0 | Mean Difference (IV, Fixed, 95% CI) | 0.0 [0.0, 0.0] | |
| 6 Change in daily symptoms compared with baseline Show forest plot | 1 | Mean Difference (IV, Fixed, 95% CI) | Totals not selected | |
| 6.1 Children | 0 | Mean Difference (IV, Fixed, 95% CI) | 0.0 [0.0, 0.0] | |
| 6.2 Adults | 1 | Mean Difference (IV, Fixed, 95% CI) | 0.0 [0.0, 0.0] | |
| 7 Nocturnal awakenings (awakenings per night) | 0 | Mean Difference (IV, Fixed, 95% CI) | Totals not selected | |
| 7.1 Children | 0 | Mean Difference (IV, Fixed, 95% CI) | 0.0 [0.0, 0.0] | |
| 7.2 Adults | 0 | Mean Difference (IV, Fixed, 95% CI) | 0.0 [0.0, 0.0] | |
| 8 Exacerbations requiring hospitalisation Show forest plot | 1 | Peto Odds Ratio (Peto, Fixed, 95% CI) | Totals not selected | |
| 8.1 Children | 0 | Peto Odds Ratio (Peto, Fixed, 95% CI) | 0.0 [0.0, 0.0] | |
| 8.2 Adults | 1 | Peto Odds Ratio (Peto, Fixed, 95% CI) | 0.0 [0.0, 0.0] | |
| 9 Exacerbations requiring OCS treatment Show forest plot | 2 | 363 | Peto Odds Ratio (Peto, Fixed, 95% CI) | 1.24 [0.77, 1.98] |
| 9.1 Children | 0 | 0 | Peto Odds Ratio (Peto, Fixed, 95% CI) | 0.0 [0.0, 0.0] |
| 9.2 Adults | 2 | 363 | Peto Odds Ratio (Peto, Fixed, 95% CI) | 1.24 [0.77, 1.98] |
| 10 Withdrawals (total) Show forest plot | 5 | 1039 | Peto Odds Ratio (Peto, Fixed, 95% CI) | 1.27 [0.88, 1.83] |
| 10.1 Children | 0 | 0 | Peto Odds Ratio (Peto, Fixed, 95% CI) | 0.0 [0.0, 0.0] |
| 10.2 Adults | 5 | 1039 | Peto Odds Ratio (Peto, Fixed, 95% CI) | 1.27 [0.88, 1.83] |
| 11 Withdrawals (adverse events) Show forest plot | 4 | 841 | Peto Odds Ratio (Peto, Fixed, 95% CI) | 0.46 [0.17, 1.25] |
| 11.1 Children | 0 | 0 | Peto Odds Ratio (Peto, Fixed, 95% CI) | 0.0 [0.0, 0.0] |
| 11.2 Adults | 4 | 841 | Peto Odds Ratio (Peto, Fixed, 95% CI) | 0.46 [0.17, 1.25] |
| 12 Withdrawals (lack of efficacy) Show forest plot | 2 | 537 | Peto Odds Ratio (Peto, Fixed, 95% CI) | 1.67 [0.73, 3.81] |
| 12.1 Children | 0 | 0 | Peto Odds Ratio (Peto, Fixed, 95% CI) | 0.0 [0.0, 0.0] |
| 12.2 Adults | 2 | 537 | Peto Odds Ratio (Peto, Fixed, 95% CI) | 1.67 [0.73, 3.81] |
| 13 Drug‐related adverse events | 0 | Peto Odds Ratio (Peto, Fixed, 95% CI) | Totals not selected | |
| 13.1 Children | 0 | Peto Odds Ratio (Peto, Fixed, 95% CI) | 0.0 [0.0, 0.0] | |
| 13.2 Adults | 0 | Peto Odds Ratio (Peto, Fixed, 95% CI) | 0.0 [0.0, 0.0] | |
| 14 HPA function data (am cortisol <5mcg/dL) | 0 | Peto Odds Ratio (Peto, Fixed, 95% CI) | Totals not selected | |
| 14.1 Children | 0 | Peto Odds Ratio (Peto, Fixed, 95% CI) | 0.0 [0.0, 0.0] | |
| 14.2 Adults | 0 | Peto Odds Ratio (Peto, Fixed, 95% CI) | 0.0 [0.0, 0.0] | |
| Outcome or subgroup title | No. of studies | No. of participants | Statistical method | Effect size |
| 1 Change from baseline in FEV1 based on study duration (litres) ‐ adults Show forest plot | 5 | 900 | Mean Difference (IV, Fixed, 95% CI) | ‐0.01 [‐0.06, 0.04] |
| 1.1 1‐4 weeks | 0 | 0 | Mean Difference (IV, Fixed, 95% CI) | 0.0 [0.0, 0.0] |
| 1.2 1‐5 months | 3 | 435 | Mean Difference (IV, Fixed, 95% CI) | ‐0.02 [‐0.09, 0.05] |
| 1.3 6 months or longer | 2 | 465 | Mean Difference (IV, Fixed, 95% CI) | 0.0 [‐0.07, 0.07] |
| 2 Change from baseline in FEV1 based on delivery devices (litres) ‐ adults Show forest plot | 5 | 900 | Mean Difference (IV, Fixed, 95% CI) | ‐0.01 [‐0.06, 0.04] |
| 2.1 MDI | 3 | 435 | Mean Difference (IV, Fixed, 95% CI) | ‐0.02 [‐0.09, 0.05] |
| 2.2 DPI | 2 | 465 | Mean Difference (IV, Fixed, 95% CI) | 0.0 [‐0.07, 0.07] |
| 3 Change from baseline in FEV1 based on degree of severity (litres) ‐ adults Show forest plot | 5 | 900 | Mean Difference (IV, Fixed, 95% CI) | ‐0.01 [‐0.06, 0.04] |
| 3.1 Mild to moderate | 1 | 38 | Mean Difference (IV, Fixed, 95% CI) | 0.1 [‐0.08, 0.28] |
| 3.2 Moderate | 3 | 575 | Mean Difference (IV, Fixed, 95% CI) | ‐0.03 [‐0.10, 0.04] |
| 3.3 Moderate to severe | 1 | 287 | Mean Difference (IV, Fixed, 95% CI) | 0.0 [‐0.09, 0.09] |
| Outcome or subgroup title | No. of studies | No. of participants | Statistical method | Effect size |
| 1 Change in FEV1 compared to baseline (litres) Show forest plot | 1 | Mean Difference (IV, Fixed, 95% CI) | Totals not selected | |
| 1.1 Children | 0 | Mean Difference (IV, Fixed, 95% CI) | 0.0 [0.0, 0.0] | |
| 1.2 Adults | 1 | Mean Difference (IV, Fixed, 95% CI) | 0.0 [0.0, 0.0] | |
| 2 FEV1 (% predicted) Show forest plot | 2 | 283 | Mean Difference (IV, Fixed, 95% CI) | ‐0.43 [‐5.72, 4.87] |
| 2.1 Children | 0 | 0 | Mean Difference (IV, Fixed, 95% CI) | 0.0 [0.0, 0.0] |
| 2.2 Adults | 2 | 283 | Mean Difference (IV, Fixed, 95% CI) | ‐0.43 [‐5.72, 4.87] |
| 3 FEV1 (Litres) Show forest plot | 1 | Mean Difference (IV, Fixed, 95% CI) | Totals not selected | |
| 3.1 Children | 0 | Mean Difference (IV, Fixed, 95% CI) | 0.0 [0.0, 0.0] | |
| 3.2 Adults | 1 | Mean Difference (IV, Fixed, 95% CI) | 0.0 [0.0, 0.0] | |
| 4 Change in FVC compared to baseline (litres) Show forest plot | 1 | Mean Difference (IV, Fixed, 95% CI) | Totals not selected | |
| 4.1 Children | 0 | Mean Difference (IV, Fixed, 95% CI) | 0.0 [0.0, 0.0] | |
| 4.2 Adults | 1 | Mean Difference (IV, Fixed, 95% CI) | 0.0 [0.0, 0.0] | |
| 5 FEF25‐75 Show forest plot | 1 | Mean Difference (IV, Fixed, 95% CI) | Totals not selected | |
| 5.1 Children | 0 | Mean Difference (IV, Fixed, 95% CI) | 0.0 [0.0, 0.0] | |
| 5.2 Adults | 1 | Mean Difference (IV, Fixed, 95% CI) | 0.0 [0.0, 0.0] | |
| 6 Change in FEF25‐75 compared to baseline (L/second) Show forest plot | 1 | Mean Difference (IV, Fixed, 95% CI) | Totals not selected | |
| 6.1 Children | 0 | Mean Difference (IV, Fixed, 95% CI) | 0.0 [0.0, 0.0] | |
| 6.2 Adults | 1 | Mean Difference (IV, Fixed, 95% CI) | 0.0 [0.0, 0.0] | |
| 7 am PEF (Litres/min) Show forest plot | 1 | Mean Difference (IV, Fixed, 95% CI) | Totals not selected | |
| 7.1 Children | 0 | Mean Difference (IV, Fixed, 95% CI) | 0.0 [0.0, 0.0] | |
| 7.2 Adults | 1 | Mean Difference (IV, Fixed, 95% CI) | 0.0 [0.0, 0.0] | |
| 8 Change in morning PEFR compared to baseline (L/min) Show forest plot | 2 | 419 | Mean Difference (IV, Fixed, 95% CI) | ‐21.86 [‐29.19, ‐14.53] |
| 8.1 Children | 0 | 0 | Mean Difference (IV, Fixed, 95% CI) | 0.0 [0.0, 0.0] |
| 8.2 Adults | 2 | 419 | Mean Difference (IV, Fixed, 95% CI) | ‐21.86 [‐29.19, ‐14.53] |
| 9 Change in evening PEFR compared to baseline (L/min) Show forest plot | 2 | 419 | Mean Difference (IV, Fixed, 95% CI) | ‐12.66 [‐19.32, ‐5.99] |
| 9.1 Children | 0 | 0 | Mean Difference (IV, Fixed, 95% CI) | 0.0 [0.0, 0.0] |
| 9.2 Adults | 2 | 419 | Mean Difference (IV, Fixed, 95% CI) | ‐12.66 [‐19.32, ‐5.99] |
| 10 Physician global rated efficacy: ineffective Show forest plot | 1 | Peto Odds Ratio (Peto, Fixed, 95% CI) | Totals not selected | |
| 10.1 Children | 0 | Peto Odds Ratio (Peto, Fixed, 95% CI) | 0.0 [0.0, 0.0] | |
| 10.2 Adults | 1 | Peto Odds Ratio (Peto, Fixed, 95% CI) | 0.0 [0.0, 0.0] | |
| 11 Symptoms Show forest plot | 1 | Mean Difference (IV, Fixed, 95% CI) | Totals not selected | |
| 11.1 Children | 0 | Mean Difference (IV, Fixed, 95% CI) | 0.0 [0.0, 0.0] | |
| 11.2 Adults | 1 | Mean Difference (IV, Fixed, 95% CI) | 0.0 [0.0, 0.0] | |
| 12 Percentage of symptom‐free days Show forest plot | 1 | Mean Difference (IV, Fixed, 95% CI) | Totals not selected | |
| 12.1 Children | 0 | Mean Difference (IV, Fixed, 95% CI) | 0.0 [0.0, 0.0] | |
| 12.2 Adults | 1 | Mean Difference (IV, Fixed, 95% CI) | 0.0 [0.0, 0.0] | |
| 13 Change in daily asthma symptom score compared to baseline Show forest plot | 1 | Std. Mean Difference (IV, Fixed, 95% CI) | Totals not selected | |
| 13.1 Children | 0 | Std. Mean Difference (IV, Fixed, 95% CI) | 0.0 [0.0, 0.0] | |
| 13.2 Adults | 1 | Std. Mean Difference (IV, Fixed, 95% CI) | 0.0 [0.0, 0.0] | |
| 14 Change in number of night‐time awakenings/week compared to baseline Show forest plot | 1 | Mean Difference (IV, Fixed, 95% CI) | Totals not selected | |
| 14.1 Children | 0 | Mean Difference (IV, Fixed, 95% CI) | 0.0 [0.0, 0.0] | |
| 14.2 Adults | 1 | Mean Difference (IV, Fixed, 95% CI) | 0.0 [0.0, 0.0] | |
| 15 Rescue medication usage Show forest plot | 1 | Mean Difference (IV, Fixed, 95% CI) | Totals not selected | |
| 15.1 Children | 0 | Mean Difference (IV, Fixed, 95% CI) | 0.0 [0.0, 0.0] | |
| 15.2 Adults | 1 | Mean Difference (IV, Fixed, 95% CI) | 0.0 [0.0, 0.0] | |
| 16 Change in daily use of beta2 agonist compared to baseline (puffs/d) Show forest plot | 1 | Mean Difference (IV, Fixed, 95% CI) | Totals not selected | |
| 16.1 Children | 0 | Mean Difference (IV, Fixed, 95% CI) | 0.0 [0.0, 0.0] | |
| 16.2 Adults | 1 | Mean Difference (IV, Fixed, 95% CI) | 0.0 [0.0, 0.0] | |
| 17 Oral Candidiasis (No. of patients) Show forest plot | 2 | 433 | Peto Odds Ratio (Peto, Fixed, 95% CI) | 0.32 [0.11, 0.97] |
| 17.1 Children | 0 | 0 | Peto Odds Ratio (Peto, Fixed, 95% CI) | 0.0 [0.0, 0.0] |
| 17.2 Adults | 2 | 433 | Peto Odds Ratio (Peto, Fixed, 95% CI) | 0.32 [0.11, 0.97] |
| 18 Hoarseness or dysphonia (No. of patients) Show forest plot | 2 | 433 | Peto Odds Ratio (Peto, Fixed, 95% CI) | 0.18 [0.05, 0.59] |
| 18.1 Children | 0 | 0 | Peto Odds Ratio (Peto, Fixed, 95% CI) | 0.0 [0.0, 0.0] |
| 18.2 Adults | 2 | 433 | Peto Odds Ratio (Peto, Fixed, 95% CI) | 0.18 [0.05, 0.59] |
| 19 Withdrawals (total) Show forest plot | 2 | 294 | Peto Odds Ratio (Peto, Fixed, 95% CI) | 5.29 [1.59, 17.60] |
| 19.1 Children | 0 | 0 | Peto Odds Ratio (Peto, Fixed, 95% CI) | 0.0 [0.0, 0.0] |
| 19.2 Adults | 2 | 294 | Peto Odds Ratio (Peto, Fixed, 95% CI) | 5.29 [1.59, 17.60] |
| 20 Number of patients withdrawn due to lack of efficacy Show forest plot | 2 | 427 | Peto Odds Ratio (Peto, Fixed, 95% CI) | 5.31 [2.18, 12.96] |
| 20.1 Children | 0 | 0 | Peto Odds Ratio (Peto, Fixed, 95% CI) | 0.0 [0.0, 0.0] |
| 20.2 Adults | 2 | 427 | Peto Odds Ratio (Peto, Fixed, 95% CI) | 5.31 [2.18, 12.96] |
| Outcome or subgroup title | No. of studies | No. of participants | Statistical method | Effect size |
| 1 Change in FEV1 compared to baseline (litres) Show forest plot | 3 | 489 | Mean Difference (IV, Fixed, 95% CI) | ‐0.11 [‐0.19, ‐0.04] |
| 1.1 Children | 0 | 0 | Mean Difference (IV, Fixed, 95% CI) | 0.0 [0.0, 0.0] |
| 1.2 Adults | 3 | 489 | Mean Difference (IV, Fixed, 95% CI) | ‐0.11 [‐0.19, ‐0.04] |
| 2 Change in FEV1 compared to baseline (%) Show forest plot | 1 | Std. Mean Difference (IV, Fixed, 95% CI) | Totals not selected | |
| 2.1 Children | 0 | Std. Mean Difference (IV, Fixed, 95% CI) | 0.0 [0.0, 0.0] | |
| 2.2 Adults | 1 | Std. Mean Difference (IV, Fixed, 95% CI) | 0.0 [0.0, 0.0] | |
| 3 Change in FEV1 % predicted Show forest plot | 1 | Mean Difference (IV, Fixed, 95% CI) | Totals not selected | |
| 3.1 Children | 0 | Mean Difference (IV, Fixed, 95% CI) | 0.0 [0.0, 0.0] | |
| 3.2 Adults | 1 | Mean Difference (IV, Fixed, 95% CI) | 0.0 [0.0, 0.0] | |
| 4 FEV1 (% predicted) Show forest plot | 1 | Mean Difference (IV, Fixed, 95% CI) | Totals not selected | |
| 4.1 Children | 0 | Mean Difference (IV, Fixed, 95% CI) | 0.0 [0.0, 0.0] | |
| 4.2 Adults | 1 | Mean Difference (IV, Fixed, 95% CI) | 0.0 [0.0, 0.0] | |
| 5 Change in morning PEFR compared to baseline (L/min) Show forest plot | 4 | 763 | Mean Difference (IV, Random, 95% CI) | ‐8.32 [‐18.02, 1.37] |
| 5.1 Children | 0 | 0 | Mean Difference (IV, Random, 95% CI) | 0.0 [0.0, 0.0] |
| 5.2 Adults | 4 | 763 | Mean Difference (IV, Random, 95% CI) | ‐8.32 [‐18.02, 1.37] |
| 6 Change in evening PEFR compared to baseline (L/min) Show forest plot | 2 | 424 | Mean Difference (IV, Fixed, 95% CI) | ‐7.81 [‐14.66, ‐0.95] |
| 6.1 Children | 0 | 0 | Mean Difference (IV, Fixed, 95% CI) | 0.0 [0.0, 0.0] |
| 6.2 Adults | 2 | 424 | Mean Difference (IV, Fixed, 95% CI) | ‐7.81 [‐14.66, ‐0.95] |
| 7 Change in FVC compared to baseline (litres) Show forest plot | 1 | Mean Difference (IV, Fixed, 95% CI) | Totals not selected | |
| 7.1 Children | 0 | Mean Difference (IV, Fixed, 95% CI) | 0.0 [0.0, 0.0] | |
| 7.2 Adults | 1 | Mean Difference (IV, Fixed, 95% CI) | 0.0 [0.0, 0.0] | |
| 8 Change in FEF25‐75 compared to baseline (L/second) Show forest plot | 1 | Mean Difference (IV, Fixed, 95% CI) | Totals not selected | |
| 8.1 Children | 0 | Mean Difference (IV, Fixed, 95% CI) | 0.0 [0.0, 0.0] | |
| 8.2 Adults | 1 | Mean Difference (IV, Fixed, 95% CI) | 0.0 [0.0, 0.0] | |
| 9 PD20 Show forest plot | 1 | Mean Difference (IV, Fixed, 95% CI) | Totals not selected | |
| 9.1 Children | 0 | Mean Difference (IV, Fixed, 95% CI) | 0.0 [0.0, 0.0] | |
| 9.2 Adults | 1 | Mean Difference (IV, Fixed, 95% CI) | 0.0 [0.0, 0.0] | |
| 10 Change in daily asthma symptom score compared to baseline Show forest plot | 2 | 291 | Std. Mean Difference (IV, Fixed, 95% CI) | 0.06 [‐0.17, 0.29] |
| 10.1 Children | 0 | 0 | Std. Mean Difference (IV, Fixed, 95% CI) | 0.0 [0.0, 0.0] |
| 10.2 Adults | 2 | 291 | Std. Mean Difference (IV, Fixed, 95% CI) | 0.06 [‐0.17, 0.29] |
| 11 Change in number of night‐time awakenings/week compared to baseline Show forest plot | 1 | Mean Difference (IV, Fixed, 95% CI) | Totals not selected | |
| 11.1 Children | 0 | Mean Difference (IV, Fixed, 95% CI) | 0.0 [0.0, 0.0] | |
| 11.2 Adults | 1 | Mean Difference (IV, Fixed, 95% CI) | 0.0 [0.0, 0.0] | |
| 12 Physician global rated efficacy: ineffective Show forest plot | 2 | 400 | Peto Odds Ratio (Peto, Fixed, 95% CI) | 1.34 [0.85, 2.12] |
| 12.1 Children | 0 | 0 | Peto Odds Ratio (Peto, Fixed, 95% CI) | 0.0 [0.0, 0.0] |
| 12.2 Adults | 2 | 400 | Peto Odds Ratio (Peto, Fixed, 95% CI) | 1.34 [0.85, 2.12] |
| 13 Change in daily use of beta2 agonist compared to baseline (puffs/d) Show forest plot | 2 | 291 | Mean Difference (IV, Fixed, 95% CI) | 0.11 [‐0.29, 0.50] |
| 13.1 Children | 0 | 0 | Mean Difference (IV, Fixed, 95% CI) | 0.0 [0.0, 0.0] |
| 13.2 Adults | 2 | 291 | Mean Difference (IV, Fixed, 95% CI) | 0.11 [‐0.29, 0.50] |
| 14 Number of patients withdrawn due to lack of efficacy Show forest plot | 4 | 554 | Peto Odds Ratio (Peto, Fixed, 95% CI) | 1.32 [0.73, 2.40] |
| 14.1 Children | 0 | 0 | Peto Odds Ratio (Peto, Fixed, 95% CI) | 0.0 [0.0, 0.0] |
| 14.2 Adults | 4 | 554 | Peto Odds Ratio (Peto, Fixed, 95% CI) | 1.32 [0.73, 2.40] |
| 15 Oral Candidiasis (No. of patients) Show forest plot | 5 | 618 | Peto Odds Ratio (Peto, Fixed, 95% CI) | 0.33 [0.16, 0.70] |
| 15.1 Children | 0 | 0 | Peto Odds Ratio (Peto, Fixed, 95% CI) | 0.0 [0.0, 0.0] |
| 15.2 Adults | 5 | 618 | Peto Odds Ratio (Peto, Fixed, 95% CI) | 0.33 [0.16, 0.70] |
| 16 Sore throat or pharyngitis (No. of patients) Show forest plot | 4 | 452 | Peto Odds Ratio (Peto, Fixed, 95% CI) | 0.49 [0.18, 1.39] |
| 16.1 Children | 0 | 0 | Peto Odds Ratio (Peto, Fixed, 95% CI) | 0.0 [0.0, 0.0] |
| 16.2 Adults | 4 | 452 | Peto Odds Ratio (Peto, Fixed, 95% CI) | 0.49 [0.18, 1.39] |
| 17 Hoarseness or dysphonia (No. of patients) Show forest plot | 4 | 561 | Peto Odds Ratio (Peto, Fixed, 95% CI) | 0.51 [0.24, 1.08] |
| 17.1 Children | 0 | 0 | Peto Odds Ratio (Peto, Fixed, 95% CI) | 0.0 [0.0, 0.0] |
| 17.2 Adults | 4 | 561 | Peto Odds Ratio (Peto, Fixed, 95% CI) | 0.51 [0.24, 1.08] |
| 18 Change in peak plasma cortisol compared to baseline (mcg/dL) Show forest plot | 1 | Mean Difference (IV, Fixed, 95% CI) | Totals not selected | |
| 18.1 Children | 0 | Mean Difference (IV, Fixed, 95% CI) | 0.0 [0.0, 0.0] | |
| 18.2 Adults | 1 | Mean Difference (IV, Fixed, 95% CI) | 0.0 [0.0, 0.0] | |
| 19 Change in morning plasma cortisol compared to baseline (mcg/dL) Show forest plot | 1 | Mean Difference (IV, Fixed, 95% CI) | Totals not selected | |
| 19.1 Children | 0 | Mean Difference (IV, Fixed, 95% CI) | 0.0 [0.0, 0.0] | |
| 19.2 Adults | 1 | Mean Difference (IV, Fixed, 95% CI) | 0.0 [0.0, 0.0] | |
| Outcome or subgroup title | No. of studies | No. of participants | Statistical method | Effect size |
| 1 Change in FEV1 compared to baseline based on study duration (litres) ‐ adults Show forest plot | 3 | 489 | Mean Difference (IV, Fixed, 95% CI) | ‐0.11 [‐0.19, ‐0.04] |
| 1.1 1‐4 weeks | 0 | 0 | Mean Difference (IV, Fixed, 95% CI) | 0.0 [0.0, 0.0] |
| 1.2 1‐5 months | 3 | 489 | Mean Difference (IV, Fixed, 95% CI) | ‐0.11 [‐0.19, ‐0.04] |
| 1.3 6 months or longer | 0 | 0 | Mean Difference (IV, Fixed, 95% CI) | 0.0 [0.0, 0.0] |
| 2 Change in FEV1 compared to baseline based on delivery devices (litres) ‐ adults Show forest plot | 3 | 489 | Mean Difference (IV, Fixed, 95% CI) | ‐0.11 [‐0.19, ‐0.04] |
| 2.1 MDI | 2 | 357 | Mean Difference (IV, Fixed, 95% CI) | ‐0.10 [‐0.19, ‐0.02] |
| 2.2 DPI | 1 | 132 | Mean Difference (IV, Fixed, 95% CI) | ‐0.15 [‐0.32, 0.02] |
| 3 Change in FEV1 compared to baseline based on degrees of severity (litres) ‐ adults Show forest plot | 3 | 489 | Mean Difference (IV, Fixed, 95% CI) | ‐0.11 [‐0.19, ‐0.04] |
| 3.1 Mild to moderate | 1 | 159 | Mean Difference (IV, Fixed, 95% CI) | ‐0.12 [‐0.26, 0.02] |
| 3.2 Moderate | 2 | 330 | Mean Difference (IV, Fixed, 95% CI) | ‐0.11 [‐0.20, ‐0.02] |
| Outcome or subgroup title | No. of studies | No. of participants | Statistical method | Effect size |
| 1 FEV1 (Change from baseline ‐ litres) Show forest plot | 1 | Mean Difference (IV, Fixed, 95% CI) | Totals not selected | |
| 1.1 Children | 0 | Mean Difference (IV, Fixed, 95% CI) | 0.0 [0.0, 0.0] | |
| 1.2 Adults | 1 | Mean Difference (IV, Fixed, 95% CI) | 0.0 [0.0, 0.0] | |
| 2 Clinic PEF (L/min ‐ change from baseline) Show forest plot | 1 | Mean Difference (IV, Fixed, 95% CI) | Totals not selected | |
| 2.1 Children | 0 | Mean Difference (IV, Fixed, 95% CI) | 0.0 [0.0, 0.0] | |
| 2.2 Adults | 1 | Mean Difference (IV, Fixed, 95% CI) | 0.0 [0.0, 0.0] | |
| 3 PC20 (methacholine) Show forest plot | 1 | Mean Difference (IV, Fixed, 95% CI) | Totals not selected | |
| 3.1 Children | 0 | Mean Difference (IV, Fixed, 95% CI) | 0.0 [0.0, 0.0] | |
| 3.2 Adults | 1 | Mean Difference (IV, Fixed, 95% CI) | 0.0 [0.0, 0.0] | |
| 4 PC20 AMP Show forest plot | 1 | Mean Difference (IV, Fixed, 95% CI) | Totals not selected | |
| 4.1 Children | 0 | Mean Difference (IV, Fixed, 95% CI) | 0.0 [0.0, 0.0] | |
| 4.2 Adults | 1 | Mean Difference (IV, Fixed, 95% CI) | 0.0 [0.0, 0.0] | |
| 5 Symptoms (change from baseline) Show forest plot | 1 | Mean Difference (IV, Fixed, 95% CI) | Totals not selected | |
| 5.1 Children | 0 | Mean Difference (IV, Fixed, 95% CI) | 0.0 [0.0, 0.0] | |
| 5.2 Adults | 1 | Mean Difference (IV, Fixed, 95% CI) | 0.0 [0.0, 0.0] | |
| Outcome or subgroup title | No. of studies | No. of participants | Statistical method | Effect size |
| 1 Change in daily dose of oral prednisolone compared to baseline (mg) Show forest plot | 4 | 274 | Mean Difference (IV, Fixed, 95% CI) | 1.00 [‐0.45, 2.45] |
| 2 Number of patients unable to discontinue OCS completely Show forest plot | 4 | 274 | Peto Odds Ratio (Peto, Fixed, 95% CI) | 1.53 [0.88, 2.68] |
| 3 Change in FEV1 compared to baseline (litres) Show forest plot | 4 | 274 | Mean Difference (IV, Fixed, 95% CI) | ‐0.13 [‐0.24, ‐0.01] |
| 4 Change in morning PEFR compared to baseline (L/min) Show forest plot | 4 | 274 | Mean Difference (IV, Fixed, 95% CI) | ‐19.63 [‐34.98, ‐4.27] |
| 5 Change in evening PEFR compared to baseline (L/min) Show forest plot | 4 | 274 | Mean Difference (IV, Fixed, 95% CI) | ‐21.58 [‐35.20, ‐7.97] |
| 6 Change in daily asthma symptom score compared to baseline Show forest plot | 4 | 274 | Std. Mean Difference (IV, Fixed, 95% CI) | 0.15 [‐0.09, 0.39] |
| 7 Change in rescue beta2 agonist use compared to baseline (puffs/d) Show forest plot | 4 | 274 | Mean Difference (IV, Fixed, 95% CI) | ‐0.14 [‐1.05, 0.78] |
| 8 Asthma Quality of Life Questionnaire: change in overall score compared to baseline Show forest plot | 3 | 187 | Mean Difference (IV, Fixed, 95% CI) | ‐0.12 [‐0.48, 0.23] |
| 9 Asthma Quality of Life Questionnaire: change in activity limitation domain compared to baseline Show forest plot | 1 | Mean Difference (IV, Fixed, 95% CI) | Totals not selected | |
| 10 Asthma Quality of Life Questionnaire: change in symptom domain compared to baseline Show forest plot | 1 | Mean Difference (IV, Fixed, 95% CI) | Totals not selected | |
| 11 Asthma Quality of Life Questionnaire: change in emotional function domain compared to baseline Show forest plot | 1 | Mean Difference (IV, Fixed, 95% CI) | Totals not selected | |
| 12 Asthma Quality of Life Questionnaire: change in environmental exposure domain compared to baseline Show forest plot | 1 | Mean Difference (IV, Fixed, 95% CI) | Totals not selected | |
| 13 Sore throat (No. of patients) Show forest plot | 2 | 141 | Peto Odds Ratio (Peto, Fixed, 95% CI) | 0.70 [0.15, 3.18] |
| 14 Hoarseness/dysphonia (No. of patients) Show forest plot | 2 | 141 | Peto Odds Ratio (Peto, Fixed, 95% CI) | 0.92 [0.28, 2.99] |
| 15 Oral Candidiasis (No. of patients) Show forest plot | 2 | 141 | Peto Odds Ratio (Peto, Fixed, 95% CI) | 0.96 [0.41, 2.24] |
| Outcome or subgroup title | No. of studies | No. of participants | Statistical method | Effect size |
| 1 FEV1 Show forest plot | 1 | Litres (Fixed, 95% CI) | Totals not selected | |
| 2 PEF Show forest plot | 1 | Litres/min (Fixed, 95% CI) | Totals not selected | |