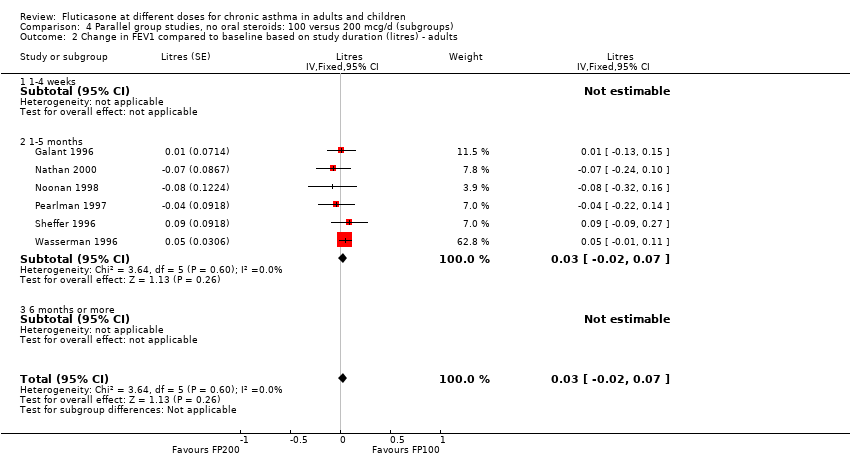
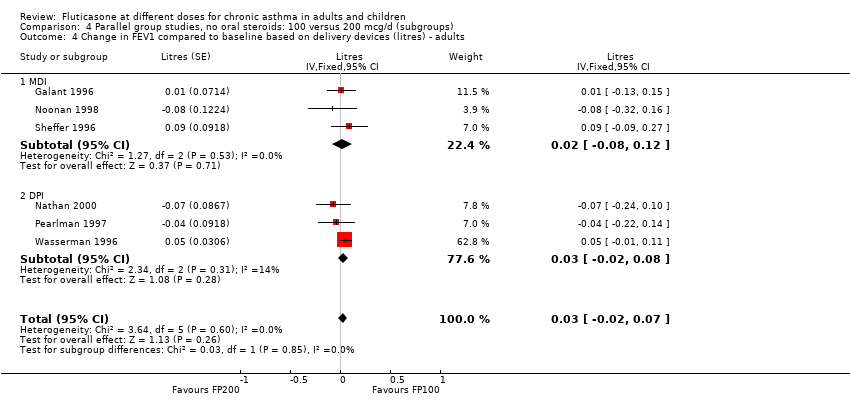
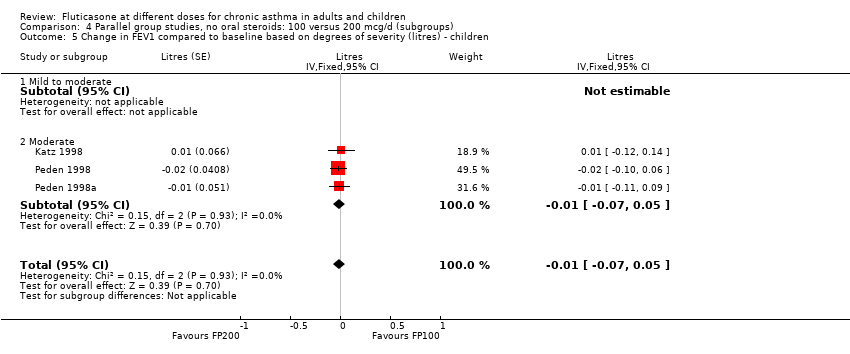
| 1 Change in FEV1 compared to baseline (litres) Show forest plot | 10 | | Litres (Fixed, 95% CI) | Subtotals only |
|
| 1.1 Children | 4 | 656 | Litres (Fixed, 95% CI) | ‐0.04 [‐0.09, 0.01] |
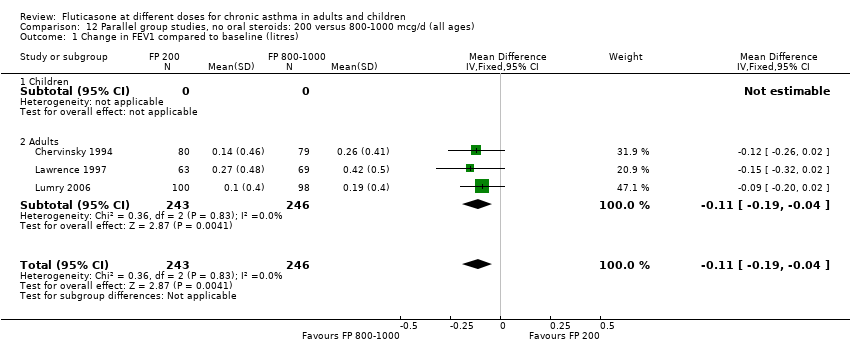
| 1.2 Adults | 6 | 887 | Litres (Fixed, 95% CI) | 0.03 [‐0.02, 0.07] |
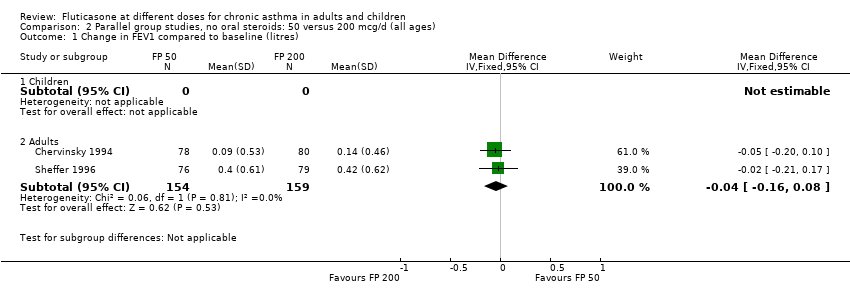
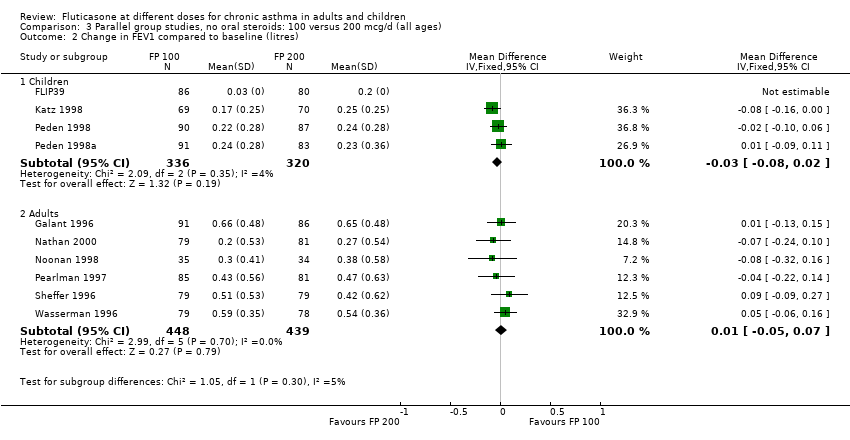
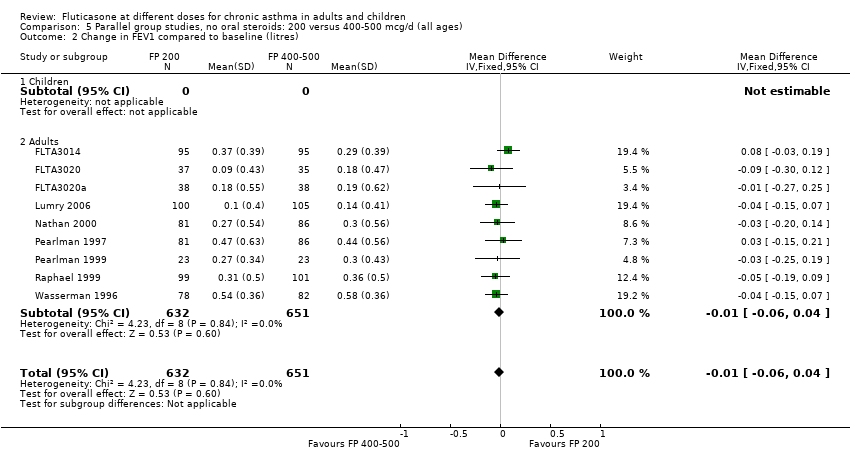
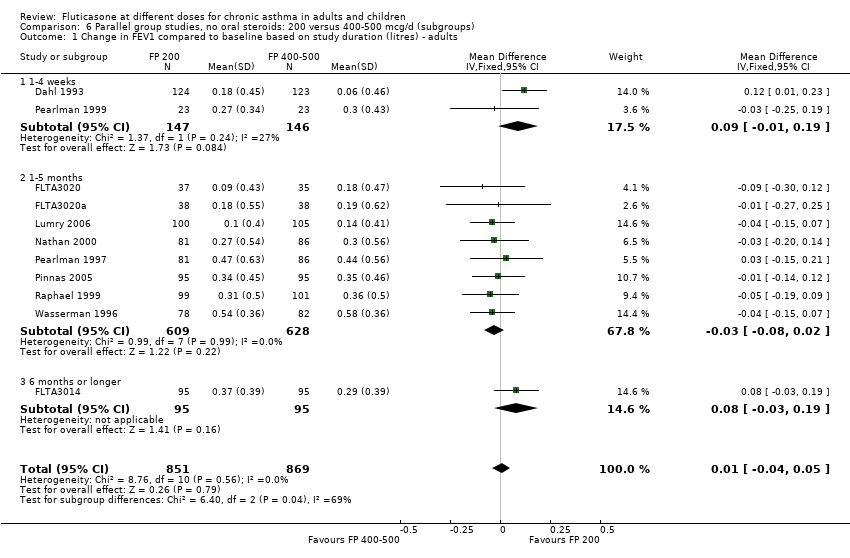
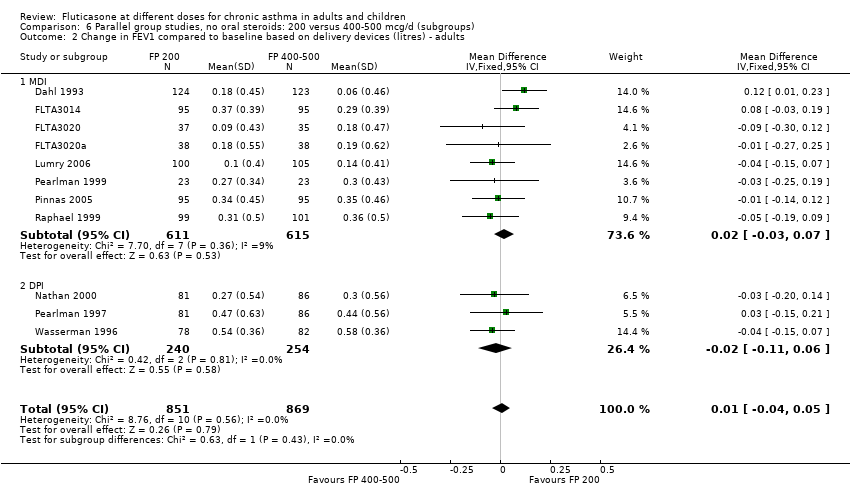
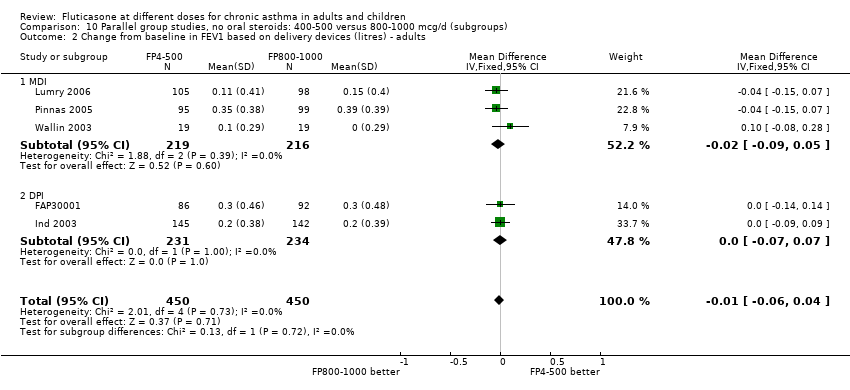
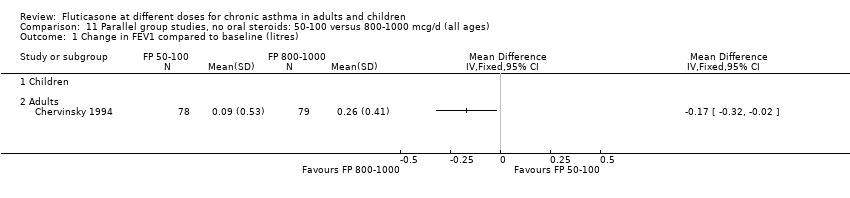
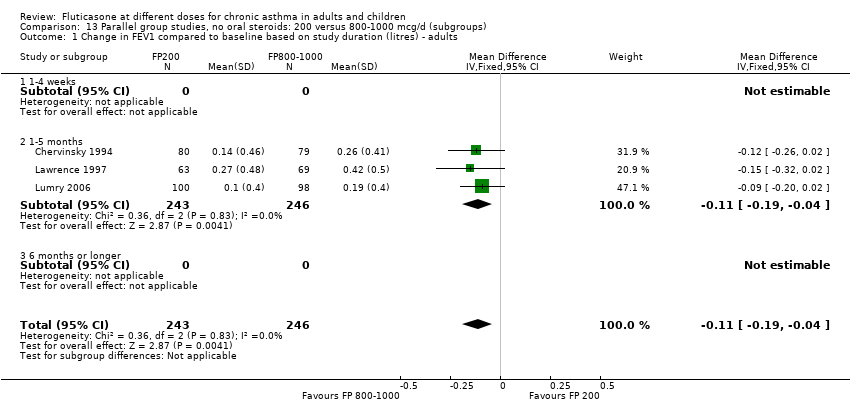
| 2 Change in FEV1 compared to baseline (litres) Show forest plot | 10 | | Mean Difference (IV, Fixed, 95% CI) | Subtotals only |
|
| 2.1 Children | 4 | 656 | Mean Difference (IV, Fixed, 95% CI) | ‐0.03 [‐0.08, 0.02] |
| 2.2 Adults | 6 | 887 | Mean Difference (IV, Fixed, 95% CI) | 0.01 [‐0.05, 0.07] |
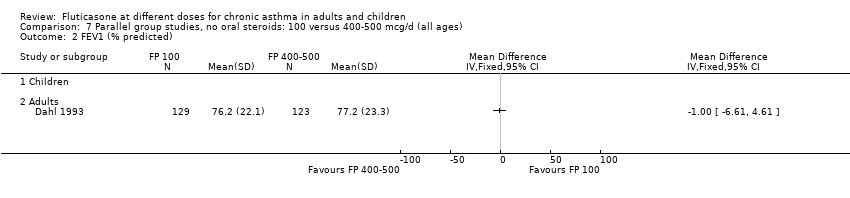
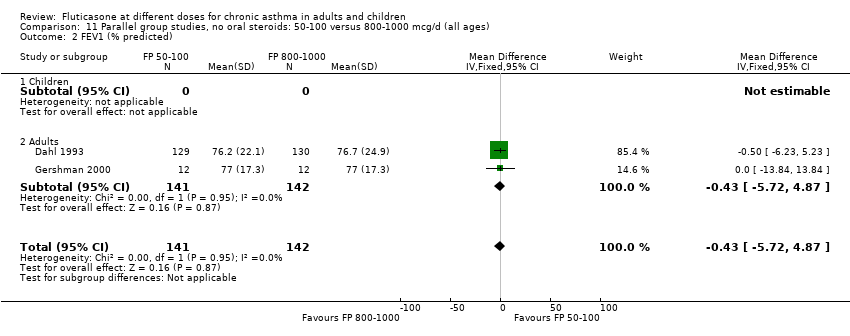
| 3 FEV1 (% predicted) Show forest plot | 2 | | Mean Difference (IV, Fixed, 95% CI) | Totals not selected |
|
| 3.1 Children | 1 | | Mean Difference (IV, Fixed, 95% CI) | 0.0 [0.0, 0.0] |
| 3.2 Adults | 1 | | Mean Difference (IV, Fixed, 95% CI) | 0.0 [0.0, 0.0] |
| 4 FEV1 (% predicted) Show forest plot | 2 | 432 | % (Fixed, 95% CI) | ‐0.52 [‐3.83, 2.79] |
|
| 4.1 Children | 1 | 179 | % (Fixed, 95% CI) | ‐2.0 [‐6.00, 2.00] |
| 4.2 Adults | 1 | 253 | % (Fixed, 95% CI) | 2.70 [‐3.19, 8.59] |
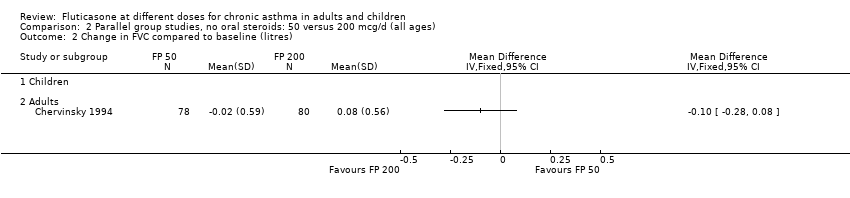
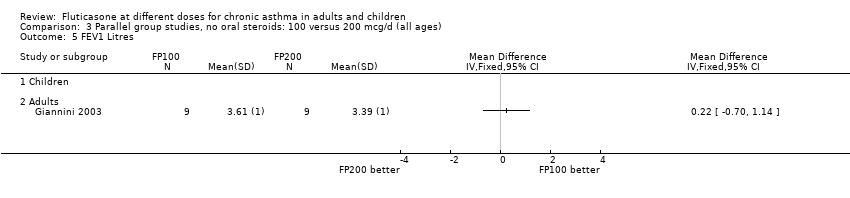
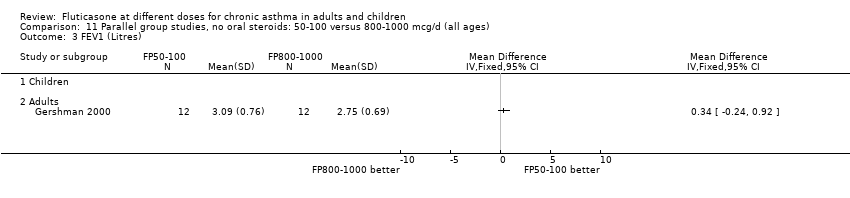
| 5 FEV1 Litres Show forest plot | 1 | | Mean Difference (IV, Fixed, 95% CI) | Totals not selected |
|
| 5.1 Children | 0 | | Mean Difference (IV, Fixed, 95% CI) | 0.0 [0.0, 0.0] |
| 5.2 Adults | 1 | | Mean Difference (IV, Fixed, 95% CI) | 0.0 [0.0, 0.0] |
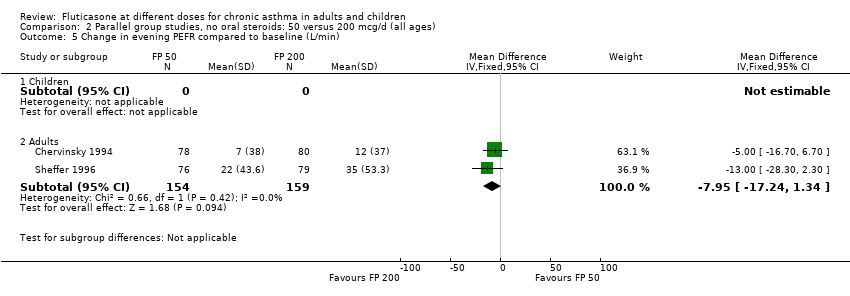
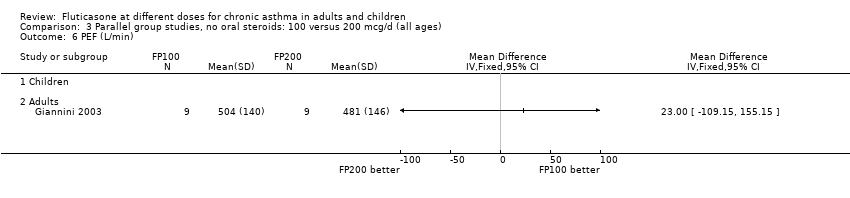
| 6 PEF (L/min) Show forest plot | 1 | | Mean Difference (IV, Fixed, 95% CI) | Totals not selected |
|
| 6.1 Children | 0 | | Mean Difference (IV, Fixed, 95% CI) | 0.0 [0.0, 0.0] |
| 6.2 Adults | 1 | | Mean Difference (IV, Fixed, 95% CI) | 0.0 [0.0, 0.0] |
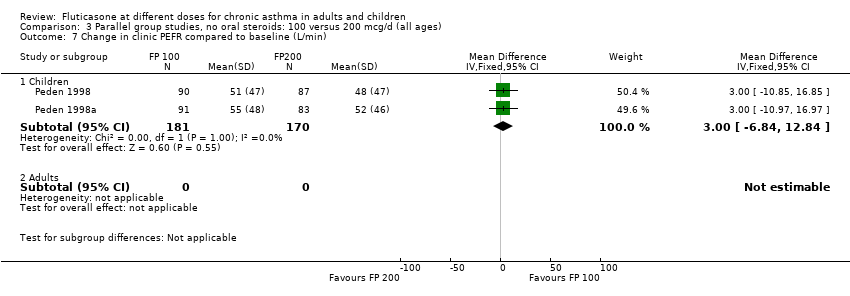
| 7 Change in clinic PEFR compared to baseline (L/min) Show forest plot | 2 | | Mean Difference (IV, Fixed, 95% CI) | Subtotals only |
|
| 7.1 Children | 2 | 351 | Mean Difference (IV, Fixed, 95% CI) | 3.00 [‐6.84, 12.84] |
| 7.2 Adults | 0 | 0 | Mean Difference (IV, Fixed, 95% CI) | 0.0 [0.0, 0.0] |
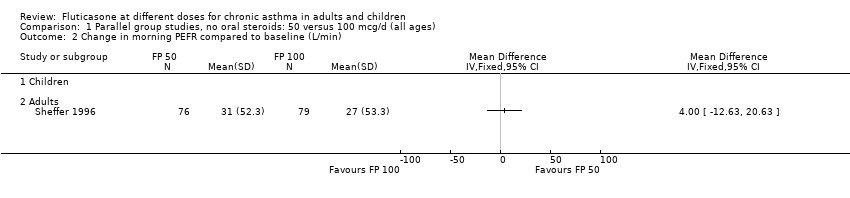
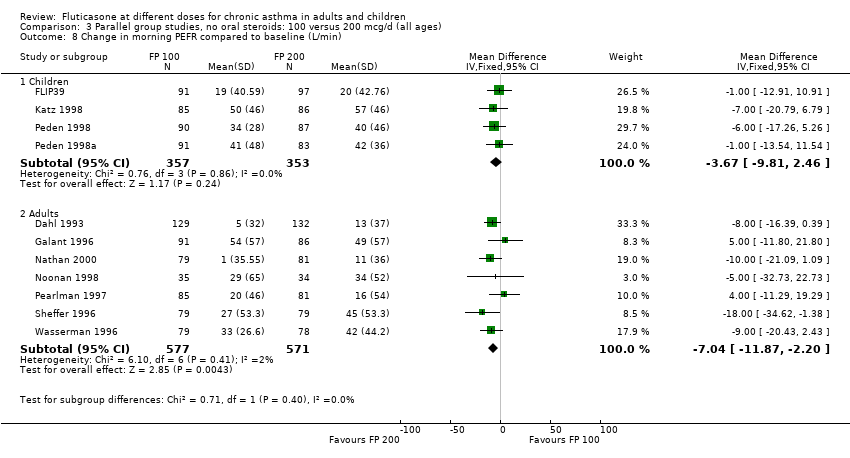
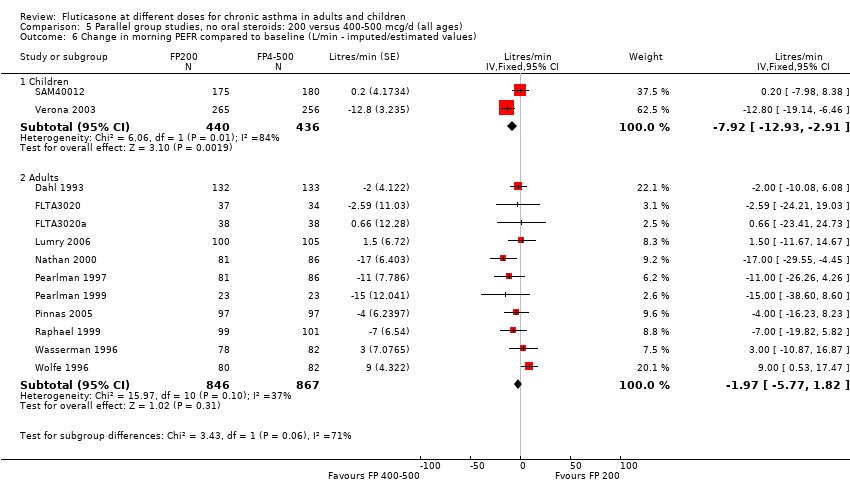
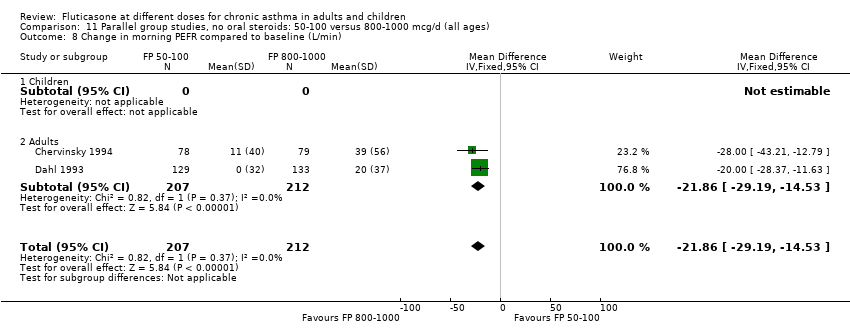
| 8 Change in morning PEFR compared to baseline (L/min) Show forest plot | 11 | | Mean Difference (IV, Fixed, 95% CI) | Subtotals only |
|
| 8.1 Children | 4 | 710 | Mean Difference (IV, Fixed, 95% CI) | ‐3.67 [‐9.81, 2.46] |
| 8.2 Adults | 7 | 1148 | Mean Difference (IV, Fixed, 95% CI) | ‐7.04 [‐11.87, ‐2.20] |
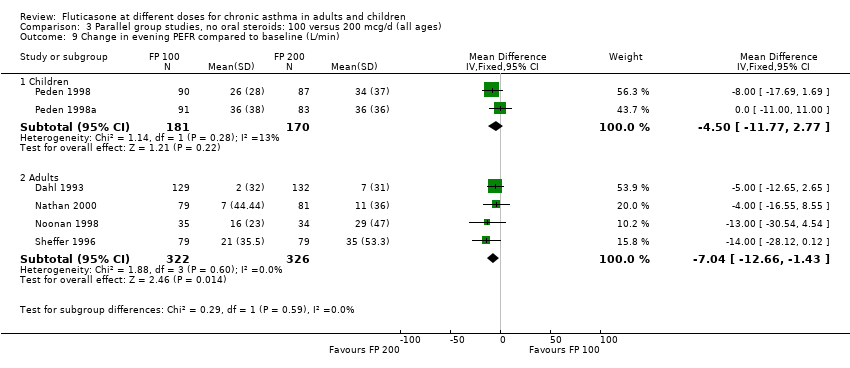
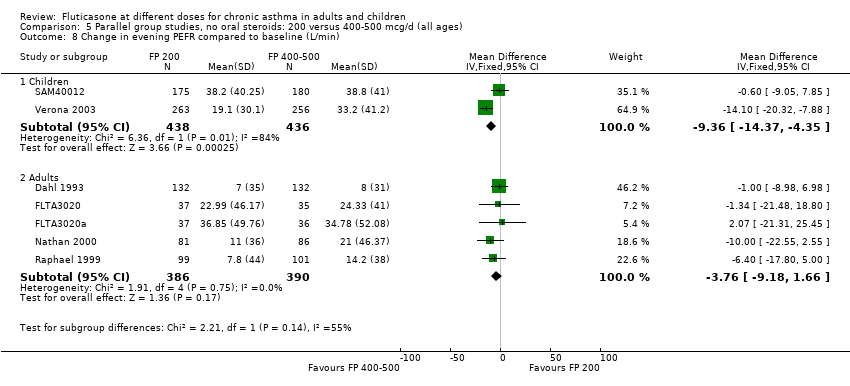
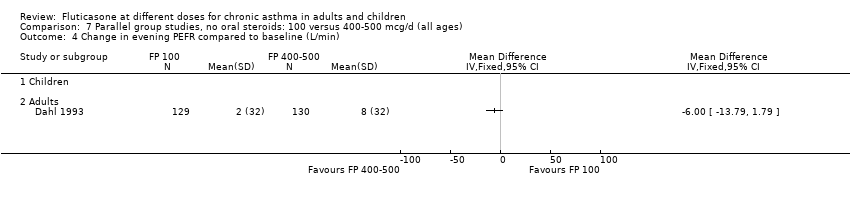
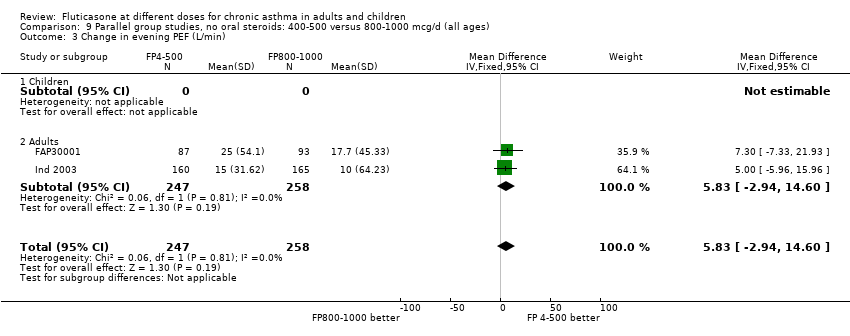
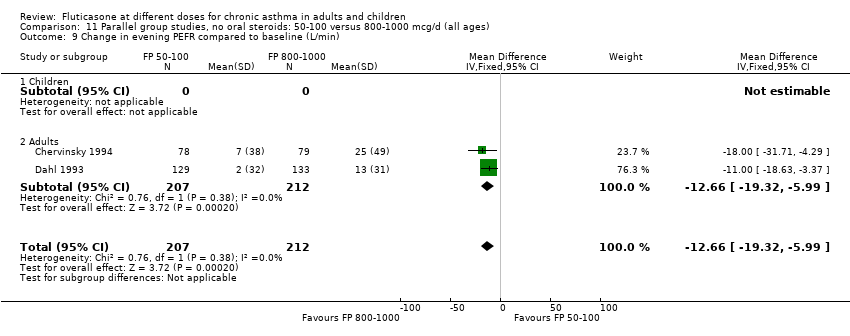
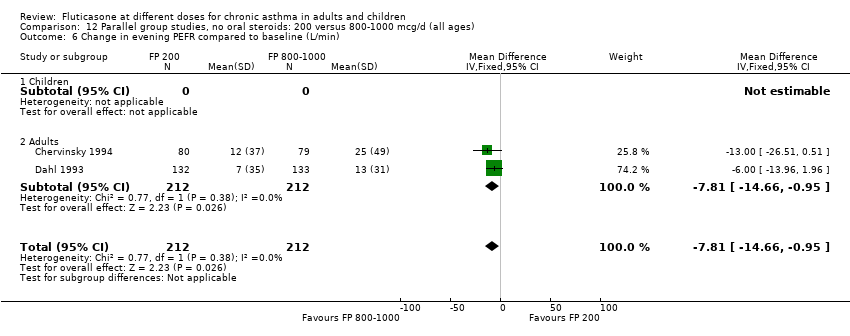
| 9 Change in evening PEFR compared to baseline (L/min) Show forest plot | 6 | | Mean Difference (IV, Fixed, 95% CI) | Subtotals only |
|
| 9.1 Children | 2 | 351 | Mean Difference (IV, Fixed, 95% CI) | ‐4.50 [‐11.77, 2.77] |
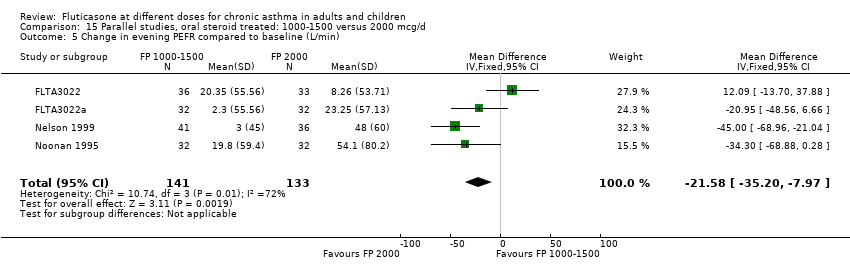
| 9.2 Adults | 4 | 648 | Mean Difference (IV, Fixed, 95% CI) | ‐7.04 [‐12.66, ‐1.43] |
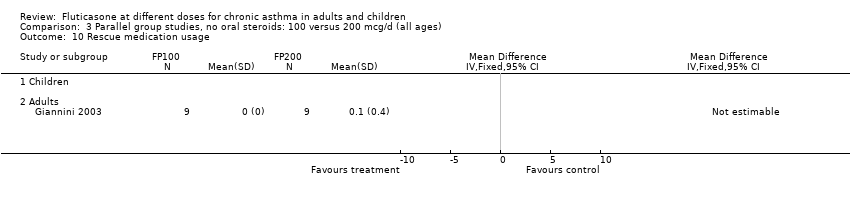
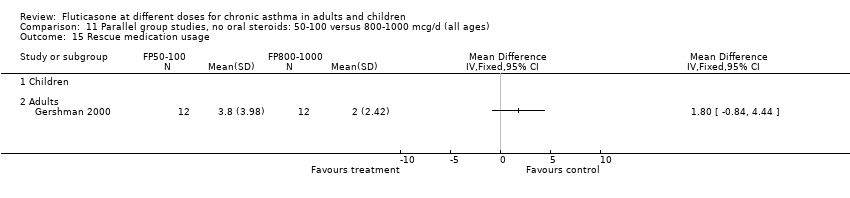
| 10 Rescue medication usage Show forest plot | 1 | | Mean Difference (IV, Fixed, 95% CI) | Totals not selected |
|
| 10.1 Children | 0 | | Mean Difference (IV, Fixed, 95% CI) | 0.0 [0.0, 0.0] |
| 10.2 Adults | 1 | | Mean Difference (IV, Fixed, 95% CI) | 0.0 [0.0, 0.0] |
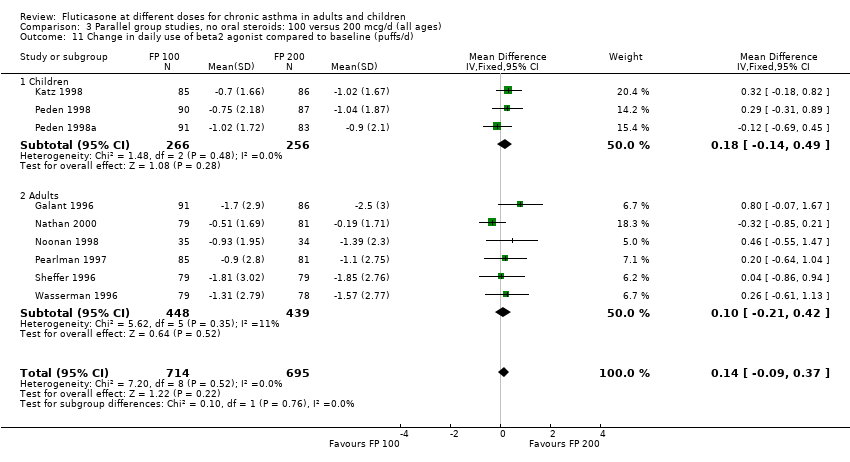
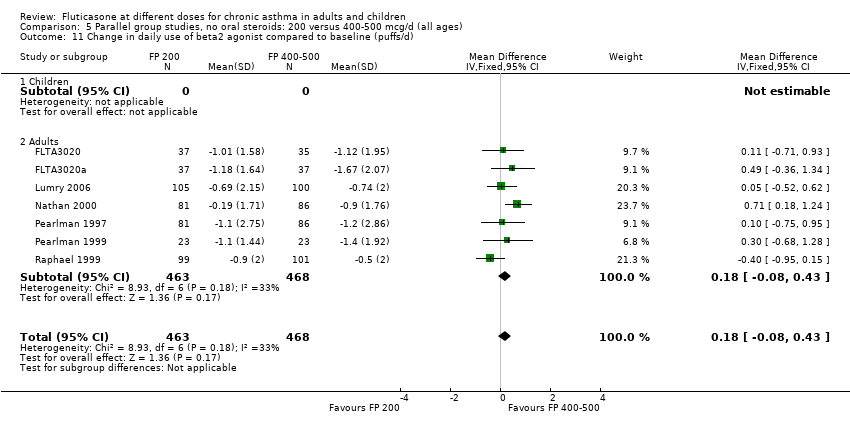
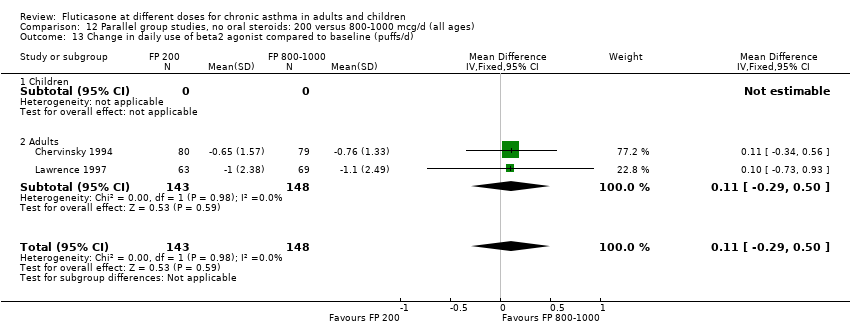
| 11 Change in daily use of beta2 agonist compared to baseline (puffs/d) Show forest plot | 9 | 1409 | Mean Difference (IV, Fixed, 95% CI) | 0.14 [‐0.09, 0.37] |
|
| 11.1 Children | 3 | 522 | Mean Difference (IV, Fixed, 95% CI) | 0.18 [‐0.14, 0.49] |
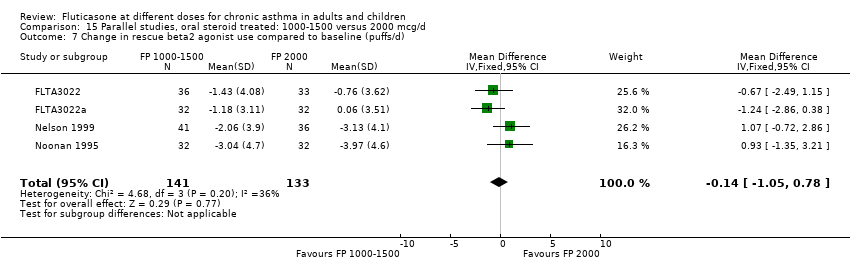
| 11.2 Adults | 6 | 887 | Mean Difference (IV, Fixed, 95% CI) | 0.10 [‐0.21, 0.42] |
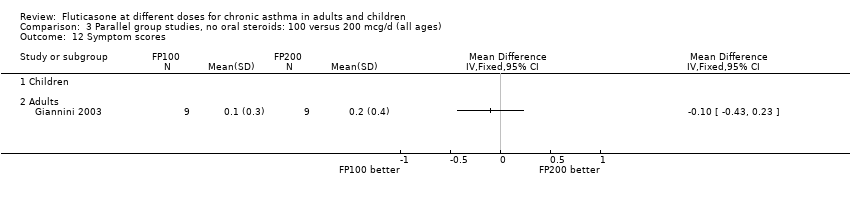
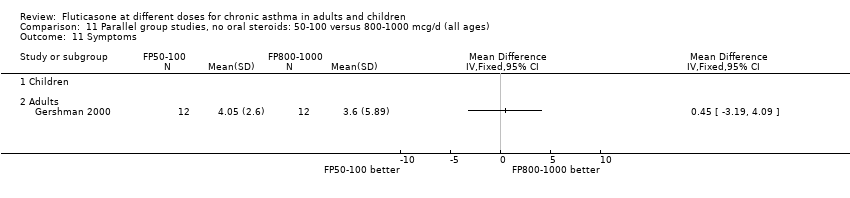
| 12 Symptom scores Show forest plot | 1 | | Mean Difference (IV, Fixed, 95% CI) | Totals not selected |
|
| 12.1 Children | 0 | | Mean Difference (IV, Fixed, 95% CI) | 0.0 [0.0, 0.0] |
| 12.2 Adults | 1 | | Mean Difference (IV, Fixed, 95% CI) | 0.0 [0.0, 0.0] |
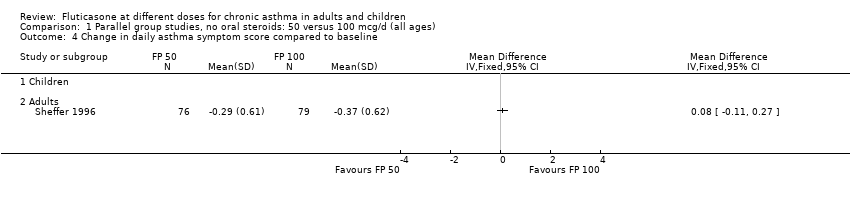
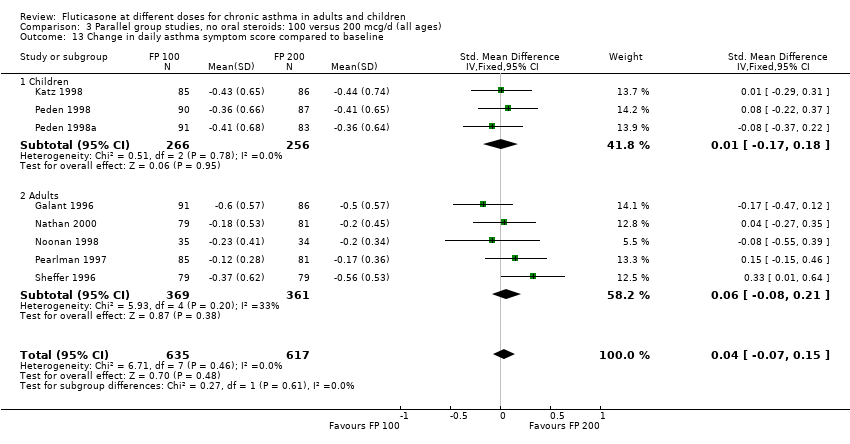
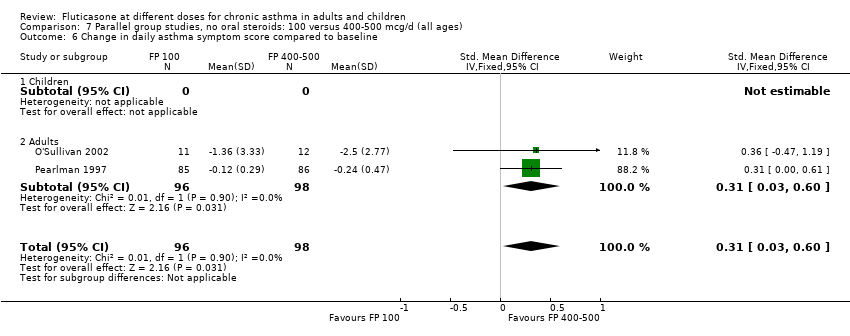
| 13 Change in daily asthma symptom score compared to baseline Show forest plot | 8 | 1252 | Std. Mean Difference (IV, Fixed, 95% CI) | 0.04 [‐0.07, 0.15] |
|
| 13.1 Children | 3 | 522 | Std. Mean Difference (IV, Fixed, 95% CI) | 0.01 [‐0.17, 0.18] |
| 13.2 Adults | 5 | 730 | Std. Mean Difference (IV, Fixed, 95% CI) | 0.06 [‐0.08, 0.21] |
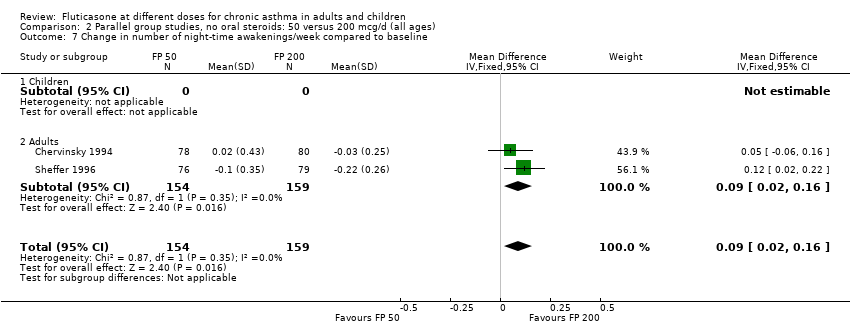
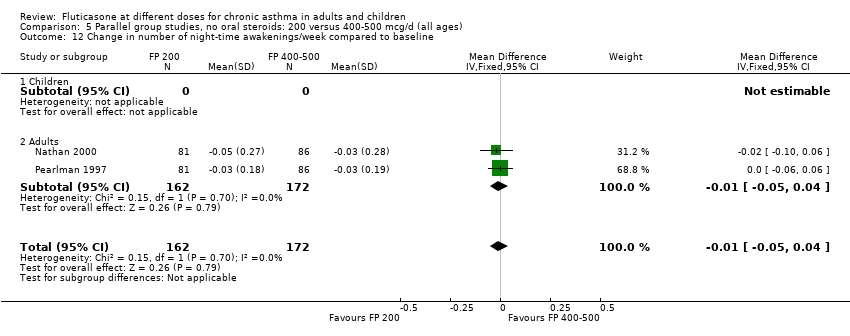
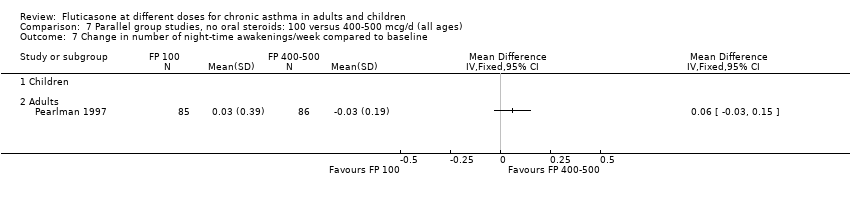
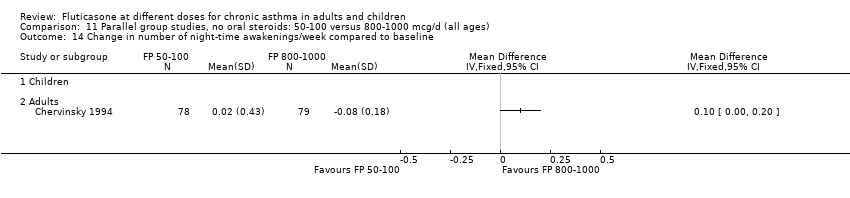
| 14 Change in number of night‐time awakenings/week compared to baseline Show forest plot | 4 | 661 | Mean Difference (IV, Fixed, 95% CI) | 0.05 [0.01, 0.09] |
|
| 14.1 Children | 0 | 0 | Mean Difference (IV, Fixed, 95% CI) | 0.0 [0.0, 0.0] |
| 14.2 Adults | 4 | 661 | Mean Difference (IV, Fixed, 95% CI) | 0.05 [0.01, 0.09] |
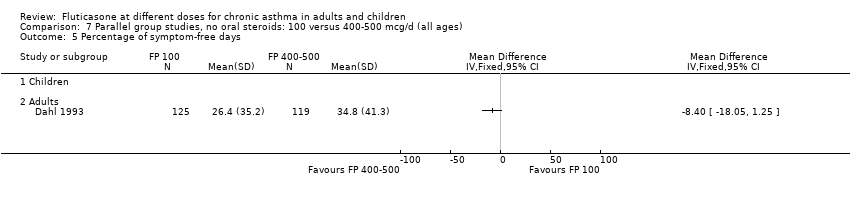
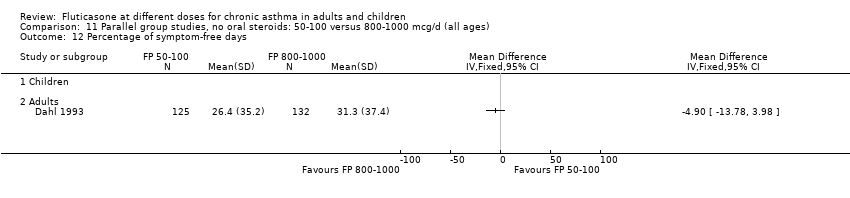
| 15 Percentage of symptom‐free days Show forest plot | 1 | | Mean Difference (IV, Fixed, 95% CI) | Totals not selected |
|
| 15.1 Children | 0 | | Mean Difference (IV, Fixed, 95% CI) | 0.0 [0.0, 0.0] |
| 15.2 Adults | 1 | | Mean Difference (IV, Fixed, 95% CI) | 0.0 [0.0, 0.0] |
| 16 Change in night‐time awakening score compared to baseline Show forest plot | 6 | 921 | Std. Mean Difference (IV, Fixed, 95% CI) | 0.17 [0.04, 0.30] |
|
| 16.1 Children | 2 | 351 | Std. Mean Difference (IV, Fixed, 95% CI) | 0.17 [‐0.04, 0.38] |
| 16.2 Adults | 4 | 570 | Std. Mean Difference (IV, Fixed, 95% CI) | 0.17 [0.01, 0.34] |
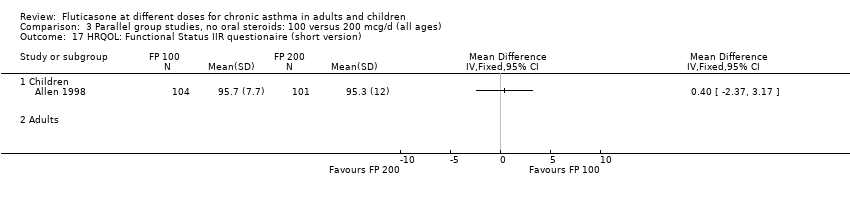
| 17 HRQOL: Functional Status IIR questionaire (short version) Show forest plot | 1 | | Mean Difference (IV, Fixed, 95% CI) | Totals not selected |
|
| 17.1 Children | 1 | | Mean Difference (IV, Fixed, 95% CI) | 0.0 [0.0, 0.0] |
| 17.2 Adults | 0 | | Mean Difference (IV, Fixed, 95% CI) | 0.0 [0.0, 0.0] |
| 18 HRQOL: Sleep Scale Children questionnaire Show forest plot | 1 | | Mean Difference (IV, Fixed, 95% CI) | Totals not selected |
|
| 18.1 Children | 1 | | Mean Difference (IV, Fixed, 95% CI) | 0.0 [0.0, 0.0] |
| 18.2 Adults | 0 | | Mean Difference (IV, Fixed, 95% CI) | 0.0 [0.0, 0.0] |
| 19 HRQOL: Quality of Life of Parents of Asthmatic Children questionnaire, burden dimension Show forest plot | 1 | | Mean Difference (IV, Fixed, 95% CI) | Totals not selected |
|
| 19.1 Children | 1 | | Mean Difference (IV, Fixed, 95% CI) | 0.0 [0.0, 0.0] |
| 19.2 Adults | 0 | | Mean Difference (IV, Fixed, 95% CI) | 0.0 [0.0, 0.0] |
| 20 HRQOL: Quality of Life of Parents of Asthmatic Children questionnaire, subjective norms dimension Show forest plot | 1 | | Mean Difference (IV, Fixed, 95% CI) | Totals not selected |
|
| 20.1 Children | 1 | | Mean Difference (IV, Fixed, 95% CI) | 0.0 [0.0, 0.0] |
| 20.2 Adults | 0 | | Mean Difference (IV, Fixed, 95% CI) | 0.0 [0.0, 0.0] |
| 21 HRQOL: Quality of Life of Parents of Asthmatic Children questionnaire, subjective norms dimension Show forest plot | 1 | | Mean Difference (IV, Fixed, 95% CI) | Totals not selected |
|
| 21.1 Children | 1 | | Mean Difference (IV, Fixed, 95% CI) | 0.0 [0.0, 0.0] |
| 21.2 Adults | 0 | | Mean Difference (IV, Fixed, 95% CI) | 0.0 [0.0, 0.0] |
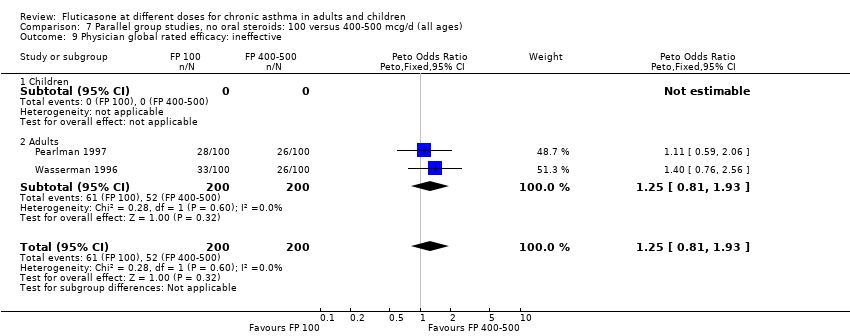
| 22 Physician global rated efficacy: ineffective Show forest plot | 2 | 357 | Peto Odds Ratio (Peto, Fixed, 95% CI) | 1.37 [0.77, 2.44] |
|
| 22.1 Children | 0 | 0 | Peto Odds Ratio (Peto, Fixed, 95% CI) | 0.0 [0.0, 0.0] |
| 22.2 Adults | 2 | 357 | Peto Odds Ratio (Peto, Fixed, 95% CI) | 1.37 [0.77, 2.44] |
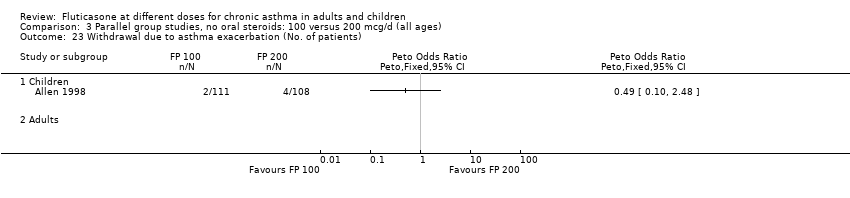
| 23 Withdrawal due to asthma exacerbation (No. of patients) Show forest plot | 1 | | Peto Odds Ratio (Peto, Fixed, 95% CI) | Totals not selected |
|
| 23.1 Children | 1 | | Peto Odds Ratio (Peto, Fixed, 95% CI) | 0.0 [0.0, 0.0] |
| 23.2 Adults | 0 | | Peto Odds Ratio (Peto, Fixed, 95% CI) | 0.0 [0.0, 0.0] |
| 24 Withdrawals due to adverse events Show forest plot | 3 | 627 | Odds Ratio (M‐H, Fixed, 95% CI) | 1.16 [0.54, 2.47] |
|
| 24.1 Children | 0 | 0 | Odds Ratio (M‐H, Fixed, 95% CI) | 0.0 [0.0, 0.0] |
| 24.2 Adults | 3 | 627 | Odds Ratio (M‐H, Fixed, 95% CI) | 1.16 [0.54, 2.47] |
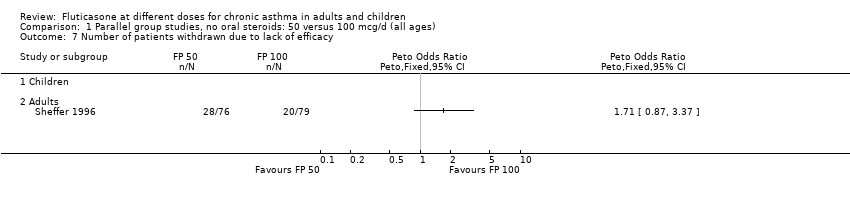
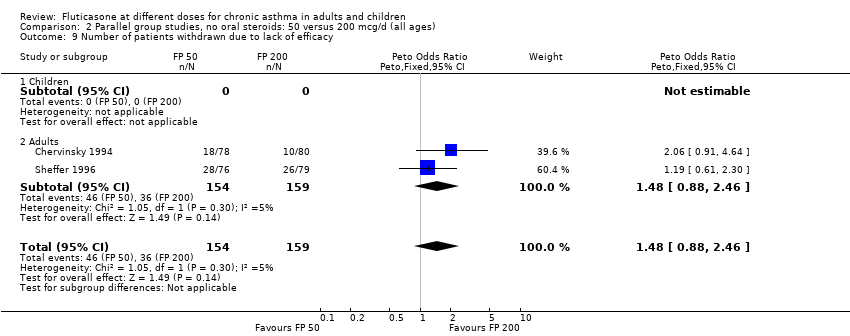
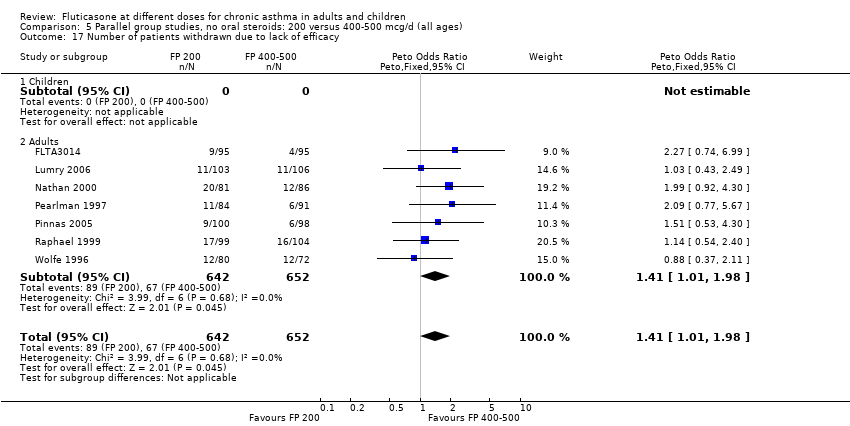
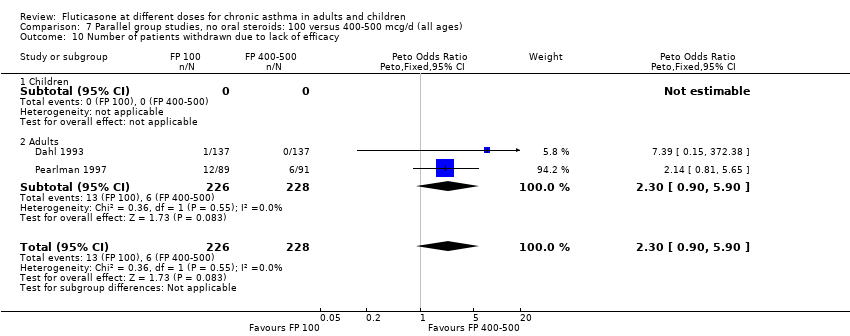
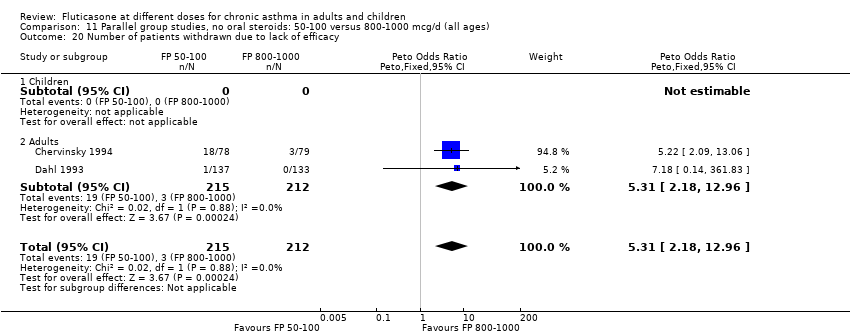
| 25 Number of patients withdrawn due to lack of efficacy Show forest plot | 9 | 1657 | Peto Odds Ratio (Peto, Fixed, 95% CI) | 1.01 [0.76, 1.35] |
|
| 25.1 Children | 3 | 522 | Peto Odds Ratio (Peto, Fixed, 95% CI) | 1.25 [0.79, 1.97] |
| 25.2 Adults | 6 | 1135 | Peto Odds Ratio (Peto, Fixed, 95% CI) | 0.88 [0.61, 1.28] |
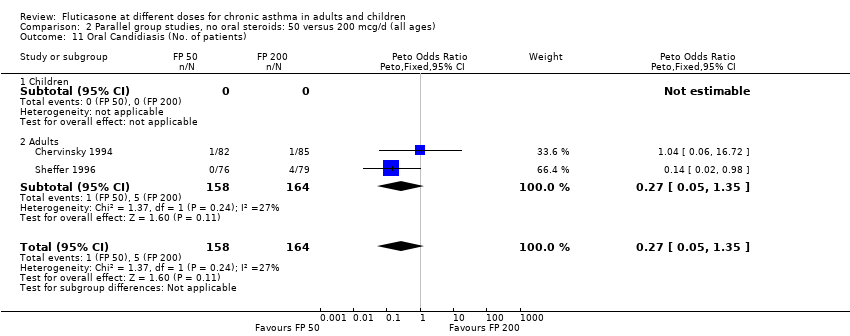
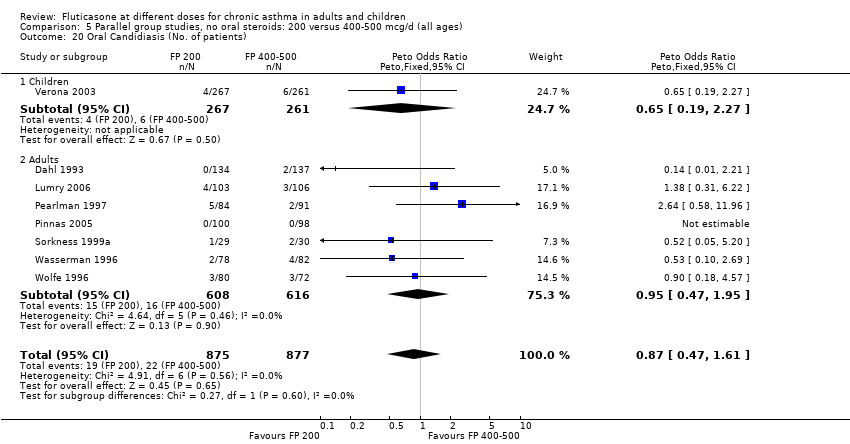
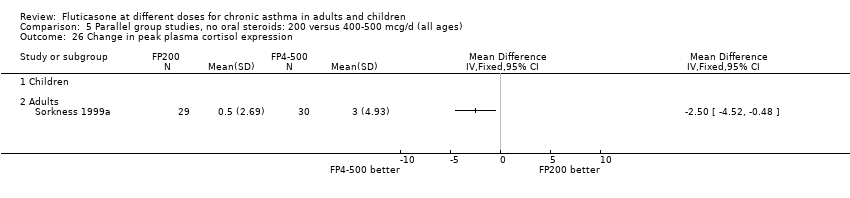
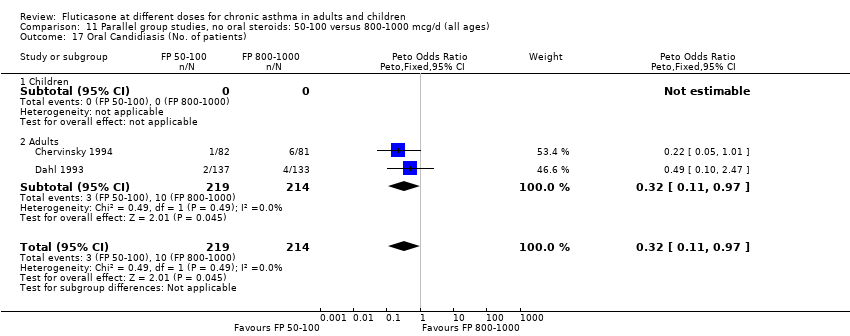
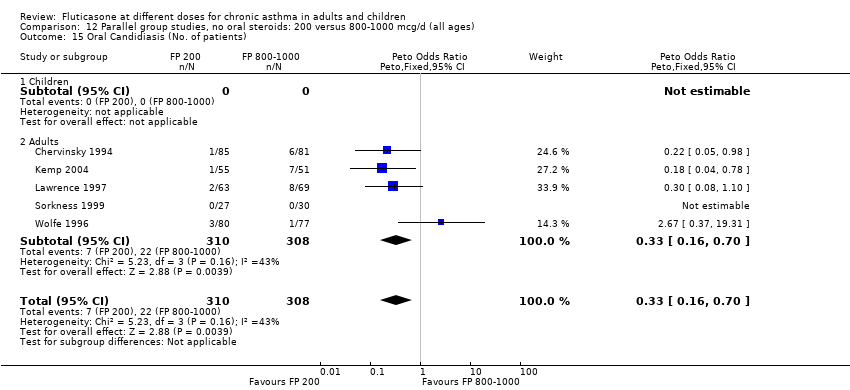
| 26 Oral Candidiasis (No. of patients) Show forest plot | 6 | 1150 | Peto Odds Ratio (Peto, Fixed, 95% CI) | 0.98 [0.46, 2.08] |
|
| 26.1 Children | 2 | 391 | Peto Odds Ratio (Peto, Fixed, 95% CI) | 1.33 [0.30, 5.90] |
| 26.2 Adults | 4 | 759 | Peto Odds Ratio (Peto, Fixed, 95% CI) | 0.88 [0.37, 2.11] |
| 27 Headaches Show forest plot | 3 | 511 | Peto Odds Ratio (Peto, Fixed, 95% CI) | 0.62 [0.15, 2.60] |
|
| 27.1 Children | 0 | 0 | Peto Odds Ratio (Peto, Fixed, 95% CI) | 0.0 [0.0, 0.0] |
| 27.2 Adults | 3 | 511 | Peto Odds Ratio (Peto, Fixed, 95% CI) | 0.62 [0.15, 2.60] |
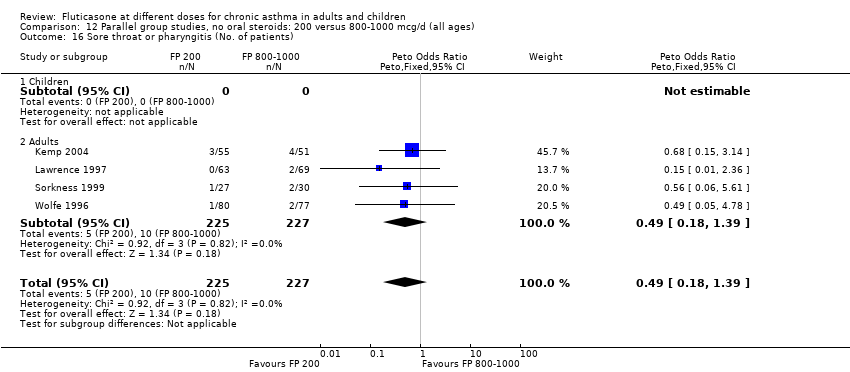
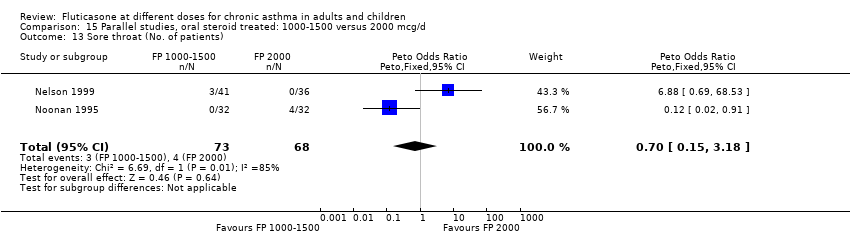
| 28 Sore throat or pharyngitis (No. of patients) Show forest plot | 5 | 841 | Peto Odds Ratio (Peto, Fixed, 95% CI) | 1.87 [0.71, 4.93] |
|
| 28.1 Children | 0 | 0 | Peto Odds Ratio (Peto, Fixed, 95% CI) | 0.0 [0.0, 0.0] |
| 28.2 Adults | 5 | 841 | Peto Odds Ratio (Peto, Fixed, 95% CI) | 1.87 [0.71, 4.93] |
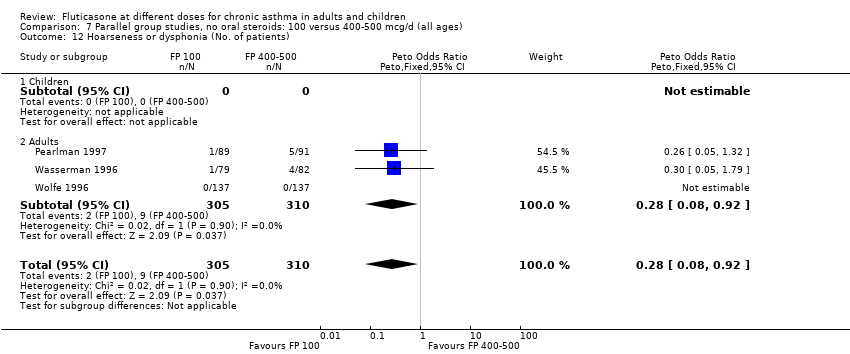
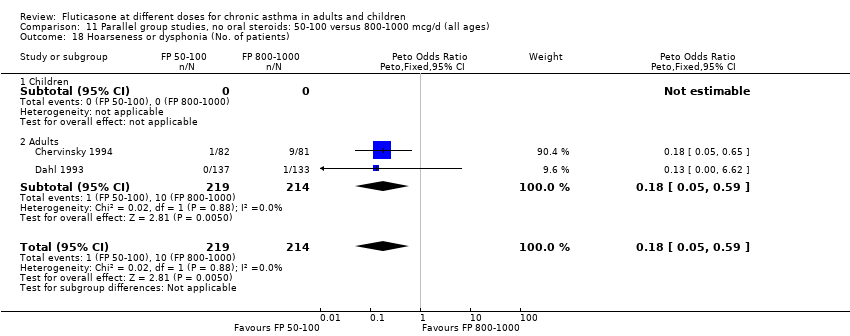
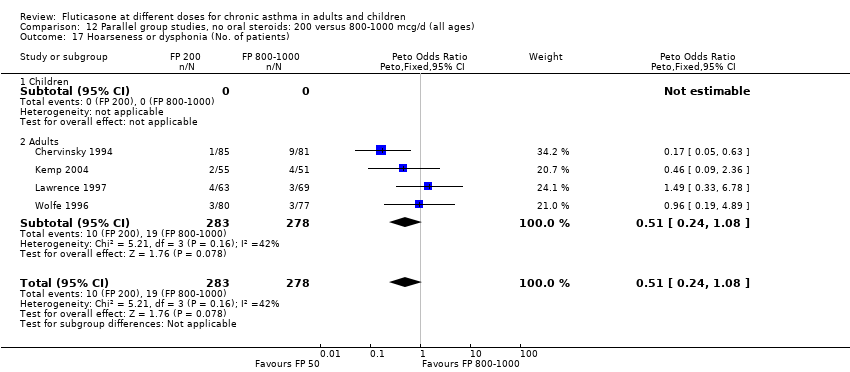
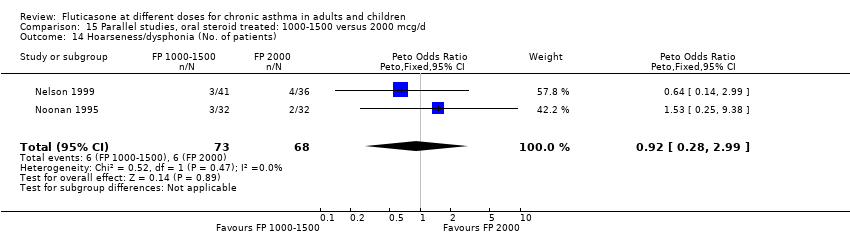
| 29 Hoarseness or dysphonia (No. of patients) Show forest plot | 7 | 1365 | Peto Odds Ratio (Peto, Fixed, 95% CI) | 0.65 [0.27, 1.57] |
|
| 29.1 Children | 2 | 391 | Peto Odds Ratio (Peto, Fixed, 95% CI) | 1.00 [0.20, 4.99] |
| 29.2 Adults | 5 | 974 | Peto Odds Ratio (Peto, Fixed, 95% CI) | 0.54 [0.19, 1.55] |
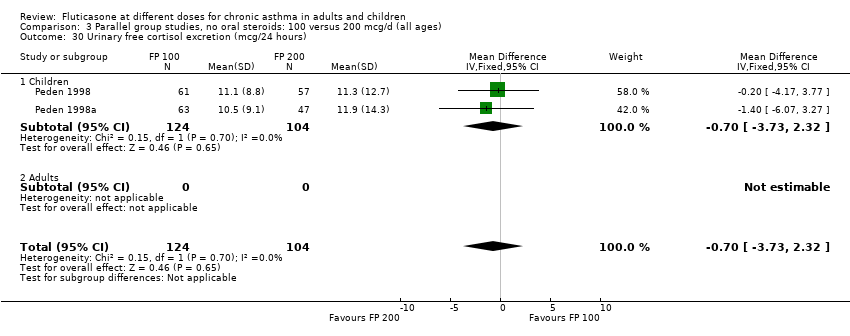
| 30 Urinary free cortisol excretion (mcg/24 hours) Show forest plot | 2 | 228 | Mean Difference (IV, Fixed, 95% CI) | ‐0.70 [‐3.73, 2.32] |
|
| 30.1 Children | 2 | 228 | Mean Difference (IV, Fixed, 95% CI) | ‐0.70 [‐3.73, 2.32] |
| 30.2 Adults | 0 | 0 | Mean Difference (IV, Fixed, 95% CI) | 0.0 [0.0, 0.0] |
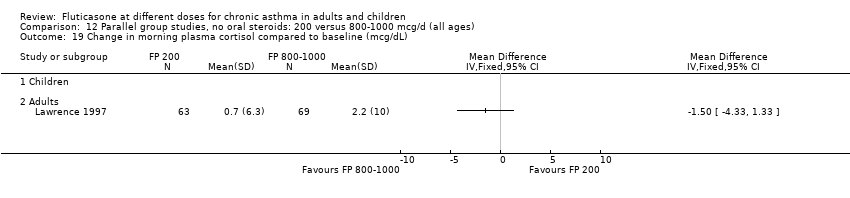
| 31 Morning plasma cortisol (mcg/dL) Show forest plot | 3 | 377 | Mean Difference (IV, Fixed, 95% CI) | ‐0.06 [‐1.01, 0.89] |
|
| 31.1 Children | 2 | 333 | Mean Difference (IV, Fixed, 95% CI) | ‐0.07 [‐1.14, 0.99] |
| 31.2 Adults | 1 | 44 | Mean Difference (IV, Fixed, 95% CI) | 0.0 [‐2.09, 2.09] |