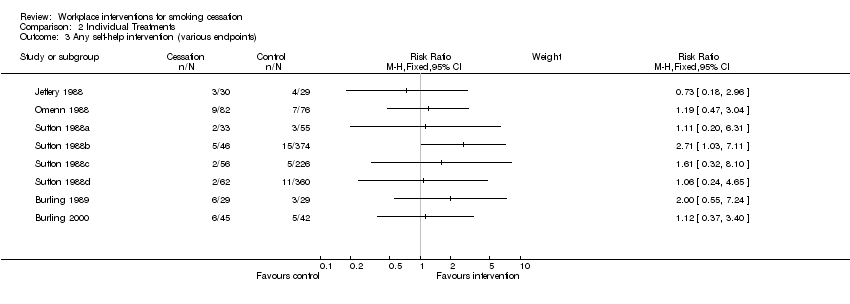
| Burling 1989 | 58 smokers, all given self‐help materials and support. Experimental group (29) also exposed to computerised nicotine fading. | No significant difference in quit rates. 3/29 in Group 1 vs 6/29 in Group 2.
(See also Cochrane Review 'Self‐help interventions for smoking cessation') | Validation (participation and abstinence) measured at CO>8ppm |
| Burling 2000 | 87 smokers, randomised to an interactive nicotine fading programme, or a conventional cessation programme.
73% of the experimental group used their programme, compared with 90% of the comparison group who used theirs | No significant difference in quit rates. 6/45 in Group 1.vs 5/42 in Group 2. There was more evidence of effect for those who used the programmes than for those that didn't.
(See also Cochrane Review 'Self‐help interventions for smoking cessation') | |
| Cambien 1981 | 304 intervention smokers recalled at 2 yrs, and 306 control smokers. 195 participants lost to follow up, proportion of smokers not reported | 21.4% of intervention smokers quit, vs 13.4% of control smokers. Point prevalence at 2 yrs, not a significant difference | Validation by blood CO levels |
| Campbell 2002 | 538 women in 9 worksites (4 exp, 5 control) completed all surveys (282 I, 256 C) to 18m. | No raw data given for smoking, but prevalence went down by around 3% in both groups. No significant differences, and no p values. | Self‐report on all outcomes, no biochemical validation |
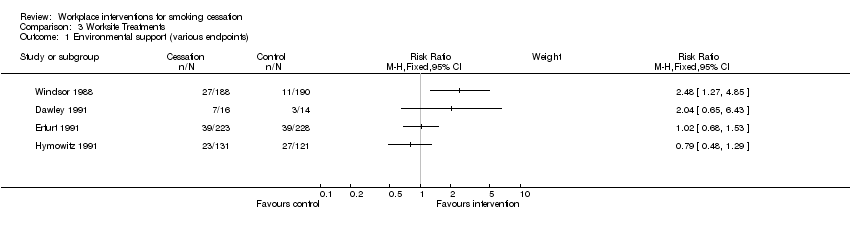
| Dawley 1991 | 16 employees in the experimental company (comprehensive programme), and 14 in the comparison company (cessation‐only programme) | Comprehensive Group achieved 43% (7/16) quit rate at 5 months, while the Cessation‐only Group achieved 21% (3/14). P‐values not given, but numbers too small for significant difference. | Validation by urinary cotinine |
| DePaul 1987 | 425 smokers in 43 corporations, randomised to group support programmes or self‐help alone programmes
Attrition rate was 8% in both groups | 6% vs 2% continuously abstinent (NS), 19% in both groups were abstinent at 12 months point prevalence.
Companies were the unit of analysis, similar results found using individual as unit of analysis.
(See also Cochrane Review 'Self‐help interventions for smoking cessation') | Partial validation by salivary cotinine, with family and colleague report |
| DePaul 1989 | 419 smokers in 38 worksites, randomised to experimental programme (206) and comparison programme (213). The attrition rate was 17% for Group worksites and 29% for Non Group worksite participants, so correcting the data for attrition would increase the apparent efficacy of the Group condition. | At the company level of analysis the 12 month point prevalence quit rates were Group 26% vs No Group 16% (p<0.06); continuous abstinence rates were 11% (Group) vs 3% (No Group) (p<0.05).
Reported rates were not based on Intention to Treat, but on participation in the programmes. Correcting for attrition would increase the efficacy of the Group programme.
At 24 months, 30% of the Group smokers were abstinent, comnpared with 19.5% of Non‐Group smokers (no p value).
(See also Cochrane Review 'Self‐help interventions for smoking cessation') | Partial validation by salivary cotinine, with family and colleague report |
| DePaul 1994 | 844 smokers in 61 worksites, randomised to Self‐help [SH] (289), Incentives [I] (281) or Group support [G] (283).
12 month attrition rates were 52.5% in SH, 47.2% in I, and 37.5% in G. | 12 month quit rates for sustained abstinence were 5.1% (n=79) SH, 11% (n=91) I, 31.2% (n=109) G (p<0.01). An Intention to Treat analysis, taking account of attrition, would further favour the intervention groups.
(See also Cochrane Review 'Self‐help interventions for smoking cessation') | Validation by salivary cotinine at 6 months, and CO<9ppm at 12 months |
| Emmons 1999 | 2055 workers (28% smokers) completed all surveys from 22 worksites, and constituted the cohort. | At 3 yr final follow up, 8.0% of the intervention smokers had quit for 6m, and 8.1% of the control smokers. 25.6% and 21.8% respectively claimed 7‐day PP. Differences were non‐significant | Self‐report, with no biochemical validation |
| Erfurt 1991 | Four sites were assessed at baseline; Site 1 had 1096 smokers (45%), Site 2 598 (44%), Site 3 844 (41%) and Site 4 834 (44%).
At 3 year follow‐up Site 4 had been significantly restructured. | Participation was affected by the intervention: 5% in Site 1, 9% in Site 2, 53% in Site 3 and 58% in Site 4.
Possible bias due to different baseline characteristics of people rescreened in site3 & 4 limit interpretation of follow‐up smoking prevalences: 41.6%, 40.6%, 36.1%, 31.0%
All sites had significant relative reductions in smoking: 7.8% (p<0.01), 10.6% (p<0.01), 11.7% (p<0.001), 13.2% (p<0.001).
Of those smoking in 1985 who were re‐screened in 1988, 17.1% at Site 1 had quit, 17.6% at Site 2, 20.3% at Site 3 and 18.9% at Site 4 (NS). | Self‐report only, not biochemically validated |
| Frank 1986 | 48 smokers initially randomised to three groups, with varying levels of hypnosis, booster and self‐management training. A 4th group (15 smokers) was later recruited, with Group 2 interventions applied more intensively.
Attrition rate of 6% across the initial 3 groups at end of treatment, 17% at 3 months and 25% at 6 month follow‐up. | No difference between the groups for smoking cessation 6 months after treatment, regardless of the frequency, length between sessions, or addition of behavioural methods. Quit rate was 20% for all groups, based on Intention to Treat.
Intensive intervention produced initially higher quit rates (60% at end of treatment), but this reverted to 20% by 6 months
(See also Cochrane Review 'Hypnotherapy for smoking cessation') | Salivary cotinine measured at 3 months, but self‐report only at 6 months |
| Glasgow 1984 | 36 employees, randomised to abrupt reduction (13), gradual reduction (12) and gradual reduction + feedback (11).
Attrition at 6 months was respectively 4, 0 and 1. | At 6 months up to one third in the gradual condition were abstinent compared to no subjects in the abrupt condition (NS).
Intention to Treat analysis showed that the gradual reduction programme was more successful than the abrupt reduction (p<0.05) | CO<10 ppm at 6 months, weighing of cigarette butts |
| Glasgow 1986 | 29 employees randomised to Basic Programme (13) or Basic Programme + Social Support (16).
Attrition 7% at end of treatment, and a further 7% at 6 months | Consistent with previous findings, supportive social interactions were not related to treatment outcome.3/13 in the Basic Programme had quit at 6 months, and 3/16 in the Basic + Social Support Group (NS).
(See also Cochrane review 'Enhancing partner support to improve smoking cessation'). | Self report, weighing of cigarette butts, CO monitoring and salivary thiocyanate |
| Glasgow 1993 | 19 worksites, random allocation to Incentive programme (474 smokers) or No Incentive programme (623 smokers).
Attrition rates at 1 year were 19% (I) and 24% (no I), and at 2 years were 27% and 32% respectively | At 2 year follow‐up 49/344 (14%) were abstinent in the Incentives group, and 49/426 (12%) in the No incentives group (NS). Intention to Treat analysis would give more conservative quit rates | CO monitoring and salivary cotinine |
| Glasgow 1995 | 26 worksites, randomised to early or delayed interventions. 1222 employees were followed up at 2 years. | Comprehensive programme; a 26% rate of cessation was noted across both longitudinal cohort groups (NS), and a 30% rate across both cross‐sectional groups (NS). No significant differences were seen between the 2 types of intervention | Self report, not biochemically validated |
| Gomel 1993a | 28 ambulance stations randomized to 4 levels of risk reduction intervention. 128 baseline smokers followed for 1 yr | No significant differences between HRA and RFE groups at any follow‐up point, nor between BC and BCI groups. HRA and RFE groups (68 smokers) were pooled and compared with 60 smokers in pooled BC and BCI groups. Continuous abstinence rates at 6m were 1% for HRA+RFE and 10% for BC+BCI (Fisher's Exact Test p=0.05); 12m rates were 0% and 7% (p=0.05). | Serum cotinine validation used. |
| Gunes 2007 | 200 smokers randomized to 7‐step behavioural programme or no intervention, followed for 6m | | |
| Hennrikus 2002 | 24 worksites, randomised to 6 programmes, 4 worksites in each programme. 2402 smokers were surveyed at baseline and at 12 and 24 months. 85.5% response rate at 12 months, and 81.7% at 24. | 407 (17%) smokers signed up to programmes. 15.4% at 12 months and 19.4% at 24 months reported themselves as non‐smokers.
Recruitment was significantly higher in the incentive sites (22% vs 12% p=0.0054), but did not translate into higher cessation rates.
Quit rates were consistently higher among programme registrants than among non‐registrants, but the differential was greater in the non‐incentive sites (15%) than in the incentive ones (6.7%), consistent with incentives attracting smokers less motivated to quit. | Self‐report, validated by family member or friend.
A sample of quitters were asked to supply saliva, and were paid $25 if they complied.
Winners of cessation prize draws had to supply a valid saliva sample. |
| Hymowitz 1991 | Six worksites randomised to Full Programme or Group‐only interventions. Participation was 50% in the Full Programme sites, and 44% at Group‐only (NS).
193/252 smokers who began the quit programme completed it.
Randomisation was by worksite, but analysis was by individual. | At 12 months, 23/131 (18%) in the Full Programme arm had quit, while 27/121 (22%) in the Group‐only arm had quit (NS). | Self‐report and expired CO<8 ppm. |
| Jeffery 1988 | 59 employees were randomly assigned to reduction (29) or cessation (30) groups, and surveyed at baseline and at 6 and 12 months. Attrition was 30% ‐ intention to treat analysis. | At 12 months 4/29 (14%) had quit in the reduction group, and 3/30 (10%) in the cessation group. No significant differences between the groups on either of the outcomes (dropout rate, cessation at 12 months). | self‐report confirmed by expired CO<8 ppm. |
| Kadowaki 2000 | 263 male employees randomised to intervention (132) or control (131).
No attrition, as inclusion was compulsory. | Quit rates 17/132 (Intervention), 4/131 (Control) at 5‐month follow‐up (p=0.003). Male smoking decreased from 62.9% to 56.7% (p=0.04).
Delayed intervention in the control group lead to 13% quit rate (16/123) | Expired CO<9 ppm at baseline, 5 months and 12 months, and a urine test at 12 months |
| Klesges 1987 | 136/480 smokers over 8 worksites; all received a behavioural programme, with the intervention sites also receiving a competition and prize component. Each group of sites (Intervention and Control) were also divided between relapse prevention training (2) and no relapse training (2).
Attrition rate was 7% at end of treatment, increased to 10% by 6 months follow‐up. | Competition intervention resulted in significantly higher quit rates at the end of the trial (39% vs 16%, p<0.004) but these differences decayed at 6 months (12% vs. 11%, NS ).
Using the baseline of 480 smokers who could have participated, 3% were abstinent at 6 months | Expired CO<10 ppm |
| Kornitzer 1980 | 30 Belgian factories (16,230 men) randomized to intervention (risk assessment, physician and written advice) or control (assessment only). tested at 2 yrs. | High risk intervention group (n=1268) reduced prevalence by 18.7% (84.5% to 68.7%), and high risk control group (n=202) reduced by 12.2% (80.8% to 70.9%). P < 0.05.
Random sample comparison: 5% of intervention group (n=327) reduced by 12.5%, compared with 10% control sample (n=800) reduced by 12.6% (ns). | Self report only, no biochemical validation. |
| Kornitzer 1987 | 199 employees were randomised to receive 2mg (101) or 4mg (98) nicotine gum.
Attrition at one year was 6% in the 2mg group and 7.2% in the 4mg group. | At 3 months 36% of the 2mg group and 45% of the 4mg group claimed to be abstinent. At that point,blinding was broken and individuals could choose their treatment group. Results were stratified by Fagerstrom score dependency. At 12 months, the 4mg group (90) had a 50% higher abstinence rate than the 2mg group (94) (p<0.05); this fails to reach significance if an intention‐to‐treat analysis is conducted. In the first 3 (blinded) months of trial, the heavier smokers benefited more from the higher dose gum.
After unblinding, 17% of the 4mg group continued treatment, whereas 39% of the 2mg group continued treatment. In the 4mg group 31% switched to 2mg, while 5% of the 2mg group switched to 4mg. | Baseline and 12 month cotinine blood samples (random sample of 69% at 12 months). |
| Kornitzer 1995 | 374 employees randomised to Group 1(149, active patch + active gum), Group 2(150, active patch + placebo gum) or Group 3(75, placebo patch + placebo gum) | At 12 months, abstinence in Group 1 was 18.1% (NS), in Group 2 12.7% (NS) and in Group 3 13.3% (NS). Time to relapse was significantly longer in Group 1 compared with the other 2 groups (p=0.04). | Salivary cotinine at baseline, and expired CO<10 ppm at subsequent checks |
| Lang 2000 | 30 worksite physicians (1095 smokers) were randomised to Group A (504, simple advice) or Group B (591, advice + support and 'contract'). | 2 physicians dropped out post randomisation.
3.4% of baseline non‐smokers in each group were smokers at 1 year follow‐up.
The sustained abstinence rate at 6 months or more (A: 4.6%; B: 6.1%) was non‐significant using the physician as the unit as analysis.
At 12 months, Group A had a quit rate of 13.5%, and Group B a rate of 18.4% (p=0.03) | Self‐report, with CO<7 ppm validation on a subset of 231 subjects whose physicians had access to a CO monitor. |
| Li 1984 | 871 employee smokers, randomised to Group 1 (simple warning) or Group 2(brief physician advice), stratified by normal/abnormal lung function.
After fine tuning, at 3 months 215 workers received counselling, while 361 received simple warning and 3 were excluded.
Attrition was 30%. | Counselled workers had an 8.4% abstinence rate at 11 months, compared with 3.6% in the control group (p<0.05).
Feedback on abnormal lung function was not significantly related to increased rates of quitting | Expired CO<10 ppm at 11 months follow‐up in all quitters, and in a random sample of 379 continuing smokers |
| Malott 1984 | 24 employees randomised to controlled smoking Group (1) or controlled smoking + partner support Group (2).
Attrition 4% at 6 months | Few differences were observed between controlled smoking and controlled smoking plus partner support conditions either during treatment or at the 6‐month follow‐up. 25% of Group 1, and 17% of Group 2 were abstinent at 6 months (NS).
(See Cochrane review 'Enhancing partner support to improve smoking cessation'). | Self‐monitoring, butt counts, expired CO levels |
| Nilsson 2001 | 113 workers randomised to intervention (65) or control (63).
Attrition at 12 months was 32% for the intervention group, and 24% for the control group. At 18 months the respective attrition rates were 34% and 27%. | Baseline prevalence for both groups was 65%. At 12 months the intervention group point prevalence rate was 37%, and the control group 63%. At 18 months, the rates were 40% and 59% respectively. This difference influenced the decrease in mean risk score from 10.3 to 9.0 after 18 months in the intervention group (p=0.042) | Self‐report, not biochemically validated |
| Omenn 1988 | 402 employee smokers randomised within their preference for group or self‐help programmes, to 3 programmes, MCP (1), RPP (2) or MTP (3).
7% attrition rate at 12 months. | Self‐reported quit rates similar across all three group preference conditions but more missing saliva samples in self‐help so validated rates lower.
All self‐help programmes similar.
Results: Group 1 8/51, Group 2 10/57, Group 3 4/51 (NS)
SH1 7/76, SH2 9/82, SH3 6/85 (NS) | Salivary cotinine at 12 months <35 ng/ml |
| Rand 1989 | 47 employees randomised to contingent payment/frequent CO monitoring group (17), non‐contingent payment/frequent CO monitoring (16), non‐contingent payment/ infrequent monitoring (14).
4 participants failed to abstain for 5 days, and were excluded before randomisation.
At 6 months 11 more participants had dropped out. Analyses were Intention to Treat at randomisation. | Contingent payment combined with frequent CO monitoring delayed but did not ultimately prevent participant relapse to smoking by the end of the six month follow‐up. Contingent payment group had CO value at or less than 11 ppm significantly longer than the other two groups (p=0.03). CO monitoring alone had no effect on abstinence.
At six months, only 2 subjects ( 1contingent, 1 non‐contingent) had achieved sustained abstinence. | Expired CO monitoring <12 ppm |
| Razavi 1999 | 344 post‐cessation abstainers randomised to psychologist support (135), ex‐smoker support (88), or no formal support (121), | 12 months abstinence rates were 59/135 (43.7%) in the PG group; 33/88 (37.5%) in the SG group; 43/121 (35.5%) in no support group (NS). | Expired CO and urinary cotinine. Unvalidated self‐report (higher) were also given. |
| Rodriguez 2003 | 218 smokers randomized to counselling + NRT (115) or minimal sporadic advice (103) in 3 Bilabao (Spain) worksites | 12 months continuous abstinence rates were 23/114 (20.2%) for the intervention group, vs 9/103 (8.7%) in the control group (P = 0.025).
NNT was 9 people treated for 3mss to produce 1 quitter | Expired CO <+ 10 ppm |
| Schröter 2006 | 38 smokers assigned to standard behavioural (SB) programme, 41 to relapse prevention (RP) programme.
Assessed at 12m for continuous and PP abstinence | 12m continuous abstinence rates were 8/38 (21.1%) for SB, and 5/41 (12.2%) for RP. | Self‐reported, no biochemical validation |
| Shi 1992 | 2887 workers (533 smokers) across 9 Californian sites, partially randomized to 4 intervention levels. No non‐intervention control group | 2 yr cross‐sectional survey of 1998 workers (250 smokers); Prevalence declined by 34% from 18% to 12% in Level 1 (p < 0.1); by 18% from 17% to 14% in Level 2 (p < 0.1); by 35% from 24% to 15% in level 3 (p < 0.01); by 44% from 14% to 8% in Level 4 (p < 0.01) | Self‐reported PP at HRA, not biochemically validated |
| Shimizu 1999 | 53 volunteer employee smokers, randomised to intervention and control groups. | After the 5 months of intervention, smoking cessation rate in the intervention group (19.2%) tended to be higher than that in the control group (7.4%), (NS).
Control group was given same programme after the 5 months for the intervention group. At six months after both groups were treated, overall cessation rate was 24.5%, and at one year was 13.2%. | Expired CO monitoring |
| Sorensen 1993 | Eight worksites, randomised to intervention (1885 workers) or comparison (1479 workers).
At baseline, 9 months before intervention, 34% of respondents were current smokers (I:39%;C:31%)
Six‐month data were on only 7 of the 8 sites, because of ownership changes at the 8th. Six‐month survey was of all smokers then employed, = 66% of originally surveyed employees.
Analyses were by individual, while randomisation was by worksite. | Analysis of all smokers, not just participants.
At the 6‐month follow‐up, 12% of smokers in the intervention group reported quitting, compared with 8.8% in the control group (p<0.05), controlling for age, sex & occupation. | Self‐report only.
Baseline and follow‐up salivary cotinines obtained for 52% of baseline smokers. These data were not analysed. |
| Sorensen 1996 | 108 matched worksites (>28,000 workers), randomised to intervention or control conditions, though Florida center sites did not target smoking, leaving smoking outcomes available in only 84 worksites. | Worksite was the unit of allocation and analysis. Baseline smoking data were not reported in detail.
There was a difference of 1.53% (NS) in the 6‐month quit rates between intervention and control sites, and a reduction in prevalence from 24.5% to 21.2% (I), and from 25.8% to 21.8% (C), a difference between the 2 groups of 0.66% (NS). | Self‐reported, no biochemical validation |
| Sorensen 1998 | Cohort analysis (2658 employees) of a randomised controlled study of 12 matched pairs of worksites.
Worksite was unit of allocation, but analysis was by individual. | PP abstinence for the 6 months prior to 2‐year follow‐up was 15% for intervention group and 9% for control group (p=0.123)
Blue‐collar cessation rates for the 2 groups were 18% (I) and 9% (C), while the white‐collar workers achieved higher rates in the control than in the intervention group; office worker rates were 2.5% (I) vs 5.1% (C), and professipnal/managerial rates were 14.2% (I) vs 18.6% (C). | Self‐reported, no biochemical validation |
| Sorensen 2002 | Cross‐sectional analysis (9019 at baseline [80%] and 7327 [65%] ) at six months follow‐up, plus cohort analysis of 5156 employees who responded to both surveys (embedded cohort of 436 smokers).
Worksite was unit of allocation, but analysis was by individual. | At six months, point prevalence in the HP/OHS sites fell from 20.4% to 16.3%, and in the HP sites from 18.6% to 17%.
In the embedded cohort (825 smokers) at 6m, the HP/OHS quit rate was 11.3%, compared with the HP rate of 7.5% (OR=1.57, p=0.17). Within the cohort, blue‐collar quit rates more than doubled in the HP/OHS sites (11.8%) compared with the HP sites (5.9%, p=0.04) | Self‐reported, no biochemical validation |
| Sorensen 2007 | Baseline participants 674 workers, (354 Int/ 320 Cont).
188 smokers (101 Int, 87 Cont) completed baseline and 6m surveys | 7‐day self‐reported PPA at 6m: Int: 19/101 (19%), Cont: 7/87 (8%) (P=0.03).
ITT analysis Int: 19/125 , Cont: 7/106, P=0.04. | Self‐reported, no biochemical validation |
| Sutton 1987 | 270/334 interested smokers invited to nicotine gum cessation programme; the uninvited 64 represented a control group. 172 (64%) of invitees attended the 1st consultation, 163 the 2nd.
One‐year follow‐up rate was 99% (9% by phone). | 12% (20/172) of those who attended the intervention course were abstinent at 12 months, compared with 1% (1/98) of those who did not accept the invitation, and 2% (1/64) of the control group; p values not given. | Expired CO<11 ppm |
| Sutton 1988a | Video programme (smoking, plus seat‐belt advice) was offered to all employees. 77 employees were randomised to DFF video (33) or seatbelt (44=control) videos. | Abstinence rates (DFF: 3%, SB [control] 0%) were not significantly different from each other at 12 months follow‐up, There was no significant difference in validated abstinence between the video groups and the non‐participant group. | Expired CO<11 ppm. |
| Sutton 1988b | 150 employees (smokers only) participated. 46 watched the DFF video, 50 watched a confidence‐boosting version of the DFF video, and 54 (control group) watched LTK video. | Abstinence rates (DFF: 11%, DFF+C 8%, LTK [control] 9%) were higher than in the other 3 studies, but not significantly different from each other
at 12 months follow‐up. But there was a significant difference in abstinence rates between participant groups and the non‐participant group (4%, p<0.05). | Expired CO<11 ppm. |
| Sutton 1988c | 197 employees (smokers only) participated. 56 watched the DFF video, 67 watched a less gory version of the DFF video, and 74 (control group) watched the TW video.
Non‐responder smokers at baseline had higher smoking prevalence (45%) than responders (29%), suggesting some response bias. | Abstinence rates (DFF: 4%, DFF‐G 3%, TW [control] 4%) were not significantly different from each other.
at 12 months follow‐up. There was no significant difference in abstinence rates between the video groups and the non‐participant group. | Expired CO<11 ppm. |
| Sutton 1988d | 179 employees (smokers only) participated. 62 watched the DFF video, 59 watched SL video, and 58 (control group) watched TW video.
Non‐responder smokers at baseline had higher smoking prevalence (34%) than responders (22%), suggesting some response bias. | Abstinence rates (DFF: 3%, SL 2%, Tw [control] 5%) were not significantly different from each other at 12 months follow‐up. There was no significant difference in validated abstinence artes between the video groups and the non‐participant group. | Expired CO<11 ppm. |
| Sutton 1988e | Fourth study (D) of the video studies groups provided a nested RCT. 161 continuing smokers at 3‐month follow‐up were randomised to intervention (79) or control (82).
40.5% response rate, attending at least one consultation. | 22% (7/32) of attenders in the intervention group were abstinent at 12 months, compared with 2% (1/47) of the non‐attending invitees, and compared with 2% (2/82)of the control group (p<0.001).
16% of intervention group achieved 'complete' sustained abstinence at 12 months, vs 2% control group (p<0.01). | Expired CO<11 ppm. |
| Tanaka 2006 | Six intervention sites matched to 6 control sites; Of 1017 intervention smokers who completed baseline and 36m follow up, 125 participated in cessation campaign, and 79 accepted counselling + NRT. | 6m sustained abstinence at 36m ITT analysis was 8.9% (123/1382) intervention vs 7.0% (121/1736) control. Quit rates in both groups rose steadily over 36m. | No biochemical confirmation |
| Terazawa 2001 | 228 smokers randomized to intervention (117) or control (111). 25 smokers in the intervention group made a supported quit attempt | PP 11.1% (13/117) in the intervention group at 12m, compared with 1.8% (2/111) controls. Continuous abstinence 6.8% (8/117) intervention, compared with 0.9% (1/111) controls. Fisher's Exact test 2‐tailed P = 0.04 | Probably validated by expired CO |
| Willemsen 1998 | Four intervention worksites matched to 4 control sites (minimal self‐help), giving 498 smokers who completed baseline survey and enrolled in programmes. | Overall sustained abstinence quit rates at 6 months were 8% (9% for heavy smokers) in the comprehensive group, and 7% (4% for heavy smokers) in the minimal group (no p values given) | Self‐report, plus baseline Fagerstrom score.
At 4‐month follow‐up, 'bogus pipeline' procedure was used, and at 14 months salivary cotinines were collected from 41/79 quitters |
| Windsor 1988 | 387 smokers randomly assigned to four groups, in a 2x2 factorial pre‐/post‐test design.
37 were lost to follow‐up, and were counted as continuing smokers | As monetary incentives made no difference, groups 1&3 were compared with 2&4. Sustained abstinence at 1 year was 5.8% (11/190) in the self‐help only groups, and 14.4% (27/188) in the self‐help + counselling groups (p<0.001). | Baseline salivary cotinine, and follow‐up salivas at 6 weeks, 6 months and 1 year. |