Number of embryos for transfer following in vitro fertilisation or intra‐cytoplasmic sperm injection
Abstract
Background
Transfer of more than one embryo during in vitro fertilisation (IVF) or intracytoplasmic sperm injection (ICSI) increases multiple pregnancy rates resulting in an increased risk of maternal and perinatal morbidity. Elective single embryo transfer offers a means of minimising this risk, but this potential gain needs to be balanced against the possibility of jeopardising the overall live birth rate (LBR).
Objectives
To evaluate the effectiveness and safety of different policies for the number of embryos transferred in infertile couples undergoing assisted reproductive technology cycles.
Search methods
We searched the Cochrane Gynaecology and Fertility Group specialised register of controlled trials, CENTRAL, MEDLINE, Embase, ClinicalTrials.gov, and the World Health Organization International Clinical Trials Registry Platform from inception to March 2020. We handsearched reference lists of articles and relevant conference proceedings. We also communicated with experts in the field regarding any additional studies.
Selection criteria
We included randomised controlled trials (RCTs) comparing different policies for the number of embryos transferred following IVF or ICSI in infertile women. Studies of fresh or frozen and thawed transfer of one to four embryos at cleavage or blastocyst stage were eligible.
Data collection and analysis
Two review authors independently extracted data and assessed trial eligibility and risk of bias. The primary outcomes were LBR and multiple pregnancy rate. The secondary outcomes were clinical pregnancy and miscarriage rates. We analysed data using risk ratios (RR), Peto odds ratio (Peto OR) and a fixed effect model.
Main results
We included 17 RCTs in the review (2505 women). The main limitation was inadequate reporting of study methods and moderate to high risk of performance bias due to lack of blinding. A majority of the studies had low numbers of participants.
None of the trials compared repeated single embryo transfer (SET) with multiple embryo transfer. Reported results of multiple embryo transfer below refer to double embryo transfer.
Repeated single embryo transfer versus multiple embryo transfer in a single cycle
Repeated SET was compared with double embryo transfer (DET) in four studies of cleavage‐stage transfer. In these studies the SET group received either two cycles of fresh SET (one study) or one cycle of fresh SET followed by one frozen SET (three studies). The cumulative live birth rate after repeated SET may be little or no different from the rate after one cycle of DET (RR 0.95, 95% CI (confidence interval) 0.82 to 1.10; I² = 0%; 4 studies, 985 participants; low‐quality evidence). This suggests that for a woman with a 42% chance of live birth following a single cycle of DET, the repeated SET would yield pregnancy rates between 34% and 46%. The multiple pregnancy rate associated with repeated SET is probably reduced compared to a single cycle of DET (Peto OR 0.13, 95% CI 0.08 to 0.21; I² = 0%; 4 studies, 985 participants; moderate‐quality evidence). This suggests that for a woman with a 13% risk of multiple pregnancy following a single cycle of DET, the risk following repeated SET would be between 0% and 3%. The clinical pregnancy rate (RR 0.99, 95% CI 0.87 to 1.12; I² = 47%; 3 studies, 943 participants; low‐quality evidence) after repeated SET may be little or no different from the rate after one cycle of DET. There may be little or no difference in the miscarriage rate between the two groups.
Single versus multiple embryo transfer in a single cycle
A single cycle of SET was compared with a single cycle of DET in 13 studies, 11 comparing cleavage‐stage transfers and three comparing blastocyst‐stage transfers.One study reported both cleavage and blastocyst stage transfers.
Low‐quality evidence suggests that the live birth rate per woman may be reduced in women who have SET in comparison with those who have DET (RR 0.67, 95% CI 0.59 to 0.75; I² = 0%; 12 studies, 1904 participants; low‐quality evidence). Thus, for a woman with a 46% chance of live birth following a single cycle of DET, the chance following a single cycle of SET would be between 27% and 35%. The multiple pregnancy rate per woman is probably lower in those who have SET than those who have DET (Peto OR 0.16, 95% CI 0.12 to 0.22; I² = 0%; 13 studies, 1952 participants; moderate‐quality evidence). This suggests that for a woman with a 15% risk of multiple pregnancy following a single cycle of DET, the risk following a single cycle of SET would be between 2% and 4%. Low‐quality evidence suggests that the clinical pregnancy rate may be lower in women who have SET than in those who have DET (RR 0.70, 95% CI 0.64 to 0.77; I² = 0%; 10 studies, 1860 participants; low‐quality evidence). There may be little or no difference in the miscarriage rate between the two groups.
Authors' conclusions
Although DET achieves higher live birth and clinical pregnancy rates per fresh cycle, the evidence suggests that the difference in effectiveness may be substantially offset when elective SET is followed by a further transfer of a single embryo in fresh or frozen cycle, while simultaneously reducing multiple pregnancies, at least among women with a good prognosis.
The quality of evidence was low to moderate primarily due to inadequate reporting of study methods and absence of masking those delivering, as well as receiving the interventions.
PICO
Plain language summary
Number of embryos for transfer in women undergoing assisted reproductive technology (ART)
Review question
How many embryos should be transferred in couples undergoing ART?
Background
Multiple pregnancy causes serious health risks for mothers and babies. Single embryo transfer (SET) can reduce the chance of having twins, triplets or higher order multiples but this needs to be balanced against the risk of lowering the chance of pregnancy or live birth. We reviewed the evidence about the number of embryos transferred in women undergoing ART. The evidence is current to March 2020.
Study characteristics
We found 17 randomised controlled trials with a total of 2505 participants. Most were not commercially funded. None of the trials compared repeated single embryo transfer (SET) with multiple embryo transfer. A majority of the studies had low numbers of participants. Reported results of multiple embryo transfer below refer to double embryo transfer.
Key findings
Repeated single embryo transfer versus multiple embryo transfer in a single cycle
Based on low‐quality evidence, there was no indication that overall live birth and clinical pregnancy rates differed substantially when repeated SET (either two cycles of single embryo transfer or one cycle of single embryo transfer followed by transfer of a single frozen embryo) was compared with double embryo transfer (DET). For a woman with a 42% chance of live birth following a single cycle of DET, the chance following repeated single embryo transfer would be between 34% and 46%. Moderate‐quality evidence suggests that the risk of multiple birth is much lower in the SET group (between 0% and 3%) compared to a 13% chance of multiple pregnancy following a single cycle of DET. The chance of miscarriage rate is similar between the two groups.
Single versus multiple embryo transfer in a single cycle
We found low‐quality evidence that the rates of live birth and clinical pregnancy (CPR) were lower after one cycle of fresh SET compared with the outcome of one cycle of fresh DET. For a woman with a 46% chance of live birth following one cycle of DET, the chance following one cycle of SET was between 27% and 35%. However, the risk of multiple pregnancy was higher after DET. There was no difference in the chance of miscarriage between the two groups.
Conclusion
While live birth and clinical pregnancy was lower following SET compared to DET after single fresh cycle, there was no difference between overall live birth rate and CPR following consecutive SET versus a single cycle of DET. However, the multiple pregnancy rate is much lower following SET compared to DET. Most of the evidence currently available concerns younger women with a good prognosis.
Quality of evidence
The quality of evidence was low to moderate primarily due to inadequate reporting of study methods and absence of masking those delivering, as well as receiving the interventions.
Authors' conclusions
Summary of findings
| Repeated single embryo transfer (mixed policies) versus multiple embryo transfer in a single cycle of IVF or ICSI | |||||||
| Patient or population: transfer following in vitro fertilisation or intracytoplasmic sperm injection | |||||||
| Outcomes | Anticipated absolute effects* (95% CI) | Relative effect | № of participants | Quality of the evidence | Comments | ||
|---|---|---|---|---|---|---|---|
| Risk with multiple embryo transfer | Risk with repeated single (mixed policies) | ||||||
| Cumulative live birth | pooled | 420 per 1000 | 399 per 1000 | RR 0.95 | 985 | ⊕⊕⊝⊝ | |
| Cumulative live birth | SET + 1 FET versus DET (×1) (cleavage stage) | 421 per 1000 | 392 per 1000 | RR 0.93 | 878 | ⊕⊕⊝⊝ | |
| SET (×2) versus DET (×1) (cleavage stage) | 407 per 1000 | 464 per 1000 | RR 1.14 | 107 | ⊕⊝⊝⊝ | ||
| Multiple pregnancy | pooled | 127 per 1000 | 18 per 1000 | Peto odds ratio 0.13 | 985 | ⊕⊕⊕⊝ | |
| Multiple pregnancy | SET + 1 FET versus DET (×1) (cleavage stage) | 128 per 1000 | 19 per 1000 | Peto odds ratio 0.13 | 878 | ⊕⊕⊕⊝ | |
| SET (×2) versus DET (×1) (cleavage stage) | 111 per 1000 | 15 per 1000 | Peto odds ratio 0.12 | 107 | ⊕⊝⊝⊝ | ||
| Clinical pregnancy rate | pooled | 515 per 1000 | 489 per 1000 (432 to 556) | RR 0.95 (0.84 to 1.08) | 943 (3 RCTs) | ⊕⊕⊝⊝ | |
| Miscarriage rate | pooled | 76 per 1000 | 149 per 1000 (71 to 289) | Peto odds ratio 2.14 (0.93 to 4.95) | 282 (2 RCTs) | ⊕⊕⊝⊝ | |
| *The risk in the intervention group (and its 95% CI) is based on the assumed risk in the comparison group and the relative effect of the intervention (and its 95% CI). | |||||||
| GRADE Working Group grades of evidence | |||||||
| 1 Very serious risk of bias, downgraded by 2 levels: high risk or unclear risk of bias for allocation concealment, high risk of bias for performance bias due to lack of blinding. | |||||||
| Single compared to multiple embryo transfer in a single cycle following in vitro fertilisation or intracytoplasmic sperm injection | ||||||
| Patient or population: transfer following in vitro fertilisation or intracytoplasmic sperm injection | ||||||
| Outcomes | Anticipated absolute effects* (95% CI) | Relative effect | № of participants | Quality of the evidence | Comments | |
|---|---|---|---|---|---|---|
| Risk with multiple (in a single cycle) | Risk with Single | |||||
| Live birth | 463 per 1000 | 310 per 1000 | RR 0.67 | 1904 | ⊕⊕⊝⊝ | |
| Multiple pregnancy | 151 per 1000 | 28 per 1000 | Peto odds ratio 0.16 | 1952 | ⊕⊕⊕⊝ | |
| Clinical pregnancy | 547 per 1000 | 383 per 1000 (350 to 421) | RR 0.70 (0.64 to 0.77) | 1860 (10 RCTs) | ⊕⊕⊝⊝ | |
| Miscarriage rate | 72 per 1000 | 69 per 1000 (46 to 99) | Peto odds ratio 0.96 (0.66 to 1.42) | 1560 (7 RCTs) | ⊕⊕⊝⊝ | |
| *The risk in the intervention group (and its 95% CI) is based on the assumed risk in the comparison group and the relative effect of the intervention (and its 95% CI). | ||||||
| GRADE Working Group grades of evidence | ||||||
| 1 Very serious risk of bias, downgraded by 2 levels: unclear or high risk for allocation concealment, high risk for performance bias due to lack of blinding in majority of the included studies. | ||||||
Background
Description of the condition
Historically, in an effort to achieve 'acceptable' pregnancy rates, most women undergoing in vitro fertilisation (IVF) and intracytoplasmic sperm injection (ICSI) have received transfer of multiple embryos. This practice results in high rates of multiple pregnancy, however, leading to poor clinical outcomes for the mother, her children or both (ASRM 2012).
In the 1990s it was calculated that women undergoing assisted reproductive technology (ART) had an approximately 20‐fold increased risk of twins and 400‐fold increased risk of higher order pregnancies (Martin 1998). In 2014, twins accounted for nearly 17% of all live births resulting from ART in Europe (De Geyter 2018). Widespread concern about the medical, social and economic consequences of multiple pregnancy has prompted the development of strategies aimed at promoting birth of a single healthy baby following ART (ESHRE 2000).
Compared with singleton births, twins have a four‐fold increased risk of perinatal mortality, and for triplets the risk is increased six‐fold (ESHRE 2000). An earlier study of 50,258 births following IVF and ICSI pregnancies reported that twins accounted for half the total neonatal deaths and one‐third of the perinatal deaths (Sullivan 2012). Twins had a significantly higher perinatal mortality rate compared to singletons (27.8 per 1000 births and 12.4 per 1000 births, respectively). The relatively high congenital malformation rates observed in babies born after IVF and ICSI are attributed to the high proportion of multiple births in this population (Sebire 2000 [pers comm]; Wennerholm 2000). In babies with very low birth weight, twin gestation is an independent risk factor for neurodevelopmental impairment including cerebral palsy, severe bilateral hearing loss and bilateral blindness (Wadhawan 2009).
Twin pregnancy also increases the risk of obstetric complications, with a high incidence of miscarriage, pregnancy‐induced hypertension, gestational diabetes, premature labour and abnormal delivery (FIVNAT 1995; ESHRE 2000). After the initial sense of achievement of parenthood, the care of children from a multiple gestation is often associated with practical difficulties and high stress levels (Garel 1992; Doyle 1996; Garel 1997). More hours per week are required to care for six‐month‐old triplets and to carry out the necessary household tasks. Even in families with material resources and plenty of help, emotional stress is not uncommon and may necessitate psychiatric help (Garel 1997).
The economic impact of multiple pregnancies on health services is another consideration. In an Australian study, the average cost of ART twin delivery was almost three times as high as for an ART singleton, while for higher order multiple births the cost was up to 11 times greater (Chambers 2007). It has been suggested that redeployment of money saved by reduction of multiple pregnancies could allow for increased provision of ART treatment in the UK at no extra cost (Ledger 2006).
Description of the intervention
IVF or ICSI is followed by the transfer of one or multiple (usually between two to four) fresh or frozen and thawed embryos within the uterine cavity. Surplus embryos can be frozen and transferred in a subsequent natural or hormone‐stimulated transfer cycle.
There is a worldwide trend for an increase in the rates of elective single embryo transfer, defined as the transfer of a single embryo, chosen from a larger number of available embryos, at cleavage or blastocyst stage. In Europe in 2014, about 35% of all embryo transfers were of single embryos but much higher rates are reported in some countries (80% in Sweden in 2014, and 89% in Australia and New Zealand in 2017) (Australia New Zealand ART data 2017; De Geyter 2018).
Embryos are often transferred after culture for two or three days, when they contain two to eight cells (cleavage stage). The rationale for cleavage‐stage transfer is that the uterus is the best environment for the survival of the embryo (Laverge 2001). Over the past decade there has been a shift in practice to the transfer of embryos on day five or six, when they have developed into blastocysts. Blastocyst transfer has been shown to be successful (Papanikolaou 2006; Khalaf 2008); it requires laboratory expertise and experience in extended embryo culture. An advantage of blastocyst transfer is that embryos surviving five days are more likely to be viable than embryos at two or three days, and so the likelihood of implantation is higher. Disadvantages of blastocyst transfer include a higher risk of cycles being cancelled (Marek 1999); and fewer embryos being available for cryopreservation due to arrested embryo progression.
A Cochrane Review comparing cleavage‐stage versus blastocyst transfer reported that blastocyst transfer was associated with a small but significant increase in the live birth rate per couple (Glujovsky 2016). There was no significant difference between the cleavage versus blastocyst stage in rates per couple of cumulative pregnancy following fresh and frozen‐thawed transfer after one oocyte retrieval. Multiple birth rates did not differ between the two groups.
How the intervention might work
A strategy of reducing the risk of multiple pregnancy by limiting the number of embryos transferred needs to be balanced against the risk of jeopardising the overall pregnancy rate. An obvious solution is to consider an individualised embryo transfer policy based on identification of key clinical and laboratory parameters associated with a higher implantation rate.
A study from Germany found no significant difference in pregnancy rates following elective transfer of two and three embryos (22% vs. 22.5%) (Ludwig 2000). The multiple pregnancy rates were 16.1% and 24% following two and three embryos transfer, respectively. In a study which used a donor oocyte recipient model, the pregnancy rates (57.8% vs. 55.8%) were comparable following transfer of two and three embryos (Licciardi 2001). The multiple pregnancy rates were 40.5% and 51% following two and three embryos, respectively.
Use of elective single embryo transfer at the cleavage stage (day two or three) has been limited in clinical practice for fear that the overall success rates of ART would decline. This assumption has been supported by the published results of single embryo transfer where only one embryo was available. Because no opportunity for selection of more suitable embryos exists, the implantation potential of the only available embryo is usually poor, with clinical pregnancy rates of around 10% (FIVNAT 1995; Giorgetti 1995; Preutthipan 1996; Yaron 1997; Lieberman 1998; Westergaard 2000). In a situation where the transferred embryos are the only available embryos, pregnancy rates are unfavourable even for multiple embryo transfer (Ludwig 2000).
A study from Finland reported a 20.2% pregnancy rate in 94 women who had only one embryo available for transfer compared with a rate of 29.7% in women who had multiple embryos available and from which a single high‐quality embryo was selected for transfer. The cumulative pregnancy rate after frozen and thawed embryo transfers in the elective single embryo transfer group was 47.3% per oocyte retrieval. By comparison, the pregnancy rate for double embryo transfers was 29.4% per transfer, of which 23.9% were twin pregnancies (Vilska 1999).
Another strategy for reducing multiple pregnancy is multifetal pregnancy reduction. However, this procedure is invasive; can have long term adverse psychological consequences for the potential parents (Berkowits 1996; McKinney 1996); and may be unacceptable to some couples given the attendant ethical and legal issues.
Why it is important to do this review
The National Institute for Health and Care Excellence (NICE) guidelines recommend single embryo transfer (SET) for women aged less than 37 years and no more than two embryos for women aged 37 and beyond (NICE 2013). The American Society of Reproductive Medicine (ASRM) recommends single embryo transfer for women aged less than 38 years and not more than three embryos for women aged 38 to 40 years (ASRM 2017).
In an individual patient data meta‐analysis, authors reported significantly lower live birth rate following fresh elective SET (eSET) compared to double embryo transfer (DET), but the cumulative live births were comparable (McLernon 2010). Similar findings were reported by another systematic review which compared SET versus DET at cleavage stage (Gelbaya 2010). However, success of eSET policy depends on good and reliable cryopreservation programme. Clinicians in Europe have generally accepted the desirability of reducing multiple births by limiting the number of embryos transferred, especially if this can be achieved without unduly reducing live birth rates (Roberts 2011). It is important to find ways to limit the risk of multiple pregnancy without reducing the chance of achieving live birth in couples undergoing ART cycles. This updated systematic review evaluates the effectiveness and safety of different policies for the number of embryos transferred in couples who undergo ART.
Objectives
To evaluate the effectiveness and safety of different policies for the number of embryos transferred in infertile couples undergoing assisted reproductive technology cycles.
Methods
Criteria for considering studies for this review
Types of studies
Published and unpublished randomised controlled trials (RCTs) were eligible for inclusion. We excluded non‐randomised studies (for example studies with evidence of inadequate sequence generation such as alternate days, chart numbers) as they are associated with a high risk of bias. Cross‐over trials were eligible but we planned that only data from the first phase would be included in the meta‐analysis as the cross‐over design is not valid in this context.
Types of participants
Women who underwent embryo transfer following IVF or ICSI treatment for female or male infertility with their own gametes or as oocyte or embryo donation recipients were eligible for inclusion.
Types of interventions
We compared the following interventions.
-
Repeated single embryo transfer versus repeated multiple embryo transfer
-
Repeated single embryo transfer (mixed policies) versus multiple embryo transfer in a single cycle
-
Single versus multiple embryo transfer in a single cycle
-
Double embryo transfer versus more than two embryos transferred
-
Other fresh or frozen cycle comparisons
Mixed policies covered different SET strategies such as two fresh cycles of SET or a single fresh SET followed by transfer of a single frozen embryo in a natural or hormone‐stimulated cycle.
It was required that elective transfer of embryos followed an initial fresh IVF or ICSI treatment using standard protocols for controlled ovarian stimulation, oocyte retrieval under ultrasound guidance, insemination, embryo culture, and transcervical replacement of embryos (cleavage stage or blastocyst) using standard culture medium and catheters for the culture and transfer of embryos respectively.
Studies could (in addition) transfer one or more frozen‐thawed embryos in one or both arms using standard procedures in a natural or hormone‐stimulated cycle.
We excluded studies comparing cleavage‐stage transfer versus blastocyst‐stage transfer.
Types of outcome measures
Primary outcome
(1) Effectiveness: live birth rate per woman or couple, or cumulative live birth rate per woman or couple (in trials with multiple transfers or multiple cycles).
We defined live birth as delivery of a live foetus after 20 completed weeks of gestational age (duration of pregnancy). We counted the delivery of single, twin, or multiple pregnancies as one live birth. Cumulative live birth rate reflects the number of live births following fresh and frozen embryo transfers after a single ART treatment leading to oocyte collection, or (where stated) after multiple ART cycles. It is calculated by dividing the total number of live births in each group by the total number of women randomised in each group. One ART cycle is defined as a single treatment leading to oocyte collection and a fresh embryo transfer or a frozen embryo transfer (where fresh embryo transfer was not performed).
(2) Safety: multiple pregnancy rate per woman or couple. The demonstration of more than one sac with a fetal pole on ultrasound scan defines a multiple pregnancy.
Secondary outcomes
(1) Effectiveness: clinical pregnancy rate per woman or couple.
We defined clinical pregnancy as the presence of a gestational sac on ultrasound scan or confirmation of products of conception by pathological examination in the event of spontaneous miscarriage or ectopic pregnancy.
(2) Safety: miscarriage rate per woman. Miscarriage rate per randomised woman, defined as the spontaneous loss of a clinical pregnancy that occurs before 20 completed weeks of gestation.
Search methods for identification of studies
We searched for all relevant published and unpublished RCTs without language restriction and in consultation with the Cochrane Gynaecology and Fertility Group (CGFG) Information Specialist.
Electronic searches
We searched the following electronic databases:
-
The CGFG's specialised register of controlled trials; searched 16 March 2020, PROCITE platform (Appendix 1);
-
Cochrane Central Register of Studies Online (CENTRAL CRSO); searched 16 March 2020, Web platform (Appendix 2);
-
MEDLINE; searched from 1946 to 16 March 2020, OVID platform (Appendix 3);
-
Embase; searched from 1980 to 16 March 2020, OVID platform (Appendix 4);
-
PsycINFO; searched from 1806 to 16 March 2020, OVID platform (Appendix 5);
-
CINAHL; searched from 1961 to 16 March 2020, EBSCO platform (Appendix 6).
The MEDLINE search was limited by the Cochrane Highly Sensitive Search Strategy filter for identifying randomised trials, which appears in the Cochrane Handbook of Systematic Reviews of Interventions (Version 5.1.0, Chapter 6, 6.4.11) (Higgins 2011). We combined the Embase (OVID platform only) searches with a trial filter developed by the Scottish Intercollegiate Guidelines Network (SIGN) (https://www.sign.ac.uk/what-we-do/methodology/search-filters/).
Other electronic sources of trials included the following.
-
Trials registers for ongoing and registered trials.
-
www.ClinicalTrials.gov;
-
www.who.int/trialsearch/Default.aspx
-
-
OpenGrey for unpublished literature from Europe at www.opengrey.eu.
-
Citation index: Web of Science.
Searching other resources
We handsearched other resources as follows.
-
Conference proceedings: International Federation of Fertility Societies (IFFS), American Society for Reproductive Medicine (ASRM), British Fertility Society (BFS), European Society of Human Reproduction and Embryology (ESHRE) between 1997 and 2020
-
Bibliographies of the identified studies
We personally communicated with experts and investigators in the field to get information on newly planned studies and information on existing embryo transfer policies.
Data collection and analysis
Selection of studies
At least two review authors (including MM and MSK) independently selected trials for inclusion in the review from those identified by the search strategy. They resolved disagreements about study eligibility by discussion with a third author (SB).
Data extraction and management
Three review authors (MM, MSK and RK) independently performed quality assessment and data extraction. They invited the senior review author (SB) to resolve any disagreements by discussion. They sought additional information on trial methodology or trial data from the principal authors of trials which appeared to meet the eligibility criteria but were unclear in aspects of methodology, or where the data were in a form unsuitable for meta‐analysis.
Assessment of risk of bias in included studies
We assessed the included studies for risk of bias using the Cochrane 'Risk of bias' tool to evaluate the following: random sequence generation; allocation concealment; blinding of participants, providers and outcome assessors; completeness of outcome data; selective outcome reporting; and other potential sources of bias. At least three authors (MM, MSK and RK) assessed these six domains. They resolved any disagreements by consensus or by discussion with another author (SB). The assessments are presented in the 'Risk of bias' tables (see Characteristics of included studies).
Measures of treatment effect
All data were dichotomous. We used the numbers of events in the control and intervention groups of each study to calculate the Mantel‐Haenszel risk ratios (RRs) with 95% confidence intervals (CIs). We used Peto odds ratios for outcomes with low event rates. Where outcome data were reported as a percentage of the total number of participants, we included them in the analyses by multiplying the percentage by the total number of participants (n) in that group and dividing by 100.
Unit of analysis issues
The primary analysis was per woman randomised; we included per pregnancy data for the outcome 'miscarriage'. We counted multiple live births (for example twins or triplets) as one live birth event. We planned to include only first‐phase data from cross‐over trials. We did not include 'per cycle' data in tables of comparison but reported them descriptively.
Dealing with missing data
We analysed the data on an intention‐to‐treat basis as far as possible and made attempts to obtain missing data from the original investigators by contacting them by email. We sent reminder emails when we did not get any response to the initial email. We assumed live births or clinical pregnancies would not have occurred in women without a reported outcome.
Assessment of heterogeneity
The authors considered whether the clinical and methodological characteristics of the included studies were sufficiently similar for meta‐analysis to provide a meaningful summary. Clinical heterogeneity in subfertility (such as variations in entry criteria and subtle differences in the treatment used that are important from a clinical aspect) cannot be avoided because most centres use their own protocols which can vary in some aspects. When trials met the inclusion criteria and had performed the same intervention we considered it appropriate to pool their results. Statistical heterogeneity was assessed by inspecting the scatter in the data points and the overlap in their CIs and, more formally, by checking the results of the I² statistic. We took an I² measurement greater than 50% to indicate substantial heterogeneity (Higgins 2011). If we detected substantial heterogeneity, we explored possible explanations in sensitivity analyses. Even when included trials in a comparison group were statistically homogeneous, there were potentially considerable differences in clinical features (clinical heterogeneity). We took these differences into account when analysing and interpreting the pooled results.
Assessment of reporting biases
In view of the difficulty of detecting and correcting for publication bias and other reporting biases, we aimed to minimise their potential impact by ensuring a comprehensive search for eligible studies and by being alert for duplication of data. If there were sufficient studies (preferably more than 10) for the primary outcomes, we planned to use a funnel plot to explore the possibility of small‐study effects (a tendency for estimates of the intervention effect to be more beneficial in smaller studies).
Data synthesis
We combined the data from primary studies using Review Manager 5 (RevMan 5) software to calculate pooled Mantel‐Haenszel RRs and 95% CIs, using a fixed‐effect model, with the following comparisons.
-
Repeated single embryo transfer versus repeated multiple embryo transfer
-
Repeated single embryo transfer (mixed policies) versus multiple embryo transfer in a single cycle
-
Single versus multiple embryo transfer in a single cycle
-
Double embryo transfer versus more than two embryos transferred
-
Other fresh or frozen cycle comparisons
We stratified data by the stage of embryo transfer (cleavage or blastocyst).
We reformatted the comparisons of interest, as above. The choice of repeated single versus repeated multiple embryo transfer as the first comparison of interest reflects the view that a policy of repeated SET may optimise the chance of live birth while minimising the risk of multiple pregnancy (Roberts 2011).
An increase in the odds of a particular outcome, which may be beneficial (for example live birth) or detrimental (for example multiple pregnancy) is displayed graphically in the meta‐analyses to the right of the centre line and a decrease in the odds of an outcome to the left of the centre‐line.
Subgroup analysis and investigation of heterogeneity
If data were available, we planned to conduct subgroup analyses to determine the separate evidence within groups for different prognostic characteristics.
We planned subgroup analysis for the following prognostic factor.
-
Cleavage stage versus blastocyst stage transfer
If we detected substantial heterogeneity, we planned to explore possible explanations in sensitivity analyses. We planned to take any statistical heterogeneity into account when interpreting the results.
Sensitivity analysis
We conducted sensitivity analyses for the primary outcomes to determine whether the conclusions were robust to arbitrary decisions made regarding study eligibility and statistical methods. We considered whether the review conclusions would have differed if:
-
eligibility had been restricted to studies without high or unclear risk of bias in any domain;
-
a random‐effects model had been adopted;
-
the summary effect measure had been odds risk rather than relative risk ratio.
Overall quality of the body of evidence: 'Summary of findings' table
We generated 'Summary of findings' tables using GRADEPro software and Cochrane methods (GRADEpro GDT; Higgins 2011). These tables evaluated the overall quality of the body of evidence for the primary review outcomes for selected comparisons: these were 'Repeated single compared to mixed policies for transfer following in vitro fertilisation or intracytoplasmic sperm injection' and 'Single compared to multiple (in a single cycle) for transfer following in vitro fertilisation or intracytoplasmic sperm injection'.
Items assessed were study limitations (that is risk of bias), consistency of effect, imprecision, indirectness and publication bias. We incorporated judgements about evidence certainty (high, moderate or low) into the reporting of results.
We have used the methods and recommendations described in the Cochrane Handbook for Systematic Reviews of Interventions (Higgins 2011), employing GRADEpro GDT software (GRADEpro GDT). We have justified all decisions to down‐ or upgrade the certainty of evidence using footnotes and have made comments to aid reader's understanding of the review where necessary. Two review authors have independently made decisions about evidence quality, and have resolved any disagreements by discussion.
We included the following outcomes in the 'Summary of findings' tables.
-
Live birth rate per woman randomised
-
Multiple pregnancy rate per woman randomised
-
Clinical pregnancy per woman randomised
-
Miscarriage rate per woman randomised
Results
Description of studies
Results of the search
The search for the previous 2013 update identified 640 articles (including duplicates). Five new studies were included in the previous 2013 update (ASSETT 2003; Gardner 2004; Thurin 2005; ECOSSE 2006; Prados 2015); these were added to the seven studies in the earlier 2009 update (Vauthier‐Brouzes 1994; Gerris 1999; Martikainen 2001; Thurin 2004; Lukassen 2005; Heijnen 2006; van Montfoort 2006). Six studies were excluded (Motta 1998 A & B; Livingstone 2001; Bowman 2004; Elgindy 2011; Guerif 2011; Forman 2012). In addition, two studies excluded from the previous 2009 version of the review were included (Komori 2004; Mostajeran 2006). Finally, 14 trials were included in the previous 2013 update (Vauthier‐Brouzes 1994; Gerris 1999; Martikainen 2001; ASSETT 2003; Gardner 2004; Komori 2004; Thurin 2004; Lukassen 2005; Thurin 2005; ECOSSE 2006; Heijnen 2006; Mostajeran 2006; van Montfoort 2006; Prados 2015). One of the included studies was unpublished data; this is now published in a peer‐reviewed journal (Prados 2015). One study which was awaiting classification in the earlier update was published and is now among included studies for the current update (Clua 2015). Of the two ongoing studies in the previous update, one is completed and we have included it in the current update (Abuzeid 2017); and we have excluded the other completed study (Forman 2012).
2020: the targeted update search resulted in 2230 records. After removing 973 duplicates, we screened a total of 1257 records. Two reviewers independently examined the titles and abstracts and identified 30 records as potentially eligible, and obtained the full text for examination. Among these 30 records, we found two records from a previously excluded study—Forman 2012—and therefore excluded them. We excluded two records arising from Thurin 2009 which had earlier appeared as a companion paper along with one of the included studies—Thurin 2004—in the previous version. We excluded 18 records from 16 studies (Eijkemans 2006; Harrild 2009; Forman 2013; Schoolcraft 2013; Forman 2014; López‐Regalado 2014a; Bensdorp 2015; Zhang 2015; Brabers 2016; Hatırnaz 2016; Rodriguez 2016; Yang 2016; Lao 2017; van Loendersloot 2017; IRCT20141217020351N10; NCT03758833). Two of these excluded studies had a main paper and a companion paper (Bensdorp 2015; Zhang 2015). One of the records was from an included study in the earlier update (Mostajeran 2006). One of the records was the main paper of a study which was already included in the previous update (published as a conference abstract) (Prados 2015). Finally, we included three new studies (six records; one study had a main paper, abstract paper and clinical trial registry record; one more study had a main paper and clinical trial registry record) (López‐Regalado 2014b; Clua 2015; Abuzeid 2017).
For details, see Figure 1.

Study flow diagram.
Included studies
For this update, we added three studies to the 14 included in the earlier update, making a total of 17 included studies. We sought additional information from authors of all the new trials and replies were received from three (López‐Regalado 2014b; Clua 2015; Abuzeid 2017).
See the 'Characteristics of included studies' table.
Study design and setting
We included 17 studies with a total of 2505 participants in the review (Vauthier‐Brouzes 1994; Gerris 1999; Martikainen 2001; ASSETT 2003; Gardner 2004; Komori 2004; Thurin 2004; Lukassen 2005; Thurin 2005; ECOSSE 2006; Heijnen 2006; Mostajeran 2006; van Montfoort 2006; López‐Regalado 2014b; Clua 2015; Prados 2015; Abuzeid 2017). All were randomised parallel‐group trials. Six were multicentre (Martikainen 2001; ASSETT 2003; Thurin 2004; Thurin 2005; ECOSSE 2006; Heijnen 2006). Sample sizes ranged from 23 to 661 women.
Of the four unpublished studies that we have added to the previous update, one was a pilot trial published as part of a PhD dissertation (Thurin 2005). Another, the 'Australian study of single embryo transfer', was stopped early because its implementation immediately and substantially altered consumer decision making: this had the effect of more than tripling rates of elective single embryo transfer during the study period and reducing study participation rates (M Davies, University of Adelaide, personal communication) (ASSETT 2003). A UK trial, known as the 'Efficacy and cost effectiveness of selective single embryo transfer' (ECOSSE) study, was also stopped early due to poor recruitment (ECOSSE 2006). The fourth unpublished study was finally published and we have included it in the current update (Prados 2015).
Eleven studies reported their funding sources. Seven reported non‐commercial funding (Gerris 1999; ASSETT 2003; ECOSSE 2006; Mostajeran 2006; van Montfoort 2006; López‐Regalado 2014b; Prados 2015); and four reported pharmaceutical company funding (Gardner 2004; Thurin 2004; Thurin 2005; Abuzeid 2017).
Participants
Study inclusion criteria differed with regard to participant age. Most studies had a maximum age threshold. This varied across studies and included 34 years (Gerris 1999), 35 years (Vauthier‐Brouzes 1994; Lukassen 2005; Abuzeid 2017), 36 years (Thurin 2004), 38 years (ECOSSE 2006; López‐Regalado 2014b; Prados 2015), and 40 years (ASSETT 2003). One study included women aged between 38 and 45 years (Heijnen 2006); while another required them to be at least 36 years old (Thurin 2005). Other studies used a variety of age limits (Martikainen 2001; van Montfoort 2006). One of the studies included oocyte donation cycles only and recipients' ages were between 18 and 50 years (Clua 2015).
Two studies only included women in their first treatment cycle (Gerris 1999; van Montfoort 2006); while four included women with an indication for IVF or ICSI either for the first time or after a previous successful treatment (Vauthier‐Brouzes 1994; Lukassen 2005; Heijnen 2006; López‐Regalado 2014b). Five studies included women in their first or second IVF or ICSI treatment cycle (ASSETT 2003; Thurin 2004; Thurin 2005; Clua 2015; Abuzeid 2017). In a multicentre study, one centre included women in their first treatment cycle only and another centre included women in their first or second cycle (Martikainen 2001). One study included all women undergoing IVF and embryo transfer who agreed to participate (Gardner 2004).
The duration of infertility was mentioned in eight studies (Gerris 1999; Thurin 2004; Lukassen 2005; Thurin 2005; Heijnen 2006; van Montfoort 2006; López‐Regalado 2014b; Abuzeid 2017); and nine mentioned the indication(s) for treatment (Martikainen 2001; Thurin 2004; Lukassen 2005; Thurin 2005; Heijnen 2006; Mostajeran 2006; van Montfoort 2006; López‐Regalado 2014b; Abuzeid 2017). See 'Prognostic factors' in Table 1.
| Study author and year | Age Eligibility criteria (mean participant age, where stated) | Duration of infertility | Previous failed cycle | Frozen cycles | Prim/Sec infertility | FSH | Quality of embryo |
|---|---|---|---|---|---|---|---|
| Under 38 years (mean age 33) | Mean 2.6 to 3.2 years | First IVF/ICSI cycle. | Frozen cycles included | Not stated | Not stated | Good | |
| less than 34 years | Average duration of infertility 3.5 years. | First IVF/ICSI cycle. | Not included | Unclear | Not mentioned | Good | |
| 38 to 45 years (mean age 41) | Average duration of infertility in DET group was 3.7(± 2.5) and in TET group was 3.2(± 2.4) years | First cycle and previous successful cycle | Not included | Yes | Not mentioned | Good | |
| Not stated | Not stated | Not stated | Not stated | Not stated | Not stated | Good | |
| < 35 years (mean age 30 to 31) | Not stated | First IVF/ICSI cycle or after previous successful cycle . | Not included | Yes | FSH < 10IU/L. | Good | |
| various, no age criteria, ranged between 22 to 40 years (mean age 31) | Not stated | women who had / not had more than 1 previous failed treatment. | Frozen cycles included | Yes, but not mentioned | Not mentioned | good | |
| Not stated | Not stated | Not stated | Not stated | Not stated | Not stated | Good | |
| < 36 years (mean age 31) | 0 to 12 years | First or second IVF cycle | Frozen cycles included | Yes | Not mentioned | Good, blastocysts included | |
| Unpublished trial, pilot study, part of a thesis | ≥ 36 years | 0 to 12 years | First or second IVF/ICSI cycle | Frozen cycles included | Yes | Not mentioned | At |
| Various ages, no criteria (mean age 33) | SET‐ 3.3 ± 1.8, DET‐ 3.3 ± 2.1 years | First IVF cycle | Not included | Yes | Not mentioned | Good | |
| ≤ 35 years | Not mentioned | First or previous successful cycle | Frozen cycles included | Yes | Not mentioned | good | |
| unpublished trial | Female age < 35 if no previous ART pregnancy, < 40 if | Not mentioned | First or previous successful cycle | Frozen cycles included | Yes | Not mentioned | At least 4 good‐quality |
| unpublished trial | ≤ 37 years | Not mentioned | First or second cycle of treatment | Frozen cycles included | Yes | Not mentioned | 4 or more good quality embryos available at the time of embryo transfer |
| < 35 years | SET ‐ 2.6 ± 1.6 years DET ‐ 3.2 ± 2.4 years | No more than 1 previous ART failure | Frozen cycles performed but not included in the analysis | Yes | Mentioned | At least 2 good‐quality blastocysts were available, | |
| oocyte donor recipients aged 18‐50 years | not mentioned | Undergoing first or second synchronised oocyte donation cycle | Frozen cycles performed but not included in the analysis | Not mentioned | Not mentioned | Minimum of 5 embryos with at least 2 good‐quality embryos on day 3 after oocyte retrieval | |
| < 38 years | SET ‐ 3.1 ± 1.1 DET ‐ 3.1 ± 1.0 | First or second cycle with previous attempt with positive pregnancy test | Frozen cycles included | Not mentioned | Not mentioned | good |
Two studies did not provide details of participant characteristics (Komori 2004; Mostajeran 2006).
Interventions
All the studies included embryo transfer after fresh IVF or ICSI cycles; and three studies included frozen cycles administered to one or both groups (Thurin 2004; Thurin 2005; López‐Regalado 2014b). Several other studies also administered frozen cycles during follow‐up but not as part of the randomised comparison (Vauthier‐Brouzes 1994; Martikainen 2001; ECOSSE 2006; Prados 2015; Clua 2015; Abuzeid 2017).
Interventions in the included studies were as follows.
-
One fresh single embryo transfer (SET) plus one frozen embryo transfer (1FET) in a natural or hormone‐stimulated cycle compared with one fresh cycle of double embryo transfer (DET) (Thurin 2004; Thurin 2005; López‐Regalado 2014b)
-
Two fresh cycles of SET compared with one fresh cycle of DET (Lukassen 2005)
-
One fresh cycle of SET plus multiple cycles of frozen DET compared with one cycle of fresh DET plus multiple cycles of frozen DET (ECOSSE 2006)
-
One fresh cycle of SET compared with one fresh cycle of DET (Gerris 1999; Martikainen 2001; ASSETT 2003; Gardner 2004; van Montfoort 2006; Clua 2015; Prados 2015; Abuzeid 2017)
-
One fresh cycle of DET compared with one fresh cycle of triple embryo transfer (TET) (Heijnen 2006);
-
Fresh or frozen DET compared with fresh or frozen TET, multiple cycles (Komori 2004)
-
Two fresh cycles of DET compared to two fresh cycles of TET (Heijnen 2006)
-
Three fresh cycles of DET compared to three fresh cycles of TET (Heijnen 2006)
-
Fresh DET compared with fresh TET where the number of cycles used was unclear (Mostajeran 2006)
-
One fresh cycle of DET compared with one fresh cycle of four embryo transfer (FET) (Vauthier‐Brouzes 1994)
One study reported only 'per cycle' data (Komori 2004). There was a large disparity between the number of women (169) and the number of cycles (212), and it was unclear how many women were included in each group. The data from this study were therefore unusable.
Four studies that randomised women to more than one embryo transfer cycle reported interim data after the first fresh cycle of SET versus DET (Thurin 2004; Lukassen 2005; Thurin 2005; ECOSSE 2006). In the case of ECOSSE 2006, these were the only data available, as the trial was stopped due to poor recruitment and data were only available for the first cycle (i.e. fresh DET versus fresh SET).
Protocols for ovarian stimulation, oocyte recovery and embryo transfer were clearly described in 12 studies (Vauthier‐Brouzes 1994; Gerris 1999; Martikainen 2001; Thurin 2004; Lukassen 2005; Thurin 2005; Heijnen 2006; van Montfoort 2006; López‐Regalado 2014b; Clua 2015; Prados 2015; Abuzeid 2017). Good‐quality embryos were transferred in all studies, usually at cleavage stage. However, in four studies all or some women had embryos transferred at blastocyst rather than cleavage stage; this applied to a small number of women in two studies (Thurin 2004; Thurin 2005), half the women in one study (Prados 2015), and all women in another study (Gardner 2004). The stage of embryo transfer was not mentioned in one study (Mostajeran 2006).
Natural progesterone was used for luteal phase support in most cases (Gerris 1999; Martikainen 2001; Gardner 2004; Thurin 2004; Lukassen 2005; Thurin 2005; Heijnen 2006; van Montfoort 2006; Clua 2015; Prados 2015; Abuzeid 2017). One study used both human chorionic gonadotropin (HCG) and natural progesterone for luteal phase support (Vauthier‐Brouzes 1994).
Outcomes
Primary outcomes
1. Live birth rate and cumulative live birth rate
Fourteen studies reported live birth rate per couple (Vauthier‐Brouzes 1994; Gerris 1999; Martikainen 2001; ASSETT 2003; Thurin 2004; Lukassen 2005; Thurin 2005; ECOSSE 2006; Heijnen 2006; van Montfoort 2006; López‐Regalado 2014b; Clua 2015; Prados 2015; Abuzeid 2017). One reported 'take home baby' per cycle only (Komori 2004).
Six studies reported cumulative live birth rates (ASSETT 2003; Thurin 2004; Lukassen 2005; Thurin 2005; Heijnen 2006; López‐Regalado 2014b).
2. Multiple pregnancy rate per woman or couple
All but one study reported multiple pregnancy rate per couple. One reported multiple pregnancy per cycle only (Komori 2004).
Secondary outcomes
1. Clinical pregnancy rate
Thirteen studies reported pregnancy rate per couple (Vauthier‐Brouzes 1994; Gerris 1999; Martikainen 2001; Gardner 2004; Thurin 2004; Lukassen 2005; Heijnen 2006; Mostajeran 2006; van Montfoort 2006; López‐Regalado 2014b; Prados 2015; Clua 2015; Abuzeid 2017).
2. Miscarriage rate per woman
Six studies reported miscarriage rate (Martikainen 2001; Lukassen 2005; van Montfoort 2006; López‐Regalado 2014b; Clua 2015; Abuzeid 2017).
Excluded studies
See Characteristics of excluded studies.
We excluded 31 studies from the review for the following reasons.
-
Seven studies were not randomised (Bowman 2004; van Montfoort 2005; Moustafa 2008; Guerif 2011; López‐Regalado 2014a; Hatırnaz 2016; Lao 2017).
-
Eighteen studies did not report a comparison of interest (Staessen 1993; Gardner 1998; Motta 1998 A & B; Livingstone 2001; Frattarelli 2003; Levitas 2004; Pantos 2004; Heijnen 2007; Thurin 2009; Elgindy 2011; Forman 2012; Forman 2013; Forman 2014; Bensdorp 2015; Zhang 2015; Yang 2016; IRCT20141217020351N10; NCT03758833).
-
Six studies were reviews, costs analysis and methodological studies (Eijkemans 2006; Harrild 2009; Schoolcraft 2013; Brabers 2016; Rodriguez 2016; van Loendersloot 2017).
Risk of bias in included studies
See Characteristics of included studies; Figure 2; Figure 3.

Methodological quality graph: review authors' judgements about each methodological quality item presented as percentages across all included studies.

Methodological quality summary: review authors' judgements about each methodological quality item for each included study.
Allocation
Generation of random sequence
Thirteen studies were at low risk of bias related to random sequence generation (Gerris 1999; Martikainen 2001; ASSETT 2003; Gardner 2004; Thurin 2004; Lukassen 2005; Thurin 2005; ECOSSE 2006; Heijnen 2006; Lopez 2014a; Clua 2015; Prados 2015; Abuzeid 2017). Four studies did not describe their randomisation methods and were therefore at unclear risk of this bias (Vauthier-Brouzes 1994; Komori 2004; Mostajeran 2006; van Montfoort 2006).
Allocation concealment
Six studies were at low risk of bias related to allocation concealment. They used sealed opaque envelopes (ASSETT 2003; Abuzeid 2017),remote allocation (ECOSSE 2006; Heijnen 2006; Prados 2015) or used concealed allocation created by statistical unit (Clua 2015). In the other 10 studies a satisfactory method of allocation concealment was not described clearly enough or no information was given, and we therefore rated the risk of this bias as unclear (Gerris 1999; Martikainen 2001; ASSETT 2003; Gardner 2004; Thurin 2004; Lukassen 2005; Thurin 2005; Lopez 2014a; Clua 2015; Abuzeid 2017). One study was considered to be at high risk for selection bias since the embryologist had access to randomisation numbers (Lopez 2014a).
Blinding
We rated five trials at low risk of performance and detection bias related to blinding, as neither the patient nor physician knew whether one embryo or two embryos had been transferred (ASSETT 2003; Thurin 2004; Thurin 2005; ECOSSE 2006; van Montfoort 2006). Four studies were unblinded (Lukassen 2005; Prados 2015; Clua 2015; Abuzeid 2017); and the others did not mention blinding. We rated these 12 studies at high risk of performance bias as lack of blinding could potentially influence clinicians behaviour and affect outcomes such as live birth and clinical pregnancy rates (Vauthier‐Brouzes 1994; Gerris 1999; Martikainen 2001; Gardner 2004; Komori 2004; Lukassen 2005; Heijnen 2006; Mostajeran 2006; López‐Regalado 2014b; Prados 2015; Clua 2015; Abuzeid 2017). However, we categorised these 12 studies as low risk of detection bias since all the outcomes were objective in nature.
Incomplete outcome data
We rated 12 studies as at low risk of this bias as they included all randomised women in the analysis (Gerris 1999; Martikainen 2001; ASSETT 2003; Thurin 2004; Lukassen 2005; Thurin 2005; ECOSSE 2006; Heijnen 2006; van Montfoort 2006; Lopez 2014a; Clua 2015; Prados 2015). We also categorised another study at low risk for attrition bias as authors reported withdrawal of only one randomised women among 50 randomised in the intervention group (n = 49 in intervention group versus n = 50 in control group) (Abuzeid 2017). We rated three studies as at unclear risk of this bias because it was unclear how many women were included in the analysis (Vauthier-Brouzes 1994; Gardner 2004; Komori 2004). We rated one study at high risk of this bias because it was unclear how many women were randomised: women non‐compliant with the drug regimen or who had ovarian hyperstimulation syndrome (numbers not stated) were excluded and three women with ectopic pregnancy were also excluded from the analysis (Mostajeran 2006) .
Selective reporting
We judged 14 studies to be at low risk of this bias. We deemed three studies to be at unclear risk of this bias: two studies that did not report live birth (Gardner 2004; Mostajeran 2006); and one study which only reported 'per cycle' data (Komori 2004).
Other potential sources of bias
We judged three studies to be at low risk of other potential biases (Heijnen 2006; López‐Regalado 2014b; Lukassen 2005); and 12 at unclear risk. We deemed two studies to be at high risk for other sources of bias (Prados 2015; Abuzeid 2017). One study gave women the option of changing the number of embryos transferred or the day of transfer if they were unhappy with the group to which they were randomised (Prados 2015). A large number of participants (21%) chose to change, including 36% of women in the SET groups who changed to DET. Although the study was analysed by 'intention to treat', the results were deemed to be at high risk of bias due to the high level of non‐compliance and the fact that nearly all the changes were in the same direction. In another study, the proportion of top‐quality blastocysts were significantly higher in one group (Abuzeid 2017). This could potentially influence the outcomes and we categorised the study to be at high risk for other potential source of bias. Further, the planned sample size was 200 (according to trial registry information), but only 100 women were randomised.
Effects of interventions
See: Summary of findings 1 Repeated single embryo transfer (mixed policies) versus multiple embryo transfer in a single cycle of IVF or ICSI; Summary of findings 2 Single compared to multiple embryo transfer in a single cycle following IVF or ICSI
The results below are formatted by type of comparison, as follows.
-
Repeated single embryo transfer versus repeated multiple embryo transfer
-
Repeated single embryo transfer (mixed policies) versus multiple embryo transfer in a single cycle
-
Single versus multiple embryos transfer in a single cycle
-
Double embryo transfer versus more than two embryos transferred
-
Other fresh or frozen cycle comparisons
1. Repeated single embryo transfer versus repeated multiple embryo transfer.
No studies compared repeated single embryo transfer versus repeated multiple transfer.
2. Repeated single embryo transfer (mixed policies) versus multiple embryo transfer in single cycle
Four studies, all of cleavage‐stage transfer, made this comparison (Thurin 2004; Thurin 2005; Lukassen 2005; Lopez 2014a).
Specific interventions were as follows (with the number of cycles in brackets).
-
Single embryo transfer (×2) versus double embryo transfer (×1) (SET (×2) versus DET (×1)) (Lukassen 2005).
-
Single embryo transfer (×1) plus transfer of one frozen‐thawed embryo in a natural or hormone‐stimulated cycle versus double embryo transfer (×1) (SET + 1 FET versus DET (×1)) (Thurin 2004; Thurin 2005; Lopez 2014a).
Primary outcomes
2.1 Cumulative live birth rate
When we pooled the four studies, the cumulative live birth rate after repeated single embryo transfer may be little or no different from the rate after one cycle of DET (RR 0.95, 95% CI 0.82 to 1.10; I² = 0%; 4 studies, 985 women; low‐quality evidence) (Thurin 2004; Lukassen 2005; Thurin 2005; Lopez 2014a). This suggests that for a woman with a 42% chance of live birth following a single cycle of DET, the chance following repeated SET would be between 34% and 46%.
Sensitivity analysis
There were no studies which were at low risk of bias for the outcome. The overall findings did not materially change with the use of a random‐effects model rather than a fixed‐effect model or with use of odds ratio rather than risk ratio.
2.1.1 SET + 1 FET versus DET (×1)
Three studies reported cumulative live birth rates after SET followed by 1 FET versus DET in a single cycle (Thurin 2004; Thurin 2005; Lopez 2014a). There may be little or no difference in cumulative live birth rates following SET + 1 FET versus DET (RR 0.93, 95% CI 0.79 to 1.09; I² = 0%; 3 studies, 878 women; low‐quality evidence).
2.1.2 SET (×2) versus DET (×1)
A single study compared cumulative live birth rate after two fresh cycles of SET versus a single fresh cycle of DET (Lukassen 2005). We are uncertain whether cumulative live birth rate improves following two fresh cycles of SET compared to single fresh cycle of DET (RR 1.14, 95% CI 0.70 to 1.84; 1 study, 107 women; very low quality evidence).
See Analysis 2.1; Figure 4

Forest plot of comparison: 2 Repeated SET (mixed policies) versus multiple ET in a single cycle, outcome: 2.1 Cumulative live birth.
2.2 Multiple pregnancy rate
When the four studies were pooled, the multiple pregnancy rate after repeated single embryo transfer probably reduces compared to a single cycle of DET (Peto odds ratio (OR) 0.13, 95% CI 0.08 to 0.21; I² = 0%; 4 studies, 985 women; moderate‐quality evidence) (Thurin 2004; Lukassen 2005; Thurin 2005; Lopez 2014a). This suggests that for a woman with a 13% risk of multiple pregnancy following a single cycle of DET, the risk following repeated SET would be between 0% and 3%.
Sensitivity analysis
There were no studies which were at low risk of bias for the outcome.
2.2.1 SET + 1 FET versus DET (×1)
Three studies reported multiple pregnancy rates after SET plus 1 FET versus DET in a single cycle (Thurin 2004; Thurin 2005; Lopez 2014a). The multiple pregnancy rate probably reduces following SET + 1 FET versus DET (Peto OR 0.13, 95% CI 0.08 to 0.22; I² = 0%; 3 studies, 878 women; moderate‐quality evidence).
2.2.2 SET (×2) versus DET (×1)
A single study compared the multiple pregnancy rate after two fresh cycles of SET versus a single fresh cycle of DET (Lukassen 2005). We are uncertain whether multiple pregnancy rate reduces following two fresh SET compared to single cycle of DET (Peto OR 0.12, 95% CI 0.03 to 0.54; 1 study, 107 women; very low quality evidence).
See Analysis 2.2; Figure 5

Forest plot of comparison: 2 Repeated SET (mixed policies) versus multiple ET in a single cycle, outcome: 2.2 Multiple pregnancy.
Secondary outcomes
2.3 Clinical pregnancy rate
When data from the three studies reporting this outcome were pooled, the clinical pregnancy rate after repeated single embryo transfer appeared to be little or no different from the rate after one cycle of DET (RR 0.99, 95% CI 0.87 to 1.12; I² = 47%; 3 studies, 943 women; low‐quality evidence) (Thurin 2004; Lukassen 2005; Lopez 2014a). This suggests that for a woman with a 51% chance of clinical pregnancy following a single cycle of DET, the corresponding chance following repeated SET would be between 43% and 56%.
2.3.1 SET + 1 FET versus DET (×1)
Two studies reported the clinical pregnancy rate after SET followed by 1 FET versus DET in a single cycle (Thurin 2004; Lopez 2014a). We found no difference between the groups (RR 0.97 95% CI 0.84 to 1.11; I² = 65%; 2 studies, 836 women). Substantial heterogeneity was noted with no obvious explanation.
2.3.2 Fresh SET (×2) versus DET (×1)
A single study compared the clinical pregnancy rate after two fresh cycles of SET versus a single fresh cycle of DET and did not find a difference between the two groups (RR 1.18, 95% CI 0.81 to 1.71; 1 study, 107 women) (Lukassen 2005).
See Analysis 2.3
2.4 Miscarriage rate per woman randomised
Two studies reported the miscarriage rate after two cycles of SET versus a single fresh cycle of DET (Lukassen 2005; Lopez 2014a). The miscarriage rate after repeated episodes of single embryo transfer may be little or no different from the rate after one cycle of DET (Peto OR 2.14, 95% CI 0.93 to 4.95; I² = 0%; 2 studies, 282 women; low‐quality evidence). This suggests that for a woman with a 8% chance of miscarriage following a single cycle of DET, the chance following repeated SET would be between 7% and 29%.
There was no difference in miscarriage rate per pregnancy between the two groups (Peto OR 1.87, 95% CI 0.77 to 4.53).
2.4.1 SET + 1 FET versus DET (×1)
No difference in miscarriage rate was found after SET followed by 1 FET versus DET in a single fresh cycle (Lopez 2014a) (Peto OR 2.86, 95% CI 0.85 to 9.67; 1 study, 175 women). There was no difference in miscarriage rate per pregnancy between the two groups (Peto OR 2.46, 95% CI 0.70 to 8.68).
2.4.2 Fresh SET (×2) versus DET (×1)
No difference in miscarriage rate was found following two fresh SET versus DET (Lukassen 2005) (Peto OR 1.65, 95% CI 0.52 to 5.23; 1 study, 107 women). There was no difference in miscarriage rate per pregnancy between the two groups (Peto OR 1.44, 95% CI 0.42 to 4.96).
See Analysis 2.4.
3. Single versus multiple embryo transfer in a single cycle
Eleven studies of cleavage‐stage transfer made this comparison (Gerris 1999; Martikainen 2001; ASSETT 2003; Thurin 2004; Lukassen 2005; Thurin 2005; ECOSSE 2006; van Montfoort 2006; Lopez 2014a; Clua 2015; Prados 2015); as did three of blastocyst‐stage transfer (Abuzeid 2017; Gardner 2004; Prados 2015). One study reported both cleavage and blastocyst stage transfers (Prados 2015).
All compared one cycle of single versus one cycle of double embryo transfer (SET (×1) versus DET (×1)). As noted above, for five of these studies the data for this comparison derive from an interim analysis, as women in one or both arms were randomised to undergo further transfer cycles if the first cycle did not result in pregnancy (Thurin 2004; Thurin 2005; Lukassen 2005; ECOSSE 2006; Lopez 2014a). However, the two new studies in the update did not randomise women in two groups following an unsuccessful cycle and all women underwent DET in a subsequent cycle, hence we included only the data from first treatment cycle in the pooled analysis (Abuzeid 2017; Clua 2015).
Primary outcomes
3.1 Live birth rate
Eleven studies of cleavage‐stage transfer and two of blastocyst transfer reported this outcome. See Analysis 3.1; Figure 6.

Forest plot of comparison: 2 Single versus multiple (in a single cycle), outcome: 2.1 Live birth.
When we pooled all studies, low‐quality evidence suggests that the live birth rate per woman may reduce in women who had SET than those who had DET (RR 0.67, 95% CI 0.59 to 0.75; I² = 0%; 12 studies, 1904 women; low‐quality evidence). This suggests that for a woman with a 46% chance of live birth following a single cycle of DET, the chance following a single cycle of SET would be between 27% and 35%.
Sensitivity analysis
There were no studies which were at low risk of bias for the outcome. The overall findings did not materially change with the use of a random‐effects model rather than a fixed‐effect model or with use of odds ratio rather than risk ratio.
Subgroup analysis
We performed subgroup analysis according to stage of transfer (cleavage versus blastocyst stage). It showed no evidence between the subgroups ‒ test for subgroup differences: Chi² = 0.04, df = 1 (P = 0.85), I² = 0%.
3.1.1 SET (×1) versus DET (×1) cleavage stage
These findings applied in comparisons of cleavage‐stage transfer (RR 0.67, 95% CI 0.59 to 0.76; I² = 0%; 11 studies, 1704 women).
3.1.2 SET (×1) versus DET (×1) blastocyst stage
These findings also applied in the comparison of blastocyst transfer (RR 0.65, 95% CI 0.51 to 0.84; I² = 0%; 2 studies, 200 women).
A funnel plot for this outcome was not suggestive of publication bias. See Figure 7

Funnel plot of comparison: 3 Single versus multiple (in a single cycle), outcome: 3.1 Live birth.
3.2 Multiple pregnancy rate
Eleven studies of cleavage‐stage transfer and three of blastocyst transfer reported this outcome. See Analysis 3.2; Figure 8.

Forest plot of comparison: 2 Single versus multiple (in a single cycle), outcome: 2.2 Multiple pregnancy.
When we pooled all studies, moderate‐quality evidence suggests the multiple pregnancy rate per woman probably reduces in those who had SET than those who had DET (Peto OR 0.16, 95% CI 0.12 to 0.22; I² = 0%; 13 studies, 1952 women; moderate‐quality evidence). This suggests that for a woman with a 15% risk of multiple pregnancy following a single cycle of DET, the risk following a single cycle of SET would be between 2% and 4%.
Sensitivity analysis
There were no studies which were at low risk of bias for the outcome.
Subgroup analysis
We performed subgroup analysis according to stage of transfer (cleavage versus blastocyst stage). It showed no evidence between the subgroups ‒ test for subgroup differences: Chi² = 0.09, df = 1 (P = 0.77), I² = 0%.
3.2.1 SET (×1) versus DET (×1) cleavage stage
These findings applied in comparisons of cleavage‐stage transfer (Peto OR 0.16, 95% CI 0.11 to 0.22; I² = 0%; 11 studies, 1704 women).
3.2.2 SET (×1) versus DET (×1) blastocyst stage
These findings also applied in comparisons of blastocyst transfer (Peto OR 0.18, 95% CI 0.09 to 0.36; I² = 58%; 3 studies, 248 women). Heterogeneity in this subgroup analysis appeared to derive from a study at high risk of bias (Prados 2015). Treatment contamination (also known as ‘cross‐over’) occurred in a high proportion of cases in this study and would be expected to attenuate any treatment difference. I² reduced to 0% when this study was excluded from the analyses, without materially affecting the conclusion.
Secondary outcomes
3.3 Clinical pregnancy rate
Eight studies of cleavage‐stage transfer and three of blastocyst transfer reported this outcome. See Analysis 3.3
When we pooled 10 studies, low‐quality evidence suggests that the clinical pregnancy rate per woman may reduce in women who had SET than those who had DET (RR 0.70, 95% CI 0.64 to 0.77; I² = 0%; 10 studies, 1860 women; low‐quality evidence). This suggests that for a woman with a 55% chance of clinical pregnancy following a single cycle of DET, the chance following repeated SET would be between 35% and 42%.
Subgroup analysis
We performed subgroup analysis according to stage of transfer (cleavage versus blastocyst stage). It showed no evidence between the subgroups ‒ test for subgroup differences: Chi² = 0.36, df = 1 (P = 0.55), I² = 0%.
3.3.1 SET (×1) versus DET (×1) cleavage stage
These findings applied in comparisons of cleavage‐stage transfer (RR 0.69, 95% CI 0.62 to 0.78; I² = 19%; 8 studies, 1612 women).
3.3.2 SET (×1) versus DET (×1) blastocyst stage
These findings also applied in comparisons of blastocyst transfer (RR 0.74, 95% CI 0.62 to 0.88; I² = 0%; 3 studies, 248 women).
3.4. Miscarriage rate per woman randomised
Six studies of cleavage‐stage transfer and one of blastocyst transfer reported this outcomes. See Analysis 3.4.
When seven studies were pooled, there may be little or no difference in the miscarriage rate per women between those who had SET and those who had DET (Peto OR 0.96, 95% CI 0.66 to 1.42; I² = 27%; 7 studies, 1560 women; low‐quality evidence). This suggests that for a woman with a 7% chance of miscarriage following a single cycle of DET, the chance following repeated SET would be between 4% and 10%.
The miscarriage rate per pregnancy was higher in SET group compared to DET group (Peto OR 1.62, 95% CI 1.07 to 2.47).
Subgroup analysis
We performed subgroup analysis according to stage of transfer (cleavage versus blastocyst stage). It showed no evidence between the subgroups ‒ test for subgroup differences: Chi² = 0.00, df = 1 (P = 0.96), I² = 0%.
3.4.1 SET (×1) versus DET (×1) cleavage stage
Six studies of cleavage‐stage transfer reported this outcome. We found no difference between the two groups (Peto OR 0.96, 95% CI 0.65 to 1.43; I² = 40%; 6 studies, 1460 women). The miscarriage rate per pregnancy was lower in DET group compared to SET following cleavage stage transfer (Peto OR 1.65, 95% CI 1.06 to 2.56).
3.4.2 SET (×1) versus DET (×1) blastocyst stage
One study of blastocyst stage transfer reported this outcome and there was no difference between the two groups (Peto OR 1.00, 95% CI 0.24 to 4.21; 1 study, 100 women).There was no difference in miscarriage rate per pregnancy blastocysts stage subgroup (Peto OR 1.38, 95% CI 0.32 to 6.06).
4. Double embryo transfer versus more than two embryos transferred
Three studies tested other fresh cycle comparisons. Two were of cleavage‐stage transfer (Vauthier-Brouzes 1994; Heijnen 2006). The day of transfer of the third study was not reported (Mostajeran 2006). Specific interventions were as follows (with the number of cycles in brackets).
-
DET (×1) versus triple embryo transfer (TET) (×1) (Heijnen 2006; Mostajeran 2006)
-
DET (×1) versus four embryo transfer (×1) (Vauthier-Brouzes 1994)
-
DET (×2) versus TET (×2) (Heijnen 2006)
-
DET (×3) versus TET (×3) (Heijnen 2006)
Primary outcomes
4.1 Live birth rate or cumulative live birth rate across single or repeated IVF cycles
4.1.1 DET (×1) versus TET (×1)
We found no difference between the groups in the live birth rate (RR 0.48, 95% CI 0.14 to 1.68; 1 study, 45 women) (Heijnen 2006).
4.1.2 DET (×1) versus four embryo transfer (×1)
We found no difference between the groups in the live birth rate (RR 0.53, 95% CI 0.27 to 1.05; 1 study, 56 women) (Vauthier-Brouzes 1994).
4.1.3 DET (×2) versus TET (×2)
We found no difference between the groups in the cumulative live birth rate after two cycles of DET versus two cycles of TET (RR 0.84, 95% CI 0.37 to 1.92; 1 study, 45 women) (Heijnen 2006).
4.1.4 DET (×3) versus TET (×3)
We found no difference between the groups in the cumulative live birth rate after three cycles of DET versus three cycles of TET (RR 0.86, 95% CI 0.43 to 1.71; 1 study, 45 women) (Heijnen 2006).
See Analysis 4.1.
Sensitivity analysis
There were no studies which were at low risk of bias for the outcome. The overall findings did not materially change with the use of a random‐effects model rather than a fixed‐effect model or with use of odds ratio rather than risk ratio.
4.2 Multiple pregnancy rate
4.2.1 DET (×1) versus TET (×1)
There was lower multiple pregnancy rate in the DET group than in the TET group (Peto OR 0.36, 95% CI 0.14 to 0.93; I² = 0%; 2 studies, 343 women) (Heijnen 2006; Mostajeran 2006).
4.2.2 DET (×1) versus four embryo transfer (×1)
We found no difference between the groups in the multiple pregnancy rate (Peto OR 0.46, 95% CI 0.11 to 1.88; 1 study, 56 women) (Vauthier-Brouzes 1994).
See Analysis 4.2.
Sensitivity analysis
There were no studies which were at low risk of bias for the outcome.
Secondary outcomes
4.3 Clinical pregnancy rate
4.3.1 DET (×1) versus TET (×1)
There was no difference between the groups in the clinical pregnancy rate (RR 0.75, 95% CI 0.53 to 1.06; 2 studies, 343 women) (Heijnen 2006; Mostajeran 2006).
4.3.2 DET (×1) versus four embryo transfer (×1)
We found no difference between the groups in the clinical pregnancy rate (RR 0.76, 95% CI 0.47 to 1.26; 1 study, 56 women) (Vauthier-Brouzes 1994).
See Analysis 4.3
4.4 Miscarriage rate
No studies reported this outcome.
5. Other fresh or frozen cycle comparisons
One study of cleavage‐stage transfer compared DET versus TET among 169 participants (Komori 2004). A total of 106 cycles of fresh or frozen embryos were apparently administered in each group, but study reporting was unclear and, moreover, outcomes were reported per cycle rather than per woman. Attempts to contact the authors were unsuccessful. Study findings were reported descriptively below.
Primary outcomes
5.1 Cumulative live birth rate
5.1.1 DET versus TET, apparently using fresh or frozen embryos for multiple cycles
We found no difference between the groups for this outcome using 'per cycle' data (30 versus 26 live births resulting from 106 cycles in each group) (Komori 2004).
5.2 Multiple pregnancy rate
5.2.1 DET versus TET, apparently using fresh or frozen embryos for multiple cycles
There was a lower incidence of multiple births per pregnancy in the DET group (6/40 pregnancies versus 14/29 pregnancies) (Komori 2004).
Secondary outcomes
5.3 Clinical pregnancy rate
5.3.1 DET versus TET, apparently using fresh or frozen embryos for multiple cycles
We found no difference between the groups for this outcome using 'per cycle' data (40 versus 29 pregnancies resulting from 106 cycles in each group) (Komori 2004).
5.4 Miscarriage rate
This outcome was not reported.
Discussion
Summary of main results
The main finding of this updated systematic review is that low‐quality evidence indicates that live birth rate (LBR) may be reduced by a strategy of elective single embryo transfer (SET) when compared to double embryo transfer (DET) in a single fresh assisted reproductive technology (ART) cycle. We observed the reduced LBR following SET compared to DET in subgroups of women receiving cleavage stage as well as blastocyst stage transfer. The risk of multiple pregnancy is probably lower following SET compared to DET and the quality of evidence was moderate (summary of findings Table 2). The clinical pregnancy rate per woman may be lower in those who had SET in comparison with those who had DET in a single fresh ART cycle. There may be little or no difference in the miscarriage rate per women between those who had SET and those who had DET.
After pooling of four studies of cleavage‐stage transfer, low‐quality evidence suggests that the cumulative live birth rate after repeated single embryo transfers (either SET followed by transfer of a single frozen embryo in a natural or hormone‐stimulated cycle, or two fresh cycles of SET) may be no different from that after a single cycle of DET (summary of findings Table 1). For a typical clinic with a 42% chance of live birth following a single cycle of DET, the live birth rate following repeated SET would be between 34% and 46%. Moderate‐quality evidence suggests that the multiple pregnancy rate after repeated single embryo transfer is probably lower in comparison with that after a single cycle of DET. This suggests that for a woman with a 13% risk of multiple pregnancy following a single cycle of DET, the risk following repeated SET would be between 0% and 3%. There may be little or no difference in clinical pregnancy and miscarriage rates after consecutive SETs compared to the rates after one cycle of DET.
Three studies of cleavage‐stage transfer of fresh embryos compared outcomes following DET versus three or four embryos. There was no difference in live birth rates following a single ART cycle, but the DET group was found to have lower multiple pregnancy rates compared to the three embryo transfer (TET) group. The cumulative live birth rate did not differ between the two groups following two and three ART cycles. The clinical pregnancy rate also did not differ between the two groups.
Most of the evidence currently available is from a cohort of younger women (aged less than 35 years) with a good prognosis.
Overall completeness and applicability of evidence
No studies compared repeated single versus repeated multiple embryo transfer within the same ART cycle. This comparison was planned in one study but the study was closed due to poor enrolment, with only 23 participants (ECOSSE 2006). This comparison would be a useful way to structure future trials in order to determine the safety and effectiveness of different embryo transfer policies, given that a number of embryos have been produced. Policy in this context means the strategy for using up the available embryos until success is achieved or the supply of embryos is exhausted. A comparison of repeated multiple‐ versus repeated single‐embryo transfer would address the policy question by determining ‘cumulative’ success rates.
The vast majority of participants in the studies included in the current and previous versions of the review had a good prognosis (aged under 36 years and with sufficient good‐quality embryos). Only two small studies focused on older women (Thurin 2005; Heijnen 2006). One of the studies noted a potential for bias, as only a small proportion of older women volunteered for the trial, probably due to a preference for double embryos or twins, or both (Gardner 2004). Future studies should include older women and those with previously failed IVF cycles or lack of good‐quality embryos.
Per cycle, DET appears to be more expensive than SET (Tiitinen 2001; Gerris 2004; Thurin 2006; Chambers 2007; Fiddelers 2007). The higher cost is mainly due to the increased rate of multiple births and premature births in the DET group, and fewer pregnancies in the SET group. Long‐term costs related to multiple births and prematurity in the DET group have not yet been adequately assessed. A decision tree analysis indicated that the direct health care costs of DET was higher than SET + 1FET across all age groups. In women under 32 years, DET was less effective (a lower live birth rate) and more expensive than SET + 1FET. For women aged 32 and over, DET was more effective (a higher live birth rate) but still more expensive than SET + 1FET (van Loendersloot 2017). Studies have reported an increased risk of 'large for gestational age' (LGA) babies following frozen cycles compared to fresh cycles, hence there is a need to gather long‐term safety data on children born following frozen cycles (Maheshwari 2016; Maheshwari 2018). In order to implement a policy of multiple single embryo transfers per woman, providers require either an efficient cryopreservation service or the ability to provide multiple fresh IVF cycles. The former is likely to be a safer and less invasive option for the women concerned.
Only three studies specifically addressed blastocyst transfer (Gardner 2004; Prados 2015; Abuzeid 2017). There were only two studies comparing DET with three embryo transfer (Heijnen 2006; Mostajeran 2006); and one study comparing DET versus four embryo transfer (Vauthier‐Brouzes 1994). It is unlikely that such trials involving transfer of more than two embryos will be conducted in the future due to unacceptably high risk of multiple births.
Quality of the evidence
This update had five comparisons.
-
Repeated single embryo transfer versus repeated multiple embryo transfer
-
Repeated single embryo transfer (mixed policies) versus multiple embryo transfer in a single cycle
-
Single versus multiple embryo transfer in a single cycle
-
Double embryo transfer versus more than two embryos transferred
-
Other fresh or frozen cycle comparisons
There were no studies reporting comparisons between repeated SET versus repeated multiple embryo transfer. In the comparison between repeated SET versus single cycle of DET, we reported on cumulative live birth, multiple pregnancy, clinical pregnancy and miscarriage rate for studies comparing repeated SET versus single cycle of DET. The quality of evidence for primary outcomes was low to moderate. We downgraded the level of evidence by one or two levels due to unclear or high risk of selection bias due to inadequate description of allocation concealment and high risk of performance bias due to lack of blinding. We considered that awareness of group allotment is likely to influence clinicians' behaviour and performance for live birth and clinical pregnancy outcomes. Substantial statistical heterogeneity was noted for miscarriage rate but there was no obvious explanation. See summary of findings Table 1.
For studies which reported single versus multiple embryo transfer in a single cycle, we reported live birth, multiple pregnancy, clinical pregnancy and miscarriage rate. The overall quality of evidence for main outcomes was low to moderate. We categorised the majority of studies at unclear risk of bias due to inadequate reporting of allocation concealment and at high risk of performance bias due to lack of blinding. We noted substantial statistical heterogeneity for miscarriage rate but there was no obvious explanation. See summary of findings Table 2.
Three studies compared DET versus transfer of three or four embryos. Studies were at unclear risk of bias for inadequate reporting of allocation concealment methodology and at high risk of performance bias due to lack of blinding.
Under the 'other fresh or frozen' comparison, we described the results of one study which compared DET versus three embryo transfer, apparently using fresh or frozen embryos for multiple cycles. Only 'per cycle' data were available.
Potential biases in the review process
The search for the updated review was comprehensive, and included a search for ongoing trials through clinical trial registries. We contacted authors of three new studies asking for clarification about their results and got a satisfactory reply from each one of them.
One of the review authors was a primary investigator of one of the included studies (ECOSSE 2006). Our comparison of one cycle of fresh SET versus one cycle of DET includes data from studies for which this was an interim analysis (Analysis 3.1). This may be a potential source of bias. A post hoc sensitivity analysis excluding these studies did not materially influence the live birth rate in this analysis.
We are unaware of any other potential biases in the review process.
Agreements and disagreements with other studies or reviews
Other studies and reviews are broadly in agreement with the current review.
A project commissioned by the UK National Institutes of Health Research Health Technology Assessment Programme used statistical modelling, analysis of registry and cohort data, and exploration of consumer perspectives to explore options for increasing SET and reducing the incidence of multiple births (Roberts 2011). The analysis concluded that couples have approximately one‐third less chance of a live birth if they have one fresh cycle of SET rather than DET, but that use of repeat cycles using cryopreservation might compensate for the lost potential in each individual transfer while reducing the likelihood of multiple births. However, the authors recognised that a policy of repeat SET (with use of cryopreserved eggs) would involve challenges including appropriate patient selection, optimisation of freezing techniques, and the emotional, financial and physical burden associated with additional treatment cycles.
Earlier systematic reviews (Gelbaya 2010; McLernon 2010) and a report from the American Society for Reproductive Medicine (ASRM 2012) have reached similar conclusions.
A large Dutch cohort study is currently in progress, which aims to assess the long‐term costs and health outcomes of ART singleton and twin children and the long term cost‐effectiveness of SET versus DET strategies. Outcomes were to be reported at 1‐year, 5‐year and 18‐year follow‐up (van Heesch 2010). The investigators have reported 5‐year follow‐up results and found significantly higher hospital costs from birth up to the age of five years following multiple birth compared to singleton birth (van Heesch 2015).
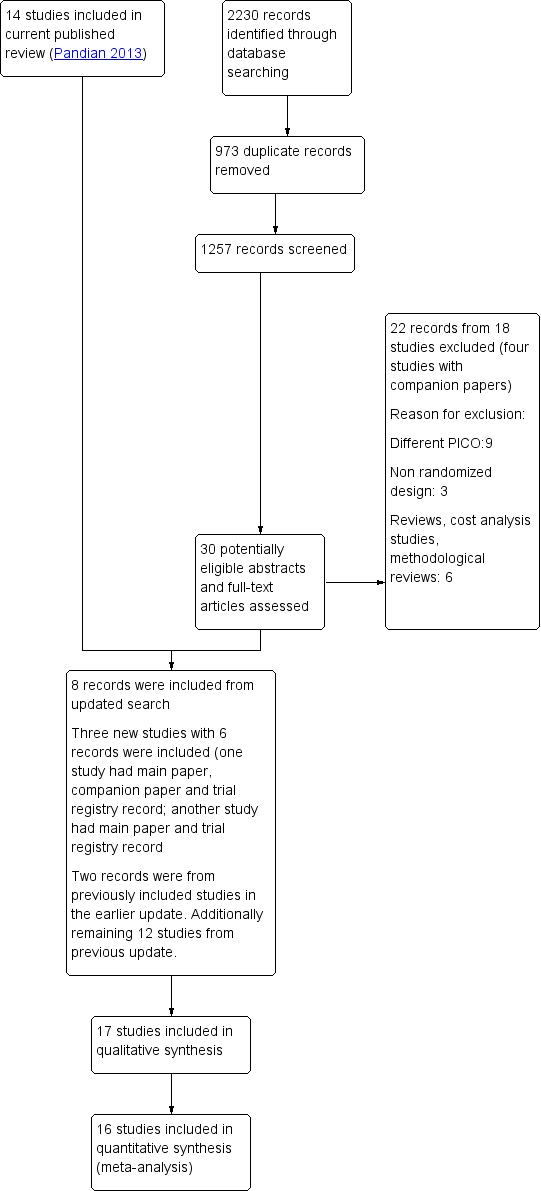
Study flow diagram.

Methodological quality graph: review authors' judgements about each methodological quality item presented as percentages across all included studies.

Methodological quality summary: review authors' judgements about each methodological quality item for each included study.

Forest plot of comparison: 2 Repeated SET (mixed policies) versus multiple ET in a single cycle, outcome: 2.1 Cumulative live birth.

Forest plot of comparison: 2 Repeated SET (mixed policies) versus multiple ET in a single cycle, outcome: 2.2 Multiple pregnancy.

Forest plot of comparison: 2 Single versus multiple (in a single cycle), outcome: 2.1 Live birth.

Funnel plot of comparison: 3 Single versus multiple (in a single cycle), outcome: 3.1 Live birth.

Forest plot of comparison: 2 Single versus multiple (in a single cycle), outcome: 2.2 Multiple pregnancy.

Comparison 2: Repeated SET (mixed policies) versus multiple ET in a single cycle, Outcome 1: Cumulative live birth

Comparison 2: Repeated SET (mixed policies) versus multiple ET in a single cycle, Outcome 2: Multiple pregnancy

Comparison 2: Repeated SET (mixed policies) versus multiple ET in a single cycle, Outcome 3: Clinical pregnancy rate

Comparison 2: Repeated SET (mixed policies) versus multiple ET in a single cycle, Outcome 4: Miscarriage

Comparison 3: Single versus multiple embryo transfer (in a single cycle), Outcome 1: Live birth

Comparison 3: Single versus multiple embryo transfer (in a single cycle), Outcome 2: Multiple pregnancy

Comparison 3: Single versus multiple embryo transfer (in a single cycle), Outcome 3: Clinical pregnancy rate

Comparison 3: Single versus multiple embryo transfer (in a single cycle), Outcome 4: Miscarriage

Comparison 4: Double embryo transfer versus more than two embryos transferred, Outcome 1: Live or cumulative live birth

Comparison 4: Double embryo transfer versus more than two embryos transferred, Outcome 2: Multiple pregnancy

Comparison 4: Double embryo transfer versus more than two embryos transferred, Outcome 3: Clinical pregnancy
| Repeated single embryo transfer (mixed policies) versus multiple embryo transfer in a single cycle of IVF or ICSI | |||||||
| Patient or population: transfer following in vitro fertilisation or intracytoplasmic sperm injection | |||||||
| Outcomes | Anticipated absolute effects* (95% CI) | Relative effect | № of participants | Quality of the evidence | Comments | ||
|---|---|---|---|---|---|---|---|
| Risk with multiple embryo transfer | Risk with repeated single (mixed policies) | ||||||
| Cumulative live birth | pooled | 420 per 1000 | 399 per 1000 | RR 0.95 | 985 | ⊕⊕⊝⊝ | |
| Cumulative live birth | SET + 1 FET versus DET (×1) (cleavage stage) | 421 per 1000 | 392 per 1000 | RR 0.93 | 878 | ⊕⊕⊝⊝ | |
| SET (×2) versus DET (×1) (cleavage stage) | 407 per 1000 | 464 per 1000 | RR 1.14 | 107 | ⊕⊝⊝⊝ | ||
| Multiple pregnancy | pooled | 127 per 1000 | 18 per 1000 | Peto odds ratio 0.13 | 985 | ⊕⊕⊕⊝ | |
| Multiple pregnancy | SET + 1 FET versus DET (×1) (cleavage stage) | 128 per 1000 | 19 per 1000 | Peto odds ratio 0.13 | 878 | ⊕⊕⊕⊝ | |
| SET (×2) versus DET (×1) (cleavage stage) | 111 per 1000 | 15 per 1000 | Peto odds ratio 0.12 | 107 | ⊕⊝⊝⊝ | ||
| Clinical pregnancy rate | pooled | 515 per 1000 | 489 per 1000 (432 to 556) | RR 0.95 (0.84 to 1.08) | 943 (3 RCTs) | ⊕⊕⊝⊝ | |
| Miscarriage rate | pooled | 76 per 1000 | 149 per 1000 (71 to 289) | Peto odds ratio 2.14 (0.93 to 4.95) | 282 (2 RCTs) | ⊕⊕⊝⊝ | |
| *The risk in the intervention group (and its 95% CI) is based on the assumed risk in the comparison group and the relative effect of the intervention (and its 95% CI). | |||||||
| GRADE Working Group grades of evidence | |||||||
| 1 Very serious risk of bias, downgraded by 2 levels: high risk or unclear risk of bias for allocation concealment, high risk of bias for performance bias due to lack of blinding. | |||||||
| Single compared to multiple embryo transfer in a single cycle following in vitro fertilisation or intracytoplasmic sperm injection | ||||||
| Patient or population: transfer following in vitro fertilisation or intracytoplasmic sperm injection | ||||||
| Outcomes | Anticipated absolute effects* (95% CI) | Relative effect | № of participants | Quality of the evidence | Comments | |
|---|---|---|---|---|---|---|
| Risk with multiple (in a single cycle) | Risk with Single | |||||
| Live birth | 463 per 1000 | 310 per 1000 | RR 0.67 | 1904 | ⊕⊕⊝⊝ | |
| Multiple pregnancy | 151 per 1000 | 28 per 1000 | Peto odds ratio 0.16 | 1952 | ⊕⊕⊕⊝ | |
| Clinical pregnancy | 547 per 1000 | 383 per 1000 (350 to 421) | RR 0.70 (0.64 to 0.77) | 1860 (10 RCTs) | ⊕⊕⊝⊝ | |
| Miscarriage rate | 72 per 1000 | 69 per 1000 (46 to 99) | Peto odds ratio 0.96 (0.66 to 1.42) | 1560 (7 RCTs) | ⊕⊕⊝⊝ | |
| *The risk in the intervention group (and its 95% CI) is based on the assumed risk in the comparison group and the relative effect of the intervention (and its 95% CI). | ||||||
| GRADE Working Group grades of evidence | ||||||
| 1 Very serious risk of bias, downgraded by 2 levels: unclear or high risk for allocation concealment, high risk for performance bias due to lack of blinding in majority of the included studies. | ||||||
| Study author and year | Age Eligibility criteria (mean participant age, where stated) | Duration of infertility | Previous failed cycle | Frozen cycles | Prim/Sec infertility | FSH | Quality of embryo |
|---|---|---|---|---|---|---|---|
| Under 38 years (mean age 33) | Mean 2.6 to 3.2 years | First IVF/ICSI cycle. | Frozen cycles included | Not stated | Not stated | Good | |
| less than 34 years | Average duration of infertility 3.5 years. | First IVF/ICSI cycle. | Not included | Unclear | Not mentioned | Good | |
| 38 to 45 years (mean age 41) | Average duration of infertility in DET group was 3.7(± 2.5) and in TET group was 3.2(± 2.4) years | First cycle and previous successful cycle | Not included | Yes | Not mentioned | Good | |
| Not stated | Not stated | Not stated | Not stated | Not stated | Not stated | Good | |
| < 35 years (mean age 30 to 31) | Not stated | First IVF/ICSI cycle or after previous successful cycle . | Not included | Yes | FSH < 10IU/L. | Good | |
| various, no age criteria, ranged between 22 to 40 years (mean age 31) | Not stated | women who had / not had more than 1 previous failed treatment. | Frozen cycles included | Yes, but not mentioned | Not mentioned | good | |
| Not stated | Not stated | Not stated | Not stated | Not stated | Not stated | Good | |
| < 36 years (mean age 31) | 0 to 12 years | First or second IVF cycle | Frozen cycles included | Yes | Not mentioned | Good, blastocysts included | |
| Unpublished trial, pilot study, part of a thesis | ≥ 36 years | 0 to 12 years | First or second IVF/ICSI cycle | Frozen cycles included | Yes | Not mentioned | At |
| Various ages, no criteria (mean age 33) | SET‐ 3.3 ± 1.8, DET‐ 3.3 ± 2.1 years | First IVF cycle | Not included | Yes | Not mentioned | Good | |
| ≤ 35 years | Not mentioned | First or previous successful cycle | Frozen cycles included | Yes | Not mentioned | good | |
| unpublished trial | Female age < 35 if no previous ART pregnancy, < 40 if | Not mentioned | First or previous successful cycle | Frozen cycles included | Yes | Not mentioned | At least 4 good‐quality |
| unpublished trial | ≤ 37 years | Not mentioned | First or second cycle of treatment | Frozen cycles included | Yes | Not mentioned | 4 or more good quality embryos available at the time of embryo transfer |
| < 35 years | SET ‐ 2.6 ± 1.6 years DET ‐ 3.2 ± 2.4 years | No more than 1 previous ART failure | Frozen cycles performed but not included in the analysis | Yes | Mentioned | At least 2 good‐quality blastocysts were available, | |
| oocyte donor recipients aged 18‐50 years | not mentioned | Undergoing first or second synchronised oocyte donation cycle | Frozen cycles performed but not included in the analysis | Not mentioned | Not mentioned | Minimum of 5 embryos with at least 2 good‐quality embryos on day 3 after oocyte retrieval | |
| < 38 years | SET ‐ 3.1 ± 1.1 DET ‐ 3.1 ± 1.0 | First or second cycle with previous attempt with positive pregnancy test | Frozen cycles included | Not mentioned | Not mentioned | good |
| Outcome or subgroup title | No. of studies | No. of participants | Statistical method | Effect size |
| 2.1 Cumulative live birth Show forest plot | 4 | 985 | Risk Ratio (M‐H, Fixed, 95% CI) | 0.95 [0.82, 1.10] |
| 2.1.1 SET + 1 FET versus DET (x1) (cleavage stage) | 3 | 878 | Risk Ratio (M‐H, Fixed, 95% CI) | 0.93 [0.79, 1.09] |
| 2.1.2 SET (x2) versus DET (x1) (cleavage stage) | 1 | 107 | Risk Ratio (M‐H, Fixed, 95% CI) | 1.14 [0.70, 1.84] |
| 2.2 Multiple pregnancy Show forest plot | 4 | 985 | Peto Odds Ratio (Peto, Fixed, 95% CI) | 0.13 [0.08, 0.21] |
| 2.2.1 SET + 1 FET versus DET (x1) (cleavage stage) | 3 | 878 | Peto Odds Ratio (Peto, Fixed, 95% CI) | 0.13 [0.08, 0.22] |
| 2.2.2 SET (x2) versus DET (x1) (cleavage stage) | 1 | 107 | Peto Odds Ratio (Peto, Fixed, 95% CI) | 0.12 [0.03, 0.54] |
| 2.3 Clinical pregnancy rate Show forest plot | 3 | 943 | Risk Ratio (M‐H, Fixed, 95% CI) | 0.99 [0.87, 1.12] |
| 2.3.1 SET + 1 FET versus DET (x1) (cleavage stage) | 2 | 836 | Risk Ratio (M‐H, Fixed, 95% CI) | 0.97 [0.84, 1.11] |
| 2.3.2 SET (x2) versus DET (x1) (cleavage stage) | 1 | 107 | Risk Ratio (M‐H, Fixed, 95% CI) | 1.18 [0.81, 1.71] |
| 2.4 Miscarriage Show forest plot | 2 | 282 | Peto Odds Ratio (Peto, Fixed, 95% CI) | 2.14 [0.93, 4.95] |
| 2.4.1 SET + 1 FET versus DET (x1) (cleavage stage) | 1 | 175 | Peto Odds Ratio (Peto, Fixed, 95% CI) | 2.86 [0.85, 9.67] |
| 2.4.2 SET (x2) versus DET (x1) (cleavage stage) | 1 | 107 | Peto Odds Ratio (Peto, Fixed, 95% CI) | 1.65 [0.52, 5.23] |
| Outcome or subgroup title | No. of studies | No. of participants | Statistical method | Effect size |
| 3.1 Live birth Show forest plot | 12 | 1904 | Risk Ratio (M‐H, Fixed, 95% CI) | 0.67 [0.59, 0.75] |
| 3.1.1 SET (x1) versus DET (x1) (cleavage stage) | 11 | 1704 | Risk Ratio (M‐H, Fixed, 95% CI) | 0.67 [0.59, 0.76] |
| 3.1.2 SET (x1) versus DET (x1) (blastocyst stage) | 2 | 200 | Risk Ratio (M‐H, Fixed, 95% CI) | 0.65 [0.51, 0.84] |
| 3.2 Multiple pregnancy Show forest plot | 13 | 1952 | Peto Odds Ratio (Peto, Fixed, 95% CI) | 0.16 [0.12, 0.22] |
| 3.2.1 SET (x1) versus DET (x1) (cleavage stage) | 11 | 1704 | Peto Odds Ratio (Peto, Fixed, 95% CI) | 0.16 [0.11, 0.22] |
| 3.2.2 SET (x1) versus DET (x1) (blastocyst stage) | 3 | 248 | Peto Odds Ratio (Peto, Fixed, 95% CI) | 0.18 [0.09, 0.36] |
| 3.3 Clinical pregnancy rate Show forest plot | 10 | 1860 | Risk Ratio (M‐H, Fixed, 95% CI) | 0.70 [0.64, 0.77] |
| 3.3.1 SET (x1) versus DET (x1) (cleavage stage) | 8 | 1612 | Risk Ratio (M‐H, Fixed, 95% CI) | 0.69 [0.62, 0.78] |
| 3.3.2 SET (x1) versus DET (x1) (blastocyst stage) | 3 | 248 | Risk Ratio (M‐H, Fixed, 95% CI) | 0.74 [0.62, 0.88] |
| 3.4 Miscarriage Show forest plot | 7 | 1560 | Peto Odds Ratio (Peto, Fixed, 95% CI) | 0.96 [0.66, 1.42] |
| 3.4.1 SET (x1) versus DET (x1) (cleavage stage) | 6 | 1460 | Peto Odds Ratio (Peto, Fixed, 95% CI) | 0.96 [0.65, 1.43] |
| 3.4.2 SET (x1) versus DET (x1) (blastocyst stage) | 1 | 100 | Peto Odds Ratio (Peto, Fixed, 95% CI) | 1.00 [0.24, 4.21] |
| Outcome or subgroup title | No. of studies | No. of participants | Statistical method | Effect size |
| 4.1 Live or cumulative live birth Show forest plot | 2 | Risk Ratio (M‐H, Fixed, 95% CI) | Subtotals only | |
| 4.1.1 DET (x1) versus TET (x1) | 1 | 45 | Risk Ratio (M‐H, Fixed, 95% CI) | 0.48 [0.14, 1.68] |
| 4.1.2 DET (x1) versus four embryo transfer (x1) | 1 | 56 | Risk Ratio (M‐H, Fixed, 95% CI) | 0.53 [0.27, 1.05] |
| 4.1.3 DET (x2) versus TET (x2) | 1 | 45 | Risk Ratio (M‐H, Fixed, 95% CI) | 0.84 [0.37, 1.92] |
| 4.1.4 DET (x3) versus TET (x3) | 1 | 45 | Risk Ratio (M‐H, Fixed, 95% CI) | 0.86 [0.43, 1.71] |
| 4.2 Multiple pregnancy Show forest plot | 3 | Peto Odds Ratio (Peto, Fixed, 95% CI) | Subtotals only | |
| 4.2.1 DET versus TET | 2 | 343 | Peto Odds Ratio (Peto, Fixed, 95% CI) | 0.36 [0.14, 0.93] |
| 4.2.2 DET versus four embryo transfer | 1 | 56 | Peto Odds Ratio (Peto, Fixed, 95% CI) | 0.46 [0.11, 1.88] |
| 4.3 Clinical pregnancy Show forest plot | 3 | Risk Ratio (M‐H, Fixed, 95% CI) | Subtotals only | |
| 4.3.1 DET (x1) versus TET (x1) | 2 | 343 | Risk Ratio (M‐H, Fixed, 95% CI) | 0.75 [0.53, 1.06] |
| 4.3.2 DET (x1) versus four embryo transfer (x1) | 1 | 56 | Risk Ratio (M‐H, Fixed, 95% CI) | 0.76 [0.47, 1.26] |