Número de embriones a transferir después de la fertilización in vitro o de la inyección intracitoplasmática de espermatozoides
Appendices
Appendix 1. Cochrane Gynaecology and Fertility specialised register search strategy
PROCITE platform
Searched 16 March 2020
Keywords CONTAINS "Number of blastocysts" or "number of blastocysts transferred" or "number of embryos" or "number of embryos transferred" or "triple embryos transfer" or "single blastocyst transfer" or "single embryo transfer" or "single vs multiple" or "single vs multiple transfer" or "double embryo transfer" or "triple embryos transfer" or "three embryos transfer" or "SET" or "two embryos" or Title CONTAINS "Number of blastocysts" or "number of blastocysts transferred" or "number of embryos" or "number of embryos transferred" or "triple embryos transfer" or "single blastocyst transfer" or "single embryo transfer" or "single vs multiple" or "single vs multiple transfer" or "double embryo transfer" or "triple embryos transfer" or "three embryos transfer" or "SET" or "two embryos"
AND
Keywords CONTAINS "ivf" or "ICSI" or "subfertility" or Title CONTAINS "ivf" or "ICSI" or "subfertility"
(1250 records)
Appendix 2. CENTRAL Register of Studies Online (CRSO) search strategy
Web platform
Searched 16 March 2020
#1 MESH DESCRIPTOR Embryo Transfer EXPLODE ALL TREES 1072
#2 (Embryo* adj5 Transfer*):TI,AB,KY 3969
#3 (blastocyst* adj5 Transfer*):TI,AB,KY 472
#4 #1 OR #2 OR #3 4087
#5 (one adj2 embryo*):TI,AB,KY 136
#6 (single adj2 embryo*):TI,AB,KY 295
#7 (single adj2 blastocyst*):TI,AB,KY 119
#8 (one adj2 blastocyst*):TI,AB,KY 32
#9 (two adj2 embryo*):TI,AB,KY 238
#10 (double adj2 embryo*):TI,AB,KY 224
#11 (double adj2 blastocyst*):TI,AB,KY 2
#12 (two adj2 blastocyst*):TI,AB,KY 46
#13 (three adj2 embryo*):TI,AB,KY 109
#14 (triple adj2 embryo*):TI,AB,KY 3
#15 (triple adj2 blastocyst*):TI,AB,KY 0
#16 (three adj2 blastocyst*):TI,AB,KY 3
#17 (multiple adj2 blastocyst*):TI,AB,KY 3
#18 (multiple adj2 embryo*):TI,AB,KY 41
#19 (SET or DET or TET):TI,AB,KY 26970
#20 (SBT or DBT or TBT):TI,AB,KY 756
#21 (four adj2 embryo*):TI,AB,KY 39
#22 (four adj2 blastocyst*):TI,AB,KY 1
#23 #5 OR #6 OR #7 OR #8 OR #9 OR #10 OR #11 OR #12 OR #13 OR #14 OR #15 OR #16 OR #17 OR #18 OR #19 OR #20 OR #21 OR #22 28576
#24 #4 AND #23 882
Appendix 3. MEDLINE search strategy
OVID platform
Searched from 1946 to 16 March 2020
1 Embryo Transfer/ (15557)
2 (Embryo$ adj5 Transfer$).tw. (18859)
3 (blastocyst$ adj5 transfer$).tw. (2479)
4 exp embryo, mammalian/ or exp blastocyst/ (93114)
5 or/1‐4 (112678)
6 (two adj2 embryo$).tw. (3566)
7 (double adj2 embryo$).tw. (643)
8 DET.tw. (1117)
9 (three adj2 embryo$).tw. (1944)
10 (triple adj2 embryo$).tw. (45)
11 TET$.tw. (450651)
12 (two adj2 blastocyst$).tw. (273)
13 (double adj2 blastocyst$).tw. (34)
14 (three adj2 blastocyst$).tw. (122)
15 (triple adj2 blastocyst$).tw. (4)
16 DBT.tw. (2494)
17 TBT.tw. (1746)
18 (one adj2 embryo$).tw. (2295)
19 (single adj2 embryo$).tw. (2109)
20 SET.tw. (510321)
21 (one adj2 blastocyst$).tw. (236)
22 (single adj2 blastocyst$).tw. (388)
23 SBT.tw. (2058)
24 (four adj2 embryo$).tw. (962)
25 (four adj2 blastocyst$).tw. (80)
26 FET.tw. (3167)
27 FZET.tw. (0)
28 (multiple$ adj2 embryo$).tw. (727)
29 (multiple$ adj2 blastocyst$).tw. (22)
30 (quadruple adj2 embryo$).tw. (5)
31 (quadruple adj2 blastocyst$).tw. (1)
32 or/6‐31 (972810)
33 5 and 32 (9191)
34 randomized controlled trial.pt. (501858)
35 controlled clinical trial.pt. (93575)
36 randomized.ab. (473201)
37 placebo.tw. (211687)
38 clinical trials as topic.sh. (190393)
39 randomly.ab. (329293)
40 trial.ti. (215152)
41 (crossover or cross‐over or cross over).tw. (83825)
42 or/34‐41 (1305981)
43 exp animals/ not humans.sh. (4678649)
44 42 not 43 (1200138)
45 33 and 44 (479)
Appendix 4. Embase search strategy
OVID platform
Searched from 1980 to 16 March 2020
1 Embryo Transfer/ (29832)
2 (Embryo$ adj5 Transfer$).tw. (29099)
3 (blastocyst$ adj5 transfer$).tw. (4752)
4 exp embryo, mammalian/ or exp blastocyst/ (28866)
5 or/1‐4 (59994)
6 (two adj2 embryo$).tw. (4269)
7 (double adj2 embryo$).tw. (999)
8 DET.tw. (1537)
9 (three adj2 embryo$).tw. (2348)
10 (triple adj2 embryo$).tw. (65)
11 TET$.tw. (473237)
12 (two adj2 blastocyst$).tw. (406)
13 (double adj2 blastocyst$).tw. (102)
14 (three adj2 blastocyst$).tw. (161)
15 (triple adj2 blastocyst$).tw. (5)
16 DBT.tw. (3402)
17 TBT.tw. (2248)
18 (one adj2 embryo$).tw. (3129)
19 (single adj2 embryo$).tw. (3734)
20 SET.tw. (649215)
21 (one adj2 blastocyst$).tw. (410)
22 (single adj2 blastocyst$).tw. (896)
23 SBT.tw. (3782)
24 (four adj2 embryo$).tw. (1078)
25 (four adj2 blastocyst$).tw. (105)
26 FET.tw. (4510)
27 FZET.tw. (0)
28 (multiple$ adj2 embryo$).tw. (1063)
29 (multiple$ adj2 blastocyst$).tw. (46)
30 (quadruple adj2 embryo$).tw. (7)
31 (quadruple adj2 blastocyst$).tw. (1)
32 or/6‐31 (1140425)
33 5 and 32 (11074)
34 Clinical trial/ (956829)
35 Randomized controlled trials/ (175321)
36 Random Allocation/ (82227)
37 Single‐Blind Method/ (36164)
38 Double‐Blind Method/ (142855)
39 Cross‐Over Studies/ (50639)
40 Placebos/ (277114)
41 Randomi?ed controlled trial$.tw. (222841)
42 RCT.tw. (36001)
43 Random allocation.tw. (1981)
44 Randomly allocated.tw. (34385)
45 Allocated randomly.tw. (2509)
46 (allocated adj2 random).tw. (810)
47 Single blind$.tw. (24170)
48 Double blind$.tw. (199664)
49 ((treble or triple) adj blind$).tw. (1107)
50 Placebo$.tw. (298020)
51 Prospective Studies/ (480306)
52 or/34‐51 (2020914)
53 Case study/ (67370)
54 Case report.tw. (394310)
55 Abstract report/ or letter/ (1084934)
56 or/53‐55 (1536415)
57 52 not 56 (1964442)
58 animal/ (1323785)
59 human/ (20095580)
60 58 not 59 (958622)
61 57 not 60 (1932644)
62 33 and 61 (1211)
Appendix 5. PsycINFO search strategy
OVID platform
Searched from 1806 to 16 March 2020
1 exp Infertility/ or exp Reproductive Technology/ (3474)
2 (Embryo$ adj5 Transfer$).tw. (175)
3 (blastocyst$ adj5 transfer$).tw. (6)
4 or/1‐3 (3551)
5 (two adj2 embryo$).tw. (41)
6 (double adj2 embryo$).tw. (16)
7 DET.tw. (166)
8 (three adj2 embryo$).tw. (15)
9 (triple adj2 embryo$).tw. (0)
10 (two adj2 blastocyst$).tw. (0)
11 (three adj2 blastocyst$).tw. (0)
12 (one adj2 embryo$).tw. (34)
13 (single adj2 embryo$).tw. (30)
14 (four adj2 embryo$).tw. (9)
15 or/5‐14 (300)
16 4 and 15 (24)
Appendix 6. CINAHL search strategy
EBSCO platform
Searched from 1961 to 16 March 2020
S47 S23 AND S46 219
S46 S45 NOT S44 634,392
S45 S24 OR S25 OR S26 OR S27 OR S28 OR S29 OR S30 OR S31 OR S32 OR S33 OR S34 OR S35 OR S36 OR S37 OR S38 663,188
S44 S42 NOT S43 168,310
S43 MH (human) 2,045,086
S42 S39 OR S40 OR S41 191,371
S41 TI (animal model*) 2,899
S40 MH (animal studies) 111,330
S39 MH animals+ 87,856
S38 AB (cluster W3 RCT) 327
S37 MH (crossover design) OR MH (comparative studies) 259,647
S36 AB (control W5 group) 100,230
S35 PT (randomized controlled trial) 87,859
S34 MH (placebos) 11,654
S33 MH (sample size) AND AB (assigned OR allocated OR control) 3,787
S32 TI (trial) 100,205
S31 AB (random*) 284,114
S30 TI (randomised OR randomized) 98,224
S29 MH cluster sample 4,074
S28 MH pretest‐posttest design 39,788
S27 MH random assignment 57,798
S26 MH single‐blind studies 13,185
S25 MH double‐blind studies 43,656
S24 MH randomized controlled trials 91,194
S23 S4 AND S22 873
S22 S5 OR S6 OR S7 OR S8 OR S9 OR S10 OR S11 OR S12 OR S13 OR S14 OR S15 OR S16 OR S17 OR S18 OR S19 OR S20 OR S21 3,454
S21 TX TBT or TX DBT 796
S20 TX TET or TX DET 1,244
S19 TX (single N2 embryo*) 453
S18 TX (single N2 blastocyst*) 114
S17 TX (one N2 blastocyst*) 39
S16 TX (double N2 blastocyst*) 4
S15 TX (two N2 blastocyst*) 29
S14 TX (three N2 blastocyst*) 22
S13 TX (four N2 blastocyst*) 13
S12 TX (multiple N2 blastocyst*) 3
S11 TX (multiple N2 embryo*) 170
S10 TX (four N2 embryo*) 102
S9 TX (triple N2 embryo*) 5
S8 TX (three N2 embryo*) 247
S7 TX (one N2 embryo*) 270
S6 TX (double N2 embryo*) 98
S5 TX (two N2 embryo*) 329
S4 S1 OR S2 OR S3 3,283
S3 TX (blastocyst* N5 Transfer*) 401
S2 TX (Embryo* N5 Transfer*) 3,191
S1 (MM "Embryo Transfer") 1,122
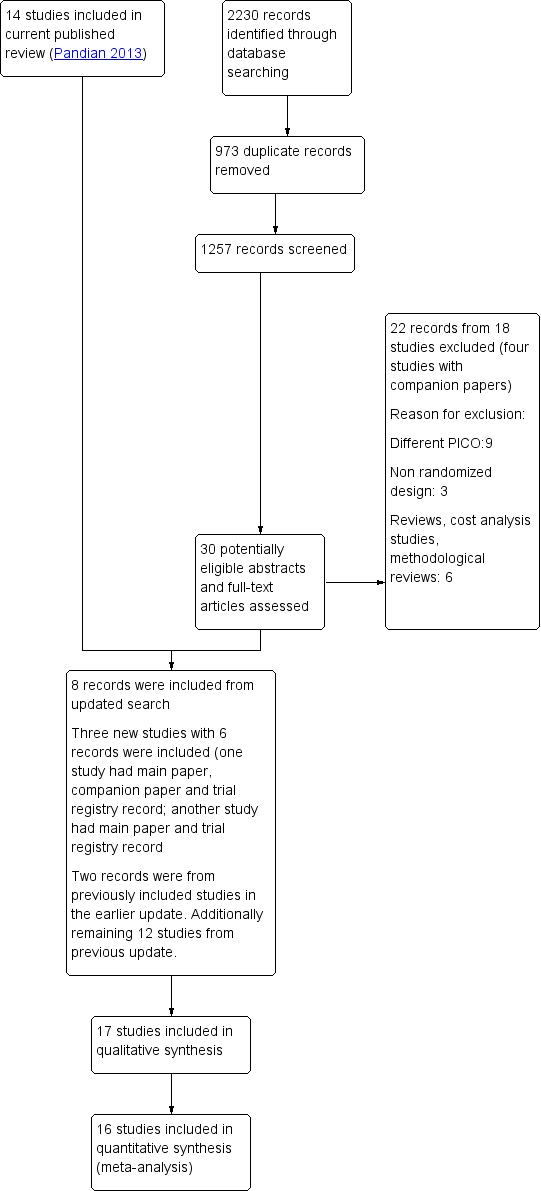
Study flow diagram.

Methodological quality graph: review authors' judgements about each methodological quality item presented as percentages across all included studies.

Methodological quality summary: review authors' judgements about each methodological quality item for each included study.

Forest plot of comparison: 2 Repeated SET (mixed policies) versus multiple ET in a single cycle, outcome: 2.1 Cumulative live birth.

Forest plot of comparison: 2 Repeated SET (mixed policies) versus multiple ET in a single cycle, outcome: 2.2 Multiple pregnancy.

Forest plot of comparison: 2 Single versus multiple (in a single cycle), outcome: 2.1 Live birth.

Funnel plot of comparison: 3 Single versus multiple (in a single cycle), outcome: 3.1 Live birth.

Forest plot of comparison: 2 Single versus multiple (in a single cycle), outcome: 2.2 Multiple pregnancy.

Comparison 2: Repeated SET (mixed policies) versus multiple ET in a single cycle, Outcome 1: Cumulative live birth

Comparison 2: Repeated SET (mixed policies) versus multiple ET in a single cycle, Outcome 2: Multiple pregnancy

Comparison 2: Repeated SET (mixed policies) versus multiple ET in a single cycle, Outcome 3: Clinical pregnancy rate

Comparison 2: Repeated SET (mixed policies) versus multiple ET in a single cycle, Outcome 4: Miscarriage

Comparison 3: Single versus multiple embryo transfer (in a single cycle), Outcome 1: Live birth

Comparison 3: Single versus multiple embryo transfer (in a single cycle), Outcome 2: Multiple pregnancy

Comparison 3: Single versus multiple embryo transfer (in a single cycle), Outcome 3: Clinical pregnancy rate

Comparison 3: Single versus multiple embryo transfer (in a single cycle), Outcome 4: Miscarriage

Comparison 4: Double embryo transfer versus more than two embryos transferred, Outcome 1: Live or cumulative live birth

Comparison 4: Double embryo transfer versus more than two embryos transferred, Outcome 2: Multiple pregnancy

Comparison 4: Double embryo transfer versus more than two embryos transferred, Outcome 3: Clinical pregnancy
| Repeated single embryo transfer (mixed policies) versus multiple embryo transfer in a single cycle of IVF or ICSI | |||||||
| Patient or population: transfer following in vitro fertilisation or intracytoplasmic sperm injection | |||||||
| Outcomes | Anticipated absolute effects* (95% CI) | Relative effect | № of participants | Quality of the evidence | Comments | ||
|---|---|---|---|---|---|---|---|
| Risk with multiple embryo transfer | Risk with repeated single (mixed policies) | ||||||
| Cumulative live birth | pooled | 420 per 1000 | 399 per 1000 | RR 0.95 | 985 | ⊕⊕⊝⊝ | |
| Cumulative live birth | SET + 1 FET versus DET (×1) (cleavage stage) | 421 per 1000 | 392 per 1000 | RR 0.93 | 878 | ⊕⊕⊝⊝ | |
| SET (×2) versus DET (×1) (cleavage stage) | 407 per 1000 | 464 per 1000 | RR 1.14 | 107 | ⊕⊝⊝⊝ | ||
| Multiple pregnancy | pooled | 127 per 1000 | 18 per 1000 | Peto odds ratio 0.13 | 985 | ⊕⊕⊕⊝ | |
| Multiple pregnancy | SET + 1 FET versus DET (×1) (cleavage stage) | 128 per 1000 | 19 per 1000 | Peto odds ratio 0.13 | 878 | ⊕⊕⊕⊝ | |
| SET (×2) versus DET (×1) (cleavage stage) | 111 per 1000 | 15 per 1000 | Peto odds ratio 0.12 | 107 | ⊕⊝⊝⊝ | ||
| Clinical pregnancy rate | pooled | 515 per 1000 | 489 per 1000 (432 to 556) | RR 0.95 (0.84 to 1.08) | 943 (3 RCTs) | ⊕⊕⊝⊝ | |
| Miscarriage rate | pooled | 76 per 1000 | 149 per 1000 (71 to 289) | Peto odds ratio 2.14 (0.93 to 4.95) | 282 (2 RCTs) | ⊕⊕⊝⊝ | |
| *The risk in the intervention group (and its 95% CI) is based on the assumed risk in the comparison group and the relative effect of the intervention (and its 95% CI). | |||||||
| GRADE Working Group grades of evidence | |||||||
| 1 Very serious risk of bias, downgraded by 2 levels: high risk or unclear risk of bias for allocation concealment, high risk of bias for performance bias due to lack of blinding. | |||||||
| Single compared to multiple embryo transfer in a single cycle following in vitro fertilisation or intracytoplasmic sperm injection | ||||||
| Patient or population: transfer following in vitro fertilisation or intracytoplasmic sperm injection | ||||||
| Outcomes | Anticipated absolute effects* (95% CI) | Relative effect | № of participants | Quality of the evidence | Comments | |
|---|---|---|---|---|---|---|
| Risk with multiple (in a single cycle) | Risk with Single | |||||
| Live birth | 463 per 1000 | 310 per 1000 | RR 0.67 | 1904 | ⊕⊕⊝⊝ | |
| Multiple pregnancy | 151 per 1000 | 28 per 1000 | Peto odds ratio 0.16 | 1952 | ⊕⊕⊕⊝ | |
| Clinical pregnancy | 547 per 1000 | 383 per 1000 (350 to 421) | RR 0.70 (0.64 to 0.77) | 1860 (10 RCTs) | ⊕⊕⊝⊝ | |
| Miscarriage rate | 72 per 1000 | 69 per 1000 (46 to 99) | Peto odds ratio 0.96 (0.66 to 1.42) | 1560 (7 RCTs) | ⊕⊕⊝⊝ | |
| *The risk in the intervention group (and its 95% CI) is based on the assumed risk in the comparison group and the relative effect of the intervention (and its 95% CI). | ||||||
| GRADE Working Group grades of evidence | ||||||
| 1 Very serious risk of bias, downgraded by 2 levels: unclear or high risk for allocation concealment, high risk for performance bias due to lack of blinding in majority of the included studies. | ||||||
| Study author and year | Age Eligibility criteria (mean participant age, where stated) | Duration of infertility | Previous failed cycle | Frozen cycles | Prim/Sec infertility | FSH | Quality of embryo |
|---|---|---|---|---|---|---|---|
| Under 38 years (mean age 33) | Mean 2.6 to 3.2 years | First IVF/ICSI cycle. | Frozen cycles included | Not stated | Not stated | Good | |
| less than 34 years | Average duration of infertility 3.5 years. | First IVF/ICSI cycle. | Not included | Unclear | Not mentioned | Good | |
| 38 to 45 years (mean age 41) | Average duration of infertility in DET group was 3.7(± 2.5) and in TET group was 3.2(± 2.4) years | First cycle and previous successful cycle | Not included | Yes | Not mentioned | Good | |
| Not stated | Not stated | Not stated | Not stated | Not stated | Not stated | Good | |
| < 35 years (mean age 30 to 31) | Not stated | First IVF/ICSI cycle or after previous successful cycle . | Not included | Yes | FSH < 10IU/L. | Good | |
| various, no age criteria, ranged between 22 to 40 years (mean age 31) | Not stated | women who had / not had more than 1 previous failed treatment. | Frozen cycles included | Yes, but not mentioned | Not mentioned | good | |
| Not stated | Not stated | Not stated | Not stated | Not stated | Not stated | Good | |
| < 36 years (mean age 31) | 0 to 12 years | First or second IVF cycle | Frozen cycles included | Yes | Not mentioned | Good, blastocysts included | |
| Unpublished trial, pilot study, part of a thesis | ≥ 36 years | 0 to 12 years | First or second IVF/ICSI cycle | Frozen cycles included | Yes | Not mentioned | At |
| Various ages, no criteria (mean age 33) | SET‐ 3.3 ± 1.8, DET‐ 3.3 ± 2.1 years | First IVF cycle | Not included | Yes | Not mentioned | Good | |
| ≤ 35 years | Not mentioned | First or previous successful cycle | Frozen cycles included | Yes | Not mentioned | good | |
| unpublished trial | Female age < 35 if no previous ART pregnancy, < 40 if | Not mentioned | First or previous successful cycle | Frozen cycles included | Yes | Not mentioned | At least 4 good‐quality |
| unpublished trial | ≤ 37 years | Not mentioned | First or second cycle of treatment | Frozen cycles included | Yes | Not mentioned | 4 or more good quality embryos available at the time of embryo transfer |
| < 35 years | SET ‐ 2.6 ± 1.6 years DET ‐ 3.2 ± 2.4 years | No more than 1 previous ART failure | Frozen cycles performed but not included in the analysis | Yes | Mentioned | At least 2 good‐quality blastocysts were available, | |
| oocyte donor recipients aged 18‐50 years | not mentioned | Undergoing first or second synchronised oocyte donation cycle | Frozen cycles performed but not included in the analysis | Not mentioned | Not mentioned | Minimum of 5 embryos with at least 2 good‐quality embryos on day 3 after oocyte retrieval | |
| < 38 years | SET ‐ 3.1 ± 1.1 DET ‐ 3.1 ± 1.0 | First or second cycle with previous attempt with positive pregnancy test | Frozen cycles included | Not mentioned | Not mentioned | good |
| Outcome or subgroup title | No. of studies | No. of participants | Statistical method | Effect size |
| 2.1 Cumulative live birth Show forest plot | 4 | 985 | Risk Ratio (M‐H, Fixed, 95% CI) | 0.95 [0.82, 1.10] |
| 2.1.1 SET + 1 FET versus DET (x1) (cleavage stage) | 3 | 878 | Risk Ratio (M‐H, Fixed, 95% CI) | 0.93 [0.79, 1.09] |
| 2.1.2 SET (x2) versus DET (x1) (cleavage stage) | 1 | 107 | Risk Ratio (M‐H, Fixed, 95% CI) | 1.14 [0.70, 1.84] |
| 2.2 Multiple pregnancy Show forest plot | 4 | 985 | Peto Odds Ratio (Peto, Fixed, 95% CI) | 0.13 [0.08, 0.21] |
| 2.2.1 SET + 1 FET versus DET (x1) (cleavage stage) | 3 | 878 | Peto Odds Ratio (Peto, Fixed, 95% CI) | 0.13 [0.08, 0.22] |
| 2.2.2 SET (x2) versus DET (x1) (cleavage stage) | 1 | 107 | Peto Odds Ratio (Peto, Fixed, 95% CI) | 0.12 [0.03, 0.54] |
| 2.3 Clinical pregnancy rate Show forest plot | 3 | 943 | Risk Ratio (M‐H, Fixed, 95% CI) | 0.99 [0.87, 1.12] |
| 2.3.1 SET + 1 FET versus DET (x1) (cleavage stage) | 2 | 836 | Risk Ratio (M‐H, Fixed, 95% CI) | 0.97 [0.84, 1.11] |
| 2.3.2 SET (x2) versus DET (x1) (cleavage stage) | 1 | 107 | Risk Ratio (M‐H, Fixed, 95% CI) | 1.18 [0.81, 1.71] |
| 2.4 Miscarriage Show forest plot | 2 | 282 | Peto Odds Ratio (Peto, Fixed, 95% CI) | 2.14 [0.93, 4.95] |
| 2.4.1 SET + 1 FET versus DET (x1) (cleavage stage) | 1 | 175 | Peto Odds Ratio (Peto, Fixed, 95% CI) | 2.86 [0.85, 9.67] |
| 2.4.2 SET (x2) versus DET (x1) (cleavage stage) | 1 | 107 | Peto Odds Ratio (Peto, Fixed, 95% CI) | 1.65 [0.52, 5.23] |
| Outcome or subgroup title | No. of studies | No. of participants | Statistical method | Effect size |
| 3.1 Live birth Show forest plot | 12 | 1904 | Risk Ratio (M‐H, Fixed, 95% CI) | 0.67 [0.59, 0.75] |
| 3.1.1 SET (x1) versus DET (x1) (cleavage stage) | 11 | 1704 | Risk Ratio (M‐H, Fixed, 95% CI) | 0.67 [0.59, 0.76] |
| 3.1.2 SET (x1) versus DET (x1) (blastocyst stage) | 2 | 200 | Risk Ratio (M‐H, Fixed, 95% CI) | 0.65 [0.51, 0.84] |
| 3.2 Multiple pregnancy Show forest plot | 13 | 1952 | Peto Odds Ratio (Peto, Fixed, 95% CI) | 0.16 [0.12, 0.22] |
| 3.2.1 SET (x1) versus DET (x1) (cleavage stage) | 11 | 1704 | Peto Odds Ratio (Peto, Fixed, 95% CI) | 0.16 [0.11, 0.22] |
| 3.2.2 SET (x1) versus DET (x1) (blastocyst stage) | 3 | 248 | Peto Odds Ratio (Peto, Fixed, 95% CI) | 0.18 [0.09, 0.36] |
| 3.3 Clinical pregnancy rate Show forest plot | 10 | 1860 | Risk Ratio (M‐H, Fixed, 95% CI) | 0.70 [0.64, 0.77] |
| 3.3.1 SET (x1) versus DET (x1) (cleavage stage) | 8 | 1612 | Risk Ratio (M‐H, Fixed, 95% CI) | 0.69 [0.62, 0.78] |
| 3.3.2 SET (x1) versus DET (x1) (blastocyst stage) | 3 | 248 | Risk Ratio (M‐H, Fixed, 95% CI) | 0.74 [0.62, 0.88] |
| 3.4 Miscarriage Show forest plot | 7 | 1560 | Peto Odds Ratio (Peto, Fixed, 95% CI) | 0.96 [0.66, 1.42] |
| 3.4.1 SET (x1) versus DET (x1) (cleavage stage) | 6 | 1460 | Peto Odds Ratio (Peto, Fixed, 95% CI) | 0.96 [0.65, 1.43] |
| 3.4.2 SET (x1) versus DET (x1) (blastocyst stage) | 1 | 100 | Peto Odds Ratio (Peto, Fixed, 95% CI) | 1.00 [0.24, 4.21] |
| Outcome or subgroup title | No. of studies | No. of participants | Statistical method | Effect size |
| 4.1 Live or cumulative live birth Show forest plot | 2 | Risk Ratio (M‐H, Fixed, 95% CI) | Subtotals only | |
| 4.1.1 DET (x1) versus TET (x1) | 1 | 45 | Risk Ratio (M‐H, Fixed, 95% CI) | 0.48 [0.14, 1.68] |
| 4.1.2 DET (x1) versus four embryo transfer (x1) | 1 | 56 | Risk Ratio (M‐H, Fixed, 95% CI) | 0.53 [0.27, 1.05] |
| 4.1.3 DET (x2) versus TET (x2) | 1 | 45 | Risk Ratio (M‐H, Fixed, 95% CI) | 0.84 [0.37, 1.92] |
| 4.1.4 DET (x3) versus TET (x3) | 1 | 45 | Risk Ratio (M‐H, Fixed, 95% CI) | 0.86 [0.43, 1.71] |
| 4.2 Multiple pregnancy Show forest plot | 3 | Peto Odds Ratio (Peto, Fixed, 95% CI) | Subtotals only | |
| 4.2.1 DET versus TET | 2 | 343 | Peto Odds Ratio (Peto, Fixed, 95% CI) | 0.36 [0.14, 0.93] |
| 4.2.2 DET versus four embryo transfer | 1 | 56 | Peto Odds Ratio (Peto, Fixed, 95% CI) | 0.46 [0.11, 1.88] |
| 4.3 Clinical pregnancy Show forest plot | 3 | Risk Ratio (M‐H, Fixed, 95% CI) | Subtotals only | |
| 4.3.1 DET (x1) versus TET (x1) | 2 | 343 | Risk Ratio (M‐H, Fixed, 95% CI) | 0.75 [0.53, 1.06] |
| 4.3.2 DET (x1) versus four embryo transfer (x1) | 1 | 56 | Risk Ratio (M‐H, Fixed, 95% CI) | 0.76 [0.47, 1.26] |