Ventilación nasal con presión positiva intermitente (VNPPI) precoz versus presión positiva nasal continua de las vías respiratorias (PPNCVR) en lactantes prematuros después de la extubación
Información
- DOI:
- https://doi.org/10.1002/14651858.CD003212.pub3Copiar DOI

- Base de datos:
-
- Cochrane Database of Systematic Reviews
- Versión publicada:
-
- 01 febrero 2017see what's new
- Tipo:
-
- Intervention
- Etapa:
-
- Review
- Grupo Editorial Cochrane:
-
Grupo Cochrane de Neonatología
- Copyright:
-
- Copyright © 2017 The Cochrane Collaboration. Published by John Wiley & Sons, Ltd.
Cifras del artículo
Altmetric:
Citado por:
Autores
Contributions of authors
PGD and BL prepared the protocol for this review.
AGD and HK provided additional material for the Background section.
BL updated the literature search, made independent quality assessments and extracted data before comparing results and resolving differences for this update.
All review authors participated in data analysis and interpretation of results for this updated review.
Sources of support
Internal sources
-
Royal Women's Hospital, Melbourne, Australia.
-
Murdoch Children's Research Institute, Melbourne, Australia.
-
University of Melbourne, Australia.
-
Royal Hobart Hospital, Australia.
-
University of Tasmania, Australia.
External sources
-
National Health and Medical Research Council, Australia.
-
Eunice Kennedy Shriver National Institute of Child Health and Human Development, National Institutes of Health, Department of Health and Human Services, USA.
Editorial support of the Cochrane Neonatal Review Group has been funded with Federal funds from the Eunice Kennedy Shriver National Institute of Child Health and Human Development, National Institutes of Health, Department of Health and Human Services, USA, under Contract No. HHSN275201100016C.
-
National Institute for Health Research, UK.
Editorial support for Cochrane Neonatal has been funded with funds from a UK National Institute of Health Research Grant (NIHR) Cochrane Programme Grant (13/89/12). The views expressed in this publication are those of the authors and not necessarily those of the NHS, the NIHR, or the UK Department of Health.
Declarations of interest
Review authors have declared no conflicts of interest.
Acknowledgements
The review authors acknowledge the generosity of Drs Friedlich, Barrington and Bhandari, who supplied 'preprints' of their manuscripts and additional information for this review. Review authors also acknowledge the generosity of the steering committee of Kirpalani 2013, which provided further data for analysis.
Version history
| Published | Title | Stage | Authors | Version |
| 2023 Jul 27 | Nasal intermittent positive pressure ventilation (NIPPV) versus nasal continuous positive airway pressure (NCPAP) for preterm neonates after extubation | Review | Brigitte Lemyre, Marc-Olivier Deguise, Paige Benson, Haresh Kirpalani, Antonio G De Paoli, Peter G Davis | |
| 2017 Feb 01 | Nasal intermittent positive pressure ventilation (NIPPV) versus nasal continuous positive airway pressure (NCPAP) for preterm neonates after extubation | Review | Brigitte Lemyre, Peter G Davis, Antonio G De Paoli, Haresh Kirpalani | |
| 2014 Sep 04 | Nasal intermittent positive pressure ventilation (NIPPV) versus nasal continuous positive airway pressure (NCPAP) for preterm neonates after extubation | Review | Brigitte Lemyre, Peter G Davis, Antonio G De Paoli, Haresh Kirpalani | |
| 2001 Jul 23 | Nasal intermittent positive pressure ventilation (NIPPV) versus nasal continuous positive airway pressure (NCPAP) for preterm neonates after extubation | Review | Peter G Davis, Brigitte Lemyre, Antonio G De Paoli | |
Differences between protocol and review
We added the methods and plan for 'Summary of findings' tables and GRADE recommendations, which were not included in the original protocol, nor in the previously published review.
Keywords
MeSH
Medical Subject Headings (MeSH) Keywords
- *Infant, Premature;
- Dilatation, Pathologic [etiology];
- Enterocolitis, Necrotizing [etiology];
- Intermittent Positive‐Pressure Ventilation [adverse effects];
- Intubation, Intratracheal;
- Positive‐Pressure Respiration [adverse effects, *methods, mortality];
- Randomized Controlled Trials as Topic;
- Respiratory Insufficiency [etiology];
- Retreatment;
- Stomach;
- Ventilator Weaning [methods];
Medical Subject Headings Check Words
Humans; Infant, Newborn;
PICO

Study flow diagram: review update.
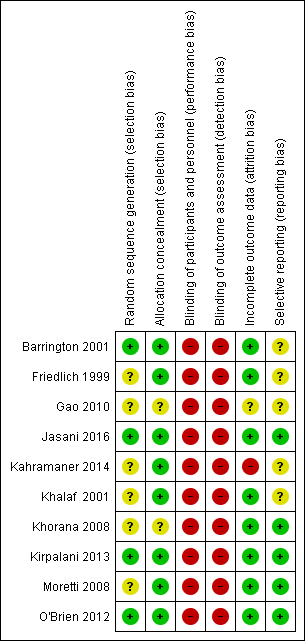
Risk of bias summary: review authors' judgements about each risk of bias item for each included study.

Comparison 1 NIPPV versus NCPAP to prevent extubation failure, Outcome 1 Respiratory failure post extubation.
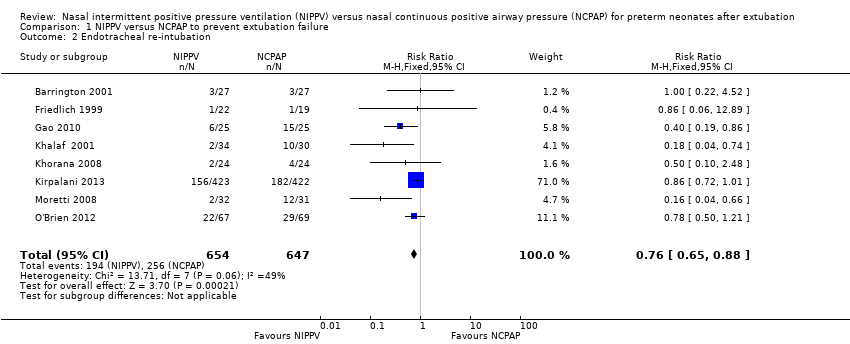
Comparison 1 NIPPV versus NCPAP to prevent extubation failure, Outcome 2 Endotracheal re‐intubation.
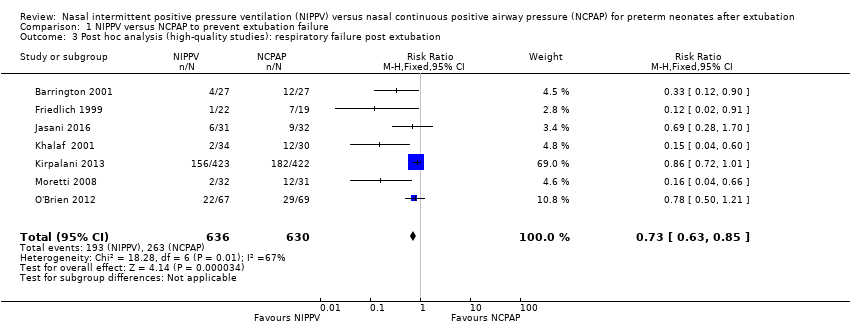
Comparison 1 NIPPV versus NCPAP to prevent extubation failure, Outcome 3 Post hoc analysis (high‐quality studies): respiratory failure post extubation.
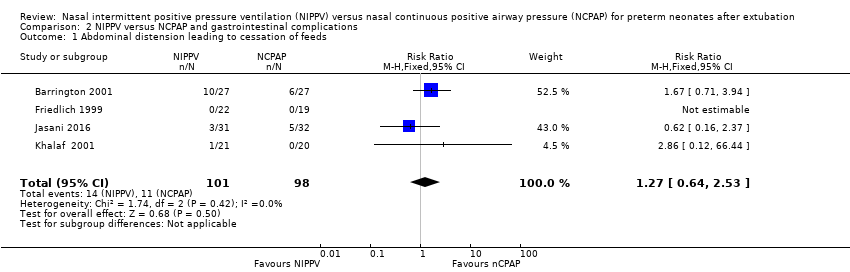
Comparison 2 NIPPV versus NCPAP and gastrointestinal complications, Outcome 1 Abdominal distension leading to cessation of feeds.
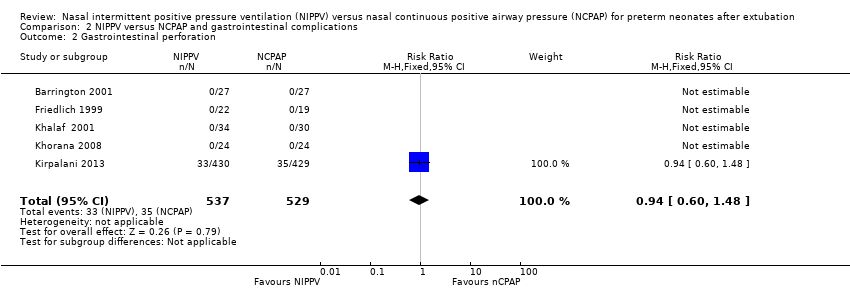
Comparison 2 NIPPV versus NCPAP and gastrointestinal complications, Outcome 2 Gastrointestinal perforation.

Comparison 2 NIPPV versus NCPAP and gastrointestinal complications, Outcome 3 Necrotising enterocolitis.

Comparison 3 NIPPV versus NCPAP to improve pulmonary outcomes, Outcome 1 Chronic lung disease (oxygen supplementation at 36 weeks).
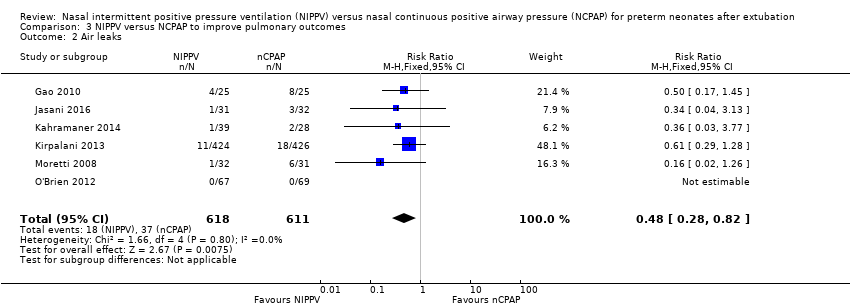
Comparison 3 NIPPV versus NCPAP to improve pulmonary outcomes, Outcome 2 Air leaks.

Comparison 4 NIPPV versus NCPAP and mortality, Outcome 1 Death before discharge.
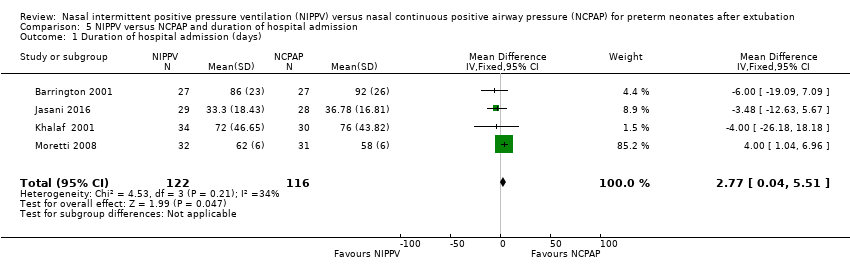
Comparison 5 NIPPV versus NCPAP and duration of hospital admission, Outcome 1 Duration of hospital admission (days).

Comparison 6 NIPPV versus NCPAP and apnoea, Outcome 1 Rates of apnoea (episodes/24 h).

Comparison 7 NIPPV versus NCPAP (synchronised vs non‐synchronised), Outcome 1 Respiratory failure post extubation.

Comparison 7 NIPPV versus NCPAP (synchronised vs non‐synchronised), Outcome 2 Endotracheal re‐intubation during the week post extubation.
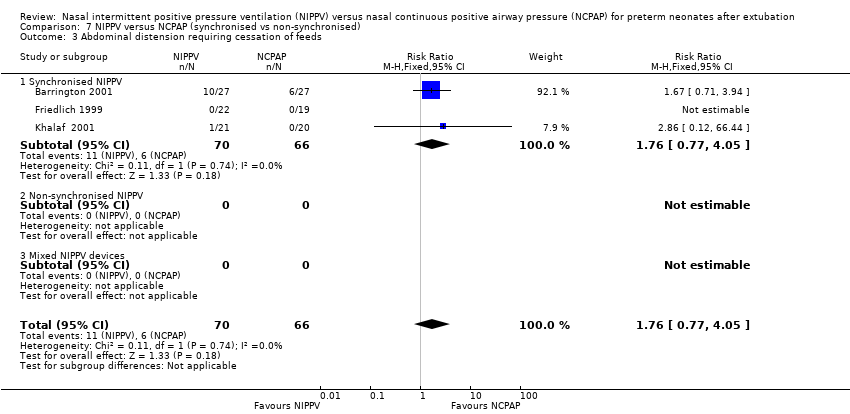
Comparison 7 NIPPV versus NCPAP (synchronised vs non‐synchronised), Outcome 3 Abdominal distension requiring cessation of feeds.

Comparison 7 NIPPV versus NCPAP (synchronised vs non‐synchronised), Outcome 4 Gastrointestinal perforation.

Comparison 7 NIPPV versus NCPAP (synchronised vs non‐synchronised), Outcome 5 Necrotising enterocolitis.
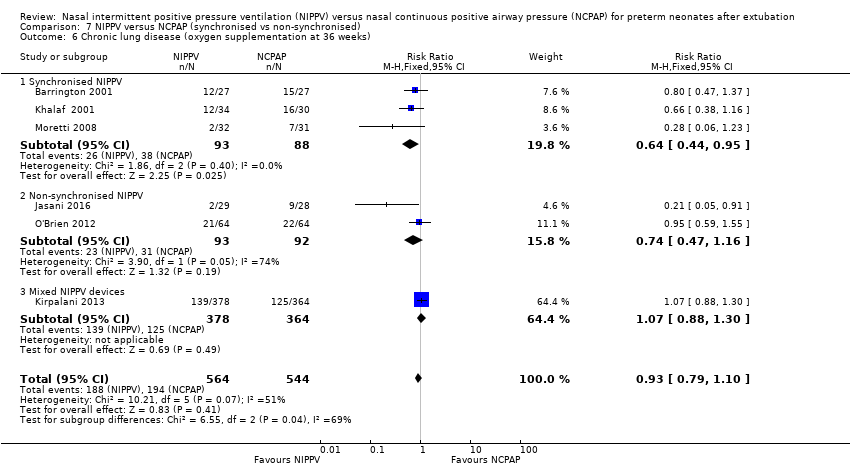
Comparison 7 NIPPV versus NCPAP (synchronised vs non‐synchronised), Outcome 6 Chronic lung disease (oxygen supplementation at 36 weeks).

Comparison 7 NIPPV versus NCPAP (synchronised vs non‐synchronised), Outcome 7 Pulmonary air leak.

Comparison 7 NIPPV versus NCPAP (synchronised vs non‐synchronised), Outcome 8 Rates of apnoea (episodes/24 h).
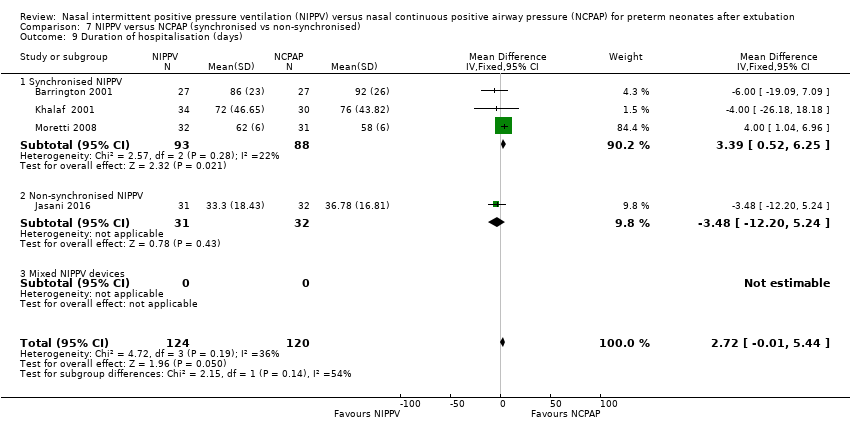
Comparison 7 NIPPV versus NCPAP (synchronised vs non‐synchronised), Outcome 9 Duration of hospitalisation (days).

Comparison 7 NIPPV versus NCPAP (synchronised vs non‐synchronised), Outcome 10 Death before discharge.
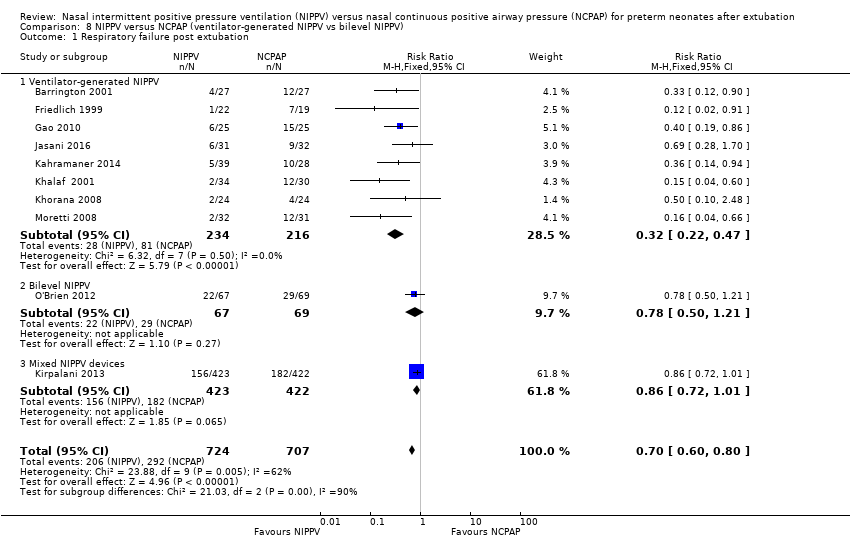
Comparison 8 NIPPV versus NCPAP (ventilator‐generated NIPPV vs bilevel NIPPV), Outcome 1 Respiratory failure post extubation.

Comparison 8 NIPPV versus NCPAP (ventilator‐generated NIPPV vs bilevel NIPPV), Outcome 2 Endotracheal re‐intubation during the week post extubation.

Comparison 8 NIPPV versus NCPAP (ventilator‐generated NIPPV vs bilevel NIPPV), Outcome 3 Abdominal distension requiring cessation of feeds.

Comparison 8 NIPPV versus NCPAP (ventilator‐generated NIPPV vs bilevel NIPPV), Outcome 4 Gastrointestinal perforation.

Comparison 8 NIPPV versus NCPAP (ventilator‐generated NIPPV vs bilevel NIPPV), Outcome 5 Necrotising enterocolitis.
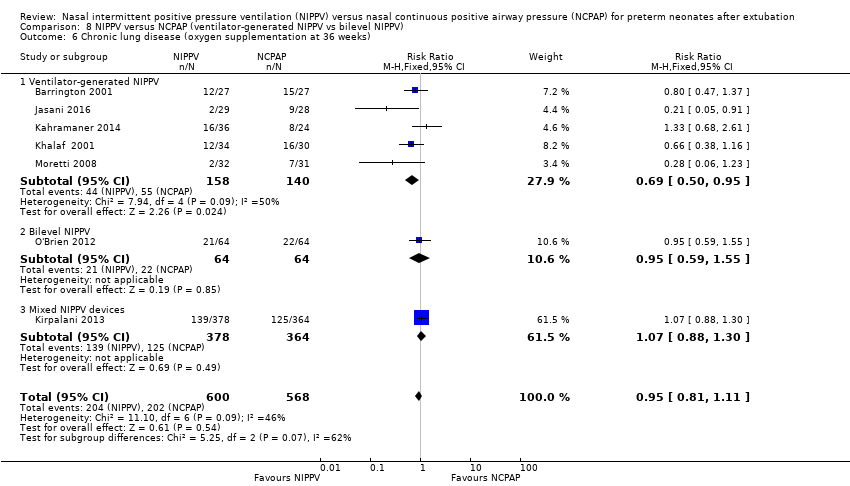
Comparison 8 NIPPV versus NCPAP (ventilator‐generated NIPPV vs bilevel NIPPV), Outcome 6 Chronic lung disease (oxygen supplementation at 36 weeks).

Comparison 8 NIPPV versus NCPAP (ventilator‐generated NIPPV vs bilevel NIPPV), Outcome 7 Pulmonary air leak.

Comparison 8 NIPPV versus NCPAP (ventilator‐generated NIPPV vs bilevel NIPPV), Outcome 8 Rates of apnoea (episodes/24 h).

Comparison 8 NIPPV versus NCPAP (ventilator‐generated NIPPV vs bilevel NIPPV), Outcome 9 Duration of hospitalisation (days).
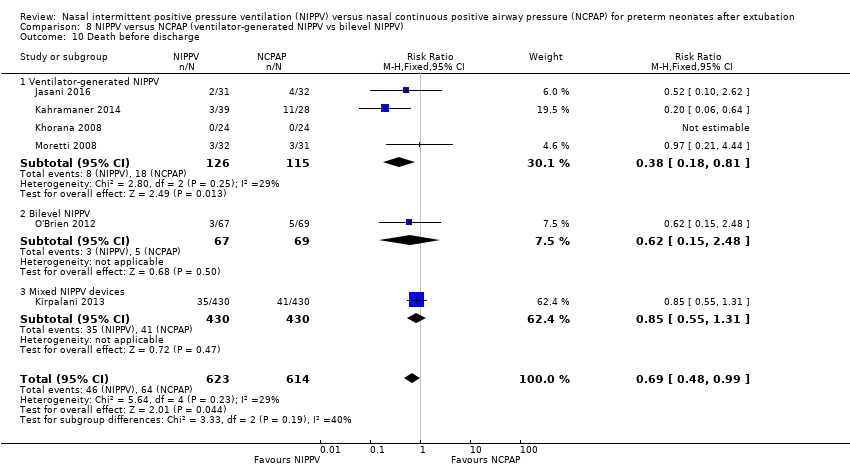
Comparison 8 NIPPV versus NCPAP (ventilator‐generated NIPPV vs bilevel NIPPV), Outcome 10 Death before discharge.
| NIPPV versus NCPAP | ||||||
| Patient or population: preterm neonates after extubation | ||||||
| Outcomes | Anticipated absolute effects* (95% CI) | Relative effect | Number of participants | Quality of the evidence | Comments | |
| Risk with NCPAP | Risk with NIPPV | |||||
| Respiratory failure post extubation | Study population | RR 0.70 | 1431 | Moderatea | Risk of bias: intervention unblinded OIS 554 | |
| 413 per 1000 | 289 per 1000 | |||||
| Endotracheal re‐intubation during the week post extubation | Study population | RR 0.76 | 1301 (8 studies) | Moderatea | Risk of bias: intervention unblinded OIS 724 | |
| 396 per 1000 | 301 per 1000 | |||||
| Abdominal distension requiring cessation of feeds | Study population | RR 1.27 | 199 (4 studies) | Lowa,b | Risk of bias: intervention unblinded Imprecision: wide confidence intervals | |
| 112 per 1000 | 143 per 1000 | |||||
| Gastrointestinal perforation | Study population | RR 0.94 | 1066 (5 studies) | Moderatea | Risk of bias: intervention unblinded | |
| 66 per 1000 | 62 per 1000 | |||||
| Necrotising enterocolitis | Study population | RR 0.87 | 1214 | Moderatea | Risk of bias: intervention unblinded | |
| 127 per 1000 | 110 per 1000 | |||||
| Chronic lung disease (oxygen supplementation at 36 weeks) | Study population | RR 0.94 | 1140 (6 studies) | Moderatea | Risk of bias: intervention unblinded | |
| 355 per 1000 | 334 per 1000 | |||||
| Pulmonary air leak | Study population | RR 0.48 | 1229 | Moderatea | Risk of bias: intervention unblinded OIS 749 | |
| 61 per 1000 | 29 per 1000 | |||||
| Duration of hospitalisation (days) | Mean duration of hospitalisation (days) was 0 | Mean duration of hospitalisation (days) in the intervention group was 2.77 higher (0.04 to 5.51 higher) | 238 | Lowa,b | Risk of bias: intervention unblinded Imprecision: wide confidence intervals | |
| Death before discharge | Study population | RR 0.69 | 1237 | Moderatea | Risk of bias: intervention unblinded Imprecision OIS 1844 | |
| 104 per 1000 | 72 per 1000 | |||||
| *The risk in the intervention group (and its 95% confidence interval) is based on assumed risk in the comparison group and the relative effect of the intervention (and its 95% CI). | ||||||
| GRADE Working Group grades of evidence. | ||||||
| aIntervention unblinded. bImprecise estimate (wide confidence intervals). | ||||||
| Outcome or subgroup title | No. of studies | No. of participants | Statistical method | Effect size |
| 1 Respiratory failure post extubation Show forest plot | 10 | 1431 | Risk Ratio (M‐H, Fixed, 95% CI) | 0.70 [0.60, 0.80] |
| 1.1 Short (nasal) prongs | 7 | 1275 | Risk Ratio (M‐H, Fixed, 95% CI) | 0.73 [0.63, 0.84] |
| 1.2 Long (nasopharyngeal) prongs | 3 | 156 | Risk Ratio (M‐H, Fixed, 95% CI) | 0.31 [0.14, 0.65] |
| 2 Endotracheal re‐intubation Show forest plot | 8 | 1301 | Risk Ratio (M‐H, Fixed, 95% CI) | 0.76 [0.65, 0.88] |
| 3 Post hoc analysis (high‐quality studies): respiratory failure post extubation Show forest plot | 7 | 1266 | Risk Ratio (M‐H, Fixed, 95% CI) | 0.73 [0.63, 0.85] |
| Outcome or subgroup title | No. of studies | No. of participants | Statistical method | Effect size |
| 1 Abdominal distension leading to cessation of feeds Show forest plot | 4 | 199 | Risk Ratio (M‐H, Fixed, 95% CI) | 1.27 [0.64, 2.53] |
| 2 Gastrointestinal perforation Show forest plot | 5 | 1066 | Risk Ratio (M‐H, Fixed, 95% CI) | 0.94 [0.60, 1.48] |
| 3 Necrotising enterocolitis Show forest plot | 6 | 1214 | Risk Ratio (M‐H, Fixed, 95% CI) | 0.87 [0.64, 1.19] |
| Outcome or subgroup title | No. of studies | No. of participants | Statistical method | Effect size |
| 1 Chronic lung disease (oxygen supplementation at 36 weeks) Show forest plot | 6 | 1140 | Risk Ratio (M‐H, Fixed, 95% CI) | 0.94 [0.80, 1.10] |
| 2 Air leaks Show forest plot | 6 | 1229 | Risk Ratio (M‐H, Fixed, 95% CI) | 0.48 [0.28, 0.82] |
| Outcome or subgroup title | No. of studies | No. of participants | Statistical method | Effect size |
| 1 Death before discharge Show forest plot | 6 | 1237 | Risk Ratio (M‐H, Fixed, 95% CI) | 0.69 [0.48, 0.99] |
| Outcome or subgroup title | No. of studies | No. of participants | Statistical method | Effect size |
| 1 Duration of hospital admission (days) Show forest plot | 4 | 238 | Mean Difference (IV, Fixed, 95% CI) | 2.77 [0.04, 5.51] |
| Outcome or subgroup title | No. of studies | No. of participants | Statistical method | Effect size |
| 1 Rates of apnoea (episodes/24 h) Show forest plot | 1 | 54 | Mean Difference (IV, Fixed, 95% CI) | ‐3.10 [‐7.92, 1.72] |
| Outcome or subgroup title | No. of studies | No. of participants | Statistical method | Effect size |
| 1 Respiratory failure post extubation Show forest plot | 10 | 1431 | Risk Ratio (M‐H, Fixed, 95% CI) | 0.70 [0.60, 0.80] |
| 1.1 Synchronised NIPPV | 5 | 272 | Risk Ratio (M‐H, Fixed, 95% CI) | 0.25 [0.15, 0.41] |
| 1.2 Non‐synchronised NIPPV | 4 | 314 | Risk Ratio (M‐H, Fixed, 95% CI) | 0.65 [0.46, 0.93] |
| 1.3 Mixed NIPPV devices | 1 | 845 | Risk Ratio (M‐H, Fixed, 95% CI) | 0.86 [0.72, 1.01] |
| 2 Endotracheal re‐intubation during the week post extubation Show forest plot | 10 | 1431 | Risk Ratio (M‐H, Fixed, 95% CI) | 0.74 [0.64, 0.85] |
| 2.1 Synchronised NIPPV | 5 | 272 | Risk Ratio (M‐H, Fixed, 95% CI) | 0.33 [0.19, 0.57] |
| 2.2 Non‐synchronised NIPPV | 4 | 314 | Risk Ratio (M‐H, Fixed, 95% CI) | 0.65 [0.46, 0.93] |
| 2.3 Mixed NIPPV devices | 1 | 845 | Risk Ratio (M‐H, Fixed, 95% CI) | 0.86 [0.72, 1.01] |
| 3 Abdominal distension requiring cessation of feeds Show forest plot | 3 | 136 | Risk Ratio (M‐H, Fixed, 95% CI) | 1.76 [0.77, 4.05] |
| 3.1 Synchronised NIPPV | 3 | 136 | Risk Ratio (M‐H, Fixed, 95% CI) | 1.76 [0.77, 4.05] |
| 3.2 Non‐synchronised NIPPV | 0 | 0 | Risk Ratio (M‐H, Fixed, 95% CI) | 0.0 [0.0, 0.0] |
| 3.3 Mixed NIPPV devices | 0 | 0 | Risk Ratio (M‐H, Fixed, 95% CI) | 0.0 [0.0, 0.0] |
| 4 Gastrointestinal perforation Show forest plot | 5 | 1052 | Risk Ratio (M‐H, Fixed, 95% CI) | 0.86 [0.72, 1.01] |
| 4.1 Synchronised NIPPV | 3 | 159 | Risk Ratio (M‐H, Fixed, 95% CI) | 0.0 [0.0, 0.0] |
| 4.2 Non‐synchronised NIPPV | 1 | 48 | Risk Ratio (M‐H, Fixed, 95% CI) | 0.0 [0.0, 0.0] |
| 4.3 Mixed NIPPV devices | 1 | 845 | Risk Ratio (M‐H, Fixed, 95% CI) | 0.86 [0.72, 1.01] |
| 5 Necrotising enterocolitis Show forest plot | 6 | 1214 | Risk Ratio (M‐H, Fixed, 95% CI) | 0.87 [0.64, 1.19] |
| 5.1 Synchronised NIPPV | 5 | 1147 | Risk Ratio (M‐H, Fixed, 95% CI) | 0.88 [0.64, 1.20] |
| 5.2 Non‐synchronised NIPPV | 1 | 67 | Risk Ratio (M‐H, Fixed, 95% CI) | 0.72 [0.11, 4.79] |
| 5.3 Mixed NIPPV devices | 0 | 0 | Risk Ratio (M‐H, Fixed, 95% CI) | 0.0 [0.0, 0.0] |
| 6 Chronic lung disease (oxygen supplementation at 36 weeks) Show forest plot | 6 | 1108 | Risk Ratio (M‐H, Fixed, 95% CI) | 0.93 [0.79, 1.10] |
| 6.1 Synchronised NIPPV | 3 | 181 | Risk Ratio (M‐H, Fixed, 95% CI) | 0.64 [0.44, 0.95] |
| 6.2 Non‐synchronised NIPPV | 2 | 185 | Risk Ratio (M‐H, Fixed, 95% CI) | 0.74 [0.47, 1.16] |
| 6.3 Mixed NIPPV devices | 1 | 742 | Risk Ratio (M‐H, Fixed, 95% CI) | 1.07 [0.88, 1.30] |
| 7 Pulmonary air leak Show forest plot | 6 | 1222 | Risk Ratio (M‐H, Fixed, 95% CI) | 0.67 [0.44, 1.02] |
| 7.1 Synchronised NIPPV | 2 | 113 | Risk Ratio (M‐H, Fixed, 95% CI) | 0.35 [0.14, 0.90] |
| 7.2 Non‐synchronised NIPPV | 3 | 259 | Risk Ratio (M‐H, Fixed, 95% CI) | 1.10 [0.58, 2.08] |
| 7.3 Mixed NIPPV devices | 1 | 850 | Risk Ratio (M‐H, Fixed, 95% CI) | 0.61 [0.29, 1.28] |
| 8 Rates of apnoea (episodes/24 h) Show forest plot | 1 | 54 | Mean Difference (IV, Fixed, 95% CI) | ‐3.10 [‐7.92, 1.72] |
| 8.1 Synchronised NIPPV | 1 | 54 | Mean Difference (IV, Fixed, 95% CI) | ‐3.10 [‐7.92, 1.72] |
| 8.2 Non‐synchronised NIPPV | 0 | 0 | Mean Difference (IV, Fixed, 95% CI) | 0.0 [0.0, 0.0] |
| 8.3 Mixed NIPPV devices | 0 | 0 | Mean Difference (IV, Fixed, 95% CI) | 0.0 [0.0, 0.0] |
| 9 Duration of hospitalisation (days) Show forest plot | 4 | 244 | Mean Difference (IV, Fixed, 95% CI) | 2.72 [‐0.01, 5.44] |
| 9.1 Synchronised NIPPV | 3 | 181 | Mean Difference (IV, Fixed, 95% CI) | 3.39 [0.52, 6.25] |
| 9.2 Non‐synchronised NIPPV | 1 | 63 | Mean Difference (IV, Fixed, 95% CI) | ‐3.48 [‐12.20, 5.24] |
| 9.3 Mixed NIPPV devices | 0 | 0 | Mean Difference (IV, Fixed, 95% CI) | 0.0 [0.0, 0.0] |
| 10 Death before discharge Show forest plot | 6 | 1237 | Risk Ratio (M‐H, Fixed, 95% CI) | 0.69 [0.48, 0.99] |
| 10.1 Synchronised NIPPV | 2 | 111 | Risk Ratio (M‐H, Fixed, 95% CI) | 0.97 [0.21, 4.44] |
| 10.2 Non‐synchronised NIPPV | 3 | 266 | Risk Ratio (M‐H, Fixed, 95% CI) | 0.35 [0.16, 0.75] |
| 10.3 Mixed NIPPV devices | 1 | 860 | Risk Ratio (M‐H, Fixed, 95% CI) | 0.85 [0.55, 1.31] |
| Outcome or subgroup title | No. of studies | No. of participants | Statistical method | Effect size |
| 1 Respiratory failure post extubation Show forest plot | 10 | 1431 | Risk Ratio (M‐H, Fixed, 95% CI) | 0.70 [0.60, 0.80] |
| 1.1 Ventilator‐generated NIPPV | 8 | 450 | Risk Ratio (M‐H, Fixed, 95% CI) | 0.32 [0.22, 0.47] |
| 1.2 Bilevel NIPPV | 1 | 136 | Risk Ratio (M‐H, Fixed, 95% CI) | 0.78 [0.50, 1.21] |
| 1.3 Mixed NIPPV devices | 1 | 845 | Risk Ratio (M‐H, Fixed, 95% CI) | 0.86 [0.72, 1.01] |
| 2 Endotracheal re‐intubation during the week post extubation Show forest plot | 10 | 1431 | Risk Ratio (M‐H, Fixed, 95% CI) | 0.74 [0.64, 0.85] |
| 2.1 Ventilator‐generated NIPPV | 8 | 450 | Risk Ratio (M‐H, Fixed, 95% CI) | 0.39 [0.26, 0.59] |
| 2.2 Bilevel NIPPV | 1 | 136 | Risk Ratio (M‐H, Fixed, 95% CI) | 0.78 [0.50, 1.21] |
| 2.3 Mixed NIPPV devices | 1 | 845 | Risk Ratio (M‐H, Fixed, 95% CI) | 0.86 [0.72, 1.01] |
| 3 Abdominal distension requiring cessation of feeds Show forest plot | 3 | 136 | Risk Ratio (M‐H, Fixed, 95% CI) | 1.76 [0.77, 4.05] |
| 3.1 Ventilator‐generated NIPPV | 3 | 136 | Risk Ratio (M‐H, Fixed, 95% CI) | 1.76 [0.77, 4.05] |
| 3.2 Bilevel NIPPV | 0 | 0 | Risk Ratio (M‐H, Fixed, 95% CI) | 0.0 [0.0, 0.0] |
| 3.3 Mixed NIPPV devices | 0 | 0 | Risk Ratio (M‐H, Fixed, 95% CI) | 0.0 [0.0, 0.0] |
| 4 Gastrointestinal perforation Show forest plot | 6 | 1133 | Risk Ratio (M‐H, Fixed, 95% CI) | 0.94 [0.60, 1.48] |
| 4.1 Ventilator‐generated NIPPV | 6 | 1133 | Risk Ratio (M‐H, Fixed, 95% CI) | 0.94 [0.60, 1.48] |
| 4.2 Bilevel NIPPV | 0 | 0 | Risk Ratio (M‐H, Fixed, 95% CI) | 0.0 [0.0, 0.0] |
| 4.3 Mixed NIPPV devices | 0 | 0 | Risk Ratio (M‐H, Fixed, 95% CI) | 0.0 [0.0, 0.0] |
| 5 Necrotising enterocolitis Show forest plot | 6 | 1214 | Risk Ratio (M‐H, Fixed, 95% CI) | 0.87 [0.64, 1.19] |
| 5.1 Ventilator‐generated NIPPV | 4 | 219 | Risk Ratio (M‐H, Fixed, 95% CI) | 0.63 [0.21, 1.93] |
| 5.2 Bilevel NIPPV | 1 | 136 | Risk Ratio (M‐H, Fixed, 95% CI) | 1.03 [0.38, 2.78] |
| 5.3 Mixed NIPPV devices | 1 | 859 | Risk Ratio (M‐H, Fixed, 95% CI) | 0.89 [0.63, 1.24] |
| 6 Chronic lung disease (oxygen supplementation at 36 weeks) Show forest plot | 7 | 1168 | Risk Ratio (M‐H, Fixed, 95% CI) | 0.95 [0.81, 1.11] |
| 6.1 Ventilator‐generated NIPPV | 5 | 298 | Risk Ratio (M‐H, Fixed, 95% CI) | 0.69 [0.50, 0.95] |
| 6.2 Bilevel NIPPV | 1 | 128 | Risk Ratio (M‐H, Fixed, 95% CI) | 0.95 [0.59, 1.55] |
| 6.3 Mixed NIPPV devices | 1 | 742 | Risk Ratio (M‐H, Fixed, 95% CI) | 1.07 [0.88, 1.30] |
| 7 Pulmonary air leak Show forest plot | 6 | 1229 | Risk Ratio (M‐H, Fixed, 95% CI) | 0.48 [0.28, 0.82] |
| 7.1 Ventilator‐generated NIPPV | 4 | 243 | Risk Ratio (M‐H, Fixed, 95% CI) | 0.35 [0.16, 0.79] |
| 7.2 Bilevel NIPPV | 1 | 136 | Risk Ratio (M‐H, Fixed, 95% CI) | 0.0 [0.0, 0.0] |
| 7.3 Mixed NIPPV devices | 1 | 850 | Risk Ratio (M‐H, Fixed, 95% CI) | 0.61 [0.29, 1.28] |
| 8 Rates of apnoea (episodes/24 h) Show forest plot | 1 | 54 | Mean Difference (IV, Fixed, 95% CI) | ‐3.10 [‐7.92, 1.72] |
| 8.1 Ventilator‐generated NIPPV | 1 | 54 | Mean Difference (IV, Fixed, 95% CI) | ‐3.10 [‐7.92, 1.72] |
| 8.2 Bilevel NIPPV | 0 | 0 | Mean Difference (IV, Fixed, 95% CI) | 0.0 [0.0, 0.0] |
| 8.3 Mixed NIPPV devices | 0 | 0 | Mean Difference (IV, Fixed, 95% CI) | 0.0 [0.0, 0.0] |
| 9 Duration of hospitalisation (days) Show forest plot | 4 | 244 | Mean Difference (IV, Fixed, 95% CI) | 2.72 [‐0.01, 5.44] |
| 9.1 Ventilator‐generated NIPPV | 4 | 244 | Mean Difference (IV, Fixed, 95% CI) | 2.72 [‐0.01, 5.44] |
| 9.2 Bilevel NIPPV | 0 | 0 | Mean Difference (IV, Fixed, 95% CI) | 0.0 [0.0, 0.0] |
| 9.3 Mixed NIPPV devices | 0 | 0 | Mean Difference (IV, Fixed, 95% CI) | 0.0 [0.0, 0.0] |
| 10 Death before discharge Show forest plot | 6 | 1237 | Risk Ratio (M‐H, Fixed, 95% CI) | 0.69 [0.48, 0.99] |
| 10.1 Ventilator‐generated NIPPV | 4 | 241 | Risk Ratio (M‐H, Fixed, 95% CI) | 0.38 [0.18, 0.81] |
| 10.2 Bilevel NIPPV | 1 | 136 | Risk Ratio (M‐H, Fixed, 95% CI) | 0.62 [0.15, 2.48] |
| 10.3 Mixed NIPPV devices | 1 | 860 | Risk Ratio (M‐H, Fixed, 95% CI) | 0.85 [0.55, 1.31] |