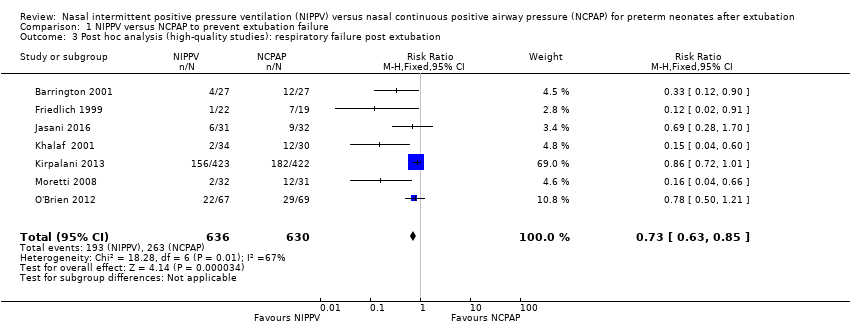
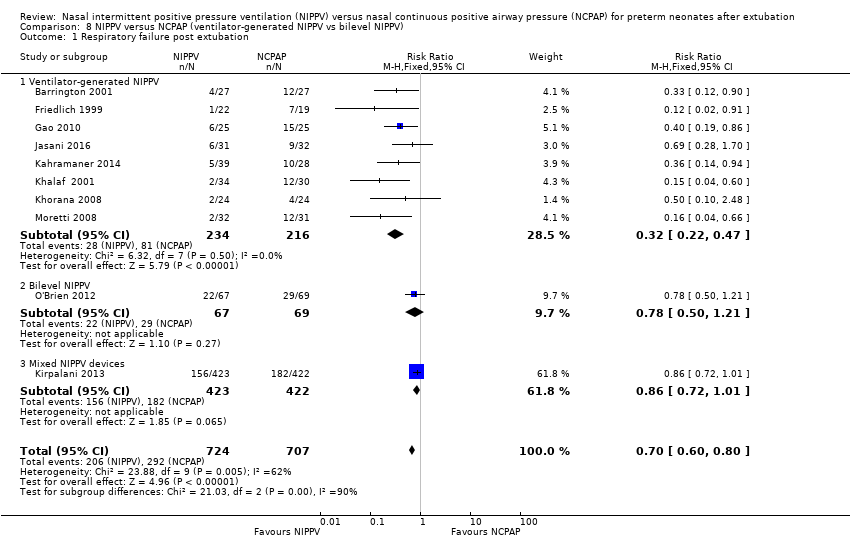
| 1 Respiratory failure post extubation Show forest plot | 10 | 1431 | Risk Ratio (M‐H, Fixed, 95% CI) | 0.70 [0.60, 0.80] |
|
| 1.1 Ventilator‐generated NIPPV | 8 | 450 | Risk Ratio (M‐H, Fixed, 95% CI) | 0.32 [0.22, 0.47] |
| 1.2 Bilevel NIPPV | 1 | 136 | Risk Ratio (M‐H, Fixed, 95% CI) | 0.78 [0.50, 1.21] |
| 1.3 Mixed NIPPV devices | 1 | 845 | Risk Ratio (M‐H, Fixed, 95% CI) | 0.86 [0.72, 1.01] |
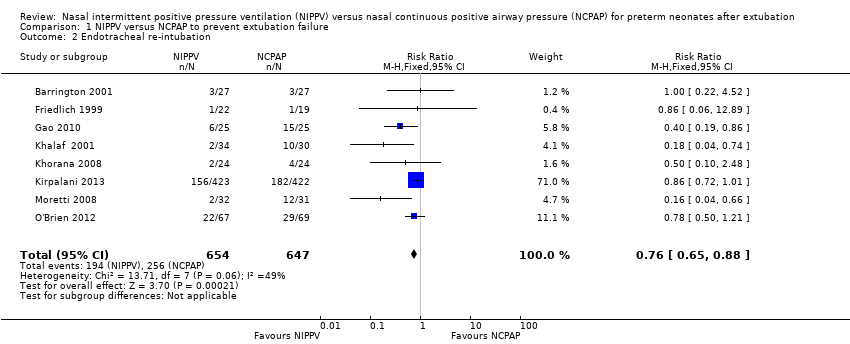
| 2 Endotracheal re‐intubation during the week post extubation Show forest plot | 10 | 1431 | Risk Ratio (M‐H, Fixed, 95% CI) | 0.74 [0.64, 0.85] |
|
| 2.1 Ventilator‐generated NIPPV | 8 | 450 | Risk Ratio (M‐H, Fixed, 95% CI) | 0.39 [0.26, 0.59] |
| 2.2 Bilevel NIPPV | 1 | 136 | Risk Ratio (M‐H, Fixed, 95% CI) | 0.78 [0.50, 1.21] |
| 2.3 Mixed NIPPV devices | 1 | 845 | Risk Ratio (M‐H, Fixed, 95% CI) | 0.86 [0.72, 1.01] |
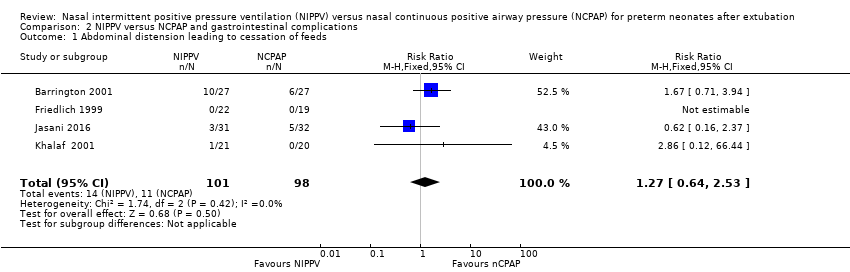
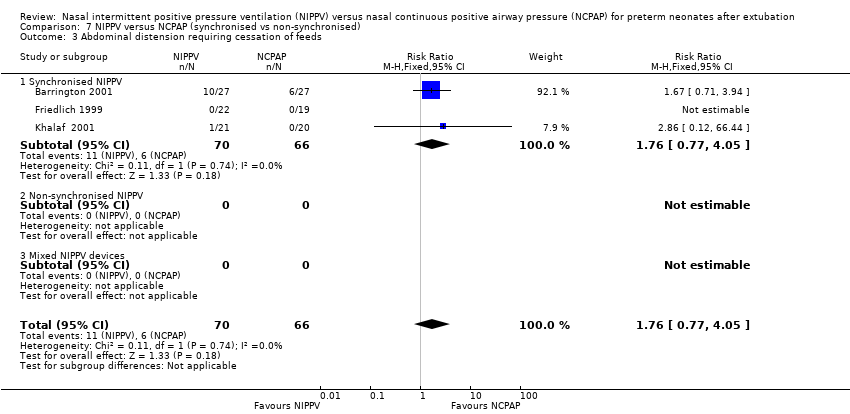
| 3 Abdominal distension requiring cessation of feeds Show forest plot | 3 | 136 | Risk Ratio (M‐H, Fixed, 95% CI) | 1.76 [0.77, 4.05] |
|
| 3.1 Ventilator‐generated NIPPV | 3 | 136 | Risk Ratio (M‐H, Fixed, 95% CI) | 1.76 [0.77, 4.05] |
| 3.2 Bilevel NIPPV | 0 | 0 | Risk Ratio (M‐H, Fixed, 95% CI) | 0.0 [0.0, 0.0] |
| 3.3 Mixed NIPPV devices | 0 | 0 | Risk Ratio (M‐H, Fixed, 95% CI) | 0.0 [0.0, 0.0] |
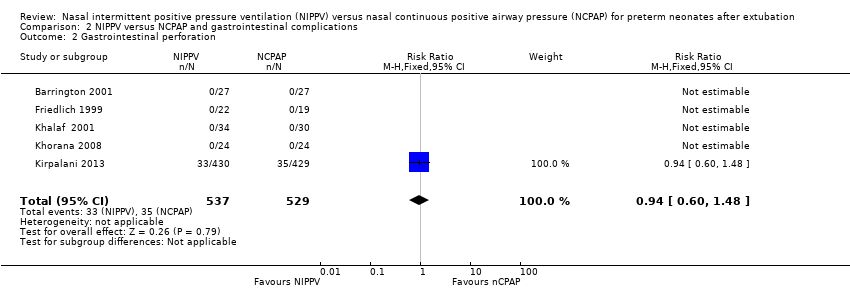
| 4 Gastrointestinal perforation Show forest plot | 6 | 1133 | Risk Ratio (M‐H, Fixed, 95% CI) | 0.94 [0.60, 1.48] |
|
| 4.1 Ventilator‐generated NIPPV | 6 | 1133 | Risk Ratio (M‐H, Fixed, 95% CI) | 0.94 [0.60, 1.48] |
| 4.2 Bilevel NIPPV | 0 | 0 | Risk Ratio (M‐H, Fixed, 95% CI) | 0.0 [0.0, 0.0] |
| 4.3 Mixed NIPPV devices | 0 | 0 | Risk Ratio (M‐H, Fixed, 95% CI) | 0.0 [0.0, 0.0] |
| 5 Necrotising enterocolitis Show forest plot | 6 | 1214 | Risk Ratio (M‐H, Fixed, 95% CI) | 0.87 [0.64, 1.19] |
|
| 5.1 Ventilator‐generated NIPPV | 4 | 219 | Risk Ratio (M‐H, Fixed, 95% CI) | 0.63 [0.21, 1.93] |
| 5.2 Bilevel NIPPV | 1 | 136 | Risk Ratio (M‐H, Fixed, 95% CI) | 1.03 [0.38, 2.78] |
| 5.3 Mixed NIPPV devices | 1 | 859 | Risk Ratio (M‐H, Fixed, 95% CI) | 0.89 [0.63, 1.24] |
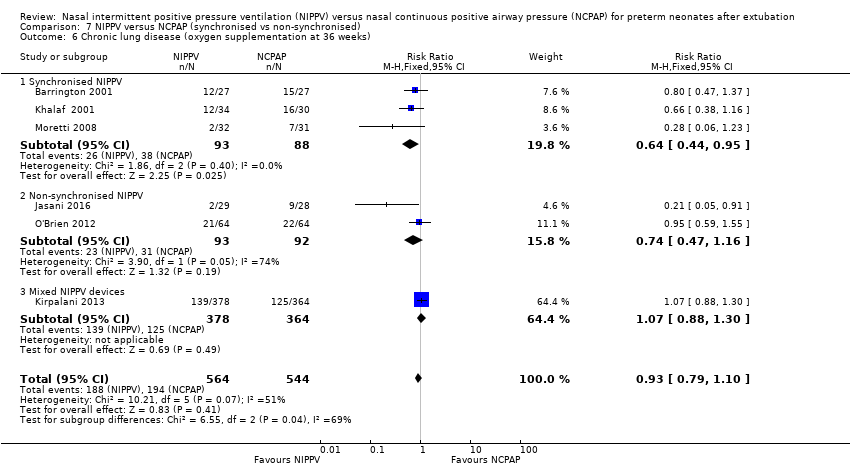
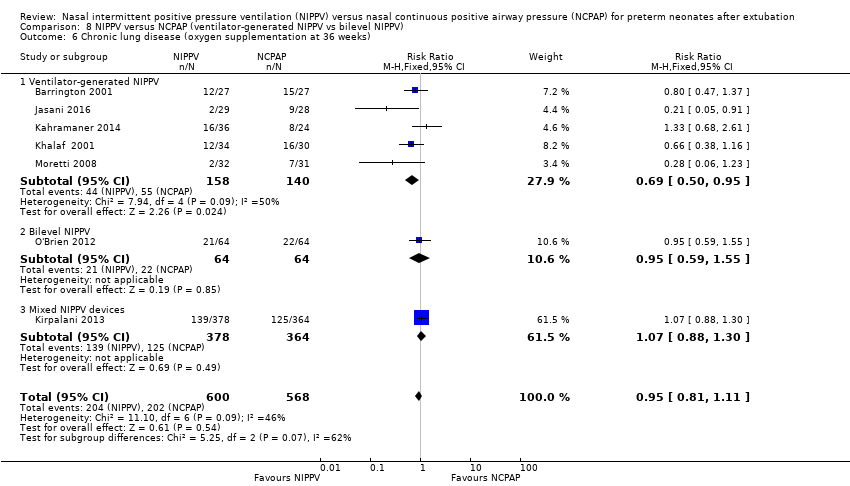
| 6 Chronic lung disease (oxygen supplementation at 36 weeks) Show forest plot | 7 | 1168 | Risk Ratio (M‐H, Fixed, 95% CI) | 0.95 [0.81, 1.11] |
|
| 6.1 Ventilator‐generated NIPPV | 5 | 298 | Risk Ratio (M‐H, Fixed, 95% CI) | 0.69 [0.50, 0.95] |
| 6.2 Bilevel NIPPV | 1 | 128 | Risk Ratio (M‐H, Fixed, 95% CI) | 0.95 [0.59, 1.55] |
| 6.3 Mixed NIPPV devices | 1 | 742 | Risk Ratio (M‐H, Fixed, 95% CI) | 1.07 [0.88, 1.30] |
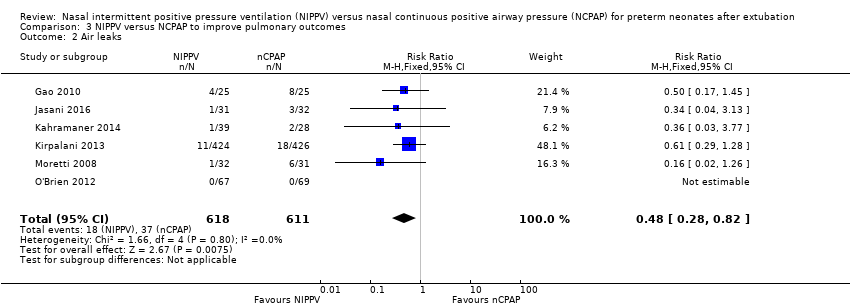
| 7 Pulmonary air leak Show forest plot | 6 | 1229 | Risk Ratio (M‐H, Fixed, 95% CI) | 0.48 [0.28, 0.82] |
|
| 7.1 Ventilator‐generated NIPPV | 4 | 243 | Risk Ratio (M‐H, Fixed, 95% CI) | 0.35 [0.16, 0.79] |
| 7.2 Bilevel NIPPV | 1 | 136 | Risk Ratio (M‐H, Fixed, 95% CI) | 0.0 [0.0, 0.0] |
| 7.3 Mixed NIPPV devices | 1 | 850 | Risk Ratio (M‐H, Fixed, 95% CI) | 0.61 [0.29, 1.28] |
| 8 Rates of apnoea (episodes/24 h) Show forest plot | 1 | 54 | Mean Difference (IV, Fixed, 95% CI) | ‐3.10 [‐7.92, 1.72] |
|
| 8.1 Ventilator‐generated NIPPV | 1 | 54 | Mean Difference (IV, Fixed, 95% CI) | ‐3.10 [‐7.92, 1.72] |
| 8.2 Bilevel NIPPV | 0 | 0 | Mean Difference (IV, Fixed, 95% CI) | 0.0 [0.0, 0.0] |
| 8.3 Mixed NIPPV devices | 0 | 0 | Mean Difference (IV, Fixed, 95% CI) | 0.0 [0.0, 0.0] |
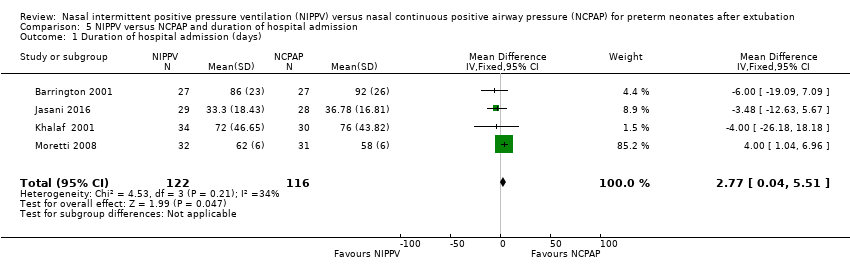
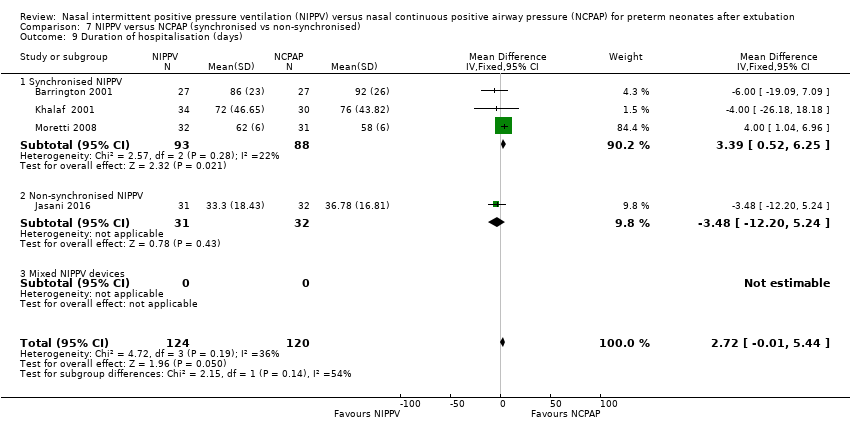
| 9 Duration of hospitalisation (days) Show forest plot | 4 | 244 | Mean Difference (IV, Fixed, 95% CI) | 2.72 [‐0.01, 5.44] |
|
| 9.1 Ventilator‐generated NIPPV | 4 | 244 | Mean Difference (IV, Fixed, 95% CI) | 2.72 [‐0.01, 5.44] |
| 9.2 Bilevel NIPPV | 0 | 0 | Mean Difference (IV, Fixed, 95% CI) | 0.0 [0.0, 0.0] |
| 9.3 Mixed NIPPV devices | 0 | 0 | Mean Difference (IV, Fixed, 95% CI) | 0.0 [0.0, 0.0] |
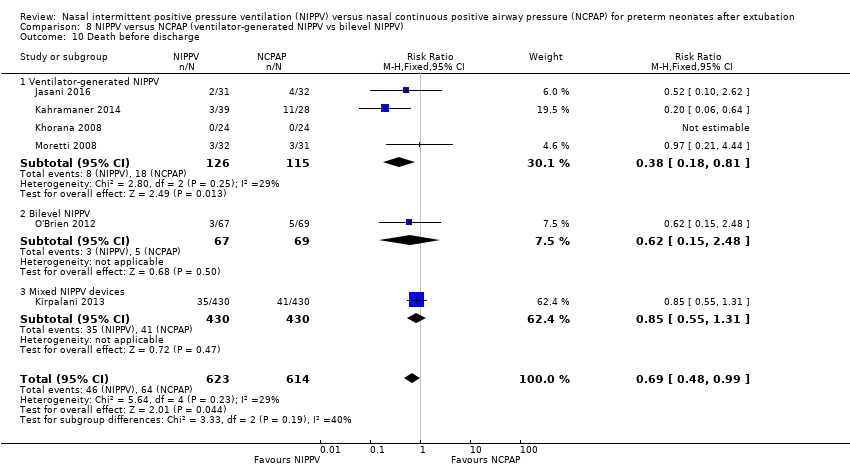
| 10 Death before discharge Show forest plot | 6 | 1237 | Risk Ratio (M‐H, Fixed, 95% CI) | 0.69 [0.48, 0.99] |
|
| 10.1 Ventilator‐generated NIPPV | 4 | 241 | Risk Ratio (M‐H, Fixed, 95% CI) | 0.38 [0.18, 0.81] |
| 10.2 Bilevel NIPPV | 1 | 136 | Risk Ratio (M‐H, Fixed, 95% CI) | 0.62 [0.15, 2.48] |
| 10.3 Mixed NIPPV devices | 1 | 860 | Risk Ratio (M‐H, Fixed, 95% CI) | 0.85 [0.55, 1.31] |