Ventilación nasal con presión positiva intermitente (VNPPI) precoz versus presión positiva nasal continua de las vías respiratorias (PPNCVR) en lactantes prematuros después de la extubación
Resumen
Antecedentes
Ensayos aleatorizados y metanálisis previos han mostrado que la presión positiva nasal continua de las vías respiratorias (PPNCVR) es un método útil para proporcionar asistencia respiratoria después de la extubación. Sin embargo, este tratamiento a veces "falla" en los lactantes, y pueden requerir reintubación endotraqueal con los riesgos y gastos que conlleva. La ventilación nasal con presión positiva intermitente (VNPPI) puede ser mejor que la PPNCVR al proporcionar respiraciones del ventilador a través de cánulas nasales. Los niños mayores y los adultos con insuficiencia respiratoria crónica se benefician de la VNPPI, y la técnica se ha aplicado a los recién nacidos. Sin embargo, con los métodos más antiguos de administración de la VNPPI se han informado efectos secundarios graves, que incluyen perforación gástrica.
Objetivos
Objetivo primario
Comparar los efectos del tratamiento con VNPPI versus PPNCVR sobre la necesidad de apoyo ventilatorio adicional en lactantes prematuros a los que se les retiró el tubo endotraqueal después de un período de ventilación con presión positiva intermitente.
Objetivos secundarios
Comparar las tasas de distensión gástrica, perforación gastrointestinal, enterocolitis necrosante y enfermedad pulmonar crónica; la duración de la hospitalización; y las tasas de apnea, las pérdidas de aire y la mortalidad por VNPPI y PPNCVR.
Métodos de búsqueda
Se utilizó la estrategia de búsqueda estándar del Grupo Cochrane de Neonatología (Cochrane Neonatal Group) para realizar búsquedas en el Registro Cochrane Central de Ensayos Controlados (CENTRAL; 2015, Número 9), MEDLINE vía PubMed (1966 hasta el 28 de septiembre de 2015), Embase (1980 hasta el 28 de septiembre de 2015) y en el Cumulative Index to Nursing and Allied Health Literature (CINAHL; 1982 al 28 de septiembre de 2015). También se buscaron ensayos controlados aleatorizados y cuasialeatorizados en las bases de datos de ensayos clínicos, en las actas de congresos y en las listas de referencias de los artículos recuperados.
Criterios de selección
Se incluyeron los ensayos aleatorizados y cuasialeatorizados que compararon el uso de VNPPI versus PPNCVR en lactantes prematuros extubados. La VNPPI incluyó apoyo no invasivo suministrado por un ventilador mecánico o un dispositivo de dos niveles de forma sincronizada o no sincronizada. Entre los participantes se encontraron lactantes prematuros ventilados que estaban listos para ser extubados para recibir una asistencia respiratoria no invasiva. Las intervenciones comparadas fueron VNPPI, administrada mediante cánulas nasales cortas o tubo nasofaríngeo y PPNCVR, administrada por los mismos métodos.
Entre los tipos de medidas de resultado se incluyeron el fracaso del tratamiento (insuficiencia respiratoria, tasas de reintubación endotraqueal); las complicaciones gastrointestinales (es decir, distensión abdominal que requiere el cese de la alimentación, la perforación gastrointestinal o la enterocolitis necrosante); las pérdidas de aire pulmonar; la enfermedad pulmonar crónica (necesidad de oxígeno a las 36 semanas de edad posmenstrual) y la mortalidad.
Obtención y análisis de los datos
Tres autores de la revisión, de forma independiente, extrajeron los datos relacionados con los resultados clínicos, que incluyen el fracaso de la extubación; la reintubación endotraqueal; las tasas de apnea, la perforación gastrointestinal, la intolerancia alimentaria, la enterocolitis necrosante, la enfermedad pulmonar crónica y las pérdidas de aire; así como la duración de la estancia hospitalaria. Los ensayos se analizaron mediante el riesgo relativo (RR), la diferencia de riesgos (DR) y el número necesario a tratar para un resultado beneficioso adicional (NNTB) o un resultado perjudicial adicional (NNTH) para los resultados dicotómicos, y la diferencia de medias (DM) para los resultados continuos. Se utilizó el enfoque GRADE (Recommendations Assessment, Development, and Evaluation) para evaluar la calidad de la evidencia.
Resultados principales
A través de la búsqueda se identificaron diez ensayos que reclutaron un total de 1431 lactantes y que compararon la extubación de los lactantes con VNPPI o PPNCVR. Tres ensayos tuvieron limitaciones metodológicas y posible sesgo de selección.
Cinco ensayos utilizaron la forma sincronizada de VNPPI, cuatro la forma no sincronizada y uno utilizó ambos métodos. Ocho estudios utilizaron VNPPI administrada por un ventilador, uno utilizó un dispositivo de dos niveles y uno utilizó ambos métodos. Cuando se incluyeron todos los estudios, el metanálisis demostró una reducción estadística y clínicamente significativa en el riesgo de cumplir con los criterios de fracaso de la extubación (RR típico 0,70; IC del 95%: 0,60 a 0,80; DR típica ‐0,13; IC del 95%: ‐0,17 a ‐0,08; NNTB 8; IC del 95%: 6 a 13; diez ensayos, 1431 lactantes) y de necesitar reintubación (RR típico 0,76; IC del 95%: 0,65 a 0,88; DR típica ‐0,10; IC del 95%: ‐0,15 a ‐0,05; NNTB 10; IC del 95%: 7 a 20; diez ensayos, 1431 lactantes). La evidencia de estos resultados se consideró moderada, ya que todas las intervenciones de los ensayos fueron no cegadas. Aunque los métodos de sincronización variaron (cápsula de Graseby o neumotacógrafo/disparador de flujo), los cinco ensayos que utilizaron la forma sincronizada de VNPPI mostraron un beneficio estadísticamente significativo en los lactantes extubados a la VNPPI en cuanto a la prevención del fracaso de la extubación hasta una semana después de la misma.
La VNPPI no sincronizada también redujo el fracaso de la extubación. La VNPPI proporcionada a través de un ventilador es más beneficiosa que la proporcionada mediante dispositivos de dos niveles para reducir el fracaso de la extubación durante la primera semana. Al comparar las intervenciones, los investigadores no encontraron una reducción significativa en las tasas de enfermedad pulmonar crónica (RR típico 0,94; IC del 95%: 0,80 a 1,10; DR típica ‐0,02; IC del 95%: ‐0,08 a 0,03) o de muerte, y ninguna diferencia en la incidencia de enterocolitis necrosante. Las pérdidas de aire se redujeron en los lactantes asignados al azar a VNPPI (RR típico 0,48; IC del 95%: 0,28 a 0,82; DR típica ‐0,03; IC del 95%: ‐0,05 a ‐0,01; NNTB 33; IC del 95%: 20 a 100). La calidad de la evidencia se consideró moderada (estudios no cegados) o baja (imprecisión) para los resultados secundarios.
Conclusiones de los autores
Implicaciones para la práctica
La VNPPI reduce la incidencia de fracaso de la extubación y la necesidad de reintubación en el transcurso de 48 horas a una semana de manera más eficaz que la PPNCVR; sin embargo, no tiene efectos sobre la enfermedad pulmonar crónica ni la mortalidad. La sincronización puede ser importante para que la VNPPI sea efectiva. El dispositivo utilizado para administrar la VNPPI puede ser importante; sin embargo, los datos no son suficientes para apoyar conclusiones sólidas. La VNPPI no parece asociarse con un aumento de los efectos secundarios gastrointestinales.
Implicaciones para la investigación
Ensayos grandes deberían establecer el impacto de la sincronización de la VNPPI sobre la seguridad y la eficacia de la técnica y deberían comparar la eficacia de los dispositivos de dos niveles versus un ventilador para proporcionar VPPNI.
PICOs
Resumen en términos sencillos
Ventilación nasal con presión positiva intermitente (VNPPI) precoz versus presión positiva nasal continua de las vías respiratorias (PPNCVR) en lactantes prematuros después de la extubación
Pregunta de la revisión
¿La ventilación nasal con presión positiva intermitente (VNPPI) tiene efectos beneficiosos a corto y largo plazo sin causar efectos perjudiciales en los lactantes prematuros que salen de un ventilador? ¿Cómo se compara con la presión positiva nasal continua de las vías respiratorias (PPNCVR)?
Antecedentes
La evidencia indica que la VNPPI aumenta la eficacia de la PPNCVR en los lactantes prematuros que ya no necesitan un tubo endotraqueal (tubo en la tráquea). Los lactantes prematuros con problemas respiratorios a menudo requieren la ayuda de una máquina (ventilador) que permite respiraciones regulares a través de un tubo colocado en la tráquea. El proceso de extubación o extracción de este tubo no siempre se realiza sin problemas, y puede ser necesario volver a insertar el tubo si el lactante no puede respirar sin ayuda. La PPNCVR y la VNPPI son formas de apoyar la respiración de los lactantes de una manera mínimamente invasiva (los tubos son cortos y llegan sólo a la parte posterior de la nariz, causando así un daño mínimo a los pulmones). La PPNCVR y la VNPPI se pueden utilizar después de la extubación para reducir el número de lactantes que necesitan la reinserción del tubo endotraqueal. La PPNCVR proporciona una presión constante en la parte posterior de la nariz que se transmite a los pulmones, lo que ayuda al lactante a respirar con mayor comodidad. La VNPPI proporciona el mismo apoyo, pero además agrega algunas respiraciones a través del ventilador.
Características de los estudios
Se buscaron en las bases de datos científicas estudios que compararan la PPNCVR versus la VNPPI en lactantes prematuros (nacidos antes de las 37 semanas completas de embarazo) que ya no necesitan un tubo endotraqueal. Se analizaron los problemas respiratorios, la necesidad de volver a insertar el tubo endotraqueal y los efectos secundarios. La evidencia está actualizada hasta septiembre de 2015.
Resultados clave
Se encontraron diez ensayos que compararon PPNCVR versus VNPPI. Seis de los diez estudios que compararon la PPNCVR y la VNPPI mostraron que la VPPNI redujo la necesidad de volver a insertar el tubo endotraqueal. Los estudios futuros deben determinar la mejor manera de administrar la VNPPI a los lactantes.
Calidad de la evidencia
En los ensayos clínicos, los médicos e investigadores conocían la intervención que recibía cada lactante (VNPPI o PPNCVR). Por lo tanto, la calidad de la evidencia para el resultado primario (problemas respiratorios y necesidad de reinserción del tubo endotraqueal) se consideró moderada.
Authors' conclusions
Summary of findings
| NIPPV versus NCPAP | ||||||
| Patient or population: preterm neonates after extubation | ||||||
| Outcomes | Anticipated absolute effects* (95% CI) | Relative effect | Number of participants | Quality of the evidence | Comments | |
| Risk with NCPAP | Risk with NIPPV | |||||
| Respiratory failure post extubation | Study population | RR 0.70 | 1431 | Moderatea | Risk of bias: intervention unblinded OIS 554 | |
| 413 per 1000 | 289 per 1000 | |||||
| Endotracheal re‐intubation during the week post extubation | Study population | RR 0.76 | 1301 (8 studies) | Moderatea | Risk of bias: intervention unblinded OIS 724 | |
| 396 per 1000 | 301 per 1000 | |||||
| Abdominal distension requiring cessation of feeds | Study population | RR 1.27 | 199 (4 studies) | Lowa,b | Risk of bias: intervention unblinded Imprecision: wide confidence intervals | |
| 112 per 1000 | 143 per 1000 | |||||
| Gastrointestinal perforation | Study population | RR 0.94 | 1066 (5 studies) | Moderatea | Risk of bias: intervention unblinded | |
| 66 per 1000 | 62 per 1000 | |||||
| Necrotising enterocolitis | Study population | RR 0.87 | 1214 | Moderatea | Risk of bias: intervention unblinded | |
| 127 per 1000 | 110 per 1000 | |||||
| Chronic lung disease (oxygen supplementation at 36 weeks) | Study population | RR 0.94 | 1140 (6 studies) | Moderatea | Risk of bias: intervention unblinded | |
| 355 per 1000 | 334 per 1000 | |||||
| Pulmonary air leak | Study population | RR 0.48 | 1229 | Moderatea | Risk of bias: intervention unblinded OIS 749 | |
| 61 per 1000 | 29 per 1000 | |||||
| Duration of hospitalisation (days) | Mean duration of hospitalisation (days) was 0 | Mean duration of hospitalisation (days) in the intervention group was 2.77 higher (0.04 to 5.51 higher) | 238 | Lowa,b | Risk of bias: intervention unblinded Imprecision: wide confidence intervals | |
| Death before discharge | Study population | RR 0.69 | 1237 | Moderatea | Risk of bias: intervention unblinded Imprecision OIS 1844 | |
| 104 per 1000 | 72 per 1000 | |||||
| *The risk in the intervention group (and its 95% confidence interval) is based on assumed risk in the comparison group and the relative effect of the intervention (and its 95% CI). | ||||||
| GRADE Working Group grades of evidence. | ||||||
| aIntervention unblinded. bImprecise estimate (wide confidence intervals). | ||||||
Background
Description of the condition
Preterm infants may experience difficulty with spontaneous, unassisted breathing for a variety of reasons, including lung immaturity, chest wall instability, upper airway obstruction and poor central respiratory drive. Historically, the primary method of support for these infants has consisted of endotracheal intubation and intermittent positive pressure ventilation. Although this method is effective, it is accompanied by complications (upper airway damage, bronchopulmonary dysplasia, sepsis) and is associated with considerable economic cost. Minimising the duration of endotracheal intubation or avoiding it completely has been a goal of neonatal intensive care. Nasal continuous positive airway pressure (NCPAP) is a less invasive way of providing respiratory support for neonates at risk of, or actually experiencing, respiratory failure. One systematic review of trials comparing NCPAP versus treatment with oxyhood concluded that NCPAP begun immediately after a period of endotracheal intubation reduced the rate of adverse events (apnoea, respiratory acidosis and increased oxygen requirements) leading to re‐intubation (Bancalari 2013; Davis 2003b). In this systematic review, approximately 25% of all preterm infants allocated to NCPAP failed extubation; therefore, the need exists to improve outcomes further for infants thought to no longer require an endotracheal tube.
Adults and older children with acute or chronic ventilatory failure of various origins, including chronic obstructive pulmonary disease (Bott 1993), severe kyphoscoliosis (Ellis 1988) and pre‐lung transplantation cystic fibrosis (Piper 1992), have been treated with intermittent positive pressure ventilation delivered via a nasal interface. Clinicians have reported improvements in respiratory function.
Description of the intervention
Nasal intermittent positive pressure ventilation (NIPPV) is a simple, effective mode of respiratory support. NIPPV augments continuous positive airway pressure (CPAP) with superimposed inflations to a set peak pressure (typically 15 to 22 cmH2O). NIPPV may be delivered by nasal mask or prongs, which may be short or long, single or binasal. Some devices attempt to synchronise inflations with the infant's respiratory efforts (Owen 2007). Synchronisation can occur via pneumatic capsules detecting abdominal wall movements or by airway‐derived flow signals. Trigger delays occur, and trigger response is less consistent at high spontaneous breathing rates (Owen 2016).
How the intervention might work
NIPPV has been used in neonates for a variety of indications. About 53% of Canadian tertiary care nurseries reported using NIPPV in the mid‐1980s (Ryan 1989). More recently, 44 of 91 (48%) neonatal units in the UK reported using NIPPV (Owen 2008). The physiological benefits of this technique have been evaluated. NIPPV reduces asynchronous thoracoabdominal motion, perhaps by reducing tube resistance or providing better stabilisation of the chest wall, or both (Kiciman 1998). Its use improves tidal and minute volumes and decreases the inspiratory effort required by neonates compared with NCPAP (Moretti 1999). NIPPV has not been provided without problems in neonates; Garland 1985 reported an association between use of ventilation via nasal prongs and increased risk of gastrointestinal perforation. In the past, lack of high‐quality evidence has led to variability in practice between neonatal intensive care units with respect to NIPPV.
Newer devices now on the market, which are not ventilators, provide bilevel respiratory support (higher positive pressure followed by lower pressure); however, they have limited peak pressure capabilities (i.e. they generally cannot provide more than 10 cmH2O of peak positive pressure). Some devices have the ability to synchronise higher pressure with the infant's own breaths by using a trigger biphasic mode. Whether these devices are comparable with more conventional NIPPV delivered via a ventilator is unclear, as they cannot attain peak inspiratory pressure (PIP) similar to that achieved by NIPPV delivered via a ventilator. Whether synchronisation adds clinical benefit remains unclear (Davis 2009). For the purposes of this review, we will use the term 'NIPPV' to describe all forms of non‐invasive ventilation that intermittently provide supportive breaths or higher pressure.
Why it is important to do this review
Avoiding or reducing time spent on invasive ventilation is a goal of treatment for all premature infants. Many published studies have reported use of various forms of NIPPV or bilevel support, often including a small number of infants or a single centre. We are conducting this review to provide bedside clinicians with the best available evidence regarding their choice of non‐invasive support.
Objectives
Primary objective
To determine effects of management with NIPPV versus NCPAP on the need for additional ventilatory support in preterm infants whose endotracheal tube was removed after a period of intermittent positive pressure ventilation.
Secondary objectives
To compare rates of gastric distension, gastrointestinal perforation, necrotising enterocolitis and chronic lung disease; duration of hospitalisation; and rates of apnoea, air leak and mortality for NIPPV and NCPAP.
Methods
Criteria for considering studies for this review
Types of studies
Randomised and quasi‐randomised trials.
Types of participants
Preterm infants (i.e. those born before 37 completed weeks' gestation) extubated after a period of endotracheal intubation.
Types of interventions
Intermittent positive pressure ventilation provided by a ventilator or a bilevel device and administered via the nasal route by short nasal prongs or nasopharyngeal tubes versus NCPAP delivered by the same methods. NIPPV included non‐invasive support delivered by a mechanical ventilator or a bilevel device in a synchronised or non‐synchronised way.
Types of outcome measures
Primary outcomes
-
Respiratory failure defined by respiratory acidosis, increased oxygen requirement or apnoea that was frequent or severe, leading to additional ventilatory support during the week post extubation
Secondary outcomes
-
Endotracheal re‐intubation during the week post extubation
-
Rates of abdominal distension requiring cessation of feeds
-
Rates of gastrointestinal perforation diagnosed radiologically or at operation
-
Rates of necrotising enterocolitis (NEC), defined according to modified Bell's criteria (stage 2 to 3)
-
Rates of chronic lung disease (CLD), defined as requirement for supplemental oxygen at 28 days of life or at 36 weeks' postmenstrual age
-
Duration of hospitalisation
-
Rates of apnoea and bradycardia expressed as events per hour
-
Rates of pulmonary air leak
-
Mortality
-
Neurodevelopmental status at 18 to 24 months (post hoc, 2015 update)
Search methods for identification of studies
We used the criteria and standard methods of Cochrane and the Cochrane Neonatal Review Group (see the Cochrane Neonatal Group search strategy for specialized register).
We conducted a comprehensive search including the Cochrane Central Register of Controlled Trials (CENTRAL; 2015, Issue 9) in the Cochrane Library; MEDLINE via PubMed (1966 to 28 September 2015); Embase (1980 to 28 September 2015); and the Cumulative Index to Nursing and Allied Health Literature (CINAHL; 1982 to 28 September 2015) using the following search terms: (nasal continuous positive airway pressure OR NCPAP OR nasal intermittent positive pressure ventilation OR NIPPV OR nasal intermittent mandatory ventilation OR NIMV OR nasal distending pressure OR nasal positive pressure OR nasal ventilation OR non‐invasive positive pressure ventilation OR synchronized intermittent mandatory ventilation OR SIMV OR nasopharyngeal synchronized intermittent mandatory ventilation OR bilevel CPAP OR BiCPAP OR BiPAP OR SiPAP), plus database‐specific limiters for randomised controlled trials (RCTs) and neonates (see Appendix 1 for the full search strategies used for each database). We applied no language restrictions.
We searched clinical trials registries for ongoing and recently completed trials (clinicaltrials.gov; the World Health Organization International Trials Registry and Platform (www.whoint/ictrp/search/en/) and the ISRCTN Registry).
Data collection and analysis
Three review authors (BL, PGD and HK) used standard methods of Cochrane and the Cochrane Neonatal Review Group to assess the methodological quality of trials.
Selection of studies
We included all randomised and quasi‐randomised controlled trials of NIPPV compared with NCPAP in ventilated preterm infants ready for extubation. Three review authors (BL, PGD and HK) independently reviewed results of the updated search and selected studies for inclusion. We resolved disagreements by discussion.
Data extraction and management
Three review authors (BL, PGD and HK) independently extracted data, compared entries and resolved differences by discussion. For the 2015 update, one review author (BL) and the Cochrane Neonatal Review Group Editor extracted data, compared entries and resolved differences.
Assessment of risk of bias in included studies
Three review authors (BL, PGD and HK) independently assessed the quality of studies using the following criteria: blinding of randomisation, blinding of intervention, completeness of follow‐up and blinding of outcome measurement. We sought additional information from study authors when required.
For the update, we assessed risk of bias using the criteria outlined in the Cochrane Handbook for Systematic Reviews of Interventions (Higgins 2011) and presented this information in the 'Risk of bias tables'.
We assessed the methodological quality of studies by using the following criteria.
-
Sequence generation (checking for possible selection bias): For each included study, we categorised the method used to generate the allocation sequence as:
-
low risk (any truly random process, e.g. random number table; computer random number generator);
-
high risk (any non‐random process, e.g. odd or even date of birth; hospital or clinic record number); or
-
unclear risk.
-
-
Allocation concealment (checking for possible selection bias): For each included study, we categorised the method used to conceal the allocation sequence as:
-
low risk (e.g. telephone or central randomisation; consecutively numbered sealed opaque envelopes);
-
high risk (open random allocation; unsealed or non‐opaque envelopes, alternation; date of birth); or
-
unclear risk.
-
-
Blinding (checking for possible performance bias): For each included study, we categorised the methods used to blind study participants and personnel from knowledge of which intervention a participant received. We assessed blinding separately for different outcomes or classes of outcomes. We categorised methods as:
-
low risk for participants, personnel and outcome assessors;
-
high risk for participants, personnel and outcome assessors; or
-
unclear risk for participants, personnel and outcome assessors.
-
-
Incomplete outcome data (checking for possible attrition bias through withdrawals, drop‐outs, protocol deviations): For each included study and for each outcome, we described completeness of data including attrition and exclusions from the analysis. We noted whether attrition and exclusions were reported, numbers included in the analysis at each stage (compared with the total number of randomised participants), reasons for attrition or exclusion when reported and whether missing data were balanced across groups or were related to outcomes. When sufficient information was reported or supplied by trial authors, we re‐included missing data in the analyses. We categorised methods as:
-
low risk (less than 20% missing data);
-
high risk (20% or more missing data); or
-
unclear risk.
-
-
Selective reporting bias: For each included study, we described how we investigated the possibility of selective outcome reporting bias and what we found. We assessed methods as:
-
low risk (when it was clear that all of the study's prespecified outcomes and all expected outcomes of interest to the review had been reported);
-
high risk (when not all of the study's prespecified outcomes had been reported; one or more reported primary outcomes were not prespecified; outcomes of interest were reported incompletely and so could not be used; or study did not include results of a key outcome that would have been expected to have been reported); or
-
unclear risk.
-
-
Other sources of bias: For each included study, we described any important concerns that we had about other possible sources of bias (e.g. whether a potential source of bias was related to the specific study design, whether the trial was stopped early owing to some data‐dependent process). We assessed whether each study was free of other problems that could put it at risk of bias as:
-
low risk;
-
high risk; or
-
unclear risk.
-
We made explicit judgements regarding whether studies were at high risk of bias, according to the criteria given in the Cochrane Handbook for Systematic Reviews of Interventions (Higgins 2011). We assessed the likely magnitude and direction of the bias, and whether we considered it likely to impact findings. If needed, we planned to explore the impact of the level of bias by undertaking sensitivity analyses (see Sensitivity analysis).
Quality of evidence
We assessed the quality of evidence for the main comparison at the outcome level using the Grading of Recommendations Assessment, Development and Evaluation (GRADE) approach (Guyatt 2011a). This methodological approach considers evidence from RCTs as high quality that may be downgraded on the basis of consideration of any of five areas: design (risk of bias), consistency across studies, directness of the evidence, precision of estimates and presence of publication bias (Guyatt 2011a). The GRADE approach results in an assessment of the quality of a body of evidence according to one of the following four grades. High: We are very confident that the true effect lies close to that of the estimate of effect. Moderate: We are moderately confident in the effect estimate: The true effect is likely to be close to the estimate of effect but may be substantially different. Low: Our confidence in the effect estimate is limited: The true effect may be substantially different from the estimate of effect. Very low: We have very little confidence in the effect estimate: The true effect is likely to be substantially different from the estimate of effect (Schünemann 2013).
Review authors independently assessed the quality of the evidence found for outcomes identified as critical or important for clinical decision making. These outcomes included:
-
Respiratory failure (defined by respiratory acidosis, increased oxygen requirement or apnoea that was frequent or severe, leading to additional ventilatory support during the week post extubation);
-
Endotracheal re‐intubation during the week post extubation;
-
Rates of CLD, defined as requirement for supplemental oxygen at 36 weeks' postmenstrual age;
-
Rates of pulmonary air leak;
-
Rates of NEC, defined according to modified Bell's criteria (stage 2 to 3);
-
Mortality; and
-
Neurodevelopmental outcomes at 18 to 24 months.
When we considered risk of bias arising from inadequate concealment of allocation, randomised assignment, complete follow‐up or blinded outcome assessment to reduce our confidence in effect estimates, we downgraded the quality of evidence accordingly (Guyatt 2011b). We evaluated consistency by examining similarity of point estimates, extent of overlap of confidence intervals and statistical criteria including measurement of heterogeneity (I2). We downgraded the quality of evidence when large and unexplained inconsistency across study results was present (i.e. some studies suggest important benefit and others no effect or harm without a clinical explanation) (Guyatt 2011d). We assessed precision on the basis of the width of the 95% confidence interval (CI) and calculation of the optimal information size (OIS). If the total number of participants included in the pooled effect estimation was less than the number of participants generated by a conventional sample size calculation for a single adequately powered trial, we considered rating down for imprecision (Guyatt 2011c). When trials were conducted in populations other than the target population, we downgraded the quality of evidence because of indirectness (Guyatt 2011e).
We entered data (i.e. pooled estimates of effects and corresponding 95% confidence Intervals) and explicit judgements for each of the above aspects assessed into the Guideline Development Tool ‐ the software used to create ‘Summary of findings’ tables (GRADEpro 2008). We explained in footnotes or comments in the ‘Summary of findings’ table all judgements involving assessment of the study characteristics described above.
Measures of treatment effect
We analysed categorical data (proportion requiring re‐intubation) using risk ratio (RR), risk difference (RD) and number needed to treat for an additional beneficial outcome (NNTB) or an additional harmful outcome (NNTH). We reported 95% confidence intervals (CIs) on all estimates. We analysed continuous data (frequency of apnoea) using mean difference (MD). We applied the fixed‐effect model.
Assessment of heterogeneity
We examined heterogeneity between trials by inspecting forest plots and quantifying the impact of heterogeneity using the I2 statistic. If noted, we planned to explore possible causes of statistical heterogeneity by performing prespecified subgroup analyses (e.g. differences in study quality, participants, intervention regimens or outcome assessments).
Data synthesis
We used the Mantel‐Haenszel method for estimates of typical RR and RD. We analysed continuous outcomes using the inverse variance method. We applied the fixed‐effect model for all meta‐analyses.
Subgroup analysis and investigation of heterogeneity
We planned to perform subgroup analyses using the same methods to determine whether responses differed according to methods of NIPPV delivery and whether or not methylxanthines were used concurrently. We planned subgroup analyses on the basis of characteristics of participants, including birth weight (e.g. infants weighing less than 1000 grams) and corrected age at the time of intervention (e.g. infants less than 28 weeks' gestation).
Sensitivity analysis
We planned sensitivity analyses for situations for which this might affect interpretation of significant results (e.g. when risk of bias was associated with the quality of some included trials or missing outcome data). We judged none to be necessary in this review.
Results
Description of studies
Included studies
We identified ten trials that met the inclusion criteria of this review (1431 infants) (Figure 1) (Barrington 2001; Friedlich 1999; Gao 2010; Jasani 2016; Kahramaner 2014; Khalaf 2001; Khorana 2008; Kirpalani 2013; Moretti 2008; O'Brien 2012). We provided details in the Characteristics of included studies table.

Study flow diagram: review update.
Inclusion criteria varied somewhat between trials; seven trials enrolled very low birth weight (VLBW) infants (i.e. infants at moderate risk of requiring endotracheal re‐intubation), one trial exclusively enrolled extremely low birth weight infants (ELBW) and two trials enrolled premature infants at less than 35 or 36 weeks' gestation. In six trials, use of methylxanthines was mandatory (Barrington 2001; Jasani 2016; Kahramaner 2014; Khalaf 2001; Khorana 2008; Moretti 2008), and in three other trials, it was extensively prescribed (Friedlich 1999; Kirpalani 2013; O'Brien 2012). Infants were extubated from generally low levels of ventilator support (ventilator rates less than 25 breaths per minute and oxygen concentrations less than 40%). Differences in settings between studies were small. An interesting variation in ventilatory strategies was noted between centres, in spite of little variation in enrolment criteria. Barrington 2001,Gao 2010,Jasani 2016, Kahramaner 2014,Khalaf 2001,Moretti 2008 and O'Brien 2012 extubated infants at a median age of less than one week, whereas Friedlich 1999 and Khorana 2008 extubated infants later (median age of 18.5 days and 21 days in the two groups in Friedlich 1999; mean age of 12.9 days and 6.9 days in the two groups in Khorana 2008).
Five trials synchronised NIPPV delivery; three trials used the Infant Star ventilator with Star Synch abdominal capsule (Barrington 2001; Friedlich 1999; Khalaf 2001), and two used more recent ventilators (Gao 2010; Moretti 2008). One trial used bilevel devices (SiPAP) to deliver non‐synchronised intermittent positive pressure ventilation (O'Brien 2012), two trials used ventilators to deliver non‐synchronised NIPPV (Jasani 2016; Kahramaner 2014) and another permitted use of ventilator‐driven NIPPV (synchronised or not) or bilevel devices (synchronised or not) (Kirpalani 2013).
Ventilator settings applied after extubation varied between studies. Intermittent mechanical ventilation rates varied between 10 per minute and 40 per minute, and PIP from that used before extubation to 2 cmH2O to 4 cmH2O above that used before extubation. Levels used in NCPAP groups also varied between studies (between 3 cmH2O and 8 cmH2O). No attempt was made to match NIPPV and NCPAP groups with respect to mean airway pressure delivered. Different prongs were used to deliver NCPAP and NIPPV; three studies used nasopharyngeal prongs (single or binasal) (Friedlich 1999; Kahramaner 2014; Khorana 2008), and the others used short nasal prongs. Barrington 2001, Jasani 2016, Khalaf 2001 and Moretti 2008 assessed the primary outcome (respiratory failure) over 72 hours post extubation, Friedlich 1999 and Kahramaner 2014 over 48 hours and Khorana 2008,Kirpalani 2013 and O'Brien 2012 over seven days. The assessment period was unclear in Gao 2010.
Three studies (Barrington 2001; Friedlich 1999; Khalaf 2001) permitted rescue NIPPV for infants not responding to NCPAP but analysed the primary outcome on an intention‐to‐treat basis. Criteria for offering rescue treatment varied; some trials proposed more stringent guidelines for extubation, and duration of follow‐up to endpoints for re‐intubation differed from 48 hours to discharge from the neonatal intensive care unit. Therefore, the term 'need for endotracheal re‐intubation', although available for each of the trials, assumed a clinically different meaning for each.
Excluded studies
We excluded 14 studies (see Characteristics of excluded studies table) for the following reasons.
-
Enrolled non‐intubated or very shortly intubated (< 6 hours) infants with respiratory distress (Bhandari 2007; Bisceglia 2007; Kishore 2009; Kugelman 2007; Meneses 2011; Ramanathan 2012).
-
Enrolled infants with apnoea of prematurity (Lin 1998; Pantalitschka 2009; Ryan 1989).
-
Compared NIPPV versus oxygen via head box after extubation (Kumar 2011).
-
Was not listed on Clinicaltrials.gov (DeSimone 2010).
-
Included term infants and infants with respiratory distress and post extubation (Shi 2010).
-
Reported none of the clinical outcomes listed in the inclusion criteria of this review (Ali 2007; Moretti 1999).
Ongoing studies and studies awaiting clarification include El‐Farash 2013,Estay 2013,Shi 2013,Silveira 2015 and Victor 2011.
Risk of bias in included studies
We assessed methodological quality using the criteria of the Cochrane Neonatal Review Group (Figure 2).

Risk of bias summary: review authors' judgements about each risk of bias item for each included study.
-
Random sequence generation: Eight of the included trials met this criterion. This was unclear in two trials (Gao 2010; Kahramaner 2014).
-
Allocation concealment: This was adequate in eight trials and unclear in two (Gao 2010; Khorana 2008).
-
Blinding of participants and personnel: No study attempted to blind participants and personnel.
-
Blinding of outcome assessments: No study attempted this.
-
Incomplete outcome data: Risk was low in eight trials and unclear in two (Gao 2010; Kahramaner 2014).
-
Selective reporting: Five trials did not have clearly specified outcomes (Barrington 2001; Friedlich 1999; Gao 2010; Kahramaner 2014; Khalaf 2001).
-
Other sources of bias: We found no major sources of other bias in the included trials.
Effects of interventions
See: Summary of findings for the main comparison NIPPV versus NCPAP
Discussion between review authors resulted in no disagreement regarding quality assessment and data extraction from the ten identified trials.
Nasal intermittent positive pressure ventilation versus nasal continuous positive airway pressure to prevent extubation failure
Primary outcome
Respiratory failure post extubation (outcomes 1.1, 1.2 and 1.3)
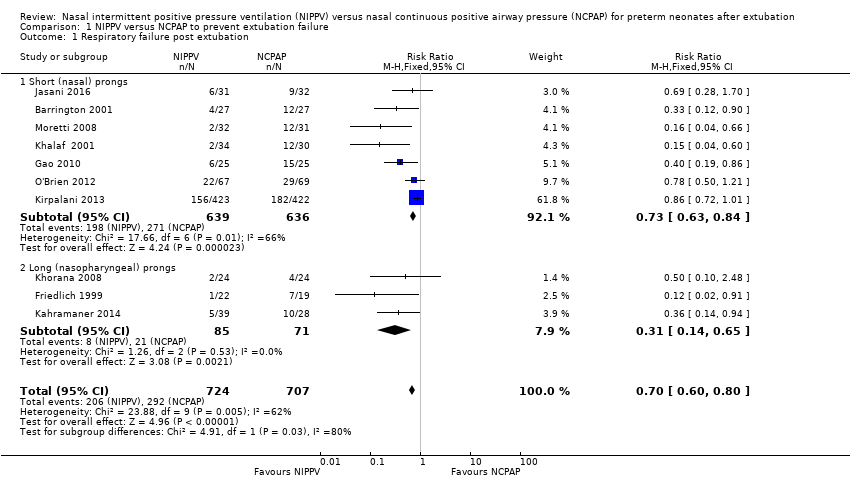
Six of the ten trials showed statistically significant benefit in terms of respiratory failure 48 hours to seven days post extubation for infants extubated to NIPPV: typical risk ratio (RR) 0.70, 95% confidence interval (CI) 0.60 to 0.80; typical risk difference (RD) ‐0.13, 95% CI ‐0.17 to ‐0.08, with eight infants (95% CI 6 to 13) needing to be treated with NIPPV to prevent one extubation failure (Analysis 1.1). Only one study followed the number of re‐intubations to discharge (Kirpalani 2013) and found no differences between groups. We graded the quality of evidence for this outcome as moderate (unblinded intervention).
Seven trials used short binasal prongs (Barrington 2001; Gao 2010; Jasani 2016; Khalaf 2001; Kirpalani 2013; Moretti 2008; O'Brien 2012), two used bi‐nasopharyngeal prongs (Friedlich 1999; Khorana 2008) and one used a shortened endotracheal tube in one nostril (Kahramaner 2014). Both prongs and tube were effective (post hoc analysis).
Owing to methodological limitations (risk of selection bias) in three studies (Gao 2010; Kahramaner 2014; Khorana 2008), we performed a post hoc analysis for the outcome respiratory failure post extubation, including only higher‐quality studies in the analysis (Analysis 1.3). Results were largely unchanged: typical RR 0.73, 95% CI 0.63 to 0.85; typical RD ‐0.11, 95% CI ‐0.16 to ‐0.06.
Secondary outcomes
Endotracheal re‐intubation (outcome 1.2)
Not all NCPAP infants reaching extubation failure criteria were re‐intubated, because a varying proportion of infants in each trial were offered rescue therapy with NIPPV. The pooled estimate of rates of endotracheal re‐intubation favoured NIPPV (typical RR 0.76, 95% CI 0.65 to 0.88; typical RD ‐0.10, 95% CI ‐0.15 to ‐0.05; number needed to treat for an additional beneficial outcome (NNTB) 10, 95% CI 7 to 20; Analysis 1.2). We graded the quality of evidence for this outcome as moderate (unblinded intervention).
Gastrointestinal side effects (outcomes 2.1, 2.2 and 2.3)
Friedlich 1999, Barrington 2001 and Jasani 2016 reported rates of feeding cessation, and Khalaf 2001 provided unpublished data for this outcome. Other studies reported feeding intolerance. Investigators reported no significant differences between groups (typical RR 1.27, 95% CI 0.64 to 2.53; typical RD 0.03, 95% CI ‐0.06 to 0.12; Analysis 2.1). We graded the quality of evidence for this outcome as low (unblinded intervention and imprecision of results).
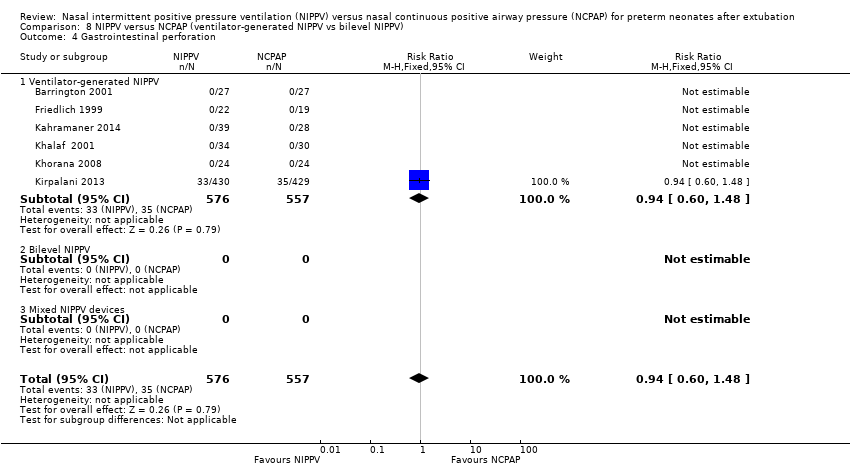
Results showed no significant differences between groups in the incidence of gastrointestinal perforation (typical RR 0.94, 95% CI 0.60 to 1.48; Analysis 2.2). Six trials reported rates of NEC (Friedlich 1999; Kahramaner 2014; Khorana 2008; Kirpalani 2013; Moretti 2008; O'Brien 2012) and revealed no differences between groups (typical RR 0.87, 95% CI 0.64 to 1.19; Analysis 2.3). We graded the quality of evidence for these outcomes as moderate (unblinded intervention).
Pulmonary outcomes (outcomes 3.1, 3.2 and 3.3)
Six trials reported oxygen need at 36 weeks' corrected gestational age (Barrington 2001; Jasani 2016; Khalaf 2001; Kirpalani 2013; Moretti 2008; O'Brien 2012). Infants randomised to NIPPV did not have significantly lower rates of CLD compared with infants randomised to NCPAP (typical RR 0.94, 95% CI 0.80 to 1.10; typical RD ‐0.02, 95% CI ‐0.08 to 0.03; Analysis 3.1). We graded the quality of evidence for this outcome as moderate (unblinded intervention). Heterogeneity between trials was also moderate (I2= 51%).
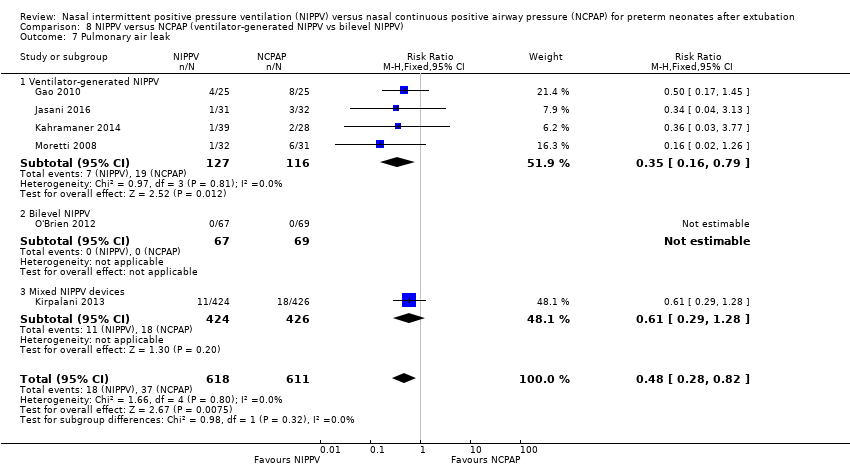
In view of new trials added to the review since its first publication, we added the outcome of air leaks to the review. Six trials reported this outcome (Gao 2010; Jasani 2016; Kahramaner 2014; Kirpalani 2013; Moretti 2008; O'Brien 2012) and described reduced air leaks among infants randomised to NIPPV (typical RR 0.48, 95% CI 0.28 to 0.82; typical RD ‐0.03, 95% CI ‐0.05 to ‐0.01; NNTB 33, 95% CI 20 to 100; Analysis 3.2). We rated the quality of evidence for this outcome as moderate (unblinded intervention).
Mortality (outcome 4.1)
Six trials (1237 infants) reported mortality (Jasani 2016; Kahramaner 2014; Khorana 2008; Kirpalani 2013; Moretti 2008; O'Brien 2012). Khorana 2008 reported no deaths, and meta‐analysis revealed a small difference between treatment groups (typical RR 0.69, 95% CI 0.48 to 0.99; typical RD ‐0.03, 95% CI ‐0.06 to 0.00; Analysis 4.1). We graded evidence for this outcome as moderate (unblinded intervention).
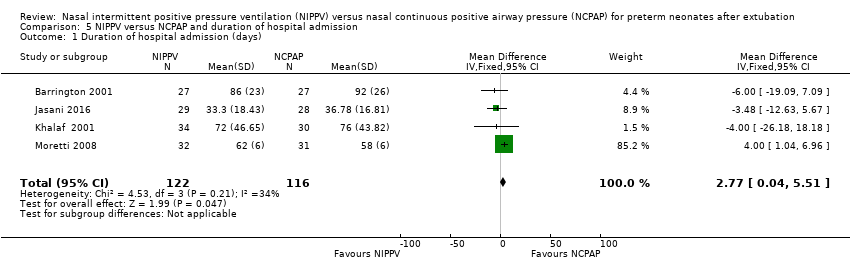
Duration of hospitalisation (outcome 5.1)
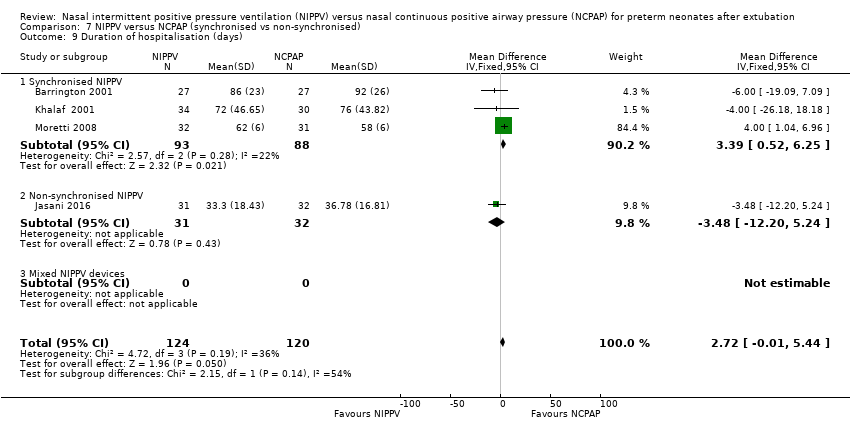
Meta‐analysis of the four studies that reported this outcome showed that duration of hospitalisation was longer in infants who were randomised to NIPPV (Analysis 5.1). However, these results should be viewed with caution because liberal use of rescue NIPPV for infants not responding to NCPAP within the first days of extubation makes a difference, and longer‐term outcomes, should they exist, are more difficult to establish. We graded the quality of evidence for this outcome as low (unblinded intervention and imprecision of results).
Rates of apnoea (outcome 6.1)
Barrington 2001 used continuous multi‐channel recording to detect apnoeic events and noted a trend towards fewer apnoeic episodes per day in the NIPPV group, which did not reach statistical significance (mean difference (MD) ‐3.10, 95% CI ‐7.92 to 1.72; Analysis 6.1).
Subgroup analyses
We planned to perform subgroup analyses to determine whether responses differed according to the modality used to deliver NIPPV (synchronised or not, bilevel devices or NIPPV provided by a ventilator).
Synchronised versus non‐synchronised NIPPV
Five studies used synchronised NIPPV (Barrington 2001; Friedlich 1999; Gao 2010; Khalaf 2001; Moretti 2008), and four did not (Jasani 2016; Kahramaner 2014; Khorana 2008; O'Brien 2012); one study did not prescribe use of either synchronised or non‐synchronised NIPPV (Kirpalani 2013). Both synchronised (typical RR 0.25, 95% CI 0.15 to 0.41) and non‐synchronised studies (typical RR 0.65, 95% CI 0.46 to 0.93) showed overall benefit, and the trial using both methods (typical RR 0.86, 95% CI 0.72 to 1.01) showed no benefit of NIPPV for preventing extubation failure (Analysis 7.1). Heterogeneity was high in this subgroup analysis.
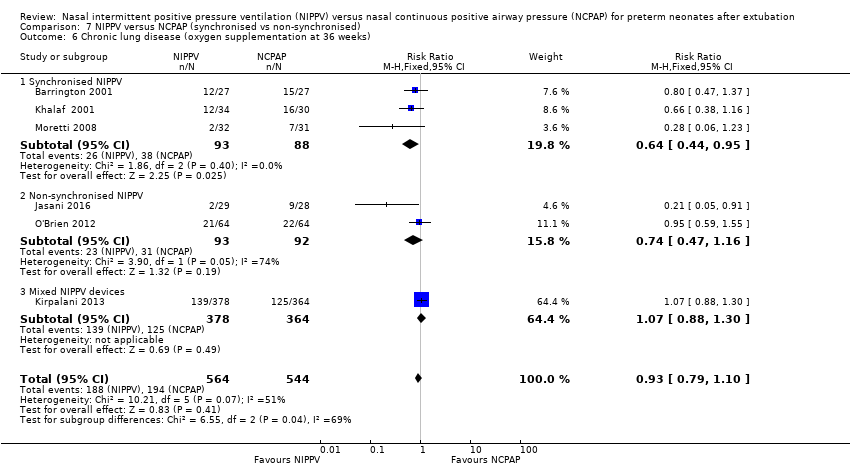
When CLD was examined by method of delivery of NIPPV, synchronised NIPPV was associated with a reduction in CLD in three trials (181 infants) that could be pooled for this analysis (typical RR 0.64, 95% CI 0.44 to 0.95; typical RD ‐0.15, 95% CI ‐0.28 to 0.02; Analysis 7.6). Air leaks were also reduced in the two trials that used synchronised NIPPV and reported this outcome (typical RR 0.35, 95% CI 0.14 to 0.90; Analysis 7.7).
NIPPV provided by a ventilator versus bilevel devices
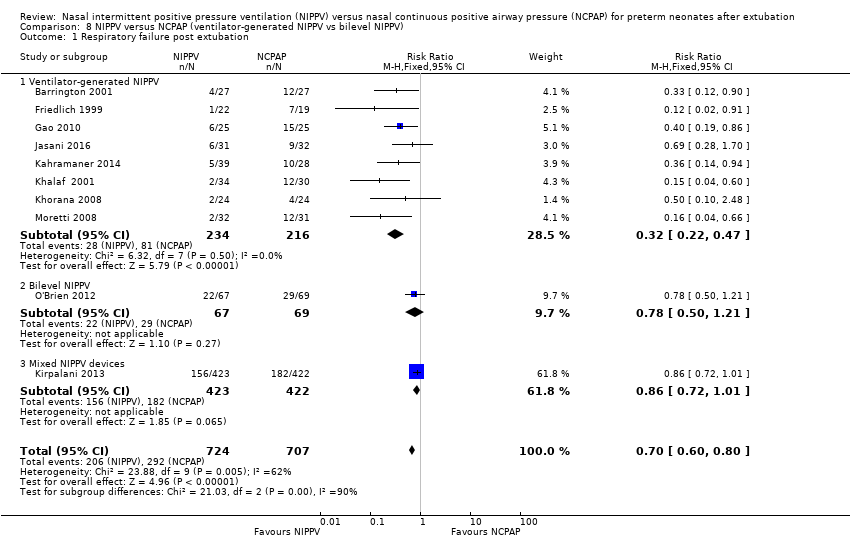
Eight trials used NIPPV delivered via a ventilator, one used bilevel devices (O'Brien 2012) and another used both a ventilator and bilevel devices (Kirpalani 2013). Six of the eight trials using a ventilator to generate NIPPV showed benefit of NIPPV in preventing respiratory failure post extubation (typical RR 0.32, 95% CI 0.22 to 0.47); the two trials that used bilevel (typical RR 0.78, 95% CI 0.50 to 1.21) or both ventilator and bilevel (typical RR 0.86, 95% CI 0.72 to 1.01) showed no benefit (Analysis 8.1). Heterogeneity was high in this subgroup analysis.
When CLD was examined by device delivering NIPPV, NIPPV delivered by a ventilator was associated with a reduction in CLD in the five trials (298 infants) that could be pooled for this analysis (typical RR 0.69, 95% CI 0.50 to 0.95; typical RD ‐0.12, 95% CI ‐0.22 to ‐0.02; Analysis 8.6). Air leaks were also reduced in the four trials that reported this outcome (typical RR 0.35, 95% CI 0.16 to 0.79; Analysis 8.7).
We had planned to perform subgroup analysis to determine whether use of methylxanthines alters response. Almost all infants received methylxanthines before extubation, so we did not perform the planned subgroup analysis. We could not perform planned subgroup analyses based on birth weight and age at randomisation, as trial authors did not present data in ways that would allow us to ascertain this information.
Discussion
Meta‐analysis performed for this updated review showed a strong effect of non‐invasive positive pressure ventilation (NIPPV) on extubation failure but no overall effect on chronic lung disease (CLD). Asymmetrical funnel plots for the primary outcome suggest possible small study bias. When outcomes were examined by subgroups, synchronised NIPPV and NIPPV delivered by a ventilator demonstrated short‐term benefit for extubation failure and long‐term pulmonary effects for CLD and pulmonary air leaks. These subgroup analyses included a smaller number of infants and high heterogeneity; thus results should be interpreted with caution. Individual neonatal intensive care units may interpret these results differently.
Most trials included in this review were small, single‐centre studies, and some used devices no longer available on the market. Additional data from one large pragmatic study increased heterogeneity in the meta‐analysis, likely as the result of broader inclusion criteria, multi‐centre status and examination of many devices providing NIPPV. Generalisation of these results to many currently available devices may not be appropriate.
Six of the ten trials identified in this review had no major methodological limitations. Three trials had potential selection bias (Gao 2010; Kahramaner 2014; Khorana 2008), and one was terminated early owing to enrolment difficulties (O'Brien 2012). Because of the nature of the interventions, it has been impossible to blind carers, and bias may have arisen through uneven use of co‐interventions. Investigators dealt with potential confounders, such as methylxanthine usage and weaning strategies, by having management protocols in place; use of objective failure criteria in these extubation trials enhances our confidence in their findings.
Provision of synchronised NIPPV requires a ventilator capable of delivering this mode of support. Few such ventilators are available on the market. Further research should define whether this modality is definitely superior to non‐synchronised NIPPV, and which type of synchronisation is optimal. Similarly, the effect of bilevel or bilevel positive airway pressure devices deserves more study. In preparing this review, we could not determine benefits for a subgroup of infants (smaller and more immature). A newly available method (neurally adjusted ventilatory assist, or NAVA) has shown promise in small case series (Lee 2015; Stein 2012), but further assessment is needed.
Study flow diagram: review update.
Risk of bias summary: review authors' judgements about each risk of bias item for each included study.
Comparison 1 NIPPV versus NCPAP to prevent extubation failure, Outcome 1 Respiratory failure post extubation.

Comparison 1 NIPPV versus NCPAP to prevent extubation failure, Outcome 2 Endotracheal re‐intubation.

Comparison 1 NIPPV versus NCPAP to prevent extubation failure, Outcome 3 Post hoc analysis (high‐quality studies): respiratory failure post extubation.

Comparison 2 NIPPV versus NCPAP and gastrointestinal complications, Outcome 1 Abdominal distension leading to cessation of feeds.

Comparison 2 NIPPV versus NCPAP and gastrointestinal complications, Outcome 2 Gastrointestinal perforation.

Comparison 2 NIPPV versus NCPAP and gastrointestinal complications, Outcome 3 Necrotising enterocolitis.

Comparison 3 NIPPV versus NCPAP to improve pulmonary outcomes, Outcome 1 Chronic lung disease (oxygen supplementation at 36 weeks).

Comparison 3 NIPPV versus NCPAP to improve pulmonary outcomes, Outcome 2 Air leaks.

Comparison 4 NIPPV versus NCPAP and mortality, Outcome 1 Death before discharge.
Comparison 5 NIPPV versus NCPAP and duration of hospital admission, Outcome 1 Duration of hospital admission (days).

Comparison 6 NIPPV versus NCPAP and apnoea, Outcome 1 Rates of apnoea (episodes/24 h).

Comparison 7 NIPPV versus NCPAP (synchronised vs non‐synchronised), Outcome 1 Respiratory failure post extubation.

Comparison 7 NIPPV versus NCPAP (synchronised vs non‐synchronised), Outcome 2 Endotracheal re‐intubation during the week post extubation.
Comparison 7 NIPPV versus NCPAP (synchronised vs non‐synchronised), Outcome 3 Abdominal distension requiring cessation of feeds.

Comparison 7 NIPPV versus NCPAP (synchronised vs non‐synchronised), Outcome 4 Gastrointestinal perforation.

Comparison 7 NIPPV versus NCPAP (synchronised vs non‐synchronised), Outcome 5 Necrotising enterocolitis.
Comparison 7 NIPPV versus NCPAP (synchronised vs non‐synchronised), Outcome 6 Chronic lung disease (oxygen supplementation at 36 weeks).

Comparison 7 NIPPV versus NCPAP (synchronised vs non‐synchronised), Outcome 7 Pulmonary air leak.

Comparison 7 NIPPV versus NCPAP (synchronised vs non‐synchronised), Outcome 8 Rates of apnoea (episodes/24 h).
Comparison 7 NIPPV versus NCPAP (synchronised vs non‐synchronised), Outcome 9 Duration of hospitalisation (days).

Comparison 7 NIPPV versus NCPAP (synchronised vs non‐synchronised), Outcome 10 Death before discharge.
Comparison 8 NIPPV versus NCPAP (ventilator‐generated NIPPV vs bilevel NIPPV), Outcome 1 Respiratory failure post extubation.

Comparison 8 NIPPV versus NCPAP (ventilator‐generated NIPPV vs bilevel NIPPV), Outcome 2 Endotracheal re‐intubation during the week post extubation.

Comparison 8 NIPPV versus NCPAP (ventilator‐generated NIPPV vs bilevel NIPPV), Outcome 3 Abdominal distension requiring cessation of feeds.
Comparison 8 NIPPV versus NCPAP (ventilator‐generated NIPPV vs bilevel NIPPV), Outcome 4 Gastrointestinal perforation.

Comparison 8 NIPPV versus NCPAP (ventilator‐generated NIPPV vs bilevel NIPPV), Outcome 5 Necrotising enterocolitis.

Comparison 8 NIPPV versus NCPAP (ventilator‐generated NIPPV vs bilevel NIPPV), Outcome 6 Chronic lung disease (oxygen supplementation at 36 weeks).
Comparison 8 NIPPV versus NCPAP (ventilator‐generated NIPPV vs bilevel NIPPV), Outcome 7 Pulmonary air leak.
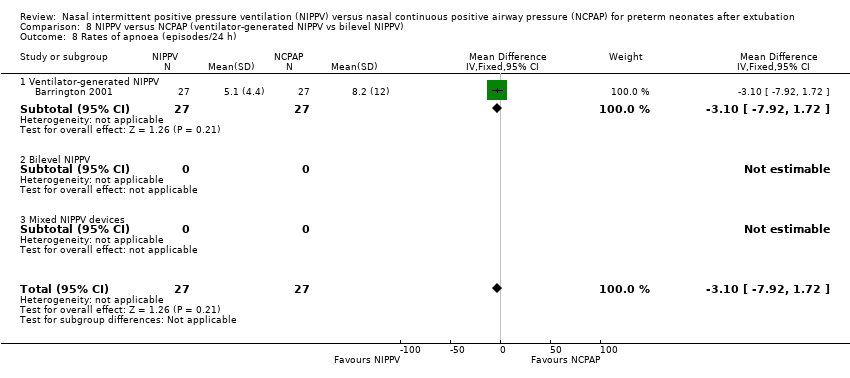
Comparison 8 NIPPV versus NCPAP (ventilator‐generated NIPPV vs bilevel NIPPV), Outcome 8 Rates of apnoea (episodes/24 h).

Comparison 8 NIPPV versus NCPAP (ventilator‐generated NIPPV vs bilevel NIPPV), Outcome 9 Duration of hospitalisation (days).
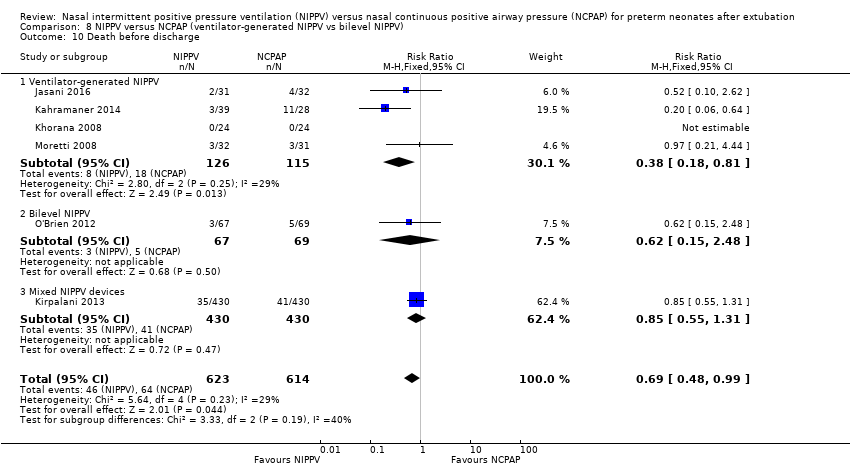
Comparison 8 NIPPV versus NCPAP (ventilator‐generated NIPPV vs bilevel NIPPV), Outcome 10 Death before discharge.
| NIPPV versus NCPAP | ||||||
| Patient or population: preterm neonates after extubation | ||||||
| Outcomes | Anticipated absolute effects* (95% CI) | Relative effect | Number of participants | Quality of the evidence | Comments | |
| Risk with NCPAP | Risk with NIPPV | |||||
| Respiratory failure post extubation | Study population | RR 0.70 | 1431 | Moderatea | Risk of bias: intervention unblinded OIS 554 | |
| 413 per 1000 | 289 per 1000 | |||||
| Endotracheal re‐intubation during the week post extubation | Study population | RR 0.76 | 1301 (8 studies) | Moderatea | Risk of bias: intervention unblinded OIS 724 | |
| 396 per 1000 | 301 per 1000 | |||||
| Abdominal distension requiring cessation of feeds | Study population | RR 1.27 | 199 (4 studies) | Lowa,b | Risk of bias: intervention unblinded Imprecision: wide confidence intervals | |
| 112 per 1000 | 143 per 1000 | |||||
| Gastrointestinal perforation | Study population | RR 0.94 | 1066 (5 studies) | Moderatea | Risk of bias: intervention unblinded | |
| 66 per 1000 | 62 per 1000 | |||||
| Necrotising enterocolitis | Study population | RR 0.87 | 1214 | Moderatea | Risk of bias: intervention unblinded | |
| 127 per 1000 | 110 per 1000 | |||||
| Chronic lung disease (oxygen supplementation at 36 weeks) | Study population | RR 0.94 | 1140 (6 studies) | Moderatea | Risk of bias: intervention unblinded | |
| 355 per 1000 | 334 per 1000 | |||||
| Pulmonary air leak | Study population | RR 0.48 | 1229 | Moderatea | Risk of bias: intervention unblinded OIS 749 | |
| 61 per 1000 | 29 per 1000 | |||||
| Duration of hospitalisation (days) | Mean duration of hospitalisation (days) was 0 | Mean duration of hospitalisation (days) in the intervention group was 2.77 higher (0.04 to 5.51 higher) | 238 | Lowa,b | Risk of bias: intervention unblinded Imprecision: wide confidence intervals | |
| Death before discharge | Study population | RR 0.69 | 1237 | Moderatea | Risk of bias: intervention unblinded Imprecision OIS 1844 | |
| 104 per 1000 | 72 per 1000 | |||||
| *The risk in the intervention group (and its 95% confidence interval) is based on assumed risk in the comparison group and the relative effect of the intervention (and its 95% CI). | ||||||
| GRADE Working Group grades of evidence. | ||||||
| aIntervention unblinded. bImprecise estimate (wide confidence intervals). | ||||||
| Outcome or subgroup title | No. of studies | No. of participants | Statistical method | Effect size |
| 1 Respiratory failure post extubation Show forest plot | 10 | 1431 | Risk Ratio (M‐H, Fixed, 95% CI) | 0.70 [0.60, 0.80] |
| 1.1 Short (nasal) prongs | 7 | 1275 | Risk Ratio (M‐H, Fixed, 95% CI) | 0.73 [0.63, 0.84] |
| 1.2 Long (nasopharyngeal) prongs | 3 | 156 | Risk Ratio (M‐H, Fixed, 95% CI) | 0.31 [0.14, 0.65] |
| 2 Endotracheal re‐intubation Show forest plot | 8 | 1301 | Risk Ratio (M‐H, Fixed, 95% CI) | 0.76 [0.65, 0.88] |
| 3 Post hoc analysis (high‐quality studies): respiratory failure post extubation Show forest plot | 7 | 1266 | Risk Ratio (M‐H, Fixed, 95% CI) | 0.73 [0.63, 0.85] |
| Outcome or subgroup title | No. of studies | No. of participants | Statistical method | Effect size |
| 1 Abdominal distension leading to cessation of feeds Show forest plot | 4 | 199 | Risk Ratio (M‐H, Fixed, 95% CI) | 1.27 [0.64, 2.53] |
| 2 Gastrointestinal perforation Show forest plot | 5 | 1066 | Risk Ratio (M‐H, Fixed, 95% CI) | 0.94 [0.60, 1.48] |
| 3 Necrotising enterocolitis Show forest plot | 6 | 1214 | Risk Ratio (M‐H, Fixed, 95% CI) | 0.87 [0.64, 1.19] |
| Outcome or subgroup title | No. of studies | No. of participants | Statistical method | Effect size |
| 1 Chronic lung disease (oxygen supplementation at 36 weeks) Show forest plot | 6 | 1140 | Risk Ratio (M‐H, Fixed, 95% CI) | 0.94 [0.80, 1.10] |
| 2 Air leaks Show forest plot | 6 | 1229 | Risk Ratio (M‐H, Fixed, 95% CI) | 0.48 [0.28, 0.82] |
| Outcome or subgroup title | No. of studies | No. of participants | Statistical method | Effect size |
| 1 Death before discharge Show forest plot | 6 | 1237 | Risk Ratio (M‐H, Fixed, 95% CI) | 0.69 [0.48, 0.99] |
| Outcome or subgroup title | No. of studies | No. of participants | Statistical method | Effect size |
| 1 Duration of hospital admission (days) Show forest plot | 4 | 238 | Mean Difference (IV, Fixed, 95% CI) | 2.77 [0.04, 5.51] |
| Outcome or subgroup title | No. of studies | No. of participants | Statistical method | Effect size |
| 1 Rates of apnoea (episodes/24 h) Show forest plot | 1 | 54 | Mean Difference (IV, Fixed, 95% CI) | ‐3.10 [‐7.92, 1.72] |
| Outcome or subgroup title | No. of studies | No. of participants | Statistical method | Effect size |
| 1 Respiratory failure post extubation Show forest plot | 10 | 1431 | Risk Ratio (M‐H, Fixed, 95% CI) | 0.70 [0.60, 0.80] |
| 1.1 Synchronised NIPPV | 5 | 272 | Risk Ratio (M‐H, Fixed, 95% CI) | 0.25 [0.15, 0.41] |
| 1.2 Non‐synchronised NIPPV | 4 | 314 | Risk Ratio (M‐H, Fixed, 95% CI) | 0.65 [0.46, 0.93] |
| 1.3 Mixed NIPPV devices | 1 | 845 | Risk Ratio (M‐H, Fixed, 95% CI) | 0.86 [0.72, 1.01] |
| 2 Endotracheal re‐intubation during the week post extubation Show forest plot | 10 | 1431 | Risk Ratio (M‐H, Fixed, 95% CI) | 0.74 [0.64, 0.85] |
| 2.1 Synchronised NIPPV | 5 | 272 | Risk Ratio (M‐H, Fixed, 95% CI) | 0.33 [0.19, 0.57] |
| 2.2 Non‐synchronised NIPPV | 4 | 314 | Risk Ratio (M‐H, Fixed, 95% CI) | 0.65 [0.46, 0.93] |
| 2.3 Mixed NIPPV devices | 1 | 845 | Risk Ratio (M‐H, Fixed, 95% CI) | 0.86 [0.72, 1.01] |
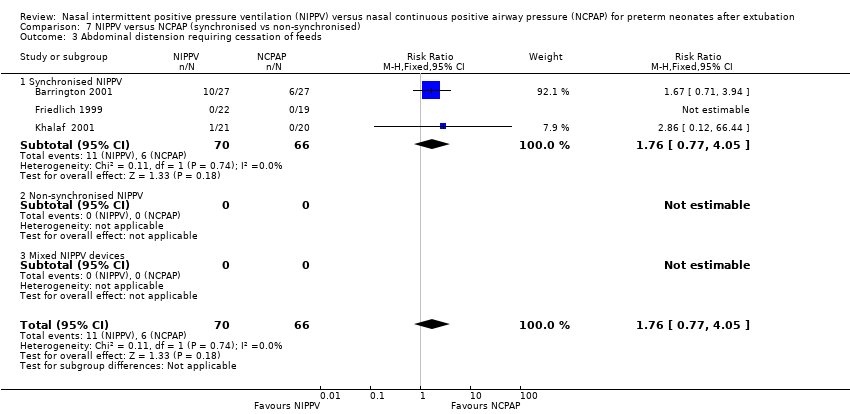
| 3 Abdominal distension requiring cessation of feeds Show forest plot | 3 | 136 | Risk Ratio (M‐H, Fixed, 95% CI) | 1.76 [0.77, 4.05] |
| 3.1 Synchronised NIPPV | 3 | 136 | Risk Ratio (M‐H, Fixed, 95% CI) | 1.76 [0.77, 4.05] |
| 3.2 Non‐synchronised NIPPV | 0 | 0 | Risk Ratio (M‐H, Fixed, 95% CI) | 0.0 [0.0, 0.0] |
| 3.3 Mixed NIPPV devices | 0 | 0 | Risk Ratio (M‐H, Fixed, 95% CI) | 0.0 [0.0, 0.0] |
| 4 Gastrointestinal perforation Show forest plot | 5 | 1052 | Risk Ratio (M‐H, Fixed, 95% CI) | 0.86 [0.72, 1.01] |
| 4.1 Synchronised NIPPV | 3 | 159 | Risk Ratio (M‐H, Fixed, 95% CI) | 0.0 [0.0, 0.0] |
| 4.2 Non‐synchronised NIPPV | 1 | 48 | Risk Ratio (M‐H, Fixed, 95% CI) | 0.0 [0.0, 0.0] |
| 4.3 Mixed NIPPV devices | 1 | 845 | Risk Ratio (M‐H, Fixed, 95% CI) | 0.86 [0.72, 1.01] |
| 5 Necrotising enterocolitis Show forest plot | 6 | 1214 | Risk Ratio (M‐H, Fixed, 95% CI) | 0.87 [0.64, 1.19] |
| 5.1 Synchronised NIPPV | 5 | 1147 | Risk Ratio (M‐H, Fixed, 95% CI) | 0.88 [0.64, 1.20] |
| 5.2 Non‐synchronised NIPPV | 1 | 67 | Risk Ratio (M‐H, Fixed, 95% CI) | 0.72 [0.11, 4.79] |
| 5.3 Mixed NIPPV devices | 0 | 0 | Risk Ratio (M‐H, Fixed, 95% CI) | 0.0 [0.0, 0.0] |
| 6 Chronic lung disease (oxygen supplementation at 36 weeks) Show forest plot | 6 | 1108 | Risk Ratio (M‐H, Fixed, 95% CI) | 0.93 [0.79, 1.10] |
| 6.1 Synchronised NIPPV | 3 | 181 | Risk Ratio (M‐H, Fixed, 95% CI) | 0.64 [0.44, 0.95] |
| 6.2 Non‐synchronised NIPPV | 2 | 185 | Risk Ratio (M‐H, Fixed, 95% CI) | 0.74 [0.47, 1.16] |
| 6.3 Mixed NIPPV devices | 1 | 742 | Risk Ratio (M‐H, Fixed, 95% CI) | 1.07 [0.88, 1.30] |
| 7 Pulmonary air leak Show forest plot | 6 | 1222 | Risk Ratio (M‐H, Fixed, 95% CI) | 0.67 [0.44, 1.02] |
| 7.1 Synchronised NIPPV | 2 | 113 | Risk Ratio (M‐H, Fixed, 95% CI) | 0.35 [0.14, 0.90] |
| 7.2 Non‐synchronised NIPPV | 3 | 259 | Risk Ratio (M‐H, Fixed, 95% CI) | 1.10 [0.58, 2.08] |
| 7.3 Mixed NIPPV devices | 1 | 850 | Risk Ratio (M‐H, Fixed, 95% CI) | 0.61 [0.29, 1.28] |
| 8 Rates of apnoea (episodes/24 h) Show forest plot | 1 | 54 | Mean Difference (IV, Fixed, 95% CI) | ‐3.10 [‐7.92, 1.72] |
| 8.1 Synchronised NIPPV | 1 | 54 | Mean Difference (IV, Fixed, 95% CI) | ‐3.10 [‐7.92, 1.72] |
| 8.2 Non‐synchronised NIPPV | 0 | 0 | Mean Difference (IV, Fixed, 95% CI) | 0.0 [0.0, 0.0] |
| 8.3 Mixed NIPPV devices | 0 | 0 | Mean Difference (IV, Fixed, 95% CI) | 0.0 [0.0, 0.0] |
| 9 Duration of hospitalisation (days) Show forest plot | 4 | 244 | Mean Difference (IV, Fixed, 95% CI) | 2.72 [‐0.01, 5.44] |
| 9.1 Synchronised NIPPV | 3 | 181 | Mean Difference (IV, Fixed, 95% CI) | 3.39 [0.52, 6.25] |
| 9.2 Non‐synchronised NIPPV | 1 | 63 | Mean Difference (IV, Fixed, 95% CI) | ‐3.48 [‐12.20, 5.24] |
| 9.3 Mixed NIPPV devices | 0 | 0 | Mean Difference (IV, Fixed, 95% CI) | 0.0 [0.0, 0.0] |
| 10 Death before discharge Show forest plot | 6 | 1237 | Risk Ratio (M‐H, Fixed, 95% CI) | 0.69 [0.48, 0.99] |
| 10.1 Synchronised NIPPV | 2 | 111 | Risk Ratio (M‐H, Fixed, 95% CI) | 0.97 [0.21, 4.44] |
| 10.2 Non‐synchronised NIPPV | 3 | 266 | Risk Ratio (M‐H, Fixed, 95% CI) | 0.35 [0.16, 0.75] |
| 10.3 Mixed NIPPV devices | 1 | 860 | Risk Ratio (M‐H, Fixed, 95% CI) | 0.85 [0.55, 1.31] |
| Outcome or subgroup title | No. of studies | No. of participants | Statistical method | Effect size |
| 1 Respiratory failure post extubation Show forest plot | 10 | 1431 | Risk Ratio (M‐H, Fixed, 95% CI) | 0.70 [0.60, 0.80] |
| 1.1 Ventilator‐generated NIPPV | 8 | 450 | Risk Ratio (M‐H, Fixed, 95% CI) | 0.32 [0.22, 0.47] |
| 1.2 Bilevel NIPPV | 1 | 136 | Risk Ratio (M‐H, Fixed, 95% CI) | 0.78 [0.50, 1.21] |
| 1.3 Mixed NIPPV devices | 1 | 845 | Risk Ratio (M‐H, Fixed, 95% CI) | 0.86 [0.72, 1.01] |
| 2 Endotracheal re‐intubation during the week post extubation Show forest plot | 10 | 1431 | Risk Ratio (M‐H, Fixed, 95% CI) | 0.74 [0.64, 0.85] |
| 2.1 Ventilator‐generated NIPPV | 8 | 450 | Risk Ratio (M‐H, Fixed, 95% CI) | 0.39 [0.26, 0.59] |
| 2.2 Bilevel NIPPV | 1 | 136 | Risk Ratio (M‐H, Fixed, 95% CI) | 0.78 [0.50, 1.21] |
| 2.3 Mixed NIPPV devices | 1 | 845 | Risk Ratio (M‐H, Fixed, 95% CI) | 0.86 [0.72, 1.01] |
| 3 Abdominal distension requiring cessation of feeds Show forest plot | 3 | 136 | Risk Ratio (M‐H, Fixed, 95% CI) | 1.76 [0.77, 4.05] |
| 3.1 Ventilator‐generated NIPPV | 3 | 136 | Risk Ratio (M‐H, Fixed, 95% CI) | 1.76 [0.77, 4.05] |
| 3.2 Bilevel NIPPV | 0 | 0 | Risk Ratio (M‐H, Fixed, 95% CI) | 0.0 [0.0, 0.0] |
| 3.3 Mixed NIPPV devices | 0 | 0 | Risk Ratio (M‐H, Fixed, 95% CI) | 0.0 [0.0, 0.0] |
| 4 Gastrointestinal perforation Show forest plot | 6 | 1133 | Risk Ratio (M‐H, Fixed, 95% CI) | 0.94 [0.60, 1.48] |
| 4.1 Ventilator‐generated NIPPV | 6 | 1133 | Risk Ratio (M‐H, Fixed, 95% CI) | 0.94 [0.60, 1.48] |
| 4.2 Bilevel NIPPV | 0 | 0 | Risk Ratio (M‐H, Fixed, 95% CI) | 0.0 [0.0, 0.0] |
| 4.3 Mixed NIPPV devices | 0 | 0 | Risk Ratio (M‐H, Fixed, 95% CI) | 0.0 [0.0, 0.0] |
| 5 Necrotising enterocolitis Show forest plot | 6 | 1214 | Risk Ratio (M‐H, Fixed, 95% CI) | 0.87 [0.64, 1.19] |
| 5.1 Ventilator‐generated NIPPV | 4 | 219 | Risk Ratio (M‐H, Fixed, 95% CI) | 0.63 [0.21, 1.93] |
| 5.2 Bilevel NIPPV | 1 | 136 | Risk Ratio (M‐H, Fixed, 95% CI) | 1.03 [0.38, 2.78] |
| 5.3 Mixed NIPPV devices | 1 | 859 | Risk Ratio (M‐H, Fixed, 95% CI) | 0.89 [0.63, 1.24] |
| 6 Chronic lung disease (oxygen supplementation at 36 weeks) Show forest plot | 7 | 1168 | Risk Ratio (M‐H, Fixed, 95% CI) | 0.95 [0.81, 1.11] |
| 6.1 Ventilator‐generated NIPPV | 5 | 298 | Risk Ratio (M‐H, Fixed, 95% CI) | 0.69 [0.50, 0.95] |
| 6.2 Bilevel NIPPV | 1 | 128 | Risk Ratio (M‐H, Fixed, 95% CI) | 0.95 [0.59, 1.55] |
| 6.3 Mixed NIPPV devices | 1 | 742 | Risk Ratio (M‐H, Fixed, 95% CI) | 1.07 [0.88, 1.30] |
| 7 Pulmonary air leak Show forest plot | 6 | 1229 | Risk Ratio (M‐H, Fixed, 95% CI) | 0.48 [0.28, 0.82] |
| 7.1 Ventilator‐generated NIPPV | 4 | 243 | Risk Ratio (M‐H, Fixed, 95% CI) | 0.35 [0.16, 0.79] |
| 7.2 Bilevel NIPPV | 1 | 136 | Risk Ratio (M‐H, Fixed, 95% CI) | 0.0 [0.0, 0.0] |
| 7.3 Mixed NIPPV devices | 1 | 850 | Risk Ratio (M‐H, Fixed, 95% CI) | 0.61 [0.29, 1.28] |
| 8 Rates of apnoea (episodes/24 h) Show forest plot | 1 | 54 | Mean Difference (IV, Fixed, 95% CI) | ‐3.10 [‐7.92, 1.72] |
| 8.1 Ventilator‐generated NIPPV | 1 | 54 | Mean Difference (IV, Fixed, 95% CI) | ‐3.10 [‐7.92, 1.72] |
| 8.2 Bilevel NIPPV | 0 | 0 | Mean Difference (IV, Fixed, 95% CI) | 0.0 [0.0, 0.0] |
| 8.3 Mixed NIPPV devices | 0 | 0 | Mean Difference (IV, Fixed, 95% CI) | 0.0 [0.0, 0.0] |
| 9 Duration of hospitalisation (days) Show forest plot | 4 | 244 | Mean Difference (IV, Fixed, 95% CI) | 2.72 [‐0.01, 5.44] |
| 9.1 Ventilator‐generated NIPPV | 4 | 244 | Mean Difference (IV, Fixed, 95% CI) | 2.72 [‐0.01, 5.44] |
| 9.2 Bilevel NIPPV | 0 | 0 | Mean Difference (IV, Fixed, 95% CI) | 0.0 [0.0, 0.0] |
| 9.3 Mixed NIPPV devices | 0 | 0 | Mean Difference (IV, Fixed, 95% CI) | 0.0 [0.0, 0.0] |
| 10 Death before discharge Show forest plot | 6 | 1237 | Risk Ratio (M‐H, Fixed, 95% CI) | 0.69 [0.48, 0.99] |
| 10.1 Ventilator‐generated NIPPV | 4 | 241 | Risk Ratio (M‐H, Fixed, 95% CI) | 0.38 [0.18, 0.81] |
| 10.2 Bilevel NIPPV | 1 | 136 | Risk Ratio (M‐H, Fixed, 95% CI) | 0.62 [0.15, 2.48] |
| 10.3 Mixed NIPPV devices | 1 | 860 | Risk Ratio (M‐H, Fixed, 95% CI) | 0.85 [0.55, 1.31] |