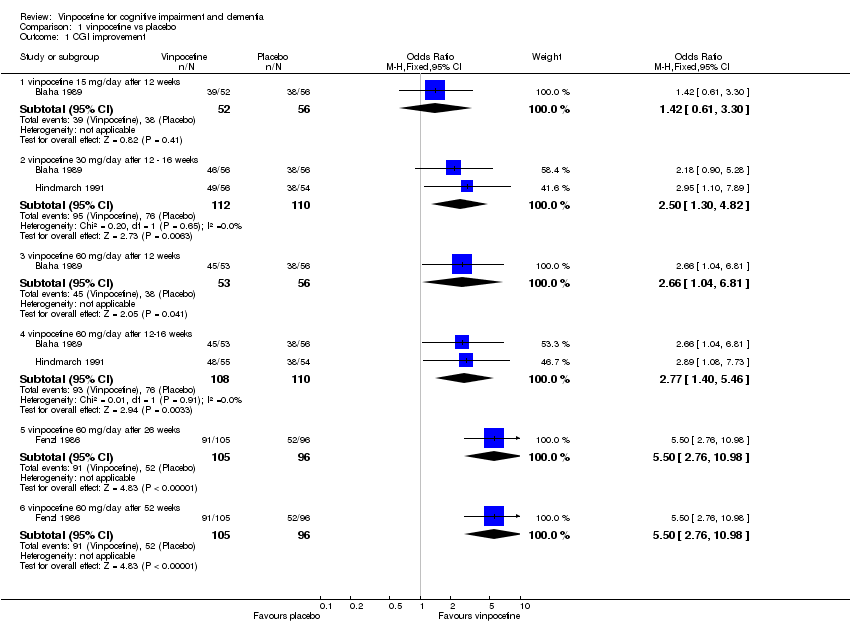
| 1 CGI improvement Show forest plot | 3 | | Odds Ratio (M‐H, Fixed, 95% CI) | Subtotals only |
|
| 1.1 vinpocetine 15 mg/day after 12 weeks | 1 | 108 | Odds Ratio (M‐H, Fixed, 95% CI) | 1.42 [0.61, 3.30] |
| 1.2 vinpocetine 30 mg/day after 12 ‐ 16 weeks | 2 | 222 | Odds Ratio (M‐H, Fixed, 95% CI) | 2.50 [1.30, 4.82] |
| 1.3 vinpocetine 60 mg/day after 12 weeks | 1 | 109 | Odds Ratio (M‐H, Fixed, 95% CI) | 2.66 [1.04, 6.81] |
| 1.4 vinpocetine 60 mg/day after 12‐16 weeks | 2 | 218 | Odds Ratio (M‐H, Fixed, 95% CI) | 2.77 [1.40, 5.46] |
| 1.5 vinpocetine 60 mg/day after 26 weeks | 1 | 201 | Odds Ratio (M‐H, Fixed, 95% CI) | 5.5 [2.76, 10.98] |
| 1.6 vinpocetine 60 mg/day after 52 weeks | 1 | 201 | Odds Ratio (M‐H, Fixed, 95% CI) | 5.5 [2.76, 10.98] |
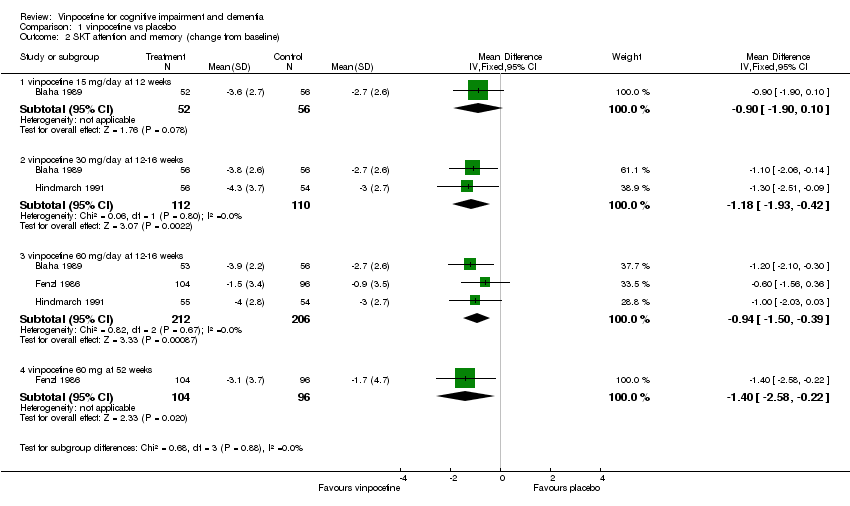
| 2 SKT attention and memory (change from baseline) Show forest plot | 3 | | Mean Difference (IV, Fixed, 95% CI) | Subtotals only |
|
| 2.1 vinpocetine 15 mg/day at 12 weeks | 1 | 108 | Mean Difference (IV, Fixed, 95% CI) | ‐0.90 [‐1.90, 0.10] |
| 2.2 vinpocetine 30 mg/day at 12‐16 weeks | 2 | 222 | Mean Difference (IV, Fixed, 95% CI) | ‐1.18 [‐1.93, ‐0.42] |
| 2.3 vinpocetine 60 mg/day at 12‐16 weeks | 3 | 418 | Mean Difference (IV, Fixed, 95% CI) | ‐0.94 [‐1.50, ‐0.39] |
| 2.4 vinpocetine 60 mg at 52 weeks | 1 | 200 | Mean Difference (IV, Fixed, 95% CI) | ‐1.40 [‐2.58, ‐0.22] |
| 3 side effects Show forest plot | 3 | | Odds Ratio (M‐H, Fixed, 95% CI) | Subtotals only |
|
| 3.1 vinpocetine 15 mg/day (12 weeks of treatment) | 1 | 108 | Odds Ratio (M‐H, Fixed, 95% CI) | 1.88 [0.43, 8.29] |
| 3.2 vinpocetine 30 mg/day (12‐16 weeks of treatment) | 3 | 224 | Odds Ratio (M‐H, Fixed, 95% CI) | 2.63 [1.04, 6.64] |
| 3.3 vinpocetine 60 mg/day (12‐16 weeks of treatment) | 2 | 218 | Odds Ratio (M‐H, Fixed, 95% CI) | 2.18 [0.84, 5.64] |
| 3.4 vinpocetine 60 mg/day (12 ‐ 52 weeks of treatment) | 3 | 419 | Odds Ratio (M‐H, Fixed, 95% CI) | 1.26 [0.71, 2.21] |
| 4 CGI Numbers who show improvement by endpoint Show forest plot | 3 | 583 | Odds Ratio (M‐H, Fixed, 95% CI) | 3.27 [2.18, 4.91] |
|
| 4.1 mean dose 30mg/day, endpoint 12 weeks | 1 | 217 | Odds Ratio (M‐H, Fixed, 95% CI) | 1.99 [1.00, 3.94] |
| 4.2 mean dose 45mg/day, endpoint 16 weeks | 1 | 165 | Odds Ratio (M‐H, Fixed, 95% CI) | 2.92 [1.30, 6.55] |
| 4.3 dose 60mg/day, endpoint 26 weeks | 1 | 201 | Odds Ratio (M‐H, Fixed, 95% CI) | 5.5 [2.76, 10.98] |
| 5 SKT attention and memory (change from baseline) at endpoint Show forest plot | 3 | 582 | Mean Difference (IV, Fixed, 95% CI) | ‐1.19 [‐1.73, ‐0.66] |
|
| 5.1 mean dose 35 mg/day | 1 | 217 | Mean Difference (IV, Fixed, 95% CI) | ‐1.10 [‐1.88, ‐0.32] |
| 5.2 mean dose 45 mg/day | 1 | 165 | Mean Difference (IV, Fixed, 95% CI) | ‐1.20 [‐2.15, ‐0.25] |
| 5.3 mean dose 60 mg/day | 1 | 200 | Mean Difference (IV, Fixed, 95% CI) | ‐1.40 [‐2.58, ‐0.22] |