Scolaris Content Display Scolaris Content Display

Comparison 1 Poor outcome, Outcome 1 death or dependency at 2 to 3 months.
Figuras y tablas -
Analysis 1.1

Comparison 1 Poor outcome, Outcome 1 death or dependency at 2 to 3 months.

Comparison 1 Poor outcome, Outcome 2 death or dependency at 12 months after SAH.
Figuras y tablas -
Analysis 1.2

Comparison 1 Poor outcome, Outcome 2 death or dependency at 12 months after SAH.

Comparison 1 Poor outcome, Outcome 3 worst‐case scenario at 12 months.
Figuras y tablas -
Analysis 1.3

Comparison 1 Poor outcome, Outcome 3 worst‐case scenario at 12 months.

Comparison 2 Secondary cerebral ischaemia, Outcome 1 2 to 3 months.
Figuras y tablas -
Analysis 2.1

Comparison 2 Secondary cerebral ischaemia, Outcome 1 2 to 3 months.

Comparison 3 Recurrent haemorrhage, Outcome 1 rebleed before treatment.
Figuras y tablas -
Analysis 3.1

Comparison 3 Recurrent haemorrhage, Outcome 1 rebleed before treatment.

Comparison 3 Recurrent haemorrhage, Outcome 2 rebleed post‐procedure up to 1 year.
Figuras y tablas -
Analysis 3.2

Comparison 3 Recurrent haemorrhage, Outcome 2 rebleed post‐procedure up to 1 year.

Comparison 3 Recurrent haemorrhage, Outcome 3 rebleed post‐procedure up to 3 months.
Figuras y tablas -
Analysis 3.3

Comparison 3 Recurrent haemorrhage, Outcome 3 rebleed post‐procedure up to 3 months.

Comparison 4 Case fatality, Outcome 1 death from any cause 2 to 3 months.
Figuras y tablas -
Analysis 4.1

Comparison 4 Case fatality, Outcome 1 death from any cause 2 to 3 months.

Comparison 4 Case fatality, Outcome 2 death from any cause between randomisation and 1 year after SAH.
Figuras y tablas -
Analysis 4.2

Comparison 4 Case fatality, Outcome 2 death from any cause between randomisation and 1 year after SAH.

Comparison 5 Complications from intervention, Outcome 1 complications from intervention.
Figuras y tablas -
Analysis 5.1

Comparison 5 Complications from intervention, Outcome 1 complications from intervention.

Comparison 6 Degree of obliteration, Outcome 1 non‐complete obliteration after 1 year.
Figuras y tablas -
Analysis 6.1

Comparison 6 Degree of obliteration, Outcome 1 non‐complete obliteration after 1 year.

Comparison 6 Degree of obliteration, Outcome 2 less than 90% occlusion after 1 year.
Figuras y tablas -
Analysis 6.2

Comparison 6 Degree of obliteration, Outcome 2 less than 90% occlusion after 1 year.

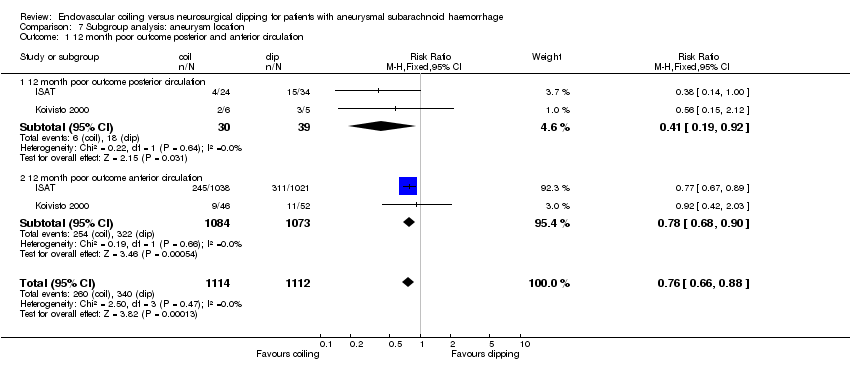
Comparison 7 Subgroup analysis: aneurysm location, Outcome 1 12 month poor outcome posterior and anterior circulation.
Figuras y tablas -
Analysis 7.1

Comparison 7 Subgroup analysis: aneurysm location, Outcome 1 12 month poor outcome posterior and anterior circulation.

Comparison 1. Poor outcome

Outcome or subgroup title

No. of studies

No. of participants

Statistical method

Effect size

1 death or dependency at 2 to 3 months Show forest plot

3

2257

Risk Ratio (M‐H, Fixed, 95% CI)

0.71 [0.63, 0.81]

2 death or dependency at 12 months after SAH Show forest plot

3

2243

Risk Ratio (M‐H, Fixed, 95% CI)

0.76 [0.67, 0.88]

3 worst‐case scenario at 12 months Show forest plot

3

2272

Risk Ratio (M‐H, Fixed, 95% CI)

0.81 [0.70, 0.92]

Figuras y tablas -
Comparison 1. Poor outcome
Comparison 2. Secondary cerebral ischaemia

Outcome or subgroup title

No. of studies

No. of participants

Statistical method

Effect size

1 2 to 3 months Show forest plot

2

129

Risk Ratio (M‐H, Fixed, 95% CI)

0.98 [0.68, 1.41]

Figuras y tablas -
Comparison 2. Secondary cerebral ischaemia
Comparison 3. Recurrent haemorrhage

Outcome or subgroup title

No. of studies

No. of participants

Statistical method

Effect size

1 rebleed before treatment Show forest plot

3

2272

Risk Ratio (M‐H, Fixed, 95% CI)

0.64 [0.37, 1.12]

2 rebleed post‐procedure up to 1 year Show forest plot

3

2272

Risk Ratio (M‐H, Fixed, 95% CI)

2.00 [1.08, 3.70]

3 rebleed post‐procedure up to 3 months Show forest plot

3

2272

Risk Ratio (M‐H, Fixed, 95% CI)

2.66 [0.71, 10.00]

Figuras y tablas -
Comparison 3. Recurrent haemorrhage
Comparison 4. Case fatality

Outcome or subgroup title

No. of studies

No. of participants

Statistical method

Effect size

1 death from any cause 2 to 3 months Show forest plot

3

2257

Risk Ratio (M‐H, Fixed, 95% CI)

0.88 [0.66, 1.18]

2 death from any cause between randomisation and 1 year after SAH Show forest plot

3

2243

Risk Ratio (M‐H, Fixed, 95% CI)

0.81 [0.63, 1.05]

Figuras y tablas -
Comparison 4. Case fatality
Comparison 5. Complications from intervention

Outcome or subgroup title

No. of studies

No. of participants

Statistical method

Effect size

1 complications from intervention Show forest plot

2

129

Risk Ratio (M‐H, Fixed, 95% CI)

1.05 [0.44, 2.53]

Figuras y tablas -
Comparison 5. Complications from intervention
Comparison 6. Degree of obliteration

Outcome or subgroup title

No. of studies

No. of participants

Statistical method

Effect size

1 non‐complete obliteration after 1 year Show forest plot

2

1038

Risk Ratio (M‐H, Fixed, 95% CI)

1.67 [1.29, 2.17]

2 less than 90% occlusion after 1 year Show forest plot

2

1038

Risk Ratio (M‐H, Fixed, 95% CI)

1.73 [0.97, 3.09]

Figuras y tablas -
Comparison 6. Degree of obliteration
Comparison 7. Subgroup analysis: aneurysm location

Outcome or subgroup title

No. of studies

No. of participants

Statistical method

Effect size

1 12 month poor outcome posterior and anterior circulation Show forest plot

2

2226

Risk Ratio (M‐H, Fixed, 95% CI)

0.76 [0.66, 0.88]

1.1 12 month poor outcome posterior circulation

2

69

Risk Ratio (M‐H, Fixed, 95% CI)

0.41 [0.19, 0.92]

1.2 12 month poor outcome anterior circulation

2

2157

Risk Ratio (M‐H, Fixed, 95% CI)

0.78 [0.68, 0.90]

Figuras y tablas -
Comparison 7. Subgroup analysis: aneurysm location