Colocación de espirales endovasculares versus clips neuroquirúrgicos para pacientes con hemorragia subaracnoidea por un aneurisma
Resumen
Antecedentes
Cerca del 30% de los pacientes que ingresan al hospital con hemorragia subaracnoidea (HSA) por un aneurisma presentará una nueva hemorragia en el mes siguiente a la hemorragia si no se trata el aneurisma. Los dos métodos utilizados con más frecuencia para ocluir el aneurisma para la prevención de una nueva hemorragia son la colocación de clips microquirúrgicos en el cuello del aneurisma y la oclusión del lumen del aneurisma por medio de espirales endovasculares. Ésta es una actualización de una revisión Cochrane publicada previamente en 2005.
Objetivos
Comparar los efectos de la colocación de espirales endovasculares versus clips neuroquirúrgicos en los pacientes con HSA por aneurisma sobre el resultado deficiente, la nueva hemorragia, el déficit neurológico y las complicaciones del tratamiento.
Métodos de búsqueda
Se hicieron búsquedas en el registro de ensayos del Grupo Cochrane de Accidentes Cerebrales Vasculares (Cochrane Stroke Group Trials Register) (marzo 2018). Además, se hicieron búsquedas en CENTRAL (2018, número 2), MEDLINE (1966 hasta marzo de 2018), Embase (1980 hasta marzo de 2018), US National Institutes of Health Ongoing Trials Register (marzo 2018), y en la World Health Organization (WHO) International Clinical Trials Registry Platform (ICTRP) (última búsqueda marzo de 2018). También se contactó con los autores de los ensayos.
Criterios de selección
Se incluyeron los ensayos aleatorios que compararon la colocación de espirales endovasculares con clips neuroquirúrgicos en pacientes con HSA causada por la rotura de un aneurisma.
Obtención y análisis de los datos
Dos autores de la revisión, de forma independiente, extrajeron los datos y evaluaron la calidad de los ensayos y el riesgo de sesgo mediante el enfoque GRADE. Se estableció contacto con los autores de los ensayos para obtener la información que faltaba. Un resultado deficiente se definió como muerte o dependencia en las actividades cotidianas (escala modificada de Rankin de 3 a 6 o escala de resultados de Glasgow [GOS] 1 a 3). En el análisis especial del peor de los casos, se supuso que todos los participantes del grupo con un mejor resultado e información faltante con respecto al seguimiento tenían un resultado deficiente y los del otro grupo con datos faltantes un buen resultado.
Resultados principales
Se incluyeron cuatro ensayos aleatorios que incluyeron a 2458 participantes (rango por ensayo: 20 a 2143 participantes). La evidencia se basa principalmente en el ensayo más grande. La mayoría de los pacientes estaban en buenas condiciones clínicas y presentaban un aneurisma en la circulación anterior. Ninguno de los ensayos incluidos presentó un bajo riesgo de sesgo en todos los dominios. Un ensayo tuvo riesgo incierto en un dominio, dos ensayos en riesgo incierto en tres dominios y un ensayo riesgo alto en un dominio.
Después de un año de seguimiento, el 24% de los participantes asignados al azar al tratamiento endovascular y el 32% de los participantes asignados al azar al grupo de tratamiento quirúrgico presentaron un resultado funcional deficiente. El cociente de riesgos (CR) de resultado deficiente (muerte o dependencia) para la colocación de espirales endovasculares versus clips neuroquirúrgicos fue 0,77 (intervalo de confianza [IC] del 95%: 0,67 a 0,87; cuatro ensayos, 2429 participantes, evidencia de calidad moderada) y la reducción del riesgo absoluto fue 7% (IC del 95%: 4% a 11%). En el análisis del peor de los casos para el resultado deficiente, el CR para la colocación de espirales versus clips neuroquirúrgicos fue 0,80 (IC del 95%: 0,71 a 0,91) y la reducción del riesgo absoluto fue 6% (IC del 95%: 2% a 10%). El CR de la muerte a los 12 meses fue 0,80 (IC del 95%: 0,63 a 1,02; cuatro ensayos, 2429 participantes, evidencia de calidad moderada). En un análisis de subgrupos de los participantes con un aneurisma en la circulación anterior, el CR del resultado deficiente fue 0,78 (IC del 95%: 0,68 a 0,90; dos ensayos, 2157 participantes, evidencia de calidad moderada), y la disminución del riesgo absoluto fue 7% (IC del 95%: 3% a 10%). En el análisis de subgrupos de los pacientes con un aneurisma en la circulación posterior, el CR fue 0,41 (IC del 95%: 0,19 a 0,92; dos ensayos, 69 participantes, evidencia de baja calidad), y la disminución absoluta en el riesgo fue 27% (IC del 95%: 6% a 48%). A los cinco años, el 28% de los participantes asignados al azar al tratamiento endovascular y el 32% de los participantes asignados al azar al tratamiento quirúrgico tuvieron un resultado funcional deficiente. El CR del resultado deficiente para la colocación de espirales endovasculares versus clips neuroquirúrgicos fue 0,87 (IC del 95%: 0,75 a 1,01; un ensayo, 1724 participantes, evidencia de baja calidad). A los diez años, el 35% de los participantes asignados al azar al tratamiento endovascular y el 43% de los participantes asignados al tratamiento quirúrgico presentaron un resultado funcional deficiente. A los diez años el CR del resultado deficiente para la colocación de espirales endovasculares versus clips neuroquirúrgicos fue 0,81 (IC del 95%: 0,70 a 0,92; un ensayo, 1316 participantes, evidencia de baja calidad). El CR de la isquemia cerebral retardada a los dos a tres meses para la colocación de espirales endovasculares versus clips neuroquirúrgicos fue 0,84 (IC del 95%: 0,74 a 0,96; cuatro ensayos, 2450 participantes, evidencia de calidad moderada). El CR de una nueva hemorragia para la colocación de espirales endovasculares versus clips neuroquirúrgicos fue 1,83 (IC del 95%: 1,04 a 3,23; cuatro ensayos, 2458 participantes, evidencia de alta calidad) al año más tarde y 2,69 (IC del 95%: 1,50 a 4,81; un ensayo, 1323 participantes, evidencia de baja calidad) a los diez años. El CR de las complicaciones de la intervención para la colocación de espirales endovasculares versus clips neuroquirúrgicos fue 1,05 (IC del 95%: 0,44 a 2,53; dos ensayos, 129 participantes, evidencia de baja calidad).
Conclusiones de los autores
La evidencia en esta revisión sistemática proviene principalmente de un ensayo grande y el seguimiento a largo plazo está disponible sólo para un subgrupo de participantes de dicho ensayo. En los pacientes en buenas condiciones clínicas con rotura de aneurismas de la circulación anterior y posterior, se encontró evidencia sólida que indica que, si el aneurisma se considera adecuado para la colocación de clips quirúrgicos y de espirales endovasculares, la colocación de espirales se asocia con un mejor resultado. No existe evidencia fiable proveniente de ensayos, que se pueda utilizar de forma directa para guiar el tratamiento en los pacientes con condiciones clínicas deficientes.
PICO
Resumen en términos sencillos
Colocación de espirales endovasculares versus clips neuroquirúrgicos para pacientes con hemorragia subaracnoidea por un aneurisma
Pregunta de la revisión
Se examinó el resultado después de la colocación de espirales endovasculares en comparación con clips neuroquirúrgicos luego de una hemorragia subaracnoidea.
Antecedentes
La hemorragia que ocurre en la membrana superficial del cerebro se llama hemorragia subaracnoidea. La hemorragia generalmente proviene de la rotura de un punto débil de una arteria que lleva sangre al cerebro. Esta zona débil es como un pequeño globo, llamado aneurisma. Generalmente el resultado después de la hemorragia subaracnoidea de un aneurisma es deficiente: un tercio de todos los pacientes muere en el transcurso de tres meses y uno de cada cinco pacientes presenta dependencia de otra persona para ayudarlo con las actividades cotidianas como caminar, vestirse, bañarse y atender sus propias necesidades. Uno de los riesgos en los pacientes con hemorragia subaracnoidea es la hemorragia recurrente. Hay dos maneras de intentar prevenirla: la colocación de un clip neuroquirúrgico en el cuello del aneurisma mediante una intervención o el bloqueo del aneurisma desde adentro mediante un espiral endovascular.
Características de los estudios
En marzo de 2018 se realizaron búsquedas de ensayos controlados aleatorios (ECA, estudios clínicos en los que los pacientes son asignados al azar a uno de dos o más grupos de tratamiento) que compararon la colocación de espirales endovasculares con clips neuroquirúrgicos para la hemorragia subaracnoidea. Se encontró un nuevo ECA y datos adicionales de ECA previamente identificados, lo que permitió incluir cuatro ECA con 2458 participantes.
Resultados clave
Los datos de los ECA mostraron que el número de pacientes que sobrevivieron y fueron independientes en la vida cotidiana fue mayor después de la colocación de espirales endovasculares que después de la colocación de clips neuroquirúrgicos, cuando ambas opciones de tratamiento fueron posibles. El riesgo de una nueva hemorragia fue mayor en los pacientes tratados con espirales endovasculares. La evidencia provino principalmente de un gran ensayo.
Calidad de la evidencia
Se consideró que hay evidencia suficiente para guiar el tratamiento de los pacientes con condiciones clínicas relativamente buenas cuyo aneurisma se considera apropiado para la colocación de clips neuroquirúrgicos y para el tratamiento endovascular. No existe evidencia fiable proveniente de ensayos, que se pueda utilizar de forma directa para guiar el tratamiento en los pacientes con condiciones clínicas deficientes.
Conclusiones de los autores
Summary of findings
| Endovascular coiling compared with neurosurgical clipping for subarachnoid haemorrhage | ||||||
| Patient or population: people with subarachnoid haemorrhage from a ruptured intracranial aneurysm Settings: tertiary care Intervention: endovascular coiling of aneurysm Comparison: neurosurgical clipping of aneurysm | ||||||
| Outcomes | Illustrative comparative risks* (95% CI) | Relative effect | No of participants | Quality of the evidence | Comments | |
| Assumed risk | Corresponding risk | |||||
| Neurosurgical clipping | Endovascular coiling | |||||
| Poor outcome: death or dependence in daily activities (12 months) | Study population | RR 0.77 (0.67 to 0.87) | 2429 | ⊕⊕⊕⊝ | — | |
| 366 per 1000 | 281 per 1000 | |||||
| Poor outcome (death or dependence) (10 years) | Study population | RR 0.81 (0.70 to 0.92) | 1316 | ⊕⊕⊝⊝a,b | Based on subgroup of participants in 1 large RCT only | |
| 430 per 1000 | 348 per 1000 | |||||
| Death from any cause (12 months) | Study population | RR 0.80 (0.63 to 1.02) | 2429 | ⊕⊕⊕⊝ | — | |
| 154 per 1000 | 123 per 1000 | |||||
| Delayed cerebral ischaemia (2–3 months) | Study population | RR 0.84 (0.74 to 0.96) | 2450 (4 RCTs) | ⊕⊕⊕⊝ | — | |
| 384 per 1000 | 322 per 1000 | |||||
| Rebleeding postprocedure up to 1 year | Study population | RR 1.83 (1.04 to 3.23) | 2458 (4 RCTs) | ⊕⊕⊕⊕ | — | |
| 21 per 1000 | 38 per 1000 (21 to 67) | |||||
| Rebleeding postprocedure up to 10 years | Study population | RR 2.69 (1.50 to 4.81) | 1323 (1 RCT) | ⊕⊕⊝⊝a,b | Based on 1 large RCT only | |
| 22 per 1000 | 61 per 1000 | |||||
| Complications from the intervention | Study population | RR 1.05 (0.44 to 2.53) | 129 (2 RCTs) | ⊕⊕⊝⊝c | Based on 2 small RCTs only | |
| 235 per 1000 | 246 per 1000 (103 to 594) | |||||
| *The basis for the assumed risk (e.g. the median control group risk across studies) is derived from the studies included in the meta‐analysis. The corresponding risk (and its 95% confidence interval) is based on the assumed risk in the comparison group and the relative effect of the intervention (and its 95% CI). CI: confidence interval; RCT: randomised controlled trial; RR: risk ratio. | ||||||
| GRADE Working Group grades of evidence | ||||||
| aDowngraded one level due to indirectness of evidence: participants in poor condition on admission under‐represented in the largest RCT. bDowngraded one level due to risk of bias: long‐term outcome data available for only a subgroup of participants. cDowngraded two levels due to risk of bias: underpowered due to data availability from only two small trials, unclear definition of complication from intervention. | ||||||
Antecedentes
Esta revisión sistemática de ensayos aleatorios comparó el resultado después de una hemorragia subaracnoidea (HSA) en pacientes tratados con espirales endovasculares versus clips neuroquirúrgicos. Es la primera actualización de una revisión publicada en 2005 (van der Schaaf 2005), que fue precedida por un protocolo publicado (Algra 2001).
Descripción de la afección
La HSA es un subgrupo dentro del accidente cerebrovascular con una incidencia de alrededor de nueve por 100 000 personas por año (de Rooij 2007). Ocurre en pacientes relativamente jóvenes: la mitad los pacientes son menores de 55 años de edad (de Rooij 2007) y conlleva un pronóstico deficiente. Un tercio de todos los pacientes muere en el transcurso de los tres meses de la hemorragia y uno de cada cinco pacientes presenta dependencia de la atención de otros para las actividades cotidianas (Nieuwkamp 2009). Debido al resultado deficiente después de la hemorragia y la edad temprana a la cual ocurre, la pérdida de años de vida productiva por HSA es tan grande como la del accidente cerebrovascular isquémico, que es el subgrupo más común dentro del accidente cerebrovascular (Johnston 1998). En el 85% de pacientes con HSA, la causa es la rotura de un aneurisma intracraneal. Cerca del 15% de los pacientes con HSA por aneurisma mueren antes de llegar al hospital (Huang 2002). Los que sobreviven las horas iniciales después de la hemorragia están en riesgo de nueva hemorragia hasta realizar la oclusión del aneurisma. Aunque desde finales de los años noventa, el retraso de tiempo en la oclusión del aneurisma ha disminuido considerablemente, alrededor del 15% de los pacientes todavía presentan nuevas hemorragias en el hospital (Vergouwen 2016).
Descripción de la intervención
La colocación de clips neuroquirúrgicos y de espirales endovasculares son métodos comunes para el tratamiento de los aneurismas intracraneales. La colocación de clips neuroquirúrgicos en un aneurisma requiere la abertura del cráneo (craneotomía). Durante la intervención, se coloca un clip metálico por encima del cuello del aneurisma para ocluir el flujo sanguíneo al aneurisma, pero preservarlo a través de las arterias normales adyacentes. El tratamiento endovascular de la rotura de un aneurisma se realiza avanzando un catéter hasta la arteria madre donde se produjo el aneurisma. Luego se colocan espirales metálicos en la bolsa del aneurisma a través de un microcatéter que detiene el flujo sanguíneo dentro del aneurisma e induce la formación de trombos, que ocluyen el aneurisma. También se utilizan otras técnicas de tratamiento endovascular, como la colocación de espirales asistida con cánula o balón, pero en esta revisión sólo se estudió la colocación simple de espirales.
De qué manera podría funcionar la intervención
El objetivo principal de la intervención es ocluir el flujo sanguíneo debido a la rotura del aneurisma para prevenir la nueva hemorragia. Sin embargo, la colocación de clips neuroquirúrgicos y de espirales endovasculares se asocia con una mortalidad y morbilidad significativas relacionadas con la intervención. La colocación de clips en el aneurisma es una intervención neuroquirúrgica mayor que requiere craneotomía, pero se considera que el resultado del tratamiento es duradero. El tratamiento endovascular es una intervención menos invasiva que la colocación de clips neuroquirúrgicos. Los motivos de preocupación principales asociados con la colocación de espirales endovasculares incluyen la obliteración incompleta del aneurisma y la durabilidad del resultado del tratamiento durante el seguimiento a largo plazo.
Por qué es importante realizar esta revisión
Los ensayos aleatorios prospectivos han examinado los efectos de la colocación de espirales endovasculares versus clips neuroquirúrgicos en la HSA. Una versión anterior de esta revisión sólo incluyó datos de seguimiento a corto plazo y al año de los efectos del tratamiento (van der Schaaf 2005), y la publicación de los datos de seguimiento a largo plazo requirió la actualización de la revisión. Esta síntesis también incluye la evaluación de la calidad de la evidencia mediante el proceso GRADE.
Objetivos
Comparar los efectos de la colocación de espirales endovasculares versus clips neuroquirúrgicos en los pacientes con HSA por aneurisma sobre el resultado deficiente, la nueva hemorragia, el déficit neurológico y las complicaciones del tratamiento.
Métodos
Criterios de inclusión de estudios para esta revisión
Tipos de estudios
Se realizaron búsquedas de todos los ensayos aleatorios que compararon la colocación de espirales endovasculares en los aneurismas intracraneales versus clips neuroquirúrgicos. Sólo se incluyeron estudios con una ocultación adecuada de la asignación.
Tipos de participantes
El análisis incluyó a pacientes con HSA por aneurisma en los que la hemorragia se documentó con examen por tomografía computarizada (TC) o imagenología de resonancia magnética (IRM) o por la presencia de xantocromía en el líquido cefalorraquídeo cerebral en los casos con una TC negativa de la cabeza; en los que la presencia de un aneurisma intracraneal se había demostrado antes de la asignación al azar mediante angiografía con catéter, angiografía con TC o angiografía de resonancia magnética; y cuyo aneurisma se había considerado apropiado para la colocación de clips neuroquirúrgicos y de espirales endovasculares. Al principio, se intentó excluir a los pacientes que fueron tratados más de 14 días después de la HSA. Sin embargo, debido a que el ensayo ISAT (International Subarachnoid Aneurysm Trial) incluyó a participantes que fueron tratados hasta 28 días después de la HSA, se modificó este criterio para excluir a los pacientes que fueron tratados más de 28 días después de la HSA (ISAT 2002).
Tipos de intervenciones
Tratamiento endovascular de la rotura de un aneurisma intracraneal con espirales desmontables y clips neuroquirúrgicos.
Tipos de medida de resultado
Para proporcionar un análisis de intención de tratar, se trató de extraer de cada ensayo el resultado al final del período de seguimiento para todos los pacientes que fueron asignados originalmente a cada grupo de tratamiento.
Resultados primarios
-
Resultado deficiente: muerte o dependencia en las actividades cotidianas (escala modificada de Rankin de 3 a 6 o escala de resultados de Glasgow [GOS] 1 a 3).
Resultados secundarios
-
Muerte por cualquier causa
-
Isquemia cerebral retardada (ICR), donde los episodios de deterioro clínico para los que no se encontraron otras causas que ICR se consideraron isquemia probable; los episodios con deterioro clínico; y el infarto cerebral confirmado por TC o IRM se clasificaron como isquemia definitiva.
-
Nueva hemorragia, donde un deterioro súbito que da lugar a la muerte sin confirmación de nueva hemorragia con TC, IRM o examen postmortem, se consideró un nueva hemorragia probable; un deterioro clínico súbito con nueva hemorragia confirmada por TC o postmortem se clasificó como una nueva hemorragia definitiva.
-
Complicaciones de la intervención (colocación de espirales endovasculares o clips neuroquirúrgicos), definidas como un deterioro clínico observado durante el procedimiento de intervención o en el transcurso de 24 horas después de la intervención.
Métodos de búsqueda para la identificación de los estudios
See the 'Specialised register' section in the Cochrane Stroke Group module. We aimed to identify all relevant randomised trials regardless of language or publication status (published, unpublished, in press, or in progress) and arranged translation of relevant papers published in languages where necessary.
Búsquedas electrónicas
We identified relevant trials in the Cochrane Stroke Group Trials Register, which was last searched by the Cochrane Stroke Information Specialist in March 2018. In addition, we searched the following electronic databases:
-
CENTRAL (2018, Issue 2) in the Cochrane Library (2018, Issue 2; Appendix 1);
-
MEDLINE Ovid (1966 to 26 March 2018; Appendix 2);
-
Embase Ovid (1980 to 26 March 2018; Appendix 3).
We used the search strategy developed for MEDLINE with the assistance of the Cochrane Stroke Group Information Specialist and modified it to suit other databases. We searched the following ongoing trials and research registers:
-
US National Institutes of Health Ongoing Trials Register ClinicalTrials.gov (clinicaltrials.gov; last searched 27 March 2018; Appendix 4);
-
World Health Organization (WHO) International Clinical Trials Registry Platform (ICTRP) (apps.who.int/trialsearch; last searched 27 March 2018; Appendix 4).
Búsqueda de otros recursos
In an effort to identify additional relevant published and unpublished studies, we contacted trialists and scanned the reference list of all relevant publications
Obtención y análisis de los datos
Selección de los estudios
Two review authors (original version of the review: IvdS and GJER; updated version of the review: AL and MV) independently reviewed the studies identified by the search for their relevance using the selection criteria. We resolved disagreements through discussion.
Extracción y manejo de los datos
Two review authors (original version of the review: IvdS and MV; updated version of the review: AL and MV) independently extracted details of method of randomisation, inclusion and exclusion criteria, blinding of outcome assessment, prognostic factors for outcome (clinical condition on admission, site and size of aneurysm, and time interval between SAH and treatment allocation), the definition of outcome measures, and the number of participants who were excluded or lost to follow‐up. Furthermore, we assessed whether intention‐to‐treat analysis was possible from the published data and if treatment groups were comparable with regard to major prognostic risk factors. In addition, we recorded duration of follow‐up, the numbers of deaths and participants with poor outcome (dependent in daily life) at the time points used by the trialists, the number of participants with DCI or rebleeding at the time points used by the trialists, complications from the intervention, and technical results of the intervention in terms of degree of obliteration of the aneurysm. Where there was disagreement, both review authors reassessed and discussed the article in question together until they reached consensus.
Evaluación del riesgo de sesgo de los estudios incluidos
Two review authors (AL and MV) independently assessed the risk of bias in the included studies according to the criteria outlined in the Cochrane Handbook for Systematic Reviews of Interventions (Higgins 2011), using the Cochrane tool for assessing risk of bias. We assessed the following domains:
-
random sequence generation;
-
allocation concealment;
-
blinding of participants and personnel;
-
blinding of outcome assessment;
-
incomplete outcome data;
-
selective outcome reporting;
-
other relevant biases.
We judged each domain for included studies as low, unclear, or high risk and provided information from the study report or obtained straight from the trialists together with a justification for our judgement in the 'Risk of bias' tables. Where there was disagreement, both authors reassessed and discussed the article in question together until they reached consensus.
Medidas del efecto del tratamiento
We analysed the primary and other outcomes according to the intention‐to‐treat principle. However, in one study it was unclear whether the published results represented intention‐to‐treat or treatment received, and so we performed a sensitivity analysis excluding this study (Li 2012). We calculated an estimate of the treatment effect across trials (risk ratio (RR) with 95% confidence interval (CI)) using standard methods for the main outcome measures. We also calculated absolute risk differences with 95% CI.
In addition, we assessed the number of participants with rebleeding from the target aneurysm at more than one year after the SAH (as a number per patient‐years of follow‐up).
We also assessed the results of treatment in terms of degree of occlusion of the aneurysm directly after treatment and at a follow‐up period of one year. We categorised occlusion after endosaccular packing as:
-
100% occlusion with coils filling the neck;
-
90% to 100% occlusion with neck remnant, and:
-
less than 90% occlusion, which included any contrast filling within the dome of the aneurysm.
If data on angiographic follow‐up were given for both endovascular and surgically treated participants, we compared the proportions of incompletely occluded aneurysms at the end of the follow‐up period.
Other prespecified analyses were:
-
timing of the intervention as early (within three days after onset of the SAH); intermediate (three to 10 days after onset of the SAH); or late (more than 10 days after the SAH);
-
timing of the follow‐up period, with trials categorised according to time of outcome assessment between one to three months; three to six months; and six to 12 months;
-
methodological quality of trials with:
-
-
exclusion of studies with insufficient information on inclusion and exclusion criteria;
-
exclusion of studies with insufficient data on method of randomisation;
-
exclusion of studies with insufficient data on blinding of outcome assessment;
-
exclusion of studies with insufficient data on the number of participants who were excluded or lost to follow‐up;
-
exclusion of studies with insufficient data on the definition of outcome events; and
-
exclusion of studies with insufficient data on the following prognostic factors:
-
clinical condition on admission;
-
site and size of the aneurysm; and
-
time interval between the SAH and treatment allocation.
-
-
For DCI and rebleeding, we performed separate analyses for the combination of probable and definite episodes and for definite episodes alone. We compared the number of participants with rebleeding per patient‐year of follow‐up for the period more than one year after the initial haemorrhage.
Cuestiones relativas a la unidad de análisis
The individual participant was the unit of analysis.
Manejo de los datos faltantes
If any participants were excluded or lost to follow‐up from the analyses, or if any of the necessary data were not available from the publication, we sought further information by contacting the trialists. If the primary analysis suggested a beneficial effect of the main outcome but follow‐up was not complete because data were missing from participants excluded after randomisation or who were lost to follow‐up, we performed a special worst‐case scenario analysis in which participants in the group with better outcome with missing follow‐up information were assumed to have had a poor outcome and those in the other group with missing data a good outcome.
Evaluación de la heterogeneidad
We assessed the statistical validity of aggregating the trials with Chi2 test statistics for heterogeneity and by calculating the I2 statistic. Substantial heterogeneity was defined as an I2 statistic greater than 50%. (Higgins 2011). We used the Peto method to calculate a weighted estimate of the treatment effects across trials (APT 1994).
Evaluación de los sesgos de notificación
As we only included four studies in this review, we did not produce funnel plots to analyse reporting bias.
Síntesis de los datos
Two review authors (AL and MV) extracted data, which one author (AL) compiled and entered into Review Manager 5 (Review Manager 2014). We calculated the RR and absolute risk difference using Review Manager 5, in accordance with Cochrane guidelines (Higgins 2011).
Análisis de subgrupos e investigación de la heterogeneidad
We planned subgroup analyses for aneurysm location (anterior versus posterior circulation, and a separate analysis for basilar artery aneurysms) and timing of the intervention. We used the I2 statistic to assess heterogeneity.
Análisis de sensibilidad
We planned a sensitivity analysis if it was unclear in any of the included studies whether an intention‐to‐treat analysis had been performed or if the analysis was based on treatment received. For the sensitivity analysis, we only included trials with an intention‐to‐treat analysis.
GRADE and 'Summary of findings' table
Two review authors (AL and MV) assessed the quality of the evidence generated from the review according to the GRADE approach. We presented the main results in a 'Summary of findings' table. We initially considered the quality of the evidence to be high because of the study design (randomised controlled trial). We subsequently downgraded this depending on whether there were study limitations; whether the results were inconsistent, imprecise, the evidence was indirect, or there was publication bias. The 'Summary of findings' table presented the following outcomes: poor outcome at 12 months, poor outcome at 10 years, death from any cause at 12 months, DCI at two to three months, rebleeding at one year, rebleeding at 10 years, and complications from the intervention.
Results
Description of studies
See Characteristics of included studies; Characteristics of excluded studies; Characteristics of studies awaiting classification; Characteristics of ongoing studies tables.
Results of the search
The summary of the search results is presented in a PRISMA study flow diagram (Figure 1). In total, we screened 2185 records. At the time of the original review, we included three RCTs (Brilstra 2000; ISAT 2002; Koivisto 2000: three records and one unpublished dataset). For this updated review, we identified four additional potentially eligible studies (BRAT 2012; ISAT‐2; Li 2012; Wadd 2015), and new long‐term follow‐up data for one of the previously included RCTs (ISAT 2002: four new records). We identified one additional record of the study of Koivisto 2000. We included one new RCT in the present review (Li 2012: one record), we excluded one study because it was not an RCT (BRAT 2012: three records), we moved one study to Studies awaiting classification pending additional data from the study authors (Wadd 2015: one record), and one study is still ongoing without published results to date (ISAT‐2: one record).

Study flow diagram. RCT: randomised controlled trial.
Included studies
We included four trials: three published, RCTs of endovascular coiling versus neurosurgical clipping for people with aneurysmal SAH (ISAT 2002; Koivisto 2000; Li 2012): and one unpublished, unconfounded controlled trial of a series of 20 people randomly allocated to either endovascular or surgical treatment (Brilstra 2000). These trials recruited participants in the years between 1994 and 2009.
The meta‐analysis included 2458 randomised participants: 1229 in the endovascular treatment group and 1229 in the surgical treatment group. The largest trial was ISAT 2002, which recruited 2143 participants. The other trials recruited 20 (Brilstra 2000), 109 (Koivisto 2000), and 186 (Li 2012) participants. The mean age of the participants in each trial ranged from 49.5 to 54 years. In all trials, randomisation was done within 28 days of the participant's ictus.
In the included trials, SAH was confirmed either by CT or lumbar puncture, and aneurysms were confirmed by CT‐angiography or angiography. After obtaining informed consent, all participants with a ruptured aneurysm that was considered suitable for both neurosurgical clipping and endovascular coiling were included if the clinical condition justified treatment. The maximum delay between SAH and treatment was three days in Koivisto 2000, five days in Brilstra 2000, and 28 days in ISAT 2002. Li 2012 did not give the maximum time to treatment, but mean time to treatment was three days.
ISAT 2002 excluded people if they were already participating in another trial. Koivisto 2000 defined exclusion criteria for participant and aneurysm characteristics. They excluded people older than 75 years, with a large haematoma necessitating operation or having a mass effect causing neurological deficit, or with a history of any previous operation for the same aneurysm. Furthermore, they gave exclusion criteria for the aneurysm concerning size, shape, and relationship to adjacent vessel. Brilstra 2000 excluded people with a fusiform, traumatic, or dissecting aneurysm. Li 2012 included all participants with aneurysmal SAH.
Outcome measures and follow‐up duration
In ISAT 2002, the primary outcome measure was the proportion of participants with a modified Rankin scale score of 3 to 6 (dependency or death) at one year. Secondary outcome measures were rebleeding, quality of life at one year, proportion of participants with epilepsy, cost‐effectiveness, and neuropsychological outcomes. Accrual to ISAT was stopped prematurely, before the planned sample size had been achieved, on the basis of an interim analysis. The Data Monitoring Committee analysed the data on 29 April 2002 and advised the Steering Committee, on the basis of the result, to stop recruitment. The Steering Committee met on 2 May 2002 and decided that recruitment should stop but that follow‐up must continue. Recruitment ceased immediately (ISAT 2002). Follow‐up continued and data from five‐year, 10‐year, and 18‐year follow‐ups have been published (Molyneux 2005; Molyneux 2009; Molyneux 2015).
In Koivisto 2000, the primary outcome measurements were 12‐month functional outcome and 12‐month neuropsychological and radiological outcomes. The 12‐month functional outcome was defined by the GOS, trichotomised into good or moderate recovery (GOS 5 and 4), severe disability and vegetative state (GOS 3 and 2), and death (GOS 1).
In Brilstra 2000, outcome measures were the proportion of participants with a Rankin score of 3 to 6 (dependency or death), the rates of rebleeding and DCI, and the rate of procedural complications at three months.
In Li 2012, outcome measures were 12‐month functional outcome (modified Rankin scale), 12‐month case fatality, 12‐month rebleeding rate and rate of DCI and rate of non‐complete obliteration of aneurysm within 12 months.
Excluded studies
We excluded one non‐randomised trial comparing endovascular coiling and neurosurgical clipping (BRAT 2012). This trial, which recruited people with SAH between 2003 and 2007, had several methodological flaws including inadequate allocation concealment: the treatment allocation was performed by alternating on 1:1 ratio (McDougall 2012) (Characteristics of excluded studies table).
Risk of bias in included studies

Risk of bias summary: review authors' judgements about each risk of bias item for each included study.

Risk of bias graph: review authors' judgements about each risk of bias item presented as percentages across all included studies.
Allocation
Two trials used sealed envelopes as the method of randomisation (Brilstra 2000; Koivisto 2000). Brilstra 2000 used a computer‐generated list and the sealed envelopes were not within reach of the treating physician.
ISAT 2002 used a minimisation algorithm to ensure balance between the two groups based on clinical grade, size and location of aneurysm, and extent of extravasated blood on CT, and made allocations by telephone call to a central randomisation service.
Li 2012 used a computer‐generated randomisation schedule.
We assessed the risk of selection bias as low for all included trials.
In the included trials, the prognostic factors of sex, age, and clinical condition on admission were balanced. Aneurysm location was similar for the treatment groups within each trial. Aneurysm size was balanced in three trials, but aneurysm size per treatment group was not available for Li 2012. However, in ISAT 2002, the prognostic determinant time between randomisation and first procedure (i.e. the time between SAH and treatment) differed slightly but statistically significantly between the coiled and clipped participants. For participants allocated to endovascular treatment the mean interval was 1.1 days (interquartile range IQR 0 to 1; range 0 to 30), and for participants allocated to neurosurgical treatment the mean interval was 1.7 days (IQR 0 to 2; range 0 to 41) (ISAT 2002).
Blinding
Due to the nature of the interventions, it was not possible to blind the interventionists, participants, or care personnel to the interventions. However, we have judged that the risk of performance bias to be low in the included studies.
ISAT 2002 collected clinical outcome measures using a validated postal questionnaire mailed to the participants. A single neurosurgeon primarily responsible for treatment or the principal investigator of the study evaluated the 12‐month functional outcome in Koivisto 2000. Brilstra 2000 interviewed participants or their carers by telephone to assess functional outcome three months after SAH and a neurologist or by a neurosurgeon who had not operated on the participant assessed 12‐month functional outcome at the outpatients clinic. Li 2012 assessed 12‐month outcome in outpatient clinic visits or by structured telephone interview with participants or close relatives.
ISAT 2002 defined DCI as a clinical diagnosis. In Koivisto 2000, DCI was not CT or MRI confirmed, but the diagnosis was based upon clinical signs of ischaemic neurological deficit. Brilstra 2000 confirmed DCI by CT or MRI. Li 2012 confirmed DCI by CT. In three trials, rebleeding had to be confirmed by CT (Brilstra 2000; ISAT 2002; Koivisto 2000), but Li 2012 did not state this. Li 2012 only reported rebleeding within 12 months after haemorrhage.
We judged the risk of detection bias to be high in Koivisto 2000, and unclear in Brilstra 2000, ISAT 2002, and Li 2012.
Incomplete outcome data
ISAT 2002 sought the main outcome measure at two months and one year for all participants, and annually thereafter for some participants. At one‐year follow‐up, the vital status was known for all included participants. For eight coiled participants (endovascular coiling group) and seven clipped participants (neurosurgical clipping group), the disability status was missing at two‐month follow‐up. At one‐year follow‐up, the disability status was missing for 10 endovascular participants and 15 neurosurgical participants. Long‐term follow‐up results (five and 10 years) were only available for part of the original ISAT cohort: annual follow‐ups were continued in all UK and eight non‐UK centres. At five years, functional outcome was available for 867 participants in the endovascular coiling group and 857 participants in the neurosurgical clipping group; and mortality was available for 1046 participants in the endovascular coiling group and 1041 participants in the neurosurgical clipping group. At 10 years, functional outcome was available for 666 participants in the endovascular coiling group and for 650 participants in the neurosurgical clipping group, with 10‐year mortality data available for 809 participants in the endovascular coiling group and 835 participants in the neurosurgical clipping group.
Koivisto 2000 assessed clinical and neuropsychological outcomes after three and 12 months. No participants were lost to follow‐up. Mean follow‐up was 39 months (standard deviation (SD) 18 months).
Brilstra 2000 assessed the main outcome measures at three months and no participants were lost to follow‐up at that time. Mean duration of follow‐up was 25 months (SD 22 months). At 12‐month follow‐up, eight coiled participants (endovascular coiling group) and eight clipped participants (neurosurgical clipping group) were available for analysis. There was no information on vital status for two participants in the endovascular coiling group and two participants in the neurosurgical clipping group.
Li 2012 assessed outcomes at 12 months and functional outcome was available for all surviving participants.
ISAT 2002 reported the angiographic occlusion on the first follow‐up angiography performed after the procedure for 881/988 participants allocated to endovascular treatment and alive after one year, and for 450/965 participants allocated to surgical treatment alive after one year. In the endovascular coiling group, timing of follow‐up angiography was before discharge in 28 participants, before two months in 80 participants, between two to 12 months in 690 participants, between one and two years in 58 participants, and after two years in 25 participants. MRI angiography was used in 47 participants. In the neurosurgical clipping group, timing of follow‐up angiography was before discharge in 142 participants, before two months in 61 participants, between two to 12 months in 199 participants, and between one and five years in 48 participants.
Koivisto 2000 gave the primary (direct post treatment) and final (after one‐year follow‐up) angiographic results of endovascular and neurosurgical treatment of the ruptured aneurysms.
Brilstra 2000 had direct post‐treatment information of completeness of occlusion after treatment for all participants; there was angiographic follow‐up information for only one of the clipped participants and for six of the eight participants who survived six months after the SAH.
Li 2012 had 12‐month angiographical follow‐up for all surviving participants. They provided only the rate of non‐complete aneurysm obliteration.
In summary, we judged the risk of attrition bias to be unclear in ISAT 2002, and low in Brilstra 2000, Koivisto 2000, and Li 2012.
Selective reporting
The risk for selective reporting in ISAT 2002, which provided a protocol (and reported outcomes as specified in the protocol), was low.
We did not identify the protocol for Brilstra 2000, but obtained information via personal communication that indicated that all intended outcomes were reported. We judged the risk for selective reporting to be low.
Koivisto 2000 published a report including the study protocol and intended outcomes, and we judged the risk of bias to be low.
Li 2012 have not published a protocol. A published report suggested that all intended outcomes were reported. We contacted the study authors for clarification, but are awaiting a response. We judged the risk of reporting bias as unclear.
Other potential sources of bias
Most of the evidence came from the largest trial (ISAT 2002). During recruitment of participants in ISAT, only 22% of people with SAH treated within the participating centres were enrolled in the study. In addition, people with SAH in poor clinical condition on admission were under‐represented in the ISAT cohort as 88% of the included participants were in good clinical condition (Grade 1‐2 on World Federation of Neurological Surgeons Subarachnoid Haemorrhage grading scale). Thus, the results of the review are only applicable to people with SAH who are in relatively good condition on admission.
It was unclear whether the published results represented intention‐to‐treat or treatment received in Li 2012. We requested missing data from the trialists but are awaiting a response.
We assessed the risk of other types of bias to be low in two trials (Brilstra 2000; Koivisto 2000), and unclear in the other two trials (ISAT 2002; Li 2012).
Effects of interventions
See summary of findings Table for the main comparison.
Poor outcome: death or dependence in daily activities
The weighted relative risk reduction for endovascular coiling versus neurosurgical clipping at two‐ to three‐month follow‐up was 29% (RR 0.71, 95% CI 0.63 to 0.81; 3 trials; 2257 participants; Analysis 1.1). The absolute risk reduction was 10% (95% CI 7% to 14%).
At one year, 295/1217 (24%) participants randomised to endovascular treatment and 383/1212 (32%) participants randomised to the surgical treatment group had poor functional outcome (Analysis 1.2). All trials adequately reported on functional outcome at 12‐month follow‐up. The reduction in the weighted RR for endovascular coiling versus neurosurgical clipping was 23% (RR 0.77, 95% CI 0.67 to 0.87; 4 trials; moderate‐quality evidence). The absolute risk reduction was 7% (95% CI 4% to 11%); this means that for every 14 (95% CI 9 to 25) participants who were allocated to be coiled instead of clipped, one poor outcome was prevented. In the worst‐case scenario, the relative risk reduction of endovascular coiling versus neurosurgical clipping was 20% (RR 0.80, 95% CI 0.71 to 0.91; 4 trials; 2458 participants; Analysis 1.3), and the absolute risk reduction was 6% (95% CI 3% to 10%).
At five years, 241/867 (28%) participants randomised to endovascular treatment and 273/857 (32%) participants randomised to surgical treatment had poor functional outcome. The relative risk reduction was 13% (RR 0.87, 95% CI 0.75 to 1.01; 1 trial; Analysis 1.4) and the absolute risk reduction (ARR) was 4% (ARR –0.04, 95% CI –0.08 to 0.00).
At 10 years, 231/666 (35%) participants allocated to endovascular treatment and 280/650 (43%) participants allocated to surgical treatment had poor functional outcome. The relative risk reduction was 19% (RR 0.81, 95% CI 0.70 to 0.92; 1 trial; 1316 participants; low‐quality evidence) and the absolute risk reduction was 8% (95% CI 3 to 14%).
Death from any cause
The relative risk reduction in death for endovascular coiling versus neurosurgical clipping at two or three months was 12% (RR 0.88, 95% CI 0.66 to 1.18; 3 trials; 2257 participants; Analysis 2.1). The absolute risk reduction was 1% (95% CI –1% to 3%). In the endovascular treatment group, 104/1217 (9%) participants had died from any cause within one year compared with 130/1212 (11%) participants allocated to the surgical treatment group. The relative risk reduction in deaths at one‐year follow‐up for endovascular treatment compared with neurosurgical treatment was 20% (RR 0.80, 95% CI 0.63 to 1.02; 4 trials; 2429 participants; moderate‐quality evidence; Analysis 2.2). The absolute risk reduction was 2% (95% CI 0% to 5%). At five years, 112/1046 (11%) participants in the endovascular treatment group and 144/1041 (14%) participants in the neurosurgical clipping group had died. The relative risk reduction for death at five years was 13% (RR 0.77, 95% CI 0.61 to 0.98; 1 trial; Analysis 2.3). At 10 years, 135/809 (17%) participants in the endovascular treatment group and 178/835 (21%) participants in the neurosurgical clipping group had died (relative risk reduction: 22%; RR 0.78, 95% CI 0.64 to 0.96; 1 study; Analysis 2.4).
Delayed cerebral ischaemia
DCI at two to three months after SAH was observed in 292/1225 (24%) participants allocated to the endovascular treatment group and in 349/1225 (28%) participants allocated to the surgical treatment group. The weighted relative risk reduction of endovascular coiling versus neurosurgical clipping was 16% (RR 0.84, 95% CI 0.74 to 0.96; 4 trials; moderate‐quality evidence; Analysis 3.1). The absolute risk reduction was 4% (95% CI 0% to 7%).
Rebleeding
Nineteen of 1135 (1.7%) participants allocated to endovascular treatment and 30/1137 (2.6%) participants allocated to neurosurgical clipping experienced rebleeding before treatment. The risk for preprocedural rebleeding did not significantly differ between endovascular coiling and neurosurgical clipping groups (RR 0.64, 95% CI 0.37 to 1.12; Analysis 4.1). With regard to post‐procedural rebleeding up to one year after treatment, the relative risk of rebleeding was higher for endovascular treatment: 32/1229 (2.6%) participants allocated to endovascular treatment and 17/1137 (1.4%) participants allocated to neurosurgical clipping had an episode of rebleeding. The RR was 1.83 (95% CI 1.04 to 3.23; 4 trials; high‐quality evidence; Analysis 4.2). The absolute increase in risk was 1% (95% CI 0% to 2%). At a follow‐up period of one (ISAT 2002) to three months (Brilstra 2000; Koivisto 2000), the relative risk for postprocedural rebleeding was 2.66 (95% CI 0.71 to 10.00) for endovascular coiling versus neurosurgical clipping. The absolute increase in risk was 0% (95% CI 0% to 1%).
Complications from intervention
Koivisto 2000 reported information on technical failure and clinical deterioration within 24 hours of the intervention. Brilstra 2000 reported on complications from the intervention, defined as clinical deterioration within 24 hours after the intervention. Complications occurred in 8/62 (13%) participants (13%) in the endovascular coiling group and in 8/67 (12%) participants in the neurosurgical clipping group. The weighted relative risk increase with endovascular coiling versus neurosurgical clipping was 5% (RR 1.05, 95% CI 0.44 to 2.53; 2 trials; Analysis 5.1). The absolute risk increase was 1% (95% CI –10% to 12%).
Neither ISAT 2002 nor Li 2012 reported information on complications from the interventions.
Death or rebleeding at more than one year after the subarachnoid haemorrhage
Death
In ISAT 2002, 27 participants randomised to endovascular coiling and 39 participants randomised to neurosurgical clipping died between one and five years. In addition, 23 participants randomised to endovascular coiling and 34 participants randomised to neurosurgical clipping died between five and 10 years of follow‐up. In the survival analysis, the proportion of participants alive decreased by 3% in the four‐year period after the first year for endovascular participants and by 4% for the neurosurgical participants. This corresponded to a death rate of 7.6 per 1000 patient‐years for participants in the endovascular coiling group and 10.2 per 1000 patient‐years for participants in the neurosurgical clipping group.
In Koivisto 2000, two participants allocated to endovascular treatment and one participant allocated to surgical treatment died after one year. In survival analyses, the proportion of participants alive decreased by 5% for participants in the endovascular coiling group in the three‐and‐half year period after the first year of follow‐up and by 7% for participants in the neurosurgical clipping group. This corresponded to a death rate of 14.6 per 1000 patient‐years for participants in the endovascular coiling group and 20.7 per 1000 patient‐years for participants in the neurosurgical clipping group.
In Brilstra 2000, a total of 8.7 patient‐years of follow‐up were available for the participant in the endovascular coiling group and a total of 19.6 patient‐years were available for the participants in the neurosurgery group after the one‐year follow‐up period. None of the participants died during this follow‐up.
Rebleeding
In ISAT 2002, 10 participants had a rebleeding from the target aneurysm between one and five years of follow‐up (8447 patient‐years' follow‐up in the endovascular coiling group and 8177 patient‐years' follow‐up in the neurosurgical clipping group). Seven of these participants were in the endovascular coiling group and three were in the neurosurgical clipping group. Between five and 10 years of follow‐up, three additional participants in the endovascular coiling group and one participant in the neurosurgical clipping group had a rebleeding from the target aneurysm. Additionally, three participants had a rebleeding after one year from another aneurysm but the trialists provided no information on the treatment modality of the target aneurysm for these participants. The RR for postprocedural rebleeding in the endovascular coiling group was 2.75 (95% CI 1.51 to 5.02) at five years' follow‐up and 2.69 (95% CI 1.50 to 4.81) at 10 years' follow‐up. Absolute risk increase was 3% (95% CI 1% to 5%) at five years and 4% (95% CI 2% to 6%) at 10 years.
Koivisto 2000 and Brilstra 2000 reported no episodes of rebleeding more than one year after SAH. The mean follow‐up period after one year was 27 months in Koivisto 2000 and 13 months in Brilstra 2000.
Degree of occlusion after endovascular coiling and neurosurgical clipping
ISAT 2002 gave direct post‐treatment results and angiographic occlusion on the first follow‐up angiography performed after the procedure. Direct post‐treatment information was based upon the first procedure actually performed, not the original allocation. Of the 1095 participants in the endovascular coiling group, endovascular coiling failed in 81 (7.4%) participants. In 22/1012 (2.2%) participants in whom the first treatment was neurosurgical, clipping was not completed or not attempted in 35 participants (3.5%). The aneurysm was successfully wrapped in 14 of these 35 participants. The angiographic occlusion on the first follow‐up angiography performed after the procedure was reported for 881/988 eligible participants allocated to endovascular treatment and for 450/965 eligible participants allocated to surgical treatment. Occlusion was complete in 66% of participants in the endovascular coiling group and 82% of the participants in the neurosurgical clipping group; a 90% to 100% occlusion of the aneurysm had occurred in a further 26% of participants in the endovascular coiling group and 12% of participants in the neurosurgery group; there was incomplete occlusion (less than 90%) in 7.8% of the participants in the endovascular coiling group and 5.6% of participants in the neurosurgery group (Table 1).
| Number of participants per treatment | Extent of occlusion | ||
| 100% | 90% to 100% | < 90% | |
| Endovascular coiling: 881 | 584 (66%) | 228 (26%) | 69 (8%) |
| Neurosurgical clipping: 450 | 370 (82%) | 55 (12%) | 25 (6%) |
| Endovascular coiling: 52 | 40 (77%) | 10 (19%) | 2 (4%) |
| Neurosurgical clipping: 57 | 49 (86%) | 7 (12%) | 1 (2%) |
| Total | |||
| Endovascular coiling: 933 | 624 (67%) | 238 (26%) | 71 (8%) |
| Neurosurgical clipping: 507 | 419 (83%) | 62 (12%) | 26 (5%) |
Koivisto 2000 provided the direct post‐treatment results of treatment for all participants, and one‐year follow‐up angiographic results. In participants in the endovascular coiling group, there was direct post‐treatment complete obliteration in 50% of participants compared with 74% in the neurosurgical clipping group. In 35% of participants in the endovascular coiling group, there was an occlusion of 90% to 100% compared with 16% of participants in the neurosurgical group; and in 15% of participants in the endovascular coiling group the aneurysm was less than 90% occluded compared with 11% of participants in the neurosurgical clipping group. After one year, there was complete occlusion in 77% of participants in the endovascular coiling group and 86% of participants in the neurosurgical clipping group; 90% to 100% occlusion of the aneurysm in 19% of participants in the endovascular coiling group and 12% of participants in the neurosurgical clipping group; and incomplete occlusion (less than 90%) in 4% of participants in the endovascular coiling group and 2% of participants in the neurosurgical clipping group.
Brilstra 2000 did not provide angiographic follow‐up for all participants but gave immediate post‐treatment information for all participants. Neurosurgical clipping of the aneurysm was not feasible in one participant and was incomplete in another participant. Immediate postcoiling angiography showed complete occlusion in five participants and 90% to 99% occlusion in the other five participants in the endovascular coiling group.
Li 2012 reported angiographical outcomes at 12 months for all surviving participants. There was incomplete occlusion of the treated aneurysm in 35% of participants in the endovascular coiling group and 16% of participants in the neurosurgery group.
On comparison of incomplete obliteration (less than 100% obliteration) for coiled versus clipped participants during one‐year follow‐up, the relative risk increase was 2.02 (95% CI 1.65 to 2.47; 3 trials; 1626 participants; Analysis 6.1) and the absolute increase in risk was 17% (95% CI 12% to 22%). The RR for obliteration less than 90% was 1.43 (95% CI 0.93 to 2.21; 2 trials; 1440 participants; Analysis 6.2) and the absolute increase in risk was 2% (95% CI 0% to 5%).
Additional analysis
The timing of the intervention was early in Koivisto 2000 (treatment within three days); early or intermediate in Brilstra 2000; and early, intermediate, or late in ISAT 2002. Li 2012 did not give the exact timing of interventions; we requested the details but have not received a reply.
In Li 2012, it was not clear if analyses were done according to the intention‐to‐treat principle; therefore, we performed a sensitivity analysis excluding this study. The results of this analysis were essentially the same as those of the main analysis: the RR for poor outcome was 0.76 (95% CI 0.66 to 0.88; Analysis 7.1).
A subgroup analysis for basilar aneurysms could not be performed since only data for all posterior circulation aneurysms combined were available. Therefore, we performed an analysis for all posterior circulation aneurysms and all anterior circulation aneurysms for which information was available (for ISAT 2002 and Koivisto 2000). Brilstra 2000 included no participants with posterior circulation. For participants with a posterior circulation aneurysm, the RR of poor outcome was 0.41 (95% CI 0.19 to 0.92; 69 participants; Analysis 7.1), and the absolute decrease in risk was 27% (95% CI 6% to 48%). For participants with an anterior circulation aneurysm, the RR was 0.78 (95% CI 0.68 to 0.90; Analysis 7.1), and the absolute risk decrease was 7% (95% CI 3% to 10%).
Discusión
Resumen de los resultados principales
La agregación de los resultados de todos los ensayos aleatorios identificados sobre la colocación de espirales endovasculares versus tratamiento con clips neuroquirúrgicos en participantes con HSA por la rotura de un aneurisma, mostró una reducción del resultado deficiente después del tratamiento con colocación de espirales endovasculares en comparación con los clips neuroquirúrgicos un año más tarde, incluso en el análisis especial del peor de los casos. En el seguimiento de cinco y diez años, la diferencia entre la colocación de espirales endovasculares y clips neuroquirúrgicos fue menor y sin significación estadística. El tamaño del efecto más pequeño se puede explicar mediante el riesgo concurrente de otras enfermedades cardiovasculares (Rinkel 2011). La falta de un efecto estadísticamente significativo se puede deber al hecho de que los datos de resultado a largo plazo sólo estuvieron disponibles para un subgrupo de la cohorte original del ISAT, lo que dio lugar a un menor poder estadístico. La colocación de espirales endovasculares se asoció con una reducción en la mortalidad al año, a los cinco años y a los diez años, aunque la diferencia al año no fue estadísticamente significativa. Los participantes del grupo de espirales endovasculares presentaron un riesgo mayor de nuevas hemorragias luego del procedimiento al año, a los cinco años y a los diez años. El riesgo de ICR a los dos a tres meses fue inferior en los participantes del grupo de espirales endovasculares.
Compleción y aplicabilidad general de las pruebas
Esta revisión representa los resultados de un ensayo grande y tres ensayos mucho más pequeños. Los resultados dependieron en gran parte del ensayo más grande (ISAT 2002), que se interrumpió de forma prematura sobre la base de un análisis provisorio, debido a que los resultados se ponderaron para el número de participantes y eventos de cada ensayo. Sin embargo, los resultados de los ensayos más pequeños tuvieron la misma dirección para la medida de resultado primaria y no hubo evidencia de heterogeneidad en los análisis.
Los grupos de intervención en los cuatro ensayos incluidos se equilibraron bien con respecto a las características iniciales. El tratamiento peri y post procedimiento probablemente sea similar entre las dos estrategias de tratamiento, salvo el uso de los inhibidores de agregación plaquetaria. A menudo, después de la colocación de espirales en los aneurismas se prescribe aspirina. En una revisión sistemática, el tratamiento antiplaquetario redujo la aparición de ICR y tendió a mejorar el resultado general (Dorhout Mees 2003). Un estudio de 19 centros que representaban a 1422 participantes (66%) en el ensayo ISAT encontró que sólo dos de los centros (8% de los participantes sometidos a la colocación de espirales) prescribieron de forma sistemática fármacos antiplaquetarios durante la colocación de los espirales y seis centros (24% de los participantes sometidos a la colocación de espirales) lo hicieron después de la colocación de los espirales. No hubo evidencia de que los antiplaquetarios durante o después de la colocación de espirales endovasculares mejoraran el resultado (van den Bergh 2009).
La intención fue realizar un análisis de subgrupos de los pacientes con rotura de un aneurisma de la arteria basilar. Sin embargo, no hubo información específica disponible sobre las principales medidas de resultado para este subgrupo de pacientes. En el análisis de subgrupos de todos los aneurismas de la circulación posterior, el riesgo relativo de un resultado deficiente mostró una tendencia hacia la disminución con la colocación de espirales endovasculares, pero no fue estadísticamente significativa.
Otro tipo de pacientes con una baja representación en los ensayos incluidos fueron los pacientes con aneurismas de la arteria cerebral media (ACM). Estos aneurismas a menudo se consideraron no apropiados para la colocación de espirales endovasculares cuando los ensayos incluidos reclutaron a los participantes. El número total de pacientes con aneurismas de la ACM todavía fue considerable y los resultados en los pacientes con aneurismas de la ACM tuvieron la misma dirección que en los pacientes con aneurismas en otros sitios. Por lo tanto, parece razonable suponer que los resultados de esta revisión también son válidos para los pacientes con aneurismas de ACM y cuya anatomía fue adecuada para el tratamiento endovascular o quirúrgico. Los pacientes con condiciones clínicas deficientes también estuvieron subrepresentados en los ensayos, debido a que los tres ensayos sólo incluyeron a participantes en los que las condiciones clínicas justificaban el tratamiento del aneurisma y cuando se obtuvo el consentimiento informado, que es más difícil en los pacientes en condiciones clínicas deficientes. Debido a que las condiciones clínicas deficientes en el momento del ingreso es una variable predictiva importante para el resultado deficiente, los resultados de esta revisión no se pueden aplicar directamente a los pacientes con condiciones clínicas deficientes en el ingreso.
La reperfusión espontánea tardía del aneurisma puede dar lugar a una protección insuficiente contra las hemorragias recurrentes en el futuro. Una desventaja con respecto a la colocación de espirales endovasculares es que los aneurismas se tratan con mayor frecuencia de manera incompleta (obliteración del 90% a 100%) y conllevan un riesgo de reapertura mayor que en el caso de los aneurismas tratados con clips. El riesgo mayor de una nueva hemorragia a los cinco y diez años en los participantes asignados al azar al tratamiento endovascular en ISAT indica que los aneurismas sometidos a la colocación de espirales son más susceptibles a una nueva hemorragia que los sometidos a la colocación de clips. La relevancia clínica de esta nueva abertura tardía no está clara debido a la nueva formación de aneurismas en ubicaciones diferentes del sitio del aneurisma original. En estudios de seguimiento de pacientes tratados por un aneurisma, la tasa de desarrollo de nuevos aneurismas varió del 0,2% al 2% por año (David 1999; Juvela 1993; Juvela 2001; Lindgren 2016; Tsutsumi 2001; Wermer 2005a). Las HSA que se presentan a causa de estos nuevos aneurismas pueden sobrepasar a las que se deben a aneurismas que se vuelven a abrir (Wermer 2005b).
Además, desde la versión anterior de esta revisión (van der Schaaf 2005), la colocación de espirales endovasculares se ha convertido en la primera opción de tratamiento oclusivo a considerar en la mayoría de los centros que tratan la HSA por aneurisma. Actualmente, la colocación de espirales endovasculares no sólo la realizan radiólogos, sino también neurocirujanos y neurólogos. Lo anterior puede haber dado lugar a que médicos con menos experiencia realicen la colocación de espirales endovasculares en ámbitos hospitalarios con menos experiencia. De hecho un estudio mostró diferencias en las tasas de complicaciones según el tipo de médico que realizaba el procedimiento(Fennell 2016). El desarrollo técnico también ha dado lugar a la disponibilidad de nuevos tratamientos endovasculares, además de la colocación de espirales endovasculares, como las cánulas que desvían el flujo (Ding 2011) y los dispositivos WEB (Wowen EndoBridge) (Çinar 2013), pero no hay ensayos aleatorios que comparen estas formas de tratamiento con los clips neuroquirúrgicos para la rotura de aneurismas intracraneales.
Calidad de la evidencia
Se analizaron los datos de cuatro ensayos que incluyeron a 2458 participantes asignados al azar: 1229 en el grupo de colocación de espirales endovasculares y 1229 en el grupo de clips neuroquirúrgicos. Los ensayos incluidos se realizaron entre 1994 y 2009. Se consideró que todos los ensayos tenían al menos un dominio con riesgo de sesgo incierto y en un estudio el riesgo de sesgo de detección fue alto (Figura 2; Figura 3). Sin embargo, no se detectó heterogeneidad importante entre los resultados de los estudios. No fue posible evaluar el sesgo de publicación debido al número reducido de ensayos incluidos. Aunque puede existir sesgo de publicación, es poco probable que exista un estudio controlado aleatorio grande no publicado que pudiese modificar los resultados. La evidencia se basó principalmente en el ensayo incluido más grande y el seguimiento a largo plazo estuvo disponible sólo para un subgrupo de participantes dentro de dicho ensayo. Por lo tanto, se consideró que la evidencia de los resultados con un seguimiento a largo plazo (resultado deficiente, nuevas hemorragias) fue de baja calidad. La evidencia de los resultados con un seguimiento a corto plazo/medio plazo se consideró de calidad moderada (resultado deficiente, muerte por cualquier causa, ICR) o alta (nuevas hemorragias).
Sesgos potenciales en el proceso de revisión
Dos autores de la revisión realizaron la selección de estudios, la extracción de datos y la evaluación de la calidad, de forma independiente, para reducir el sesgo y la subjetividad. Se intentó identificar todos los ECA de relevancia potencial para la revisión. No se realizó un análisis del gráfico en embudo (funnel plot), debido a que sólo se identificaron cuatro ECA elegibles.
Acuerdos y desacuerdos con otros estudios o revisiones
Se identificaron otras revisiones sistemáticas sobre este tema que incluyeron sólo ensayos prospectivos (Lanzino 2013) o ensayos prospectivos combinados con estudios no aleatorios (Falk Delgado 2017; Fotakopoulos 2017; Li 2013; Xia 2017). Una revisión de ensayos prospectivos encontró que el riesgo de un resultado deficiente al año después de la colocación de espirales endovasculares y clips por la rotura de un aneurisma fue inferior después de la colocación de espirales endovasculares (CR 0,75; IC del 95%: 0,65 a 0,87) (Lanzino 2013), lo que coincide con los resultados de la presente revisión. Otra revisión encontró que el riesgo de un resultado deficiente fue mayor después de la colocación de clips (odds ratio [OR] 1,25; IC del 95%: 1,12 a 1,40), pero no hubo diferencias en la mortalidad (OR 1,07; IC del 95%: 0,88 a 1,30). El riesgo de una nueva hemorragia fue inferior después de la colocación de clips (OR 0,43; IC del 95%: 0,28 a 0,66) (Li 2013). Una revisión que comparó la colocación de clips versus espirales endovasculares en pacientes con rotura de aneurismas de la circulación anterior no encontró diferencias en cuanto a la mortalidad operatoria (OR 0,80; IC del 95%: 0,31 a 2,08), el déficit neurológico permanente (OR 1,42; IC del 95%: 0,85 a 2,39), la mortalidad tardía (OR 0,97; IC del 95%: 0,42 a 2,25) ni la necesidad de una nueva intervención (OR 0,86; IC del 95%: 0,25 a 2,95) (Fotakopoulos 2017). Los resultados de una revisión que comparó las tasas del resultado independiente en los pacientes con rotura de un aneurisma tratado con colocación de espirales o clips estuvieron a favor de los espirales después del seguimiento a medio plazo (OR 0,80; IC del 95%: 0,68 a 0,94; OR menor que 1 a favor de la colocación de espirales) y a largo plazo (OR 0,81; IC del 95%: 0,71 a 0,93; OR menor que 1 a favor de la colocación de espirales) (Falk Delgado 2017). Una revisión que se centró en los pacientes con HSA de grado alto encontró que la colocación de espirales se asoció con una mortalidad mayor (OR 0,55; IC del 95%: 0,41 a 0,75; OR menor que 1 a favor de los espirales), pero no encontró diferencias en las tasas de complicaciones que incluyeron una nueva hemorragia (OR 0,62; IC del 95%: 0,30 a 1,29), infarto isquémico (OR 0,76; IC del 95%: 0,45 a 1,29), hidrocefalia dependiente de la anastomosis (OR 1,33; IC del 95%: 0,52 a 3,40) o un buen resultado (OR 1,44; IC del 95%: 0,95 a 2,36) (Xia 2017). Las diferencias en comparación con los resultados de la presente revisión probablemente se debieron a la inclusión de datos no aleatorios y a la restricción de los análisis a subgrupos de participantes.
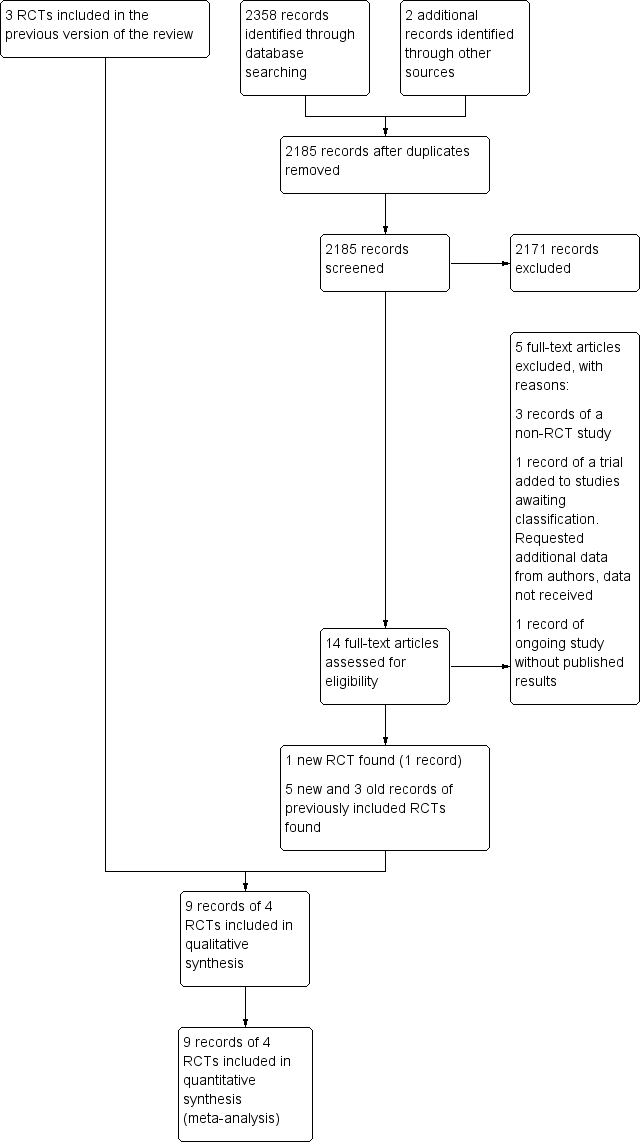
Study flow diagram. RCT: randomised controlled trial.
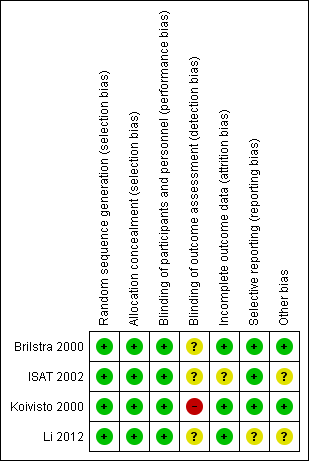
Risk of bias summary: review authors' judgements about each risk of bias item for each included study.
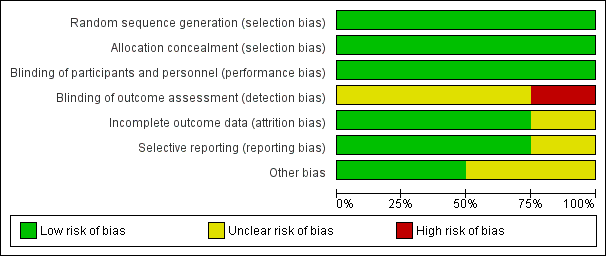
Risk of bias graph: review authors' judgements about each risk of bias item presented as percentages across all included studies.
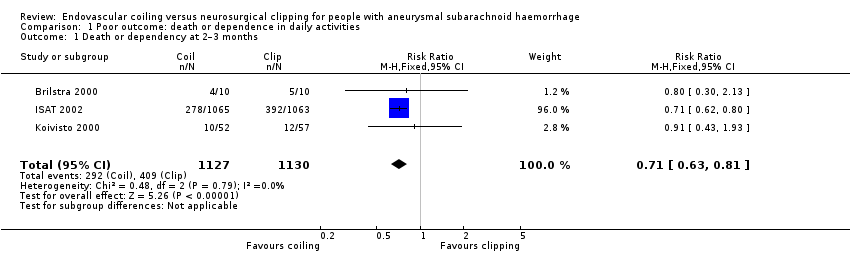
Comparison 1 Poor outcome: death or dependence in daily activities, Outcome 1 Death or dependency at 2–3 months.
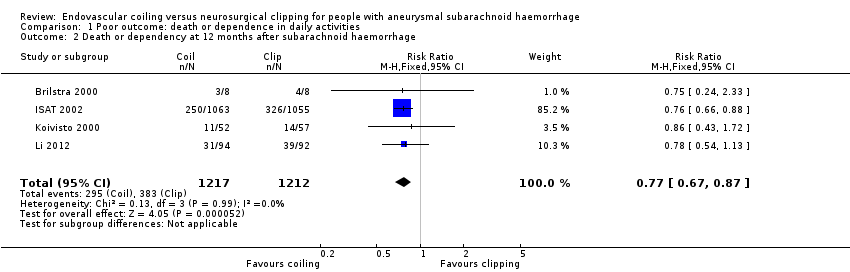
Comparison 1 Poor outcome: death or dependence in daily activities, Outcome 2 Death or dependency at 12 months after subarachnoid haemorrhage.
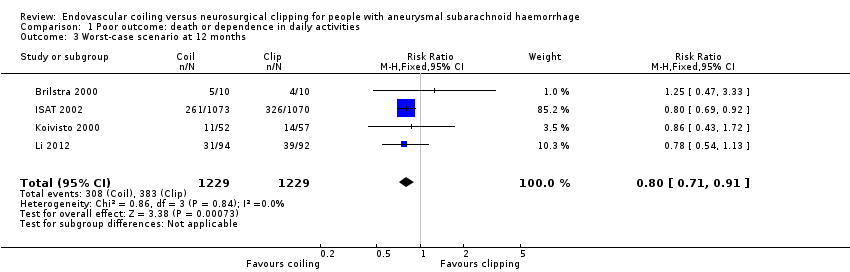
Comparison 1 Poor outcome: death or dependence in daily activities, Outcome 3 Worst‐case scenario at 12 months.

Comparison 1 Poor outcome: death or dependence in daily activities, Outcome 4 Death or dependency at 5 years.
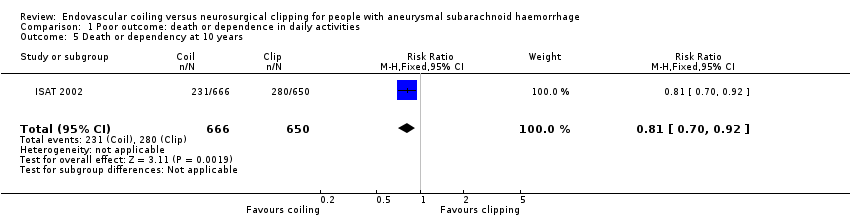
Comparison 1 Poor outcome: death or dependence in daily activities, Outcome 5 Death or dependency at 10 years.

Comparison 2 Death from any cause, Outcome 1 Death from any cause 2–3 months.

Comparison 2 Death from any cause, Outcome 2 Death from any cause between randomisation and 1 year after SAH.

Comparison 2 Death from any cause, Outcome 3 Death from any cause up to 5 years.

Comparison 2 Death from any cause, Outcome 4 Death from any cause up to 10 years.
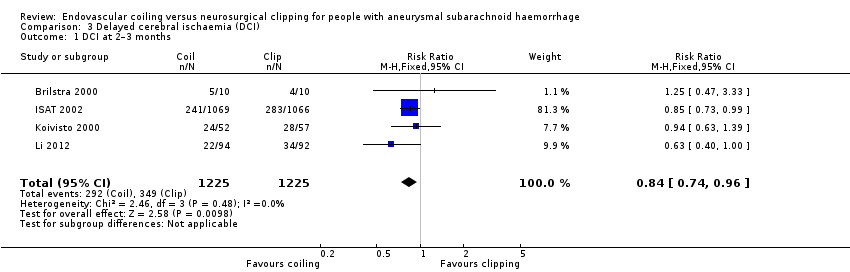
Comparison 3 Delayed cerebral ischaemia (DCI), Outcome 1 DCI at 2–3 months.

Comparison 4 Rebleeding, Outcome 1 Rebleed before treatment.
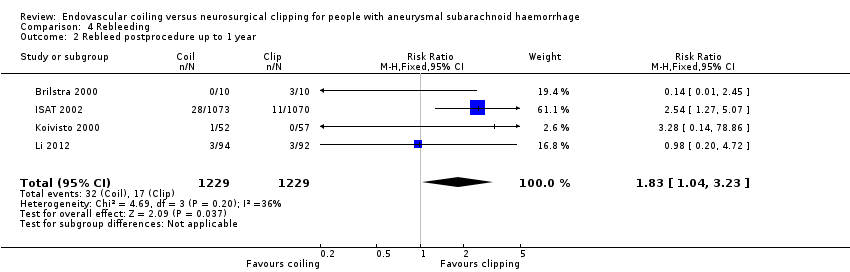
Comparison 4 Rebleeding, Outcome 2 Rebleed postprocedure up to 1 year.
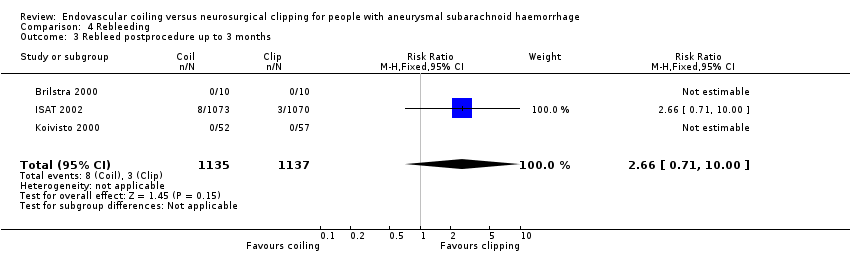
Comparison 4 Rebleeding, Outcome 3 Rebleed postprocedure up to 3 months.

Comparison 4 Rebleeding, Outcome 4 Rebleed postprocedure up to 5 years.
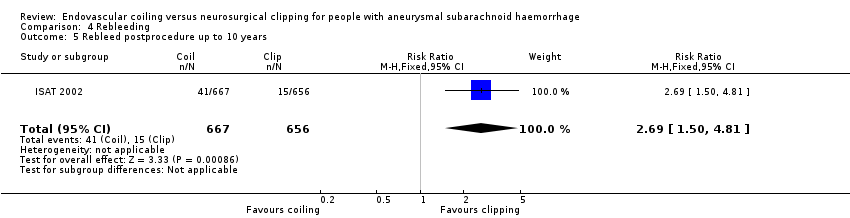
Comparison 4 Rebleeding, Outcome 5 Rebleed postprocedure up to 10 years.

Comparison 5 Complications from intervention, Outcome 1 Complications from intervention.
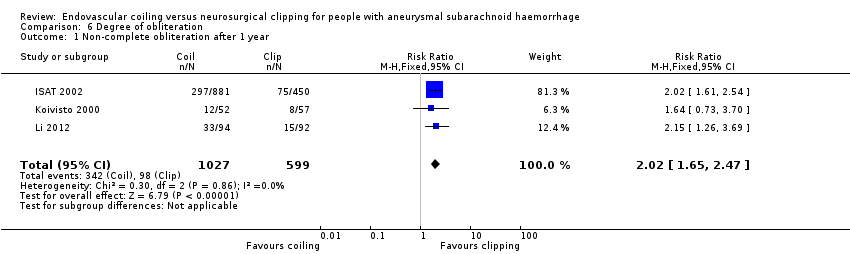
Comparison 6 Degree of obliteration, Outcome 1 Non‐complete obliteration after 1 year.

Comparison 6 Degree of obliteration, Outcome 2 < 90% occlusion after 1 year.

Comparison 7 Subgroup analysis: aneurysm location, Outcome 1 Poor outcome at 12 months: posterior and anterior circulation.
| Endovascular coiling compared with neurosurgical clipping for subarachnoid haemorrhage | ||||||
| Patient or population: people with subarachnoid haemorrhage from a ruptured intracranial aneurysm Settings: tertiary care Intervention: endovascular coiling of aneurysm Comparison: neurosurgical clipping of aneurysm | ||||||
| Outcomes | Illustrative comparative risks* (95% CI) | Relative effect | No of participants | Quality of the evidence | Comments | |
| Assumed risk | Corresponding risk | |||||
| Neurosurgical clipping | Endovascular coiling | |||||
| Poor outcome: death or dependence in daily activities (12 months) | Study population | RR 0.77 (0.67 to 0.87) | 2429 | ⊕⊕⊕⊝ | — | |
| 366 per 1000 | 281 per 1000 | |||||
| Poor outcome (death or dependence) (10 years) | Study population | RR 0.81 (0.70 to 0.92) | 1316 | ⊕⊕⊝⊝a,b | Based on subgroup of participants in 1 large RCT only | |
| 430 per 1000 | 348 per 1000 | |||||
| Death from any cause (12 months) | Study population | RR 0.80 (0.63 to 1.02) | 2429 | ⊕⊕⊕⊝ | — | |
| 154 per 1000 | 123 per 1000 | |||||
| Delayed cerebral ischaemia (2–3 months) | Study population | RR 0.84 (0.74 to 0.96) | 2450 (4 RCTs) | ⊕⊕⊕⊝ | — | |
| 384 per 1000 | 322 per 1000 | |||||
| Rebleeding postprocedure up to 1 year | Study population | RR 1.83 (1.04 to 3.23) | 2458 (4 RCTs) | ⊕⊕⊕⊕ | — | |
| 21 per 1000 | 38 per 1000 (21 to 67) | |||||
| Rebleeding postprocedure up to 10 years | Study population | RR 2.69 (1.50 to 4.81) | 1323 (1 RCT) | ⊕⊕⊝⊝a,b | Based on 1 large RCT only | |
| 22 per 1000 | 61 per 1000 | |||||
| Complications from the intervention | Study population | RR 1.05 (0.44 to 2.53) | 129 (2 RCTs) | ⊕⊕⊝⊝c | Based on 2 small RCTs only | |
| 235 per 1000 | 246 per 1000 (103 to 594) | |||||
| *The basis for the assumed risk (e.g. the median control group risk across studies) is derived from the studies included in the meta‐analysis. The corresponding risk (and its 95% confidence interval) is based on the assumed risk in the comparison group and the relative effect of the intervention (and its 95% CI). CI: confidence interval; RCT: randomised controlled trial; RR: risk ratio. | ||||||
| GRADE Working Group grades of evidence | ||||||
| aDowngraded one level due to indirectness of evidence: participants in poor condition on admission under‐represented in the largest RCT. bDowngraded one level due to risk of bias: long‐term outcome data available for only a subgroup of participants. cDowngraded two levels due to risk of bias: underpowered due to data availability from only two small trials, unclear definition of complication from intervention. | ||||||
| Number of participants per treatment | Extent of occlusion | ||
| 100% | 90% to 100% | < 90% | |
| Endovascular coiling: 881 | 584 (66%) | 228 (26%) | 69 (8%) |
| Neurosurgical clipping: 450 | 370 (82%) | 55 (12%) | 25 (6%) |
| Endovascular coiling: 52 | 40 (77%) | 10 (19%) | 2 (4%) |
| Neurosurgical clipping: 57 | 49 (86%) | 7 (12%) | 1 (2%) |
| Total | |||
| Endovascular coiling: 933 | 624 (67%) | 238 (26%) | 71 (8%) |
| Neurosurgical clipping: 507 | 419 (83%) | 62 (12%) | 26 (5%) |
| Outcome or subgroup title | No. of studies | No. of participants | Statistical method | Effect size |
| 1 Death or dependency at 2–3 months Show forest plot | 3 | 2257 | Risk Ratio (M‐H, Fixed, 95% CI) | 0.71 [0.63, 0.81] |
| 2 Death or dependency at 12 months after subarachnoid haemorrhage Show forest plot | 4 | 2429 | Risk Ratio (M‐H, Fixed, 95% CI) | 0.77 [0.67, 0.87] |
| 3 Worst‐case scenario at 12 months Show forest plot | 4 | 2458 | Risk Ratio (M‐H, Fixed, 95% CI) | 0.80 [0.71, 0.91] |
| 4 Death or dependency at 5 years Show forest plot | 1 | 1724 | Risk Ratio (M‐H, Fixed, 95% CI) | 0.87 [0.75, 1.01] |
| 5 Death or dependency at 10 years Show forest plot | 1 | 1316 | Risk Ratio (M‐H, Fixed, 95% CI) | 0.81 [0.70, 0.92] |
| Outcome or subgroup title | No. of studies | No. of participants | Statistical method | Effect size |
| 1 Death from any cause 2–3 months Show forest plot | 3 | 2257 | Risk Ratio (M‐H, Fixed, 95% CI) | 0.88 [0.66, 1.18] |
| 2 Death from any cause between randomisation and 1 year after SAH Show forest plot | 4 | 2429 | Risk Ratio (M‐H, Fixed, 95% CI) | 0.80 [0.63, 1.02] |
| 3 Death from any cause up to 5 years Show forest plot | 1 | 2087 | Risk Ratio (M‐H, Fixed, 95% CI) | 0.77 [0.61, 0.98] |
| 4 Death from any cause up to 10 years Show forest plot | 1 | 1644 | Risk Ratio (M‐H, Fixed, 95% CI) | 0.78 [0.64, 0.96] |
| Outcome or subgroup title | No. of studies | No. of participants | Statistical method | Effect size |
| 1 DCI at 2–3 months Show forest plot | 4 | 2450 | Risk Ratio (M‐H, Fixed, 95% CI) | 0.84 [0.74, 0.96] |
| Outcome or subgroup title | No. of studies | No. of participants | Statistical method | Effect size |
| 1 Rebleed before treatment Show forest plot | 3 | 2272 | Risk Ratio (M‐H, Fixed, 95% CI) | 0.64 [0.37, 1.12] |
| 2 Rebleed postprocedure up to 1 year Show forest plot | 4 | 2458 | Risk Ratio (M‐H, Fixed, 95% CI) | 1.83 [1.04, 3.23] |
| 3 Rebleed postprocedure up to 3 months Show forest plot | 3 | 2272 | Risk Ratio (M‐H, Fixed, 95% CI) | 2.66 [0.71, 10.00] |
| 4 Rebleed postprocedure up to 5 years Show forest plot | 1 | 1448 | Risk Ratio (M‐H, Fixed, 95% CI) | 2.75 [1.51, 5.02] |
| 5 Rebleed postprocedure up to 10 years Show forest plot | 1 | 1323 | Risk Ratio (M‐H, Fixed, 95% CI) | 2.69 [1.50, 4.81] |
| Outcome or subgroup title | No. of studies | No. of participants | Statistical method | Effect size |
| 1 Complications from intervention Show forest plot | 2 | 129 | Risk Ratio (M‐H, Fixed, 95% CI) | 1.05 [0.44, 2.53] |
| Outcome or subgroup title | No. of studies | No. of participants | Statistical method | Effect size |
| 1 Non‐complete obliteration after 1 year Show forest plot | 3 | 1626 | Risk Ratio (M‐H, Fixed, 95% CI) | 2.02 [1.65, 2.47] |
| 2 < 90% occlusion after 1 year Show forest plot | 2 | 1440 | Risk Ratio (M‐H, Fixed, 95% CI) | 1.43 [0.93, 2.21] |
| Outcome or subgroup title | No. of studies | No. of participants | Statistical method | Effect size |
| 1 Poor outcome at 12 months: posterior and anterior circulation Show forest plot | 2 | 2226 | Risk Ratio (M‐H, Fixed, 95% CI) | 0.76 [0.66, 0.88] |
| 1.1 Poor outcome at 12 months: posterior circulation | 2 | 69 | Risk Ratio (M‐H, Fixed, 95% CI) | 0.41 [0.19, 0.92] |
| 1.2 Poor outcome at 12 months: anterior circulation | 2 | 2157 | Risk Ratio (M‐H, Fixed, 95% CI) | 0.78 [0.68, 0.90] |