Endovascular coiling versus neurosurgical clipping for people with aneurysmal subarachnoid haemorrhage
Information
- DOI:
- https://doi.org/10.1002/14651858.CD003085.pub3Copy DOI

- Database:
-
- Cochrane Database of Systematic Reviews
- Version published:
-
- 15 August 2018see what's new
- Type:
-
- Intervention
- Stage:
-
- Review
- Cochrane Editorial Group:
-
Cochrane Stroke Group
- Copyright:
-
- Copyright © 2018 The Cochrane Collaboration. Published by John Wiley & Sons, Ltd.
Article metrics
Altmetric:
Cited by:
Authors
Contributions of authors
AL: extracted data from the studies included in the review; appraised the quality of studies; analysed and interpreted data; and wrote the updated version of the review.
MDIV: extracted data from the studies included in the review; appraised the quality of studies; analysed and interpreted data; and revised the updated version of the review.
IvdS: extracted data from the studies included in the review; prepared the analysis; and wrote the first drafts of the review.
AA: participated in writing the grant application; developed the protocol; appraised the quality of studies; analysed and interpreted data; and participated in writing the review.
MW: participated in writing the review.
MJC: participated in revising the text of the review.
GJER: participated in developing the protocol; extracted data; appraised the quality of studies; analysed and interpreted data; wrote the review and entered the review into Review Manager 5. Dr Rinkel is the guarantor for this review.
Declarations of interest
AL: none known.
MDIV: none known.
IvdS: none known.
AA: none known.
MW: none known.
MJC: was on the Executive Committee for ISAT, but was not involved in decisions about the eligibility or quality of ISAT for this review.
GJER: none known.
Acknowledgements
We thank Drs EH Brilstra and WJJ van Rooij for their contributions to the development of the protocol for this review.
Version history
| Published | Title | Stage | Authors | Version |
| 2018 Aug 15 | Endovascular coiling versus neurosurgical clipping for people with aneurysmal subarachnoid haemorrhage | Review | Antti Lindgren, Mervyn DI Vergouwen, Irene van der Schaaf, Ale Algra, Marieke Wermer, Mike J Clarke, Gabriel JE Rinkel | |
| 2005 Oct 19 | Endovascular coiling versus neurosurgical clipping for patients with aneurysmal subarachnoid haemorrhage | Review | Irene van der Schaaf, Ale Algra, Marieke Wermer, Andrew Molyneux, Mike J Clarke, Jan van Gijn, Gabriel JE Rinkel | |
| 2001 Jan 22 | Endovascular coiling versus neurosurgical clipping for patients with aneurysmal subarachnoid haemorrhage | Protocol | Ale Algra, Eva Brilstra, Mike Clarke, Jan van Gijn, Andrew Molyneux, Gabriel JE Rinkel, WJJ van Rooij | |
Keywords
MeSH
Medical Subject Headings (MeSH) Keywords
- *Stents;
- Aneurysm, Ruptured [mortality, surgery, *therapy];
- Brain Ischemia [epidemiology, etiology];
- Embolization, Therapeutic;
- Endovascular Procedures [*methods];
- Intracranial Aneurysm [mortality, surgery, *therapy];
- Neurosurgical Procedures [adverse effects, methods];
- Postoperative Complications [epidemiology, etiology];
- Randomized Controlled Trials as Topic;
- Recurrence;
- Secondary Prevention [methods];
- Subarachnoid Hemorrhage [mortality, surgery, *therapy];
- Treatment Outcome;
Medical Subject Headings Check Words
Humans;
PICOs
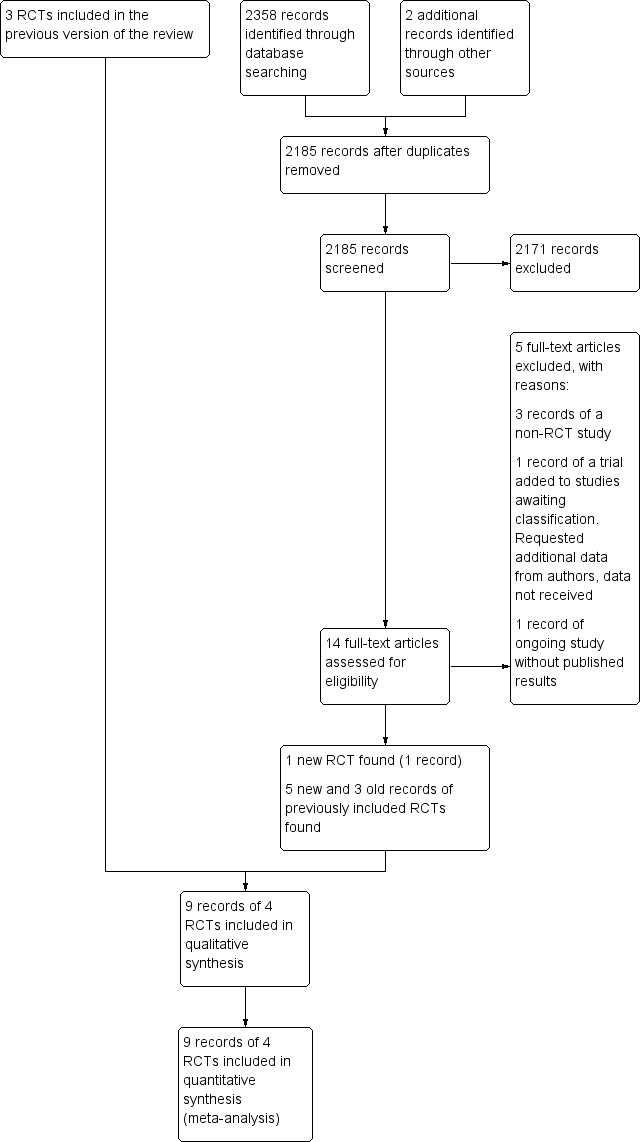
Study flow diagram. RCT: randomised controlled trial.
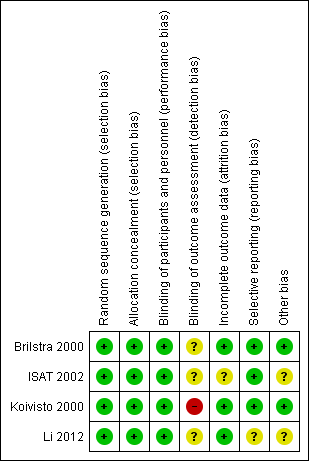
Risk of bias summary: review authors' judgements about each risk of bias item for each included study.
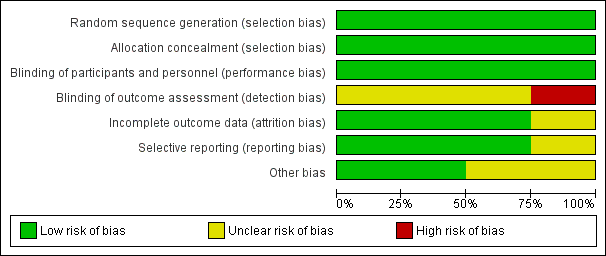
Risk of bias graph: review authors' judgements about each risk of bias item presented as percentages across all included studies.

Comparison 1 Poor outcome: death or dependence in daily activities, Outcome 1 Death or dependency at 2–3 months.

Comparison 1 Poor outcome: death or dependence in daily activities, Outcome 2 Death or dependency at 12 months after subarachnoid haemorrhage.

Comparison 1 Poor outcome: death or dependence in daily activities, Outcome 3 Worst‐case scenario at 12 months.

Comparison 1 Poor outcome: death or dependence in daily activities, Outcome 4 Death or dependency at 5 years.

Comparison 1 Poor outcome: death or dependence in daily activities, Outcome 5 Death or dependency at 10 years.

Comparison 2 Death from any cause, Outcome 1 Death from any cause 2–3 months.

Comparison 2 Death from any cause, Outcome 2 Death from any cause between randomisation and 1 year after SAH.

Comparison 2 Death from any cause, Outcome 3 Death from any cause up to 5 years.

Comparison 2 Death from any cause, Outcome 4 Death from any cause up to 10 years.

Comparison 3 Delayed cerebral ischaemia (DCI), Outcome 1 DCI at 2–3 months.

Comparison 4 Rebleeding, Outcome 1 Rebleed before treatment.

Comparison 4 Rebleeding, Outcome 2 Rebleed postprocedure up to 1 year.

Comparison 4 Rebleeding, Outcome 3 Rebleed postprocedure up to 3 months.

Comparison 4 Rebleeding, Outcome 4 Rebleed postprocedure up to 5 years.

Comparison 4 Rebleeding, Outcome 5 Rebleed postprocedure up to 10 years.

Comparison 5 Complications from intervention, Outcome 1 Complications from intervention.

Comparison 6 Degree of obliteration, Outcome 1 Non‐complete obliteration after 1 year.

Comparison 6 Degree of obliteration, Outcome 2 < 90% occlusion after 1 year.

Comparison 7 Subgroup analysis: aneurysm location, Outcome 1 Poor outcome at 12 months: posterior and anterior circulation.
| Endovascular coiling compared with neurosurgical clipping for subarachnoid haemorrhage | ||||||
| Patient or population: people with subarachnoid haemorrhage from a ruptured intracranial aneurysm Settings: tertiary care Intervention: endovascular coiling of aneurysm Comparison: neurosurgical clipping of aneurysm | ||||||
| Outcomes | Illustrative comparative risks* (95% CI) | Relative effect | No of participants | Quality of the evidence | Comments | |
| Assumed risk | Corresponding risk | |||||
| Neurosurgical clipping | Endovascular coiling | |||||
| Poor outcome: death or dependence in daily activities (12 months) | Study population | RR 0.77 (0.67 to 0.87) | 2429 | ⊕⊕⊕⊝ | — | |
| 366 per 1000 | 281 per 1000 | |||||
| Poor outcome (death or dependence) (10 years) | Study population | RR 0.81 (0.70 to 0.92) | 1316 | ⊕⊕⊝⊝a,b | Based on subgroup of participants in 1 large RCT only | |
| 430 per 1000 | 348 per 1000 | |||||
| Death from any cause (12 months) | Study population | RR 0.80 (0.63 to 1.02) | 2429 | ⊕⊕⊕⊝ | — | |
| 154 per 1000 | 123 per 1000 | |||||
| Delayed cerebral ischaemia (2–3 months) | Study population | RR 0.84 (0.74 to 0.96) | 2450 (4 RCTs) | ⊕⊕⊕⊝ | — | |
| 384 per 1000 | 322 per 1000 | |||||
| Rebleeding postprocedure up to 1 year | Study population | RR 1.83 (1.04 to 3.23) | 2458 (4 RCTs) | ⊕⊕⊕⊕ | — | |
| 21 per 1000 | 38 per 1000 (21 to 67) | |||||
| Rebleeding postprocedure up to 10 years | Study population | RR 2.69 (1.50 to 4.81) | 1323 (1 RCT) | ⊕⊕⊝⊝a,b | Based on 1 large RCT only | |
| 22 per 1000 | 61 per 1000 | |||||
| Complications from the intervention | Study population | RR 1.05 (0.44 to 2.53) | 129 (2 RCTs) | ⊕⊕⊝⊝c | Based on 2 small RCTs only | |
| 235 per 1000 | 246 per 1000 (103 to 594) | |||||
| *The basis for the assumed risk (e.g. the median control group risk across studies) is derived from the studies included in the meta‐analysis. The corresponding risk (and its 95% confidence interval) is based on the assumed risk in the comparison group and the relative effect of the intervention (and its 95% CI). CI: confidence interval; RCT: randomised controlled trial; RR: risk ratio. | ||||||
| GRADE Working Group grades of evidence | ||||||
| aDowngraded one level due to indirectness of evidence: participants in poor condition on admission under‐represented in the largest RCT. bDowngraded one level due to risk of bias: long‐term outcome data available for only a subgroup of participants. cDowngraded two levels due to risk of bias: underpowered due to data availability from only two small trials, unclear definition of complication from intervention. | ||||||
| Number of participants per treatment | Extent of occlusion | ||
| 100% | 90% to 100% | < 90% | |
| Endovascular coiling: 881 | 584 (66%) | 228 (26%) | 69 (8%) |
| Neurosurgical clipping: 450 | 370 (82%) | 55 (12%) | 25 (6%) |
| Endovascular coiling: 52 | 40 (77%) | 10 (19%) | 2 (4%) |
| Neurosurgical clipping: 57 | 49 (86%) | 7 (12%) | 1 (2%) |
| Total | |||
| Endovascular coiling: 933 | 624 (67%) | 238 (26%) | 71 (8%) |
| Neurosurgical clipping: 507 | 419 (83%) | 62 (12%) | 26 (5%) |
| Outcome or subgroup title | No. of studies | No. of participants | Statistical method | Effect size |
| 1 Death or dependency at 2–3 months Show forest plot | 3 | 2257 | Risk Ratio (M‐H, Fixed, 95% CI) | 0.71 [0.63, 0.81] |
| 2 Death or dependency at 12 months after subarachnoid haemorrhage Show forest plot | 4 | 2429 | Risk Ratio (M‐H, Fixed, 95% CI) | 0.77 [0.67, 0.87] |
| 3 Worst‐case scenario at 12 months Show forest plot | 4 | 2458 | Risk Ratio (M‐H, Fixed, 95% CI) | 0.80 [0.71, 0.91] |
| 4 Death or dependency at 5 years Show forest plot | 1 | 1724 | Risk Ratio (M‐H, Fixed, 95% CI) | 0.87 [0.75, 1.01] |
| 5 Death or dependency at 10 years Show forest plot | 1 | 1316 | Risk Ratio (M‐H, Fixed, 95% CI) | 0.81 [0.70, 0.92] |
| Outcome or subgroup title | No. of studies | No. of participants | Statistical method | Effect size |
| 1 Death from any cause 2–3 months Show forest plot | 3 | 2257 | Risk Ratio (M‐H, Fixed, 95% CI) | 0.88 [0.66, 1.18] |
| 2 Death from any cause between randomisation and 1 year after SAH Show forest plot | 4 | 2429 | Risk Ratio (M‐H, Fixed, 95% CI) | 0.80 [0.63, 1.02] |
| 3 Death from any cause up to 5 years Show forest plot | 1 | 2087 | Risk Ratio (M‐H, Fixed, 95% CI) | 0.77 [0.61, 0.98] |
| 4 Death from any cause up to 10 years Show forest plot | 1 | 1644 | Risk Ratio (M‐H, Fixed, 95% CI) | 0.78 [0.64, 0.96] |
| Outcome or subgroup title | No. of studies | No. of participants | Statistical method | Effect size |
| 1 DCI at 2–3 months Show forest plot | 4 | 2450 | Risk Ratio (M‐H, Fixed, 95% CI) | 0.84 [0.74, 0.96] |
| Outcome or subgroup title | No. of studies | No. of participants | Statistical method | Effect size |
| 1 Rebleed before treatment Show forest plot | 3 | 2272 | Risk Ratio (M‐H, Fixed, 95% CI) | 0.64 [0.37, 1.12] |
| 2 Rebleed postprocedure up to 1 year Show forest plot | 4 | 2458 | Risk Ratio (M‐H, Fixed, 95% CI) | 1.83 [1.04, 3.23] |
| 3 Rebleed postprocedure up to 3 months Show forest plot | 3 | 2272 | Risk Ratio (M‐H, Fixed, 95% CI) | 2.66 [0.71, 10.00] |
| 4 Rebleed postprocedure up to 5 years Show forest plot | 1 | 1448 | Risk Ratio (M‐H, Fixed, 95% CI) | 2.75 [1.51, 5.02] |
| 5 Rebleed postprocedure up to 10 years Show forest plot | 1 | 1323 | Risk Ratio (M‐H, Fixed, 95% CI) | 2.69 [1.50, 4.81] |
| Outcome or subgroup title | No. of studies | No. of participants | Statistical method | Effect size |
| 1 Complications from intervention Show forest plot | 2 | 129 | Risk Ratio (M‐H, Fixed, 95% CI) | 1.05 [0.44, 2.53] |
| Outcome or subgroup title | No. of studies | No. of participants | Statistical method | Effect size |
| 1 Non‐complete obliteration after 1 year Show forest plot | 3 | 1626 | Risk Ratio (M‐H, Fixed, 95% CI) | 2.02 [1.65, 2.47] |
| 2 < 90% occlusion after 1 year Show forest plot | 2 | 1440 | Risk Ratio (M‐H, Fixed, 95% CI) | 1.43 [0.93, 2.21] |
| Outcome or subgroup title | No. of studies | No. of participants | Statistical method | Effect size |
| 1 Poor outcome at 12 months: posterior and anterior circulation Show forest plot | 2 | 2226 | Risk Ratio (M‐H, Fixed, 95% CI) | 0.76 [0.66, 0.88] |
| 1.1 Poor outcome at 12 months: posterior circulation | 2 | 69 | Risk Ratio (M‐H, Fixed, 95% CI) | 0.41 [0.19, 0.92] |
| 1.2 Poor outcome at 12 months: anterior circulation | 2 | 2157 | Risk Ratio (M‐H, Fixed, 95% CI) | 0.78 [0.68, 0.90] |