Formula versus donor breast milk for feeding preterm or low birth weight infants
Referencias
References to studies included in this review
References to studies excluded from this review
References to ongoing studies
Additional references
References to other published versions of this review
Characteristics of studies
Characteristics of included studies [ordered by study ID]
| Methods | Randomised controlled trial | |
| Participants | 53 newborn infants: birth weight 500 ‐ 1250 g (Probably) 2010‐12 | |
| Interventions | Preterm formula milk (N = 24) versus fortified (with human milk‐based fortifier), pasteurised donor breast milk (N = 29). Assigned until 91 days after birth, or discharge, or oral feeding at least 50% of feeds. | |
| Outcomes | Duration of parenteral nutrition, growth, respiratory support, and NEC | |
| Notes | Additional information on methods courtesy of Dr Cristafalo (April 2014) | |
| Risk of bias | ||
| Bias | Authors' judgement | Support for judgement |
| Random sequence generation (selection bias) | Low risk | Random sequence generated centrally in permuted blocks stratified by investigational site |
| Allocation concealment (selection bias) | Low risk | Allocation outcome provided to an individual at each site who was not connected with the evaluation of outcomes for participants |
| Blinding (performance bias and detection bias) | Low risk | Investigators, caregivers, and families were blinded |
| Incomplete outcome data (attrition bias) | Low risk | 100% follow‐up |
| Methods | Randomised controlled trial | |
| Participants | 68 preterm infants: 28 to 36 weeks in 2 strata | |
| Interventions | Term formula milk (N = 34) versus unfortified, pasteurised donor breast milk (N = 34). Assigned from birth for 2 months | |
| Outcomes | Rates of weight gain, increase in head circumference and length from birth until 1 month and from 1 month until 2 months | |
| Notes | Infants of mothers who wished to breast‐feed were initially given expressed breast milk if unable to feed naturally. There were only 2 such infants, their feeding group was not specified and the results for these infants are not presented separately in the paper. Given that this applies to only 2 out of 68 infants, we have included this study in the review | |
| Risk of bias | ||
| Bias | Authors' judgement | Support for judgement |
| Random sequence generation (selection bias) | Unclear risk | Method not stated |
| Allocation concealment (selection bias) | Unclear risk | Method not stated |
| Blinding (performance bias and detection bias) | Unclear risk | No information given |
| Incomplete outcome data (attrition bias) | Low risk | 100% follow‐up |
| Methods | Randomised controlled trial | |
| Participants | 67 preterm infants (27 to 33 weeks) | |
| Interventions | Term formula milk (N = 26) versus unfortified, pasteurised donor breast milk (N = 41). Feeds were assigned until the infant reached a weight of 1800 g or until withdrawn from the study because of feeding intolerance or NEC | |
| Outcomes | Time to regain birth weight | |
| Notes | Although the report gave information on adverse outcomes, the 7 affected infants were withdrawn from the study and not included in the analyses of growth rates. Therefore, growth data are reported for 20 infants in each arm of the trial | |
| Risk of bias | ||
| Bias | Authors' judgement | Support for judgement |
| Random sequence generation (selection bias) | Low risk | Random number table |
| Allocation concealment (selection bias) | Unclear risk | Method not stated "Any infant withdrawn from the study was replaced by the next one enrolled": implies lack of allocation concealment for these infants |
| Blinding (performance bias and detection bias) | Unclear risk | No information given |
| Incomplete outcome data (attrition bias) | Unclear risk | 7 out of 67 (10%) with adverse outcomes (NEC, mortality) were not assessed for growth outcomes. This included 6/26 (23%) in the formula group and 1/41 (2.4%) in the donor breast milk group, so potential bias 100% follow‐up and low risk of bias for mortality and NEC |
| Methods | Randomised controlled trial | |
| Participants | 159 infants of birth weight < 1850 g. Stratified by birth weight < 1200 g and 1201 g to 1850 g Infants with congenital abnormalities excluded. Infants with intrauterine growth restriction not excluded | |
| Interventions | Preterm formula milk (N = 76) versus donor (mainly "drip") breast milk (N = 83) The formula was intended to be delivered at 180 ml/kg/day versus the breast milk at 200 ml/kg/day Feeds were assigned until the infant reached a weight of 2000 g or until discharge from the neonatal unit | |
| Outcomes | Short term outcomes: Longer‐term outcomes: | |
| Notes | The first "interim" report provided data on short‐term growth outcomes in a predefined subset of the total cohort recruited. | |
| Risk of bias | ||
| Bias | Authors' judgement | Support for judgement |
| Random sequence generation (selection bias) | Low risk | Balanced randomisation sequence was prepared for each centre, within strata defined by birth weight (method of sequence generation not stated explicitly) |
| Allocation concealment (selection bias) | Low risk | Sealed, numbered envelopes |
| Blinding (performance bias and detection bias) | Unclear risk | No information given |
| Incomplete outcome data (attrition bias) | Low risk | 100% assessment of in‐hospital outcomes and > 80% follow‐up for long‐term outcomes (except for cognitive outcomes (verbal and performance intelligence quotient), which were assessed in about 20% of participants at ages 8 and 16 years) |
| Methods | Randomised controlled trial | |
| Participants | 343 infants of birth weight < 1850 g. Stratified by birth weight < 1200g and 1201 to 1850 g. Infants with congenital abnormalities excluded. Infants with intrauterine growth restriction not excluded | |
| Interventions | Preterm formula milk (N = 173) versus banked donor breast milk (N = 170) as a supplement to the mother's own breast milk | |
| Outcomes | Short‐term outcomes: time to regain birth weight (132 infants). Rates of change in weight (115 infants), crown‐heel length (45 infants) and head circumference (97 infants) from the point of regained birth weight until discharge from the neonatal unit or reaching a weight of 2000 g | |
| Notes | The first "interim" report provided data on short‐term growth outcomes in a predefined subset of the total cohort recruited. | |
| Risk of bias | ||
| Bias | Authors' judgement | Support for judgement |
| Random sequence generation (selection bias) | Unclear risk | Not stated |
| Allocation concealment (selection bias) | Low risk | Sealed, numbered envelopes |
| Blinding (performance bias and detection bias) | Unclear risk | No information given |
| Incomplete outcome data (attrition bias) | Low risk | 100% assessment of in‐hospital outcomes and > 80% follow‐up for long‐term outcomes (except for cognitive outcomes (verbal and performance intelligence quotient), which were assessed in about 20% of participants at ages 8 and 16 years) |
| Methods | Randomised controlled trial | |
| Participants | 106 preterm infants of birth weight < 2100 g, but between 10th and 90th centiles for birth weight. Infants excluded if evidence of "physical abnormality or obvious disease" Premature Unit, Helsinki University Children's Hospital, 1972 to 1975 | |
| Interventions | Term formula milk (N = 84) versus unfortified donor breast milk (N = 22) Feeds continued until a weight of 2.4 kg was attained or until infants were withdrawn from the study because of a "medical complication" | |
| Outcomes | Time, from birth, to regain birth weight. Rate of weight change from birth and from point of regained birth weight | |
| Notes | Donor breast milk was given at a 170 ml/kg/day, compared with formula at 150 ml/kg/day, "in order to achieve equivalent calorie inputs". Donor breast milk‐fed infants were also given supplemental vitamins | |
| Risk of bias | ||
| Bias | Authors' judgement | Support for judgement |
| Random sequence generation (selection bias) | High risk | Randomly selected permutations of 1, 2, 3, 4 were prepared in advance, which were used to allocate to the 4 formula arms. Every 5th infant was assigned to pooled breast milk. Hence, it was not strictly random. Also, no details of how the permutations were generated |
| Allocation concealment (selection bias) | High risk | Every 5th infant was assigned to pooled breast milk so allocation concealment may have been sub‐optimal |
| Blinding (performance bias and detection bias) | Unclear risk | No information given |
| Incomplete outcome data (attrition bias) | Low risk | 95% follow‐up (5/106 infants who were enrolled were dropped from the study for medical reasons) |
| Methods | Randomised controlled trial | |
| Participants | 173 infants of gestational age < 30 weeks, whose mothers intended to breast‐feed but whose own milk became insufficient from birth until 90 days of age or hospital discharge | |
| Interventions | Preterm formula (N = 81) versus unfortified donor breast milk (N = 92) given as a supplement to maternal breast milk | |
| Outcomes | Incidence of late‐onset invasive infection and NEC, duration of hospitalisation and growth during the study period (weight gain, head circumference increment and length increment) | |
| Notes | Participating infants received small quantities (20 ml/kg/day) of their own mother's milk during the first week after birth and continued for 3 to 5 days before the volume was advanced. Milk intake was increased by 20 to 100 ml/kg/day at which time human milk fortifier was added. Subsequently the volume of fortified human milk was advanced by 20 ml/kg/day until 160 ml/kg/day was achieved. If no mother's milk was available and the baby was assigned to donor breast milk then a similar advancement and fortification protocol was followed. For all infants, adjustments in milk intake between 160 and 200 ml/kg/day were recommended to ensure an average weekly weight gain of at least 15 g/kg per day | |
| Risk of bias | ||
| Bias | Authors' judgement | Support for judgement |
| Random sequence generation (selection bias) | Low risk | Method not stated explicitly but very likely to be computer‐generated since the random sequence was "an unbalanced blocked design, according to the stratification variables of gestational age and receipt of prenatal steroids" |
| Allocation concealment (selection bias) | Low risk | Allocation was "performed by the research nurse coordinator with sealed opaque envelopes" |
| Blinding (performance bias and detection bias) | High risk | Unblinded |
| Incomplete outcome data (attrition bias) | Low risk | Complete follow‐up |
| Methods | Randomised controlled trial | |
| Participants | 20 preterm or LBW infants; all infants were "physically normal with no further signs of disease" | |
| Interventions | Term formula milk (N = 10) versus donor breast milk (N = 10) for at least 4 weeks from birth | |
| Outcomes | Time, from birth, to regain birth weight (mean but no SD reported) | |
| Notes | — | |
| Risk of bias | ||
| Bias | Authors' judgement | Support for judgement |
| Random sequence generation (selection bias) | Unclear risk | Method not stated |
| Allocation concealment (selection bias) | Unclear risk | No information given |
| Blinding (performance bias and detection bias) | Unclear risk | No information given |
| Incomplete outcome data (attrition bias) | Low risk | 100% follow‐up |
| Methods | Randomised controlled trial | |
| Participants | 81 VLBW infants, excluding infants with "any significant illness" or those who required ventilatory support at day 10 | |
| Interventions | Preterm formula milk (N = 44) versus donor breast milk (N = 37). The donor breast milk was not pasteurised. Feeds were allocated on the 10th day of life, and continued until the infant reached a weight of 2000 g or until withdrawn from the study because of "any illness requiring intravenous infusion of fat or protein" | |
| Outcomes | Mean daily rates of change in weight, crown‐heel length and head circumference from the 10th until the 30th day of life were reported | |
| Notes | The feeds were not allocated until the 10th day after birth in order to avoid the use of protein‐enriched formula "when active growth was unlikely". In the first 9 days of life the infants received a term formula or maternal expressed breast milk (if available). Although the report gave information on adverse outcomes, including NEC, the 5 affected infants were withdrawn from the study and not included in the analyses of growth rates | |
| Risk of bias | ||
| Bias | Authors' judgement | Support for judgement |
| Random sequence generation (selection bias) | Unclear risk | Infants were stratified by birth weight and randomised, but how the sequence was generated is not stated |
| Allocation concealment (selection bias) | Low risk | Concealed envelope opened only after informed parental consent obtained |
| Blinding (performance bias and detection bias) | Unclear risk | No information given |
| Incomplete outcome data (attrition bias) | Low risk | 5 infants with adverse outcomes did not have growth data |
LBW: low birth weight
NEC: necrotising enterocolitis
SD: standard deviation
VLBW: very low birth weight
Characteristics of excluded studies [ordered by study ID]
| Study | Reason for exclusion |
| Cooper 1984 measured growth and adverse events in preterm infants fed preterm formula or donor breast milk, but for most participants the feeding group was not allocated randomly | |
| Jarvenpaa 1983 compared growth in low birth weight infants fed formula versus breast milk. However, the allocation was not random since those infants whose mothers chose to provide their own milk were selectively assigned to the human milk group | |
| Narayanan 1982 reported a block randomised trial in low birth weight infants of feeding with formula milk versus "expressed human milk", the latter being a mixture of preterm and term human milk. The randomised blocked design was followed strictly at first, but in the second year, many of the low birth weight infants were allocated to one of the human milk groups (rather than the formula group). Hence, the data for year 1 are completely random (all 4 groups can be compared and be included in our review), but the data for year 2 (and beyond) were not completely random (and should not be included). The authors reported that the results in the random and "non‐random" phases were similar and therefore presented the combined results. The authors have been contacted to see if the results for year 1 are available separately | |
| O'Connor 2003 compared growth, feeding tolerance, morbidity and development in 463 low birth weight infants fed human milk or formula. However, the feeding groups were not randomly allocated | |
| Although not clearly stated in the title or abstract, feeds do not appear to have been randomly assigned | |
| Randomised controlled trial 207 infants with birth weight 500 g to 1250 g, with intention to receive mother's milk, and ability to adhere to feeding protocol (based on use of mother's own milk, initiation of enteral feeding before 21 days after birth, and initiation of parenteral nutrition within 48 hours of birth) All infants received their mother's own milk and 1 of 3 fortifiers, which was supplemented, if necessary, with either formula or donor breast milk as follows: 1. Human milk‐based fortifier (HMF) started when enteral intake was 40 ml/kg/day and donor breast milk as a supplement to mother's own milk 2. Human milk‐based fortifier (HMF) started when enteral intake was 100 ml/kg/day and donor breast milk as a supplement to mother's own milk 3. Bovine milk‐based fortifier (BMF) started when enteral intake was 100 ml/kg/day and preterm formula as a supplement to mother's own milk | |
| Svenningsen 1982 randomly assigned 48 low birth weight infants to formula milk versus breast milk. However, most infants in the breast milk group received their own mother's expressed milk rather than donor breast milk |
Characteristics of ongoing studies [ordered by study ID]
| Trial name or title | 'Role of Human Milk Bank in the Protection of Severe Respiratory Disease in Very Low Birth Weight Premature Infants' |
| Methods | Randomised controlled trial |
| Participants | Very low birth weight infants (sample size not stated) |
| Interventions | Donor breast milk and preterm formula versus preterm formula alone |
| Outcomes | Incidence of respiratory infections in infancy |
| Starting date | 2011 |
| Contact information | Fernando Pedro Polack: [email protected] |
| Notes | — |
| Trial name or title | 'Donor Milk vs. Formula in Extremely Low Birth Weight (ELBW) Infants (The MILK trial)' |
| Methods | Randomised controlled trial |
| Participants | 670 ELBW infants |
| Interventions | Donor breast milk (provided by the Human Milk Banking Association of North America) versus preterm formula |
| Outcomes | Primary: Bayley Scales of Infant Development III (BSID III) at 22 to 26 months post‐term |
| Starting date | 2012 (estimated completion 2018) |
| Contact information | Tarah Colaizy: tarah‐[email protected] |
| Notes | Eunice Kennedy Shriver National Institute of Child Health and Human Development (NICHD) ‐ sponsored in 17 centres, USA |
| Trial name or title | 'PREterM FOrmula Or Donor Breast Milk for Premature Babies (PREMFOOD)' |
| Methods | Randomised controlled trial (3 arms) |
| Participants | 66 very preterm infants |
| Interventions | Donor breast milk or donor breast milk with fortifier or preterm formula |
| Outcomes | Primary: total body adiposity measured by MRI at "term equivalent" |
| Starting date | 2012 |
| Contact information | Luke Mills: [email protected] |
| Notes | — |
ELBW: extremely low birth weight
Data and analyses
| Outcome or subgroup title | No. of studies | No. of participants | Statistical method | Effect size |
| 1 Time to regain birth weight (days from birth) Show forest plot | 2 | 166 | Mean Difference (IV, Fixed, 95% CI) | ‐2.00 [‐5.81, ‐2.18] |
| Analysis 1.1  Comparison 1 Formula (term or preterm) versus donor breast milk, Outcome 1 Time to regain birth weight (days from birth). | ||||
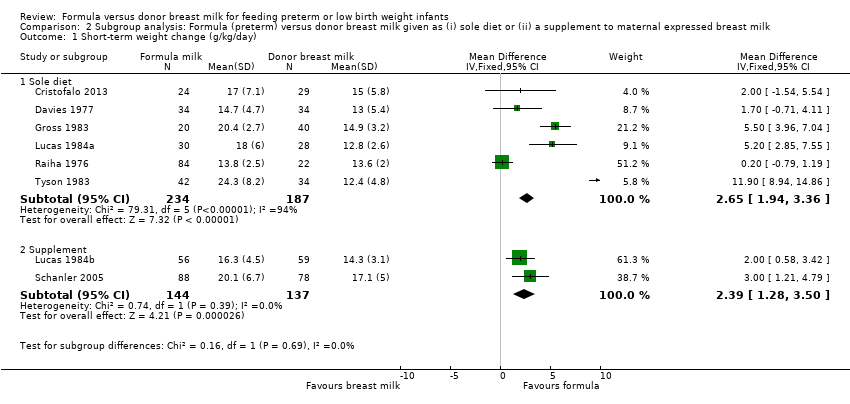
| 2 Short term weight change (g/kg/day) Show forest plot | 8 | 702 | Mean Difference (IV, Fixed, 95% CI) | 2.58 [1.98, 3.17] |
| Analysis 1.2 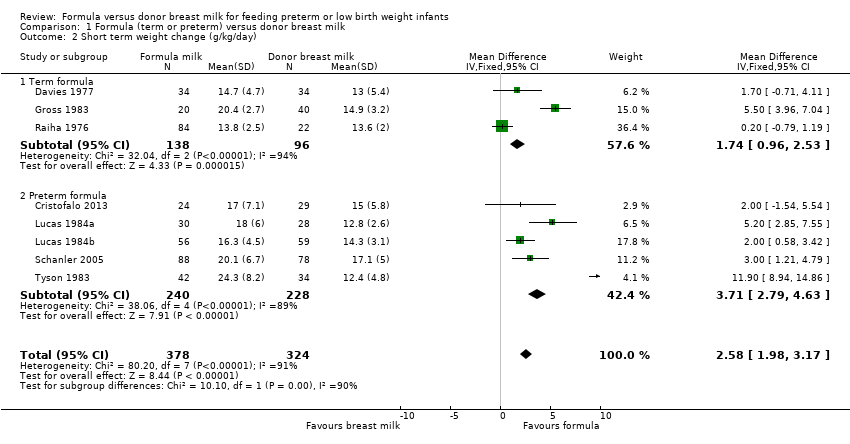 Comparison 1 Formula (term or preterm) versus donor breast milk, Outcome 2 Short term weight change (g/kg/day). | ||||
| 2.1 Term formula | 3 | 234 | Mean Difference (IV, Fixed, 95% CI) | 1.74 [0.96, 2.53] |
| 2.2 Preterm formula | 5 | 468 | Mean Difference (IV, Fixed, 95% CI) | 3.71 [2.79, 4.63] |
| 3 Short‐term change in crown‐heel length (mm/week) Show forest plot | 7 | 494 | Mean Difference (IV, Fixed, 95% CI) | 1.36 [0.87, 1.85] |
| Analysis 1.3 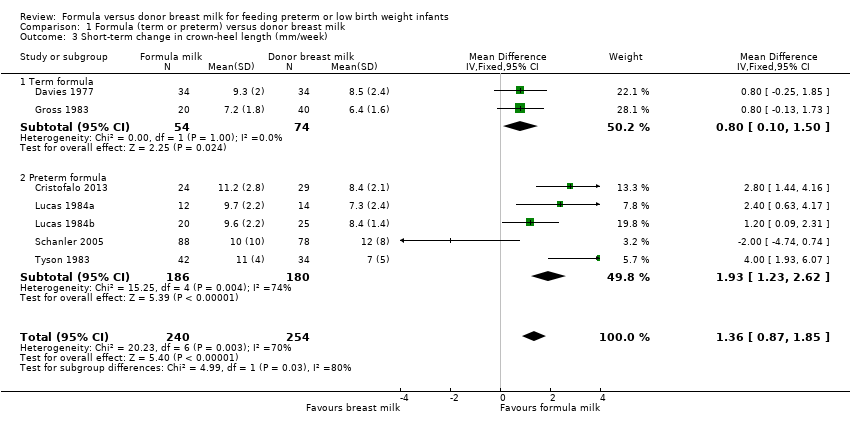 Comparison 1 Formula (term or preterm) versus donor breast milk, Outcome 3 Short‐term change in crown‐heel length (mm/week). | ||||
| 3.1 Term formula | 2 | 128 | Mean Difference (IV, Fixed, 95% CI) | 0.80 [0.10, 1.50] |
| 3.2 Preterm formula | 5 | 366 | Mean Difference (IV, Fixed, 95% CI) | 1.93 [1.23, 2.62] |
| 4 Short‐term change in crown‐rump length (mm/week) Show forest plot | 1 | Mean Difference (IV, Fixed, 95% CI) | Subtotals only | |
| Analysis 1.4  Comparison 1 Formula (term or preterm) versus donor breast milk, Outcome 4 Short‐term change in crown‐rump length (mm/week). | ||||
| 5 Short‐term change in femoral length (mm/week) Show forest plot | 1 | Mean Difference (IV, Fixed, 95% CI) | Subtotals only | |
| Analysis 1.5 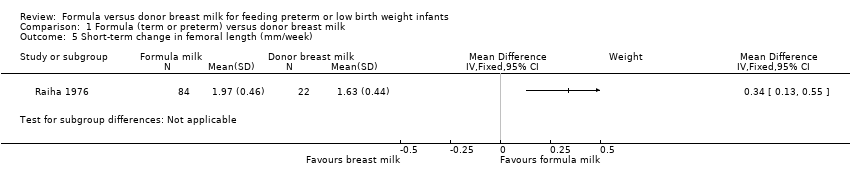 Comparison 1 Formula (term or preterm) versus donor breast milk, Outcome 5 Short‐term change in femoral length (mm/week). | ||||
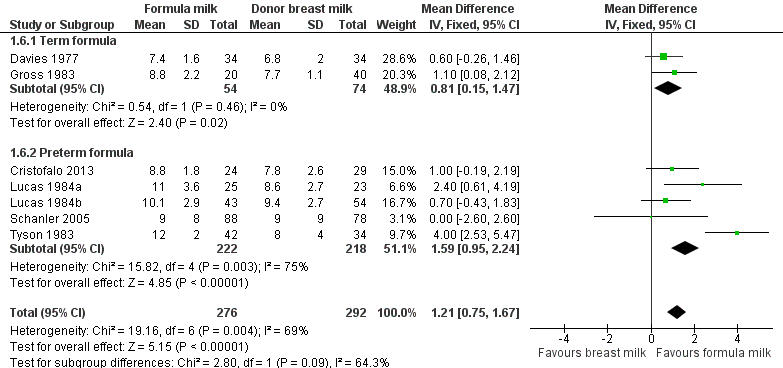
| 6 Short‐term change in head circumference (mm/week) Show forest plot | 7 | 568 | Mean Difference (IV, Fixed, 95% CI) | 1.21 [0.75, 1.67] |
| Analysis 1.6  Comparison 1 Formula (term or preterm) versus donor breast milk, Outcome 6 Short‐term change in head circumference (mm/week). | ||||
| 6.1 Term formula | 2 | 128 | Mean Difference (IV, Fixed, 95% CI) | 0.81 [0.15, 1.47] |
| 6.2 Preterm formula | 5 | 440 | Mean Difference (IV, Fixed, 95% CI) | 1.59 [0.95, 2.24] |
| 7 Weight (kg) at 9 months post‐term Show forest plot | 2 | 369 | Mean Difference (IV, Fixed, 95% CI) | ‐0.03 [‐0.26, 0.21] |
| Analysis 1.7  Comparison 1 Formula (term or preterm) versus donor breast milk, Outcome 7 Weight (kg) at 9 months post‐term. | ||||
| 8 Length (cm) at 9 months post‐term Show forest plot | 2 | 369 | Mean Difference (IV, Fixed, 95% CI) | 0.03 [‐0.64, 0.70] |
| Analysis 1.8  Comparison 1 Formula (term or preterm) versus donor breast milk, Outcome 8 Length (cm) at 9 months post‐term. | ||||
| 9 Head circumference (cm) at 9 months post‐term Show forest plot | 2 | 369 | Mean Difference (IV, Fixed, 95% CI) | 0.20 [‐0.13, 0.53] |
| Analysis 1.9  Comparison 1 Formula (term or preterm) versus donor breast milk, Outcome 9 Head circumference (cm) at 9 months post‐term. | ||||
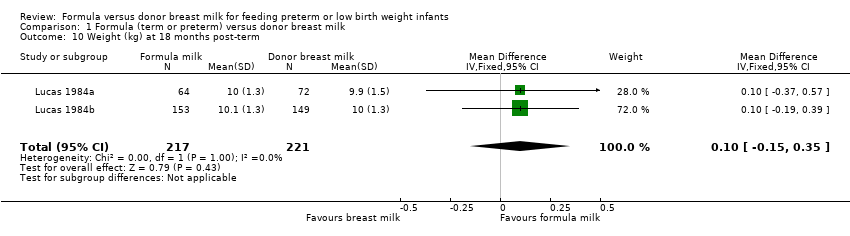
| 10 Weight (kg) at 18 months post‐term Show forest plot | 2 | 438 | Mean Difference (IV, Fixed, 95% CI) | 0.10 [‐0.15, 0.35] |
| Analysis 1.10  Comparison 1 Formula (term or preterm) versus donor breast milk, Outcome 10 Weight (kg) at 18 months post‐term. | ||||
| 11 Length (cm) at 18 months post‐term Show forest plot | 2 | 438 | Mean Difference (IV, Fixed, 95% CI) | 0.53 [‐0.15, 1.20] |
| Analysis 1.11 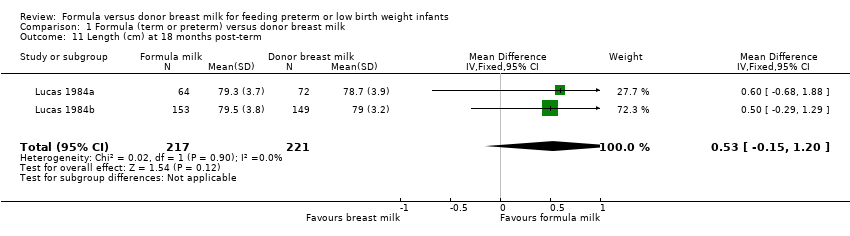 Comparison 1 Formula (term or preterm) versus donor breast milk, Outcome 11 Length (cm) at 18 months post‐term. | ||||
| 12 Head circumference (cm) at 18 months post‐term Show forest plot | 2 | 438 | Mean Difference (IV, Fixed, 95% CI) | 0.10 [‐0.19, 0.39] |
| Analysis 1.12 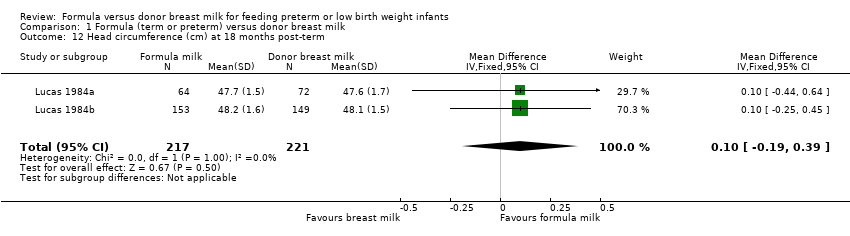 Comparison 1 Formula (term or preterm) versus donor breast milk, Outcome 12 Head circumference (cm) at 18 months post‐term. | ||||
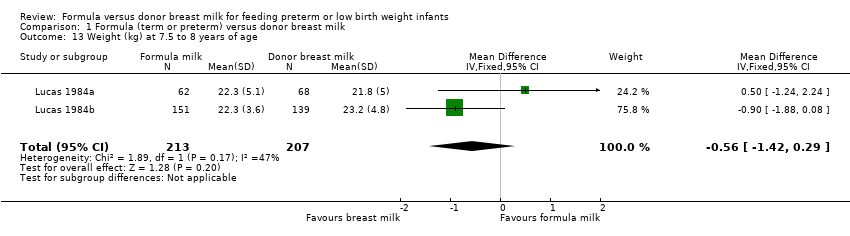
| 13 Weight (kg) at 7.5 to 8 years of age Show forest plot | 2 | 420 | Mean Difference (IV, Fixed, 95% CI) | ‐0.56 [‐1.42, 0.29] |
| Analysis 1.13  Comparison 1 Formula (term or preterm) versus donor breast milk, Outcome 13 Weight (kg) at 7.5 to 8 years of age. | ||||
| 14 Length (cm) at 7.5 to 8 years of age Show forest plot | 2 | 420 | Mean Difference (IV, Fixed, 95% CI) | 0.05 [‐1.12, 1.23] |
| Analysis 1.14  Comparison 1 Formula (term or preterm) versus donor breast milk, Outcome 14 Length (cm) at 7.5 to 8 years of age. | ||||
| 15 Head circumference (cm) at 7.5 to 8 years of age Show forest plot | 2 | 420 | Mean Difference (IV, Fixed, 95% CI) | ‐0.19 [‐0.54, 0.16] |
| Analysis 1.15 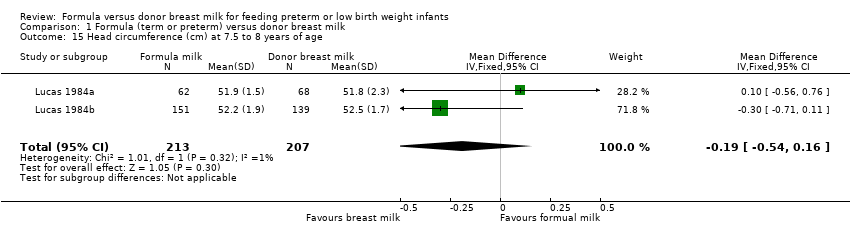 Comparison 1 Formula (term or preterm) versus donor breast milk, Outcome 15 Head circumference (cm) at 7.5 to 8 years of age. | ||||
| 16 Bayley Mental Development Index at 18 months Show forest plot | 2 | 387 | Mean Difference (IV, Fixed, 95% CI) | 1.24 [‐2.62, 5.09] |
| Analysis 1.16  Comparison 1 Formula (term or preterm) versus donor breast milk, Outcome 16 Bayley Mental Development Index at 18 months. | ||||
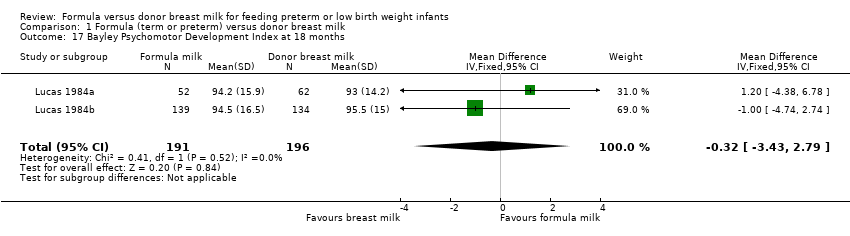
| 17 Bayley Psychomotor Development Index at 18 months Show forest plot | 2 | 387 | Mean Difference (IV, Fixed, 95% CI) | ‐0.32 [‐3.43, 2.79] |
| Analysis 1.17  Comparison 1 Formula (term or preterm) versus donor breast milk, Outcome 17 Bayley Psychomotor Development Index at 18 months. | ||||
| 18 Neurological impairment at 18 months Show forest plot | 2 | 400 | Risk Ratio (M‐H, Fixed, 95% CI) | 1.21 [0.62, 2.35] |
| Analysis 1.18  Comparison 1 Formula (term or preterm) versus donor breast milk, Outcome 18 Neurological impairment at 18 months. | ||||
| 19 All‐cause mortality Show forest plot | 4 | 721 | Risk Ratio (M‐H, Fixed, 95% CI) | 1.33 [0.79, 2.25] |
| Analysis 1.19 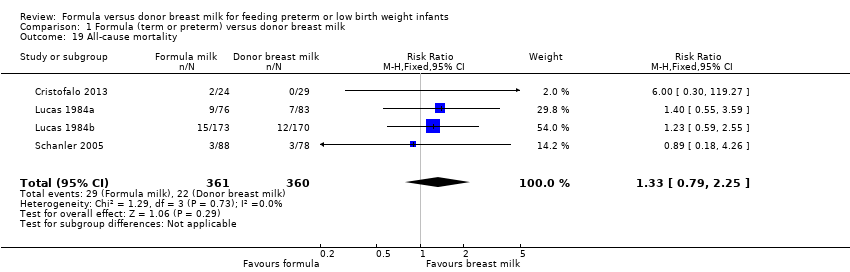 Comparison 1 Formula (term or preterm) versus donor breast milk, Outcome 19 All‐cause mortality. | ||||
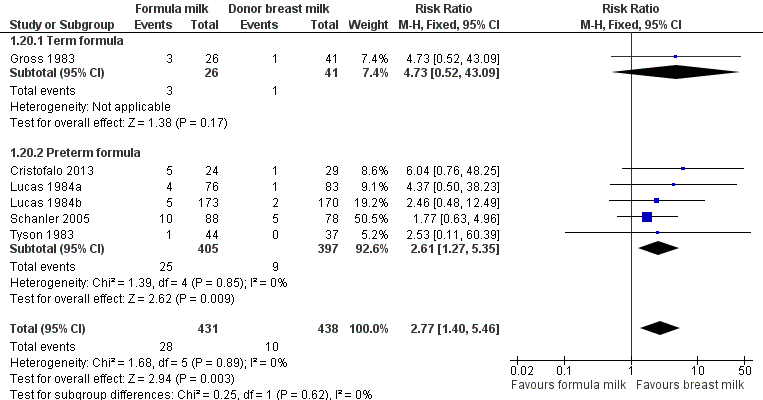
| 20 Necrotising enterocolitis Show forest plot | 6 | 869 | Risk Ratio (M‐H, Fixed, 95% CI) | 2.77 [1.40, 5.46] |
| Analysis 1.20  Comparison 1 Formula (term or preterm) versus donor breast milk, Outcome 20 Necrotising enterocolitis. | ||||
| 20.1 Term formula | 1 | 67 | Risk Ratio (M‐H, Fixed, 95% CI) | 4.73 [0.52, 43.09] |
| 20.2 Preterm formula | 5 | 802 | Risk Ratio (M‐H, Fixed, 95% CI) | 2.61 [1.27, 5.35] |
| 21 Days after birth to establish full enteral feeding Show forest plot | 1 | 53 | Mean Difference (IV, Fixed, 95% CI) | 4.70 [‐2.56, 11.96] |
| Analysis 1.21  Comparison 1 Formula (term or preterm) versus donor breast milk, Outcome 21 Days after birth to establish full enteral feeding. | ||||
| 22 Feeding intolerance or diarrhoea Show forest plot | 2 | 148 | Risk Difference (M‐H, Fixed, 95% CI) | 0.10 [0.01, 0.19] |
| Analysis 1.22  Comparison 1 Formula (term or preterm) versus donor breast milk, Outcome 22 Feeding intolerance or diarrhoea. | ||||
| 22.1 Term formula | 1 | 67 | Risk Difference (M‐H, Fixed, 95% CI) | 0.21 [0.04, 0.38] |
| 22.2 Preterm formula | 1 | 81 | Risk Difference (M‐H, Fixed, 95% CI) | 0.02 [‐0.06, 0.10] |
| 23 Incidence of invasive infection Show forest plot | 2 | 219 | Risk Ratio (M‐H, Fixed, 95% CI) | 1.12 [0.84, 1.49] |
| Analysis 1.23  Comparison 1 Formula (term or preterm) versus donor breast milk, Outcome 23 Incidence of invasive infection. | ||||
| Outcome or subgroup title | No. of studies | No. of participants | Statistical method | Effect size |
| 1 Short‐term weight change (g/kg/day) Show forest plot | 8 | Mean Difference (IV, Fixed, 95% CI) | Subtotals only | |
| Analysis 2.1  Comparison 2 Subgroup analysis: Formula (preterm) versus donor breast milk given as (i) sole diet or (ii) a supplement to maternal expressed breast milk, Outcome 1 Short‐term weight change (g/kg/day). | ||||
| 1.1 Sole diet | 6 | 421 | Mean Difference (IV, Fixed, 95% CI) | 2.65 [1.94, 3.36] |
| 1.2 Supplement | 2 | 281 | Mean Difference (IV, Fixed, 95% CI) | 2.39 [1.28, 3.50] |
| 2 Short‐term change in crown‐heel length (mm/week) Show forest plot | 7 | Mean Difference (IV, Fixed, 95% CI) | Subtotals only | |
| Analysis 2.2 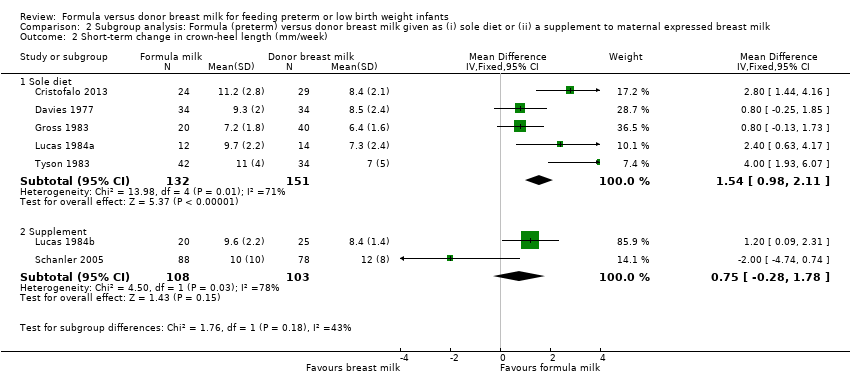 Comparison 2 Subgroup analysis: Formula (preterm) versus donor breast milk given as (i) sole diet or (ii) a supplement to maternal expressed breast milk, Outcome 2 Short‐term change in crown‐heel length (mm/week). | ||||
| 2.1 Sole diet | 5 | 283 | Mean Difference (IV, Fixed, 95% CI) | 1.54 [0.98, 2.11] |
| 2.2 Supplement | 2 | 211 | Mean Difference (IV, Fixed, 95% CI) | 0.75 [‐0.28, 1.78] |
| 3 Short‐term change in head circumference (mm/week) Show forest plot | 7 | Mean Difference (IV, Fixed, 95% CI) | Subtotals only | |
| Analysis 2.3  Comparison 2 Subgroup analysis: Formula (preterm) versus donor breast milk given as (i) sole diet or (ii) a supplement to maternal expressed breast milk, Outcome 3 Short‐term change in head circumference (mm/week). | ||||
| 3.1 Sole diet | 5 | 305 | Mean Difference (IV, Fixed, 95% CI) | 1.36 [0.85, 1.88] |
| 3.2 Supplement | 2 | 263 | Mean Difference (IV, Fixed, 95% CI) | 0.59 [‐0.44, 1.62] |
| 4 Weight (kg) at 9 months post‐term Show forest plot | 2 | Mean Difference (IV, Fixed, 95% CI) | Subtotals only | |
| Analysis 2.4 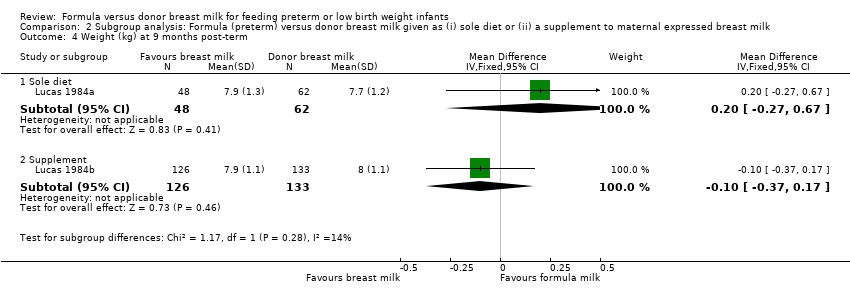 Comparison 2 Subgroup analysis: Formula (preterm) versus donor breast milk given as (i) sole diet or (ii) a supplement to maternal expressed breast milk, Outcome 4 Weight (kg) at 9 months post‐term. | ||||
| 4.1 Sole diet | 1 | 110 | Mean Difference (IV, Fixed, 95% CI) | 0.20 [‐0.27, 0.67] |
| 4.2 Supplement | 1 | 259 | Mean Difference (IV, Fixed, 95% CI) | ‐0.10 [‐0.37, 0.17] |
| 5 Length (cm) at 9 months post‐term Show forest plot | 2 | Mean Difference (IV, Fixed, 95% CI) | Subtotals only | |
| Analysis 2.5  Comparison 2 Subgroup analysis: Formula (preterm) versus donor breast milk given as (i) sole diet or (ii) a supplement to maternal expressed breast milk, Outcome 5 Length (cm) at 9 months post‐term. | ||||
| 5.1 Sole diet | 1 | 110 | Mean Difference (IV, Fixed, 95% CI) | 0.40 [‐0.93, 1.73] |
| 5.2 Supplement | 1 | 259 | Mean Difference (IV, Fixed, 95% CI) | ‐0.10 [‐0.88, 0.68] |
| 6 Head circumference (cm) at 9 months post‐term Show forest plot | 2 | Mean Difference (IV, Fixed, 95% CI) | Subtotals only | |
| Analysis 2.6 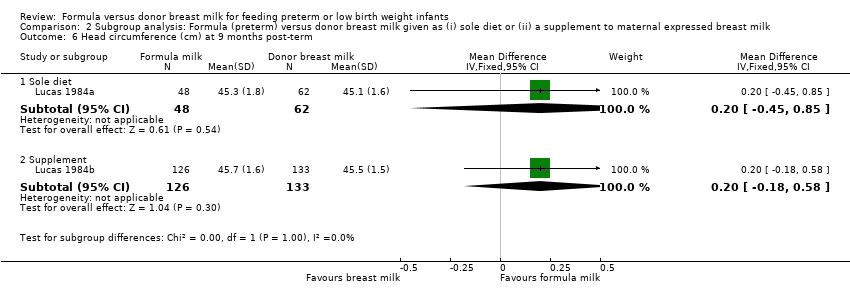 Comparison 2 Subgroup analysis: Formula (preterm) versus donor breast milk given as (i) sole diet or (ii) a supplement to maternal expressed breast milk, Outcome 6 Head circumference (cm) at 9 months post‐term. | ||||
| 6.1 Sole diet | 1 | 110 | Mean Difference (IV, Fixed, 95% CI) | 0.20 [‐0.45, 0.85] |
| 6.2 Supplement | 1 | 259 | Mean Difference (IV, Fixed, 95% CI) | 0.20 [‐0.18, 0.58] |
| 7 Weight (kg) at 18 months post‐term Show forest plot | 2 | Mean Difference (IV, Fixed, 95% CI) | Subtotals only | |
| Analysis 2.7  Comparison 2 Subgroup analysis: Formula (preterm) versus donor breast milk given as (i) sole diet or (ii) a supplement to maternal expressed breast milk, Outcome 7 Weight (kg) at 18 months post‐term. | ||||
| 7.1 Sole diet | 1 | 136 | Mean Difference (IV, Fixed, 95% CI) | 0.10 [‐0.37, 0.57] |
| 7.2 Supplement | 1 | 302 | Mean Difference (IV, Fixed, 95% CI) | 0.10 [‐0.19, 0.39] |
| 8 Length (cm) at 18 months post‐term Show forest plot | 2 | Mean Difference (IV, Fixed, 95% CI) | Subtotals only | |
| Analysis 2.8  Comparison 2 Subgroup analysis: Formula (preterm) versus donor breast milk given as (i) sole diet or (ii) a supplement to maternal expressed breast milk, Outcome 8 Length (cm) at 18 months post‐term. | ||||
| 8.1 Sole diet | 1 | 136 | Mean Difference (IV, Fixed, 95% CI) | 0.60 [‐0.68, 1.88] |
| 8.2 Supplement | 1 | 302 | Mean Difference (IV, Fixed, 95% CI) | 0.5 [‐0.29, 1.29] |
| 9 Head circumference (cm) at 18 months post‐term Show forest plot | 2 | Mean Difference (IV, Fixed, 95% CI) | Subtotals only | |
| Analysis 2.9  Comparison 2 Subgroup analysis: Formula (preterm) versus donor breast milk given as (i) sole diet or (ii) a supplement to maternal expressed breast milk, Outcome 9 Head circumference (cm) at 18 months post‐term. | ||||
| 9.1 Sole diet | 1 | 136 | Mean Difference (IV, Fixed, 95% CI) | 0.10 [‐0.44, 0.64] |
| 9.2 Supplement | 1 | 302 | Mean Difference (IV, Fixed, 95% CI) | 0.10 [‐0.25, 0.45] |
| 10 Weight (kg) at 7.5 to 8 years of age Show forest plot | 2 | Mean Difference (IV, Fixed, 95% CI) | Subtotals only | |
| Analysis 2.10  Comparison 2 Subgroup analysis: Formula (preterm) versus donor breast milk given as (i) sole diet or (ii) a supplement to maternal expressed breast milk, Outcome 10 Weight (kg) at 7.5 to 8 years of age. | ||||
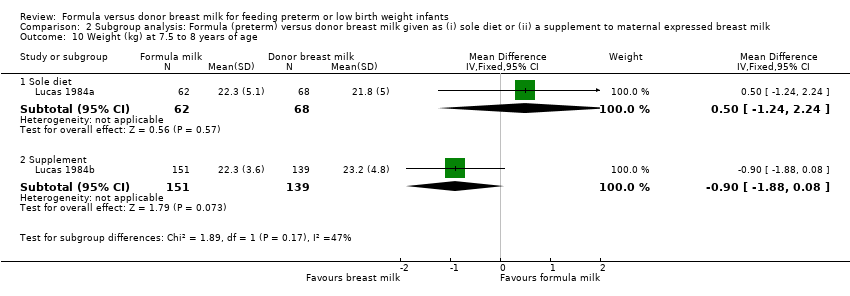
| 10.1 Sole diet | 1 | 130 | Mean Difference (IV, Fixed, 95% CI) | 0.5 [‐1.24, 2.24] |
| 10.2 Supplement | 1 | 290 | Mean Difference (IV, Fixed, 95% CI) | ‐0.90 [‐1.88, 0.08] |
| 11 Length (cm) at 7.5 to 8 years of age Show forest plot | 2 | 420 | Mean Difference (IV, Fixed, 95% CI) | 0.05 [‐1.12, 1.23] |
| Analysis 2.11 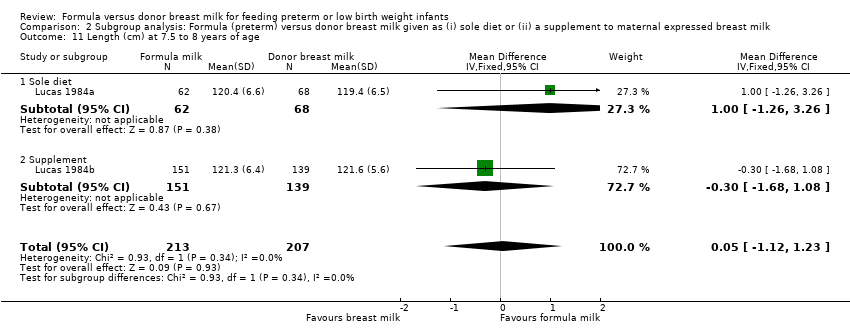 Comparison 2 Subgroup analysis: Formula (preterm) versus donor breast milk given as (i) sole diet or (ii) a supplement to maternal expressed breast milk, Outcome 11 Length (cm) at 7.5 to 8 years of age. | ||||
| 11.1 Sole diet | 1 | 130 | Mean Difference (IV, Fixed, 95% CI) | 1.0 [‐1.26, 3.26] |
| 11.2 Supplement | 1 | 290 | Mean Difference (IV, Fixed, 95% CI) | ‐0.30 [‐1.68, 1.08] |
| 12 Head circumference (cm) at 7.5 to 8 years of age Show forest plot | 2 | 420 | Mean Difference (IV, Fixed, 95% CI) | ‐0.19 [‐0.54, 0.16] |
| Analysis 2.12 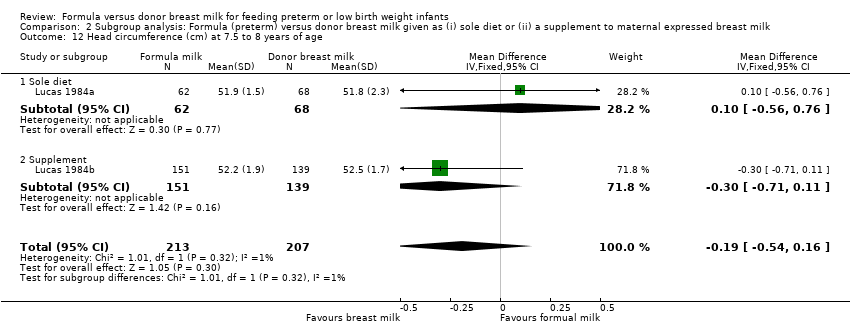 Comparison 2 Subgroup analysis: Formula (preterm) versus donor breast milk given as (i) sole diet or (ii) a supplement to maternal expressed breast milk, Outcome 12 Head circumference (cm) at 7.5 to 8 years of age. | ||||
| 12.1 Sole diet | 1 | 130 | Mean Difference (IV, Fixed, 95% CI) | 0.10 [‐0.56, 0.76] |
| 12.2 Supplement | 1 | 290 | Mean Difference (IV, Fixed, 95% CI) | ‐0.30 [‐0.71, 0.11] |
| 13 Bayley Mental Development Index at 18 months Show forest plot | 2 | Mean Difference (IV, Fixed, 95% CI) | Subtotals only | |
| Analysis 2.13  Comparison 2 Subgroup analysis: Formula (preterm) versus donor breast milk given as (i) sole diet or (ii) a supplement to maternal expressed breast milk, Outcome 13 Bayley Mental Development Index at 18 months. | ||||
| 13.1 Sole diet | 1 | 114 | Mean Difference (IV, Fixed, 95% CI) | 0.5 [‐6.21, 7.21] |
| 13.2 Supplement | 1 | 273 | Mean Difference (IV, Fixed, 95% CI) | 1.60 [‐3.11, 6.31] |
| 14 Bayley Psychomotor Development Index at 18 months Show forest plot | 2 | Mean Difference (IV, Fixed, 95% CI) | Subtotals only | |
| Analysis 2.14  Comparison 2 Subgroup analysis: Formula (preterm) versus donor breast milk given as (i) sole diet or (ii) a supplement to maternal expressed breast milk, Outcome 14 Bayley Psychomotor Development Index at 18 months. | ||||
| 14.1 Sole diet | 1 | 114 | Mean Difference (IV, Fixed, 95% CI) | 1.20 [‐4.38, 6.78] |
| 14.2 Supplement | 1 | 273 | Mean Difference (IV, Fixed, 95% CI) | ‐1.0 [‐4.74, 2.74] |
| 15 Neurological impairment at 18 months Show forest plot | 2 | Risk Ratio (M‐H, Fixed, 95% CI) | Subtotals only | |
| Analysis 2.15 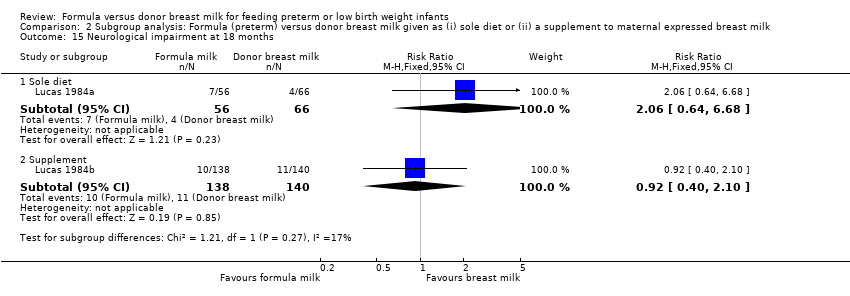 Comparison 2 Subgroup analysis: Formula (preterm) versus donor breast milk given as (i) sole diet or (ii) a supplement to maternal expressed breast milk, Outcome 15 Neurological impairment at 18 months. | ||||
| 15.1 Sole diet | 1 | 122 | Risk Ratio (M‐H, Fixed, 95% CI) | 2.06 [0.64, 6.68] |
| 15.2 Supplement | 1 | 278 | Risk Ratio (M‐H, Fixed, 95% CI) | 0.92 [0.40, 2.10] |
| 16 All‐cause mortality Show forest plot | 4 | Risk Ratio (M‐H, Fixed, 95% CI) | Subtotals only | |
| Analysis 2.16  Comparison 2 Subgroup analysis: Formula (preterm) versus donor breast milk given as (i) sole diet or (ii) a supplement to maternal expressed breast milk, Outcome 16 All‐cause mortality. | ||||
| 16.1 Sole diet | 2 | 212 | Risk Ratio (M‐H, Fixed, 95% CI) | 1.70 [0.71, 4.07] |
| 16.2 Supplement | 2 | 509 | Risk Ratio (M‐H, Fixed, 95% CI) | 1.16 [0.60, 2.24] |
| 17 Necrotising enterocolitis Show forest plot | 6 | Risk Ratio (M‐H, Fixed, 95% CI) | Subtotals only | |
| Analysis 2.17  Comparison 2 Subgroup analysis: Formula (preterm) versus donor breast milk given as (i) sole diet or (ii) a supplement to maternal expressed breast milk, Outcome 17 Necrotising enterocolitis. | ||||
| 17.1 Sole diet | 4 | 360 | Risk Ratio (M‐H, Fixed, 95% CI) | 4.62 [1.47, 14.56] |
| 17.2 Supplement | 2 | 509 | Risk Ratio (M‐H, Fixed, 95% CI) | 1.96 [0.82, 4.67] |
| 18 Feeding intolerance or diarrhoea Show forest plot | 2 | Risk Ratio (M‐H, Fixed, 95% CI) | Subtotals only | |
| Analysis 2.18  Comparison 2 Subgroup analysis: Formula (preterm) versus donor breast milk given as (i) sole diet or (ii) a supplement to maternal expressed breast milk, Outcome 18 Feeding intolerance or diarrhoea. | ||||
| 18.1 Sole diet | 2 | 148 | Risk Ratio (M‐H, Fixed, 95% CI) | 4.92 [1.17, 20.70] |
| 19 Incidence of invasive infection Show forest plot | 2 | Risk Ratio (M‐H, Fixed, 95% CI) | Subtotals only | |
| Analysis 2.19  Comparison 2 Subgroup analysis: Formula (preterm) versus donor breast milk given as (i) sole diet or (ii) a supplement to maternal expressed breast milk, Outcome 19 Incidence of invasive infection. | ||||
| 19.1 Sole diet | 1 | 53 | Risk Ratio (M‐H, Fixed, 95% CI) | 1.43 [0.97, 2.11] |
| 19.2 Supplement | 1 | 166 | Risk Ratio (M‐H, Fixed, 95% CI) | 0.98 [0.66, 1.44] |
| Outcome or subgroup title | No. of studies | No. of participants | Statistical method | Effect size |
| 1 Short‐term weight change (g/kg/day) Show forest plot | 8 | Mean Difference (IV, Fixed, 95% CI) | Subtotals only | |
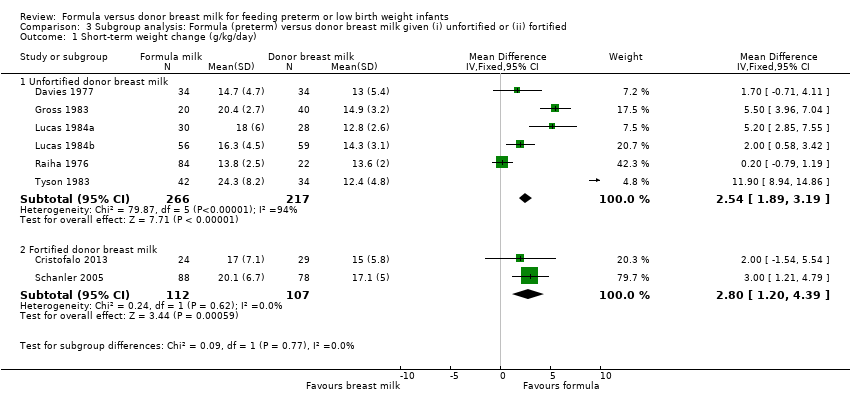
| Analysis 3.1  Comparison 3 Subgroup analysis: Formula (preterm) versus donor breast milk given (i) unfortified or (ii) fortified, Outcome 1 Short‐term weight change (g/kg/day). | ||||
| 1.1 Unfortified donor breast milk | 6 | 483 | Mean Difference (IV, Fixed, 95% CI) | 2.54 [1.89, 3.19] |
| 1.2 Fortified donor breast milk | 2 | 219 | Mean Difference (IV, Fixed, 95% CI) | 2.80 [1.20, 4.39] |
| 2 Short‐term change in crown‐heel length (mm/week) Show forest plot | 7 | Mean Difference (IV, Fixed, 95% CI) | Subtotals only | |
| Analysis 3.2  Comparison 3 Subgroup analysis: Formula (preterm) versus donor breast milk given (i) unfortified or (ii) fortified, Outcome 2 Short‐term change in crown‐heel length (mm/week). | ||||
| 2.1 Unfortified donor breast milk | 5 | 275 | Mean Difference (IV, Fixed, 95% CI) | 1.26 [0.72, 1.80] |
| 2.2 Fortified donor breast milk | 2 | 219 | Mean Difference (IV, Fixed, 95% CI) | 1.86 [0.64, 3.07] |
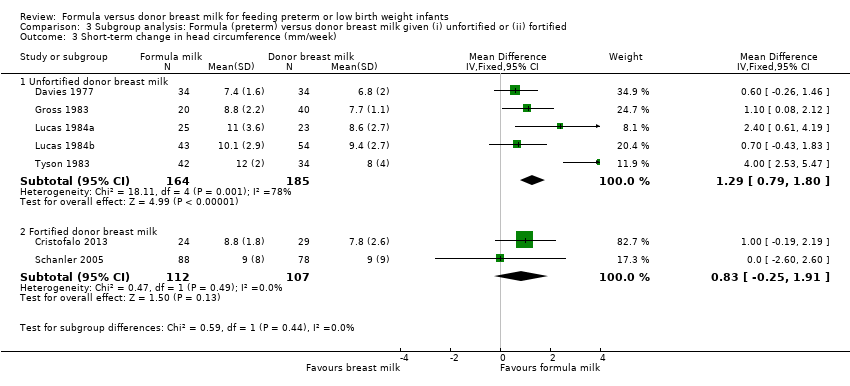
| 3 Short‐term change in head circumference (mm/week) Show forest plot | 7 | Mean Difference (IV, Fixed, 95% CI) | Subtotals only | |
| Analysis 3.3  Comparison 3 Subgroup analysis: Formula (preterm) versus donor breast milk given (i) unfortified or (ii) fortified, Outcome 3 Short‐term change in head circumference (mm/week). | ||||
| 3.1 Unfortified donor breast milk | 5 | 349 | Mean Difference (IV, Fixed, 95% CI) | 1.29 [0.79, 1.80] |
| 3.2 Fortified donor breast milk | 2 | 219 | Mean Difference (IV, Fixed, 95% CI) | 0.83 [‐0.25, 1.91] |
| 4 Weight (kg) at 9 months post‐term Show forest plot | 2 | Mean Difference (IV, Fixed, 95% CI) | Subtotals only | |
| Analysis 3.4  Comparison 3 Subgroup analysis: Formula (preterm) versus donor breast milk given (i) unfortified or (ii) fortified, Outcome 4 Weight (kg) at 9 months post‐term. | ||||
| 4.1 Unfortified donor breast milk | 2 | 369 | Mean Difference (IV, Fixed, 95% CI) | ‐0.03 [‐0.26, 0.21] |
| 5 Length (cm) at 9 months post‐term Show forest plot | 2 | Mean Difference (IV, Fixed, 95% CI) | Subtotals only | |
| Analysis 3.5  Comparison 3 Subgroup analysis: Formula (preterm) versus donor breast milk given (i) unfortified or (ii) fortified, Outcome 5 Length (cm) at 9 months post‐term. | ||||
| 5.1 Unfortified donor breast milk | 2 | 369 | Mean Difference (IV, Fixed, 95% CI) | 0.03 [‐0.64, 0.70] |
| 6 Head circumference (cm) at 9 months post‐term Show forest plot | 2 | Mean Difference (IV, Fixed, 95% CI) | Subtotals only | |
| Analysis 3.6  Comparison 3 Subgroup analysis: Formula (preterm) versus donor breast milk given (i) unfortified or (ii) fortified, Outcome 6 Head circumference (cm) at 9 months post‐term. | ||||
| 6.1 Unfortified donor breast milk | 2 | 369 | Mean Difference (IV, Fixed, 95% CI) | 0.20 [‐0.13, 0.53] |
| 7 Weight (kg) at 18 months post‐term Show forest plot | 2 | Mean Difference (IV, Fixed, 95% CI) | Subtotals only | |
| Analysis 3.7 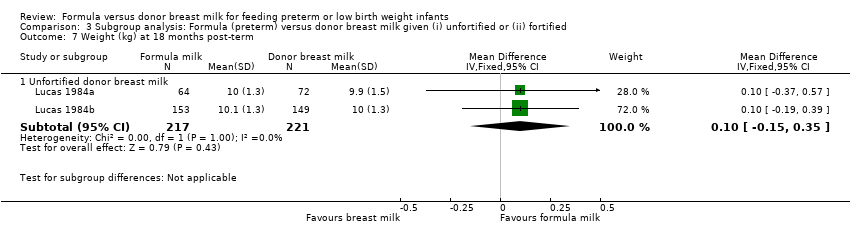 Comparison 3 Subgroup analysis: Formula (preterm) versus donor breast milk given (i) unfortified or (ii) fortified, Outcome 7 Weight (kg) at 18 months post‐term. | ||||
| 7.1 Unfortified donor breast milk | 2 | 438 | Mean Difference (IV, Fixed, 95% CI) | 0.10 [‐0.15, 0.35] |
| 8 Length (cm) at 18 months post‐term Show forest plot | 2 | Mean Difference (IV, Fixed, 95% CI) | Subtotals only | |
| Analysis 3.8 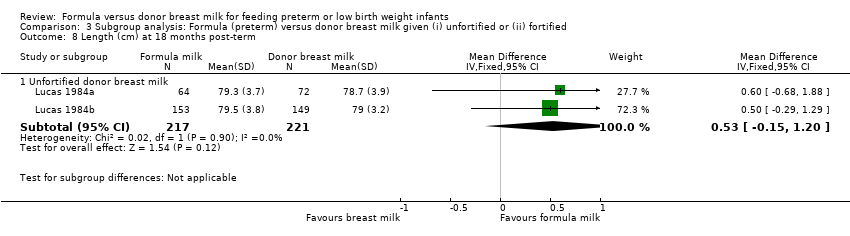 Comparison 3 Subgroup analysis: Formula (preterm) versus donor breast milk given (i) unfortified or (ii) fortified, Outcome 8 Length (cm) at 18 months post‐term. | ||||
| 8.1 Unfortified donor breast milk | 2 | 438 | Mean Difference (IV, Fixed, 95% CI) | 0.53 [‐0.15, 1.20] |
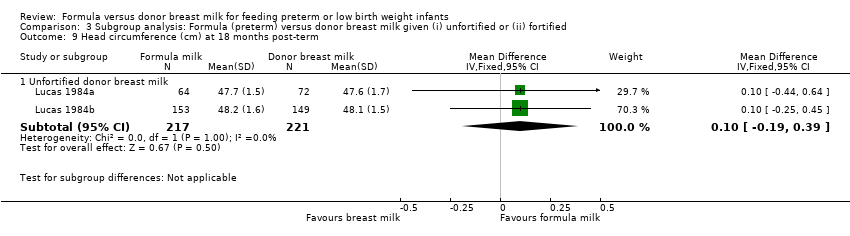
| 9 Head circumference (cm) at 18 months post‐term Show forest plot | 2 | Mean Difference (IV, Fixed, 95% CI) | Subtotals only | |
| Analysis 3.9  Comparison 3 Subgroup analysis: Formula (preterm) versus donor breast milk given (i) unfortified or (ii) fortified, Outcome 9 Head circumference (cm) at 18 months post‐term. | ||||
| 9.1 Unfortified donor breast milk | 2 | 438 | Mean Difference (IV, Fixed, 95% CI) | 0.10 [‐0.19, 0.39] |
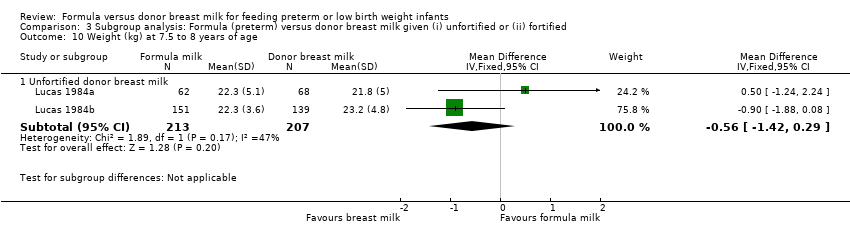
| 10 Weight (kg) at 7.5 to 8 years of age Show forest plot | 2 | Mean Difference (IV, Fixed, 95% CI) | Subtotals only | |
| Analysis 3.10  Comparison 3 Subgroup analysis: Formula (preterm) versus donor breast milk given (i) unfortified or (ii) fortified, Outcome 10 Weight (kg) at 7.5 to 8 years of age. | ||||
| 10.1 Unfortified donor breast milk | 2 | 420 | Mean Difference (IV, Fixed, 95% CI) | ‐0.56 [‐1.42, 0.29] |
| 11 Length (cm) at 7.5 to 8 years of age Show forest plot | 2 | Mean Difference (IV, Fixed, 95% CI) | Subtotals only | |
| Analysis 3.11 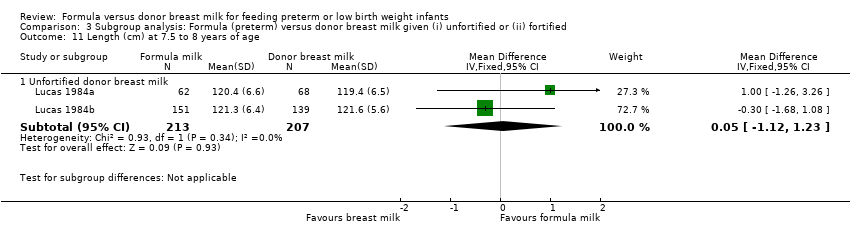 Comparison 3 Subgroup analysis: Formula (preterm) versus donor breast milk given (i) unfortified or (ii) fortified, Outcome 11 Length (cm) at 7.5 to 8 years of age. | ||||
| 11.1 Unfortified donor breast milk | 2 | 420 | Mean Difference (IV, Fixed, 95% CI) | 0.05 [‐1.12, 1.23] |
| 12 Head circumference (cm) at 7.5 to 8 years of age Show forest plot | 2 | Mean Difference (IV, Fixed, 95% CI) | Subtotals only | |
| Analysis 3.12 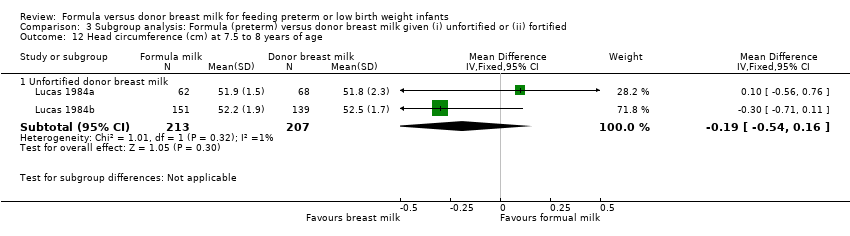 Comparison 3 Subgroup analysis: Formula (preterm) versus donor breast milk given (i) unfortified or (ii) fortified, Outcome 12 Head circumference (cm) at 7.5 to 8 years of age. | ||||
| 12.1 Unfortified donor breast milk | 2 | 420 | Mean Difference (IV, Fixed, 95% CI) | ‐0.19 [‐0.54, 0.16] |
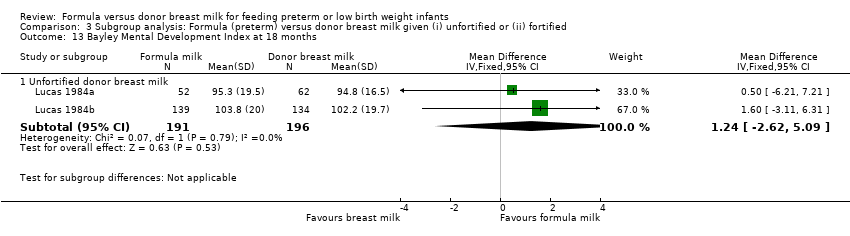
| 13 Bayley Mental Development Index at 18 months Show forest plot | 2 | Mean Difference (IV, Fixed, 95% CI) | Subtotals only | |
| Analysis 3.13  Comparison 3 Subgroup analysis: Formula (preterm) versus donor breast milk given (i) unfortified or (ii) fortified, Outcome 13 Bayley Mental Development Index at 18 months. | ||||
| 13.1 Unfortified donor breast milk | 2 | 387 | Mean Difference (IV, Fixed, 95% CI) | 1.24 [‐2.62, 5.09] |
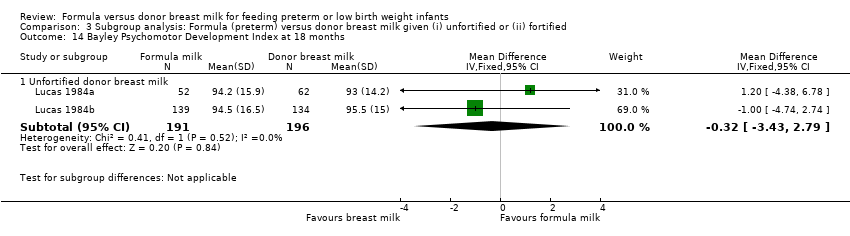
| 14 Bayley Psychomotor Development Index at 18 months Show forest plot | 2 | Mean Difference (IV, Fixed, 95% CI) | Subtotals only | |
| Analysis 3.14  Comparison 3 Subgroup analysis: Formula (preterm) versus donor breast milk given (i) unfortified or (ii) fortified, Outcome 14 Bayley Psychomotor Development Index at 18 months. | ||||
| 14.1 Unfortified donor breast milk | 2 | 387 | Mean Difference (IV, Fixed, 95% CI) | ‐0.32 [‐3.43, 2.79] |
| 15 Neurological impairment at 18 months Show forest plot | 2 | Risk Ratio (M‐H, Fixed, 95% CI) | Subtotals only | |
| Analysis 3.15 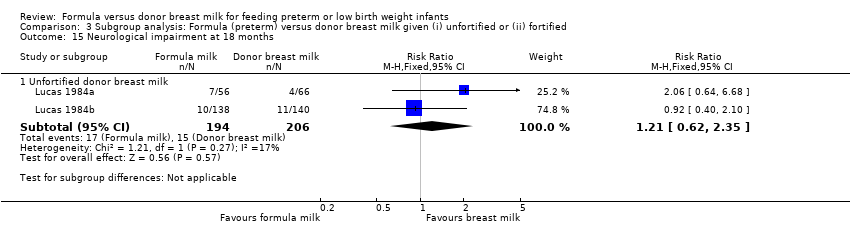 Comparison 3 Subgroup analysis: Formula (preterm) versus donor breast milk given (i) unfortified or (ii) fortified, Outcome 15 Neurological impairment at 18 months. | ||||
| 15.1 Unfortified donor breast milk | 2 | 400 | Risk Ratio (M‐H, Fixed, 95% CI) | 1.21 [0.62, 2.35] |
| 16 All‐cause mortality Show forest plot | 4 | Risk Ratio (M‐H, Fixed, 95% CI) | Subtotals only | |
| Analysis 3.16  Comparison 3 Subgroup analysis: Formula (preterm) versus donor breast milk given (i) unfortified or (ii) fortified, Outcome 16 All‐cause mortality. | ||||
| 16.1 Unfortified donor breast milk | 2 | 502 | Risk Ratio (M‐H, Fixed, 95% CI) | 1.29 [0.73, 2.29] |
| 16.2 Fortified donor breast milk | 2 | 219 | Risk Ratio (M‐H, Fixed, 95% CI) | 1.53 [0.42, 5.51] |
| 17 Necrotising enterocolitis Show forest plot | 6 | Risk Ratio (M‐H, Fixed, 95% CI) | Subtotals only | |
| Analysis 3.17  Comparison 3 Subgroup analysis: Formula (preterm) versus donor breast milk given (i) unfortified or (ii) fortified, Outcome 17 Necrotising enterocolitis. | ||||
| 17.1 Unfortified donor breast milk | 4 | 650 | Risk Ratio (M‐H, Fixed, 95% CI) | 3.30 [1.16, 9.41] |
| 17.2 Fortified donor breast milk | 2 | 219 | Risk Ratio (M‐H, Fixed, 95% CI) | 2.40 [0.98, 5.87] |
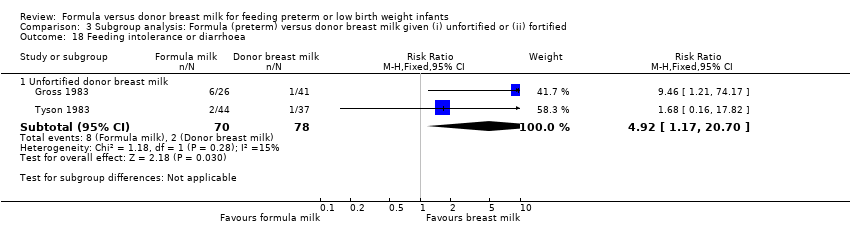
| 18 Feeding intolerance or diarrhoea Show forest plot | 2 | Risk Ratio (M‐H, Fixed, 95% CI) | Subtotals only | |
| Analysis 3.18  Comparison 3 Subgroup analysis: Formula (preterm) versus donor breast milk given (i) unfortified or (ii) fortified, Outcome 18 Feeding intolerance or diarrhoea. | ||||
| 18.1 Unfortified donor breast milk | 2 | 148 | Risk Ratio (M‐H, Fixed, 95% CI) | 4.92 [1.17, 20.70] |
| 19 Incidence of invasive infection Show forest plot | 2 | Risk Ratio (M‐H, Fixed, 95% CI) | Subtotals only | |
| Analysis 3.19  Comparison 3 Subgroup analysis: Formula (preterm) versus donor breast milk given (i) unfortified or (ii) fortified, Outcome 19 Incidence of invasive infection. | ||||
| 19.1 Fortified donor breast milk | 2 | 219 | Risk Ratio (M‐H, Fixed, 95% CI) | 1.12 [0.84, 1.49] |

Risk of bias graph: review authors' judgements about each risk of bias item presented as percentages across all included studies.

Forest plot of comparison: 1 Formula (term or preterm) versus donor breast milk, outcome: 1.1 Time to regain birth weight (days from birth).

Forest plot of comparison: 1 Formula (term or preterm) versus donor breast milk, outcome: 1.2 Short‐term weight change (g/kg/day).

Forest plot of comparison: 1 Formula (term or preterm) versus donor breast milk, outcome: 1.3 Short‐term change in crown‐heel length (mm/week).
Forest plot of comparison: 1 Formula (term or preterm) versus donor breast milk, outcome: 1.6 Short‐term change in head circumference (mm/week).
Forest plot of comparison: 1 Formula (term or preterm) versus donor breast milk, outcome: 1.20 Necrotising enterocolitis.
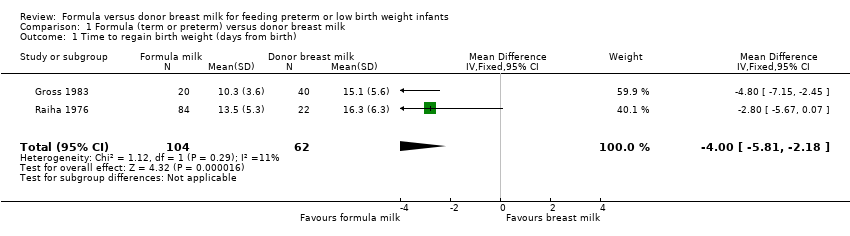
Comparison 1 Formula (term or preterm) versus donor breast milk, Outcome 1 Time to regain birth weight (days from birth).

Comparison 1 Formula (term or preterm) versus donor breast milk, Outcome 2 Short term weight change (g/kg/day).

Comparison 1 Formula (term or preterm) versus donor breast milk, Outcome 3 Short‐term change in crown‐heel length (mm/week).

Comparison 1 Formula (term or preterm) versus donor breast milk, Outcome 4 Short‐term change in crown‐rump length (mm/week).

Comparison 1 Formula (term or preterm) versus donor breast milk, Outcome 5 Short‐term change in femoral length (mm/week).
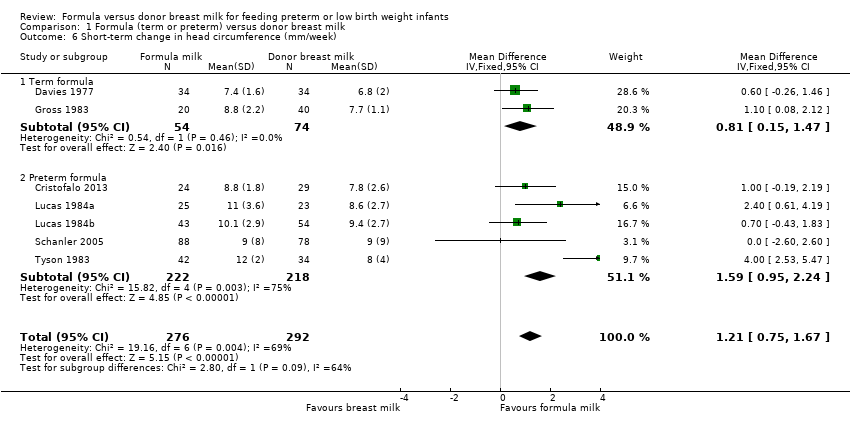
Comparison 1 Formula (term or preterm) versus donor breast milk, Outcome 6 Short‐term change in head circumference (mm/week).
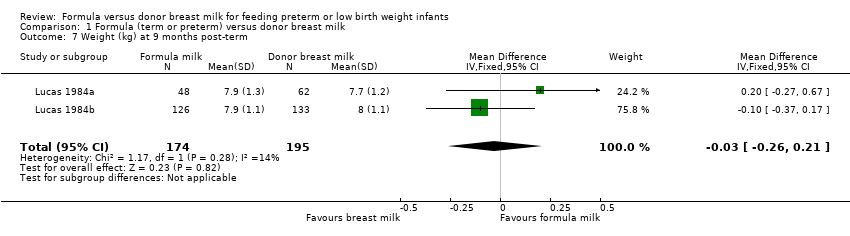
Comparison 1 Formula (term or preterm) versus donor breast milk, Outcome 7 Weight (kg) at 9 months post‐term.
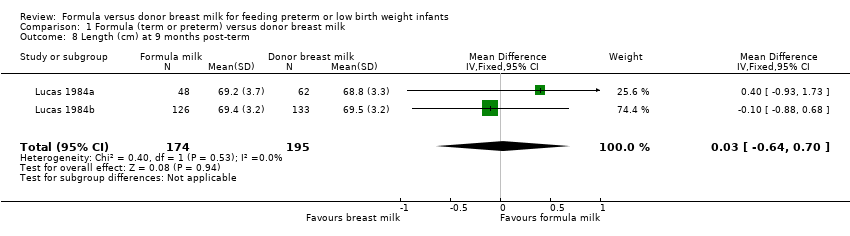
Comparison 1 Formula (term or preterm) versus donor breast milk, Outcome 8 Length (cm) at 9 months post‐term.

Comparison 1 Formula (term or preterm) versus donor breast milk, Outcome 9 Head circumference (cm) at 9 months post‐term.
Comparison 1 Formula (term or preterm) versus donor breast milk, Outcome 10 Weight (kg) at 18 months post‐term.

Comparison 1 Formula (term or preterm) versus donor breast milk, Outcome 11 Length (cm) at 18 months post‐term.

Comparison 1 Formula (term or preterm) versus donor breast milk, Outcome 12 Head circumference (cm) at 18 months post‐term.
Comparison 1 Formula (term or preterm) versus donor breast milk, Outcome 13 Weight (kg) at 7.5 to 8 years of age.

Comparison 1 Formula (term or preterm) versus donor breast milk, Outcome 14 Length (cm) at 7.5 to 8 years of age.

Comparison 1 Formula (term or preterm) versus donor breast milk, Outcome 15 Head circumference (cm) at 7.5 to 8 years of age.

Comparison 1 Formula (term or preterm) versus donor breast milk, Outcome 16 Bayley Mental Development Index at 18 months.
Comparison 1 Formula (term or preterm) versus donor breast milk, Outcome 17 Bayley Psychomotor Development Index at 18 months.

Comparison 1 Formula (term or preterm) versus donor breast milk, Outcome 18 Neurological impairment at 18 months.

Comparison 1 Formula (term or preterm) versus donor breast milk, Outcome 19 All‐cause mortality.

Comparison 1 Formula (term or preterm) versus donor breast milk, Outcome 20 Necrotising enterocolitis.

Comparison 1 Formula (term or preterm) versus donor breast milk, Outcome 21 Days after birth to establish full enteral feeding.

Comparison 1 Formula (term or preterm) versus donor breast milk, Outcome 22 Feeding intolerance or diarrhoea.

Comparison 1 Formula (term or preterm) versus donor breast milk, Outcome 23 Incidence of invasive infection.
Comparison 2 Subgroup analysis: Formula (preterm) versus donor breast milk given as (i) sole diet or (ii) a supplement to maternal expressed breast milk, Outcome 1 Short‐term weight change (g/kg/day).

Comparison 2 Subgroup analysis: Formula (preterm) versus donor breast milk given as (i) sole diet or (ii) a supplement to maternal expressed breast milk, Outcome 2 Short‐term change in crown‐heel length (mm/week).

Comparison 2 Subgroup analysis: Formula (preterm) versus donor breast milk given as (i) sole diet or (ii) a supplement to maternal expressed breast milk, Outcome 3 Short‐term change in head circumference (mm/week).

Comparison 2 Subgroup analysis: Formula (preterm) versus donor breast milk given as (i) sole diet or (ii) a supplement to maternal expressed breast milk, Outcome 4 Weight (kg) at 9 months post‐term.

Comparison 2 Subgroup analysis: Formula (preterm) versus donor breast milk given as (i) sole diet or (ii) a supplement to maternal expressed breast milk, Outcome 5 Length (cm) at 9 months post‐term.

Comparison 2 Subgroup analysis: Formula (preterm) versus donor breast milk given as (i) sole diet or (ii) a supplement to maternal expressed breast milk, Outcome 6 Head circumference (cm) at 9 months post‐term.

Comparison 2 Subgroup analysis: Formula (preterm) versus donor breast milk given as (i) sole diet or (ii) a supplement to maternal expressed breast milk, Outcome 7 Weight (kg) at 18 months post‐term.

Comparison 2 Subgroup analysis: Formula (preterm) versus donor breast milk given as (i) sole diet or (ii) a supplement to maternal expressed breast milk, Outcome 8 Length (cm) at 18 months post‐term.

Comparison 2 Subgroup analysis: Formula (preterm) versus donor breast milk given as (i) sole diet or (ii) a supplement to maternal expressed breast milk, Outcome 9 Head circumference (cm) at 18 months post‐term.
Comparison 2 Subgroup analysis: Formula (preterm) versus donor breast milk given as (i) sole diet or (ii) a supplement to maternal expressed breast milk, Outcome 10 Weight (kg) at 7.5 to 8 years of age.

Comparison 2 Subgroup analysis: Formula (preterm) versus donor breast milk given as (i) sole diet or (ii) a supplement to maternal expressed breast milk, Outcome 11 Length (cm) at 7.5 to 8 years of age.

Comparison 2 Subgroup analysis: Formula (preterm) versus donor breast milk given as (i) sole diet or (ii) a supplement to maternal expressed breast milk, Outcome 12 Head circumference (cm) at 7.5 to 8 years of age.

Comparison 2 Subgroup analysis: Formula (preterm) versus donor breast milk given as (i) sole diet or (ii) a supplement to maternal expressed breast milk, Outcome 13 Bayley Mental Development Index at 18 months.

Comparison 2 Subgroup analysis: Formula (preterm) versus donor breast milk given as (i) sole diet or (ii) a supplement to maternal expressed breast milk, Outcome 14 Bayley Psychomotor Development Index at 18 months.
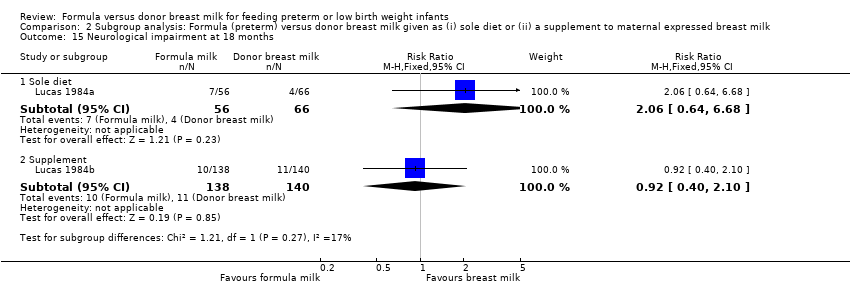
Comparison 2 Subgroup analysis: Formula (preterm) versus donor breast milk given as (i) sole diet or (ii) a supplement to maternal expressed breast milk, Outcome 15 Neurological impairment at 18 months.

Comparison 2 Subgroup analysis: Formula (preterm) versus donor breast milk given as (i) sole diet or (ii) a supplement to maternal expressed breast milk, Outcome 16 All‐cause mortality.

Comparison 2 Subgroup analysis: Formula (preterm) versus donor breast milk given as (i) sole diet or (ii) a supplement to maternal expressed breast milk, Outcome 17 Necrotising enterocolitis.
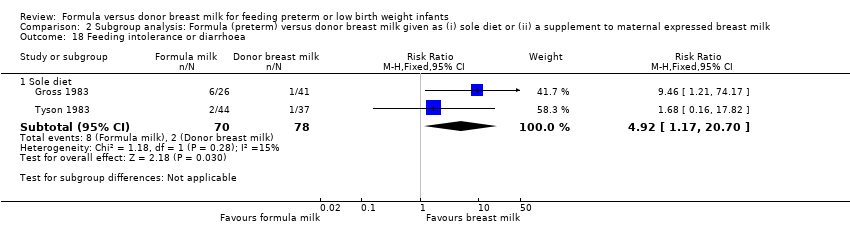
Comparison 2 Subgroup analysis: Formula (preterm) versus donor breast milk given as (i) sole diet or (ii) a supplement to maternal expressed breast milk, Outcome 18 Feeding intolerance or diarrhoea.
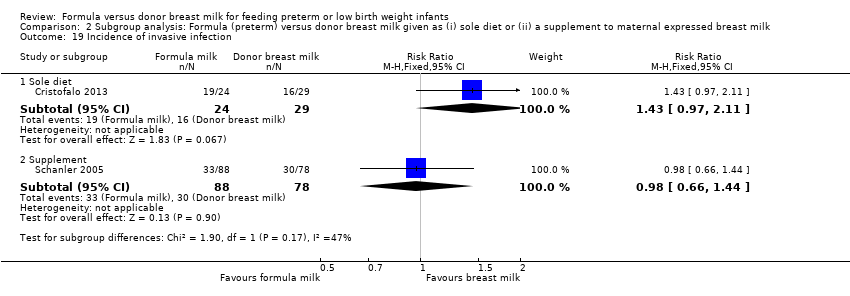
Comparison 2 Subgroup analysis: Formula (preterm) versus donor breast milk given as (i) sole diet or (ii) a supplement to maternal expressed breast milk, Outcome 19 Incidence of invasive infection.
Comparison 3 Subgroup analysis: Formula (preterm) versus donor breast milk given (i) unfortified or (ii) fortified, Outcome 1 Short‐term weight change (g/kg/day).

Comparison 3 Subgroup analysis: Formula (preterm) versus donor breast milk given (i) unfortified or (ii) fortified, Outcome 2 Short‐term change in crown‐heel length (mm/week).
Comparison 3 Subgroup analysis: Formula (preterm) versus donor breast milk given (i) unfortified or (ii) fortified, Outcome 3 Short‐term change in head circumference (mm/week).

Comparison 3 Subgroup analysis: Formula (preterm) versus donor breast milk given (i) unfortified or (ii) fortified, Outcome 4 Weight (kg) at 9 months post‐term.

Comparison 3 Subgroup analysis: Formula (preterm) versus donor breast milk given (i) unfortified or (ii) fortified, Outcome 5 Length (cm) at 9 months post‐term.

Comparison 3 Subgroup analysis: Formula (preterm) versus donor breast milk given (i) unfortified or (ii) fortified, Outcome 6 Head circumference (cm) at 9 months post‐term.

Comparison 3 Subgroup analysis: Formula (preterm) versus donor breast milk given (i) unfortified or (ii) fortified, Outcome 7 Weight (kg) at 18 months post‐term.

Comparison 3 Subgroup analysis: Formula (preterm) versus donor breast milk given (i) unfortified or (ii) fortified, Outcome 8 Length (cm) at 18 months post‐term.
Comparison 3 Subgroup analysis: Formula (preterm) versus donor breast milk given (i) unfortified or (ii) fortified, Outcome 9 Head circumference (cm) at 18 months post‐term.
Comparison 3 Subgroup analysis: Formula (preterm) versus donor breast milk given (i) unfortified or (ii) fortified, Outcome 10 Weight (kg) at 7.5 to 8 years of age.

Comparison 3 Subgroup analysis: Formula (preterm) versus donor breast milk given (i) unfortified or (ii) fortified, Outcome 11 Length (cm) at 7.5 to 8 years of age.

Comparison 3 Subgroup analysis: Formula (preterm) versus donor breast milk given (i) unfortified or (ii) fortified, Outcome 12 Head circumference (cm) at 7.5 to 8 years of age.
Comparison 3 Subgroup analysis: Formula (preterm) versus donor breast milk given (i) unfortified or (ii) fortified, Outcome 13 Bayley Mental Development Index at 18 months.
Comparison 3 Subgroup analysis: Formula (preterm) versus donor breast milk given (i) unfortified or (ii) fortified, Outcome 14 Bayley Psychomotor Development Index at 18 months.

Comparison 3 Subgroup analysis: Formula (preterm) versus donor breast milk given (i) unfortified or (ii) fortified, Outcome 15 Neurological impairment at 18 months.

Comparison 3 Subgroup analysis: Formula (preterm) versus donor breast milk given (i) unfortified or (ii) fortified, Outcome 16 All‐cause mortality.

Comparison 3 Subgroup analysis: Formula (preterm) versus donor breast milk given (i) unfortified or (ii) fortified, Outcome 17 Necrotising enterocolitis.
Comparison 3 Subgroup analysis: Formula (preterm) versus donor breast milk given (i) unfortified or (ii) fortified, Outcome 18 Feeding intolerance or diarrhoea.

Comparison 3 Subgroup analysis: Formula (preterm) versus donor breast milk given (i) unfortified or (ii) fortified, Outcome 19 Incidence of invasive infection.
| Outcome or subgroup title | No. of studies | No. of participants | Statistical method | Effect size |
| 1 Time to regain birth weight (days from birth) Show forest plot | 2 | 166 | Mean Difference (IV, Fixed, 95% CI) | ‐2.00 [‐5.81, ‐2.18] |
| 2 Short term weight change (g/kg/day) Show forest plot | 8 | 702 | Mean Difference (IV, Fixed, 95% CI) | 2.58 [1.98, 3.17] |
| 2.1 Term formula | 3 | 234 | Mean Difference (IV, Fixed, 95% CI) | 1.74 [0.96, 2.53] |
| 2.2 Preterm formula | 5 | 468 | Mean Difference (IV, Fixed, 95% CI) | 3.71 [2.79, 4.63] |
| 3 Short‐term change in crown‐heel length (mm/week) Show forest plot | 7 | 494 | Mean Difference (IV, Fixed, 95% CI) | 1.36 [0.87, 1.85] |
| 3.1 Term formula | 2 | 128 | Mean Difference (IV, Fixed, 95% CI) | 0.80 [0.10, 1.50] |
| 3.2 Preterm formula | 5 | 366 | Mean Difference (IV, Fixed, 95% CI) | 1.93 [1.23, 2.62] |
| 4 Short‐term change in crown‐rump length (mm/week) Show forest plot | 1 | Mean Difference (IV, Fixed, 95% CI) | Subtotals only | |
| 5 Short‐term change in femoral length (mm/week) Show forest plot | 1 | Mean Difference (IV, Fixed, 95% CI) | Subtotals only | |
| 6 Short‐term change in head circumference (mm/week) Show forest plot | 7 | 568 | Mean Difference (IV, Fixed, 95% CI) | 1.21 [0.75, 1.67] |
| 6.1 Term formula | 2 | 128 | Mean Difference (IV, Fixed, 95% CI) | 0.81 [0.15, 1.47] |
| 6.2 Preterm formula | 5 | 440 | Mean Difference (IV, Fixed, 95% CI) | 1.59 [0.95, 2.24] |
| 7 Weight (kg) at 9 months post‐term Show forest plot | 2 | 369 | Mean Difference (IV, Fixed, 95% CI) | ‐0.03 [‐0.26, 0.21] |
| 8 Length (cm) at 9 months post‐term Show forest plot | 2 | 369 | Mean Difference (IV, Fixed, 95% CI) | 0.03 [‐0.64, 0.70] |
| 9 Head circumference (cm) at 9 months post‐term Show forest plot | 2 | 369 | Mean Difference (IV, Fixed, 95% CI) | 0.20 [‐0.13, 0.53] |
| 10 Weight (kg) at 18 months post‐term Show forest plot | 2 | 438 | Mean Difference (IV, Fixed, 95% CI) | 0.10 [‐0.15, 0.35] |
| 11 Length (cm) at 18 months post‐term Show forest plot | 2 | 438 | Mean Difference (IV, Fixed, 95% CI) | 0.53 [‐0.15, 1.20] |
| 12 Head circumference (cm) at 18 months post‐term Show forest plot | 2 | 438 | Mean Difference (IV, Fixed, 95% CI) | 0.10 [‐0.19, 0.39] |
| 13 Weight (kg) at 7.5 to 8 years of age Show forest plot | 2 | 420 | Mean Difference (IV, Fixed, 95% CI) | ‐0.56 [‐1.42, 0.29] |
| 14 Length (cm) at 7.5 to 8 years of age Show forest plot | 2 | 420 | Mean Difference (IV, Fixed, 95% CI) | 0.05 [‐1.12, 1.23] |
| 15 Head circumference (cm) at 7.5 to 8 years of age Show forest plot | 2 | 420 | Mean Difference (IV, Fixed, 95% CI) | ‐0.19 [‐0.54, 0.16] |
| 16 Bayley Mental Development Index at 18 months Show forest plot | 2 | 387 | Mean Difference (IV, Fixed, 95% CI) | 1.24 [‐2.62, 5.09] |
| 17 Bayley Psychomotor Development Index at 18 months Show forest plot | 2 | 387 | Mean Difference (IV, Fixed, 95% CI) | ‐0.32 [‐3.43, 2.79] |
| 18 Neurological impairment at 18 months Show forest plot | 2 | 400 | Risk Ratio (M‐H, Fixed, 95% CI) | 1.21 [0.62, 2.35] |
| 19 All‐cause mortality Show forest plot | 4 | 721 | Risk Ratio (M‐H, Fixed, 95% CI) | 1.33 [0.79, 2.25] |
| 20 Necrotising enterocolitis Show forest plot | 6 | 869 | Risk Ratio (M‐H, Fixed, 95% CI) | 2.77 [1.40, 5.46] |
| 20.1 Term formula | 1 | 67 | Risk Ratio (M‐H, Fixed, 95% CI) | 4.73 [0.52, 43.09] |
| 20.2 Preterm formula | 5 | 802 | Risk Ratio (M‐H, Fixed, 95% CI) | 2.61 [1.27, 5.35] |
| 21 Days after birth to establish full enteral feeding Show forest plot | 1 | 53 | Mean Difference (IV, Fixed, 95% CI) | 4.70 [‐2.56, 11.96] |
| 22 Feeding intolerance or diarrhoea Show forest plot | 2 | 148 | Risk Difference (M‐H, Fixed, 95% CI) | 0.10 [0.01, 0.19] |
| 22.1 Term formula | 1 | 67 | Risk Difference (M‐H, Fixed, 95% CI) | 0.21 [0.04, 0.38] |
| 22.2 Preterm formula | 1 | 81 | Risk Difference (M‐H, Fixed, 95% CI) | 0.02 [‐0.06, 0.10] |
| 23 Incidence of invasive infection Show forest plot | 2 | 219 | Risk Ratio (M‐H, Fixed, 95% CI) | 1.12 [0.84, 1.49] |
| Outcome or subgroup title | No. of studies | No. of participants | Statistical method | Effect size |
| 1 Short‐term weight change (g/kg/day) Show forest plot | 8 | Mean Difference (IV, Fixed, 95% CI) | Subtotals only | |
| 1.1 Sole diet | 6 | 421 | Mean Difference (IV, Fixed, 95% CI) | 2.65 [1.94, 3.36] |
| 1.2 Supplement | 2 | 281 | Mean Difference (IV, Fixed, 95% CI) | 2.39 [1.28, 3.50] |
| 2 Short‐term change in crown‐heel length (mm/week) Show forest plot | 7 | Mean Difference (IV, Fixed, 95% CI) | Subtotals only | |
| 2.1 Sole diet | 5 | 283 | Mean Difference (IV, Fixed, 95% CI) | 1.54 [0.98, 2.11] |
| 2.2 Supplement | 2 | 211 | Mean Difference (IV, Fixed, 95% CI) | 0.75 [‐0.28, 1.78] |
| 3 Short‐term change in head circumference (mm/week) Show forest plot | 7 | Mean Difference (IV, Fixed, 95% CI) | Subtotals only | |
| 3.1 Sole diet | 5 | 305 | Mean Difference (IV, Fixed, 95% CI) | 1.36 [0.85, 1.88] |
| 3.2 Supplement | 2 | 263 | Mean Difference (IV, Fixed, 95% CI) | 0.59 [‐0.44, 1.62] |
| 4 Weight (kg) at 9 months post‐term Show forest plot | 2 | Mean Difference (IV, Fixed, 95% CI) | Subtotals only | |
| 4.1 Sole diet | 1 | 110 | Mean Difference (IV, Fixed, 95% CI) | 0.20 [‐0.27, 0.67] |
| 4.2 Supplement | 1 | 259 | Mean Difference (IV, Fixed, 95% CI) | ‐0.10 [‐0.37, 0.17] |
| 5 Length (cm) at 9 months post‐term Show forest plot | 2 | Mean Difference (IV, Fixed, 95% CI) | Subtotals only | |
| 5.1 Sole diet | 1 | 110 | Mean Difference (IV, Fixed, 95% CI) | 0.40 [‐0.93, 1.73] |
| 5.2 Supplement | 1 | 259 | Mean Difference (IV, Fixed, 95% CI) | ‐0.10 [‐0.88, 0.68] |
| 6 Head circumference (cm) at 9 months post‐term Show forest plot | 2 | Mean Difference (IV, Fixed, 95% CI) | Subtotals only | |
| 6.1 Sole diet | 1 | 110 | Mean Difference (IV, Fixed, 95% CI) | 0.20 [‐0.45, 0.85] |
| 6.2 Supplement | 1 | 259 | Mean Difference (IV, Fixed, 95% CI) | 0.20 [‐0.18, 0.58] |
| 7 Weight (kg) at 18 months post‐term Show forest plot | 2 | Mean Difference (IV, Fixed, 95% CI) | Subtotals only | |
| 7.1 Sole diet | 1 | 136 | Mean Difference (IV, Fixed, 95% CI) | 0.10 [‐0.37, 0.57] |
| 7.2 Supplement | 1 | 302 | Mean Difference (IV, Fixed, 95% CI) | 0.10 [‐0.19, 0.39] |
| 8 Length (cm) at 18 months post‐term Show forest plot | 2 | Mean Difference (IV, Fixed, 95% CI) | Subtotals only | |
| 8.1 Sole diet | 1 | 136 | Mean Difference (IV, Fixed, 95% CI) | 0.60 [‐0.68, 1.88] |
| 8.2 Supplement | 1 | 302 | Mean Difference (IV, Fixed, 95% CI) | 0.5 [‐0.29, 1.29] |
| 9 Head circumference (cm) at 18 months post‐term Show forest plot | 2 | Mean Difference (IV, Fixed, 95% CI) | Subtotals only | |
| 9.1 Sole diet | 1 | 136 | Mean Difference (IV, Fixed, 95% CI) | 0.10 [‐0.44, 0.64] |
| 9.2 Supplement | 1 | 302 | Mean Difference (IV, Fixed, 95% CI) | 0.10 [‐0.25, 0.45] |
| 10 Weight (kg) at 7.5 to 8 years of age Show forest plot | 2 | Mean Difference (IV, Fixed, 95% CI) | Subtotals only | |
| 10.1 Sole diet | 1 | 130 | Mean Difference (IV, Fixed, 95% CI) | 0.5 [‐1.24, 2.24] |
| 10.2 Supplement | 1 | 290 | Mean Difference (IV, Fixed, 95% CI) | ‐0.90 [‐1.88, 0.08] |
| 11 Length (cm) at 7.5 to 8 years of age Show forest plot | 2 | 420 | Mean Difference (IV, Fixed, 95% CI) | 0.05 [‐1.12, 1.23] |
| 11.1 Sole diet | 1 | 130 | Mean Difference (IV, Fixed, 95% CI) | 1.0 [‐1.26, 3.26] |
| 11.2 Supplement | 1 | 290 | Mean Difference (IV, Fixed, 95% CI) | ‐0.30 [‐1.68, 1.08] |
| 12 Head circumference (cm) at 7.5 to 8 years of age Show forest plot | 2 | 420 | Mean Difference (IV, Fixed, 95% CI) | ‐0.19 [‐0.54, 0.16] |
| 12.1 Sole diet | 1 | 130 | Mean Difference (IV, Fixed, 95% CI) | 0.10 [‐0.56, 0.76] |
| 12.2 Supplement | 1 | 290 | Mean Difference (IV, Fixed, 95% CI) | ‐0.30 [‐0.71, 0.11] |
| 13 Bayley Mental Development Index at 18 months Show forest plot | 2 | Mean Difference (IV, Fixed, 95% CI) | Subtotals only | |
| 13.1 Sole diet | 1 | 114 | Mean Difference (IV, Fixed, 95% CI) | 0.5 [‐6.21, 7.21] |
| 13.2 Supplement | 1 | 273 | Mean Difference (IV, Fixed, 95% CI) | 1.60 [‐3.11, 6.31] |
| 14 Bayley Psychomotor Development Index at 18 months Show forest plot | 2 | Mean Difference (IV, Fixed, 95% CI) | Subtotals only | |
| 14.1 Sole diet | 1 | 114 | Mean Difference (IV, Fixed, 95% CI) | 1.20 [‐4.38, 6.78] |
| 14.2 Supplement | 1 | 273 | Mean Difference (IV, Fixed, 95% CI) | ‐1.0 [‐4.74, 2.74] |
| 15 Neurological impairment at 18 months Show forest plot | 2 | Risk Ratio (M‐H, Fixed, 95% CI) | Subtotals only | |
| 15.1 Sole diet | 1 | 122 | Risk Ratio (M‐H, Fixed, 95% CI) | 2.06 [0.64, 6.68] |
| 15.2 Supplement | 1 | 278 | Risk Ratio (M‐H, Fixed, 95% CI) | 0.92 [0.40, 2.10] |
| 16 All‐cause mortality Show forest plot | 4 | Risk Ratio (M‐H, Fixed, 95% CI) | Subtotals only | |
| 16.1 Sole diet | 2 | 212 | Risk Ratio (M‐H, Fixed, 95% CI) | 1.70 [0.71, 4.07] |
| 16.2 Supplement | 2 | 509 | Risk Ratio (M‐H, Fixed, 95% CI) | 1.16 [0.60, 2.24] |
| 17 Necrotising enterocolitis Show forest plot | 6 | Risk Ratio (M‐H, Fixed, 95% CI) | Subtotals only | |
| 17.1 Sole diet | 4 | 360 | Risk Ratio (M‐H, Fixed, 95% CI) | 4.62 [1.47, 14.56] |
| 17.2 Supplement | 2 | 509 | Risk Ratio (M‐H, Fixed, 95% CI) | 1.96 [0.82, 4.67] |
| 18 Feeding intolerance or diarrhoea Show forest plot | 2 | Risk Ratio (M‐H, Fixed, 95% CI) | Subtotals only | |
| 18.1 Sole diet | 2 | 148 | Risk Ratio (M‐H, Fixed, 95% CI) | 4.92 [1.17, 20.70] |
| 19 Incidence of invasive infection Show forest plot | 2 | Risk Ratio (M‐H, Fixed, 95% CI) | Subtotals only | |
| 19.1 Sole diet | 1 | 53 | Risk Ratio (M‐H, Fixed, 95% CI) | 1.43 [0.97, 2.11] |
| 19.2 Supplement | 1 | 166 | Risk Ratio (M‐H, Fixed, 95% CI) | 0.98 [0.66, 1.44] |
| Outcome or subgroup title | No. of studies | No. of participants | Statistical method | Effect size |
| 1 Short‐term weight change (g/kg/day) Show forest plot | 8 | Mean Difference (IV, Fixed, 95% CI) | Subtotals only | |
| 1.1 Unfortified donor breast milk | 6 | 483 | Mean Difference (IV, Fixed, 95% CI) | 2.54 [1.89, 3.19] |
| 1.2 Fortified donor breast milk | 2 | 219 | Mean Difference (IV, Fixed, 95% CI) | 2.80 [1.20, 4.39] |
| 2 Short‐term change in crown‐heel length (mm/week) Show forest plot | 7 | Mean Difference (IV, Fixed, 95% CI) | Subtotals only | |
| 2.1 Unfortified donor breast milk | 5 | 275 | Mean Difference (IV, Fixed, 95% CI) | 1.26 [0.72, 1.80] |
| 2.2 Fortified donor breast milk | 2 | 219 | Mean Difference (IV, Fixed, 95% CI) | 1.86 [0.64, 3.07] |
| 3 Short‐term change in head circumference (mm/week) Show forest plot | 7 | Mean Difference (IV, Fixed, 95% CI) | Subtotals only | |
| 3.1 Unfortified donor breast milk | 5 | 349 | Mean Difference (IV, Fixed, 95% CI) | 1.29 [0.79, 1.80] |
| 3.2 Fortified donor breast milk | 2 | 219 | Mean Difference (IV, Fixed, 95% CI) | 0.83 [‐0.25, 1.91] |
| 4 Weight (kg) at 9 months post‐term Show forest plot | 2 | Mean Difference (IV, Fixed, 95% CI) | Subtotals only | |
| 4.1 Unfortified donor breast milk | 2 | 369 | Mean Difference (IV, Fixed, 95% CI) | ‐0.03 [‐0.26, 0.21] |
| 5 Length (cm) at 9 months post‐term Show forest plot | 2 | Mean Difference (IV, Fixed, 95% CI) | Subtotals only | |
| 5.1 Unfortified donor breast milk | 2 | 369 | Mean Difference (IV, Fixed, 95% CI) | 0.03 [‐0.64, 0.70] |
| 6 Head circumference (cm) at 9 months post‐term Show forest plot | 2 | Mean Difference (IV, Fixed, 95% CI) | Subtotals only | |
| 6.1 Unfortified donor breast milk | 2 | 369 | Mean Difference (IV, Fixed, 95% CI) | 0.20 [‐0.13, 0.53] |
| 7 Weight (kg) at 18 months post‐term Show forest plot | 2 | Mean Difference (IV, Fixed, 95% CI) | Subtotals only | |
| 7.1 Unfortified donor breast milk | 2 | 438 | Mean Difference (IV, Fixed, 95% CI) | 0.10 [‐0.15, 0.35] |
| 8 Length (cm) at 18 months post‐term Show forest plot | 2 | Mean Difference (IV, Fixed, 95% CI) | Subtotals only | |
| 8.1 Unfortified donor breast milk | 2 | 438 | Mean Difference (IV, Fixed, 95% CI) | 0.53 [‐0.15, 1.20] |
| 9 Head circumference (cm) at 18 months post‐term Show forest plot | 2 | Mean Difference (IV, Fixed, 95% CI) | Subtotals only | |
| 9.1 Unfortified donor breast milk | 2 | 438 | Mean Difference (IV, Fixed, 95% CI) | 0.10 [‐0.19, 0.39] |
| 10 Weight (kg) at 7.5 to 8 years of age Show forest plot | 2 | Mean Difference (IV, Fixed, 95% CI) | Subtotals only | |
| 10.1 Unfortified donor breast milk | 2 | 420 | Mean Difference (IV, Fixed, 95% CI) | ‐0.56 [‐1.42, 0.29] |
| 11 Length (cm) at 7.5 to 8 years of age Show forest plot | 2 | Mean Difference (IV, Fixed, 95% CI) | Subtotals only | |
| 11.1 Unfortified donor breast milk | 2 | 420 | Mean Difference (IV, Fixed, 95% CI) | 0.05 [‐1.12, 1.23] |
| 12 Head circumference (cm) at 7.5 to 8 years of age Show forest plot | 2 | Mean Difference (IV, Fixed, 95% CI) | Subtotals only | |
| 12.1 Unfortified donor breast milk | 2 | 420 | Mean Difference (IV, Fixed, 95% CI) | ‐0.19 [‐0.54, 0.16] |
| 13 Bayley Mental Development Index at 18 months Show forest plot | 2 | Mean Difference (IV, Fixed, 95% CI) | Subtotals only | |
| 13.1 Unfortified donor breast milk | 2 | 387 | Mean Difference (IV, Fixed, 95% CI) | 1.24 [‐2.62, 5.09] |
| 14 Bayley Psychomotor Development Index at 18 months Show forest plot | 2 | Mean Difference (IV, Fixed, 95% CI) | Subtotals only | |
| 14.1 Unfortified donor breast milk | 2 | 387 | Mean Difference (IV, Fixed, 95% CI) | ‐0.32 [‐3.43, 2.79] |
| 15 Neurological impairment at 18 months Show forest plot | 2 | Risk Ratio (M‐H, Fixed, 95% CI) | Subtotals only | |
| 15.1 Unfortified donor breast milk | 2 | 400 | Risk Ratio (M‐H, Fixed, 95% CI) | 1.21 [0.62, 2.35] |
| 16 All‐cause mortality Show forest plot | 4 | Risk Ratio (M‐H, Fixed, 95% CI) | Subtotals only | |
| 16.1 Unfortified donor breast milk | 2 | 502 | Risk Ratio (M‐H, Fixed, 95% CI) | 1.29 [0.73, 2.29] |
| 16.2 Fortified donor breast milk | 2 | 219 | Risk Ratio (M‐H, Fixed, 95% CI) | 1.53 [0.42, 5.51] |
| 17 Necrotising enterocolitis Show forest plot | 6 | Risk Ratio (M‐H, Fixed, 95% CI) | Subtotals only | |
| 17.1 Unfortified donor breast milk | 4 | 650 | Risk Ratio (M‐H, Fixed, 95% CI) | 3.30 [1.16, 9.41] |
| 17.2 Fortified donor breast milk | 2 | 219 | Risk Ratio (M‐H, Fixed, 95% CI) | 2.40 [0.98, 5.87] |
| 18 Feeding intolerance or diarrhoea Show forest plot | 2 | Risk Ratio (M‐H, Fixed, 95% CI) | Subtotals only | |
| 18.1 Unfortified donor breast milk | 2 | 148 | Risk Ratio (M‐H, Fixed, 95% CI) | 4.92 [1.17, 20.70] |
| 19 Incidence of invasive infection Show forest plot | 2 | Risk Ratio (M‐H, Fixed, 95% CI) | Subtotals only | |
| 19.1 Fortified donor breast milk | 2 | 219 | Risk Ratio (M‐H, Fixed, 95% CI) | 1.12 [0.84, 1.49] |