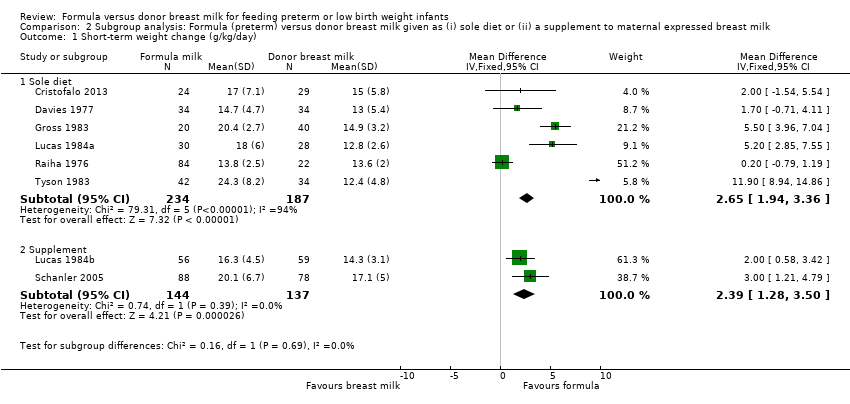
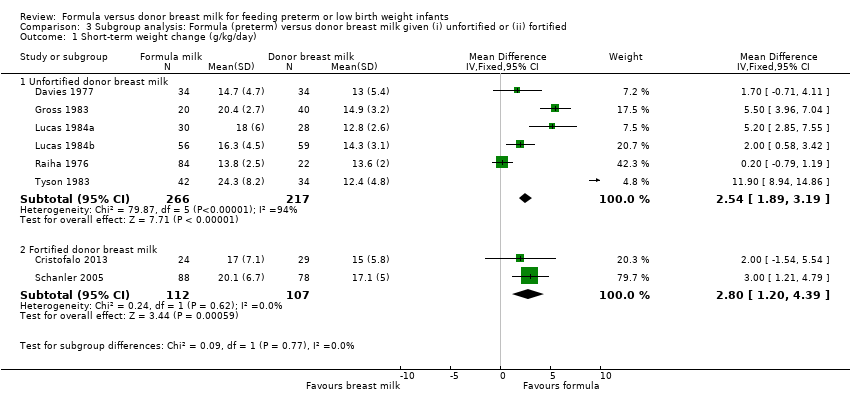
| 1 Short‐term weight change (g/kg/day) Show forest plot | 8 | | Mean Difference (IV, Fixed, 95% CI) | Subtotals only |
|
| 1.1 Sole diet | 6 | 421 | Mean Difference (IV, Fixed, 95% CI) | 2.65 [1.94, 3.36] |
| 1.2 Supplement | 2 | 281 | Mean Difference (IV, Fixed, 95% CI) | 2.39 [1.28, 3.50] |
| 2 Short‐term change in crown‐heel length (mm/week) Show forest plot | 7 | | Mean Difference (IV, Fixed, 95% CI) | Subtotals only |
|
| 2.1 Sole diet | 5 | 283 | Mean Difference (IV, Fixed, 95% CI) | 1.54 [0.98, 2.11] |
| 2.2 Supplement | 2 | 211 | Mean Difference (IV, Fixed, 95% CI) | 0.75 [‐0.28, 1.78] |
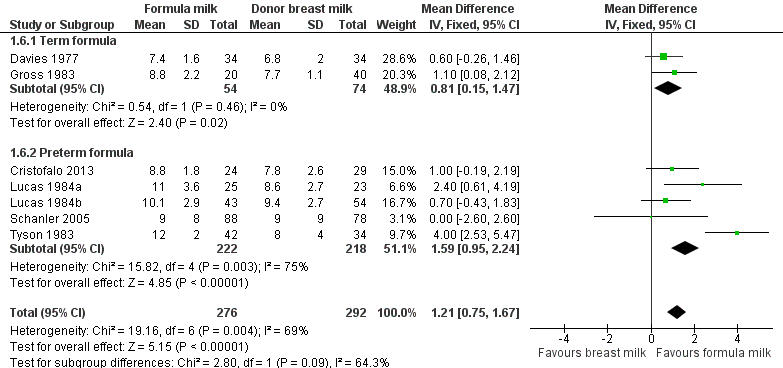
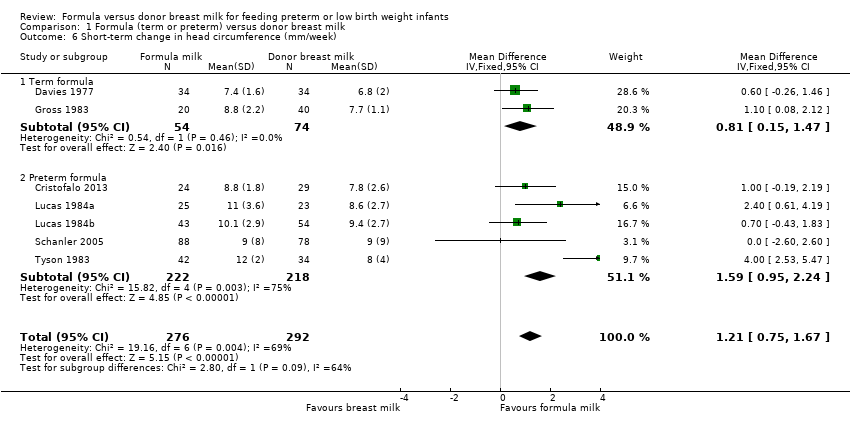
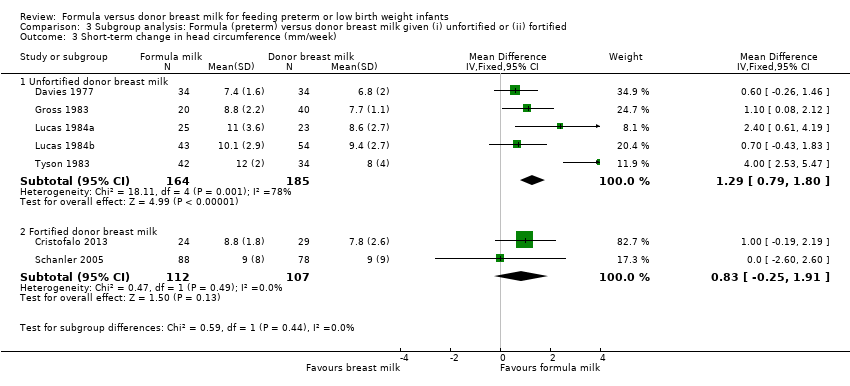
| 3 Short‐term change in head circumference (mm/week) Show forest plot | 7 | | Mean Difference (IV, Fixed, 95% CI) | Subtotals only |
|
| 3.1 Sole diet | 5 | 305 | Mean Difference (IV, Fixed, 95% CI) | 1.36 [0.85, 1.88] |
| 3.2 Supplement | 2 | 263 | Mean Difference (IV, Fixed, 95% CI) | 0.59 [‐0.44, 1.62] |
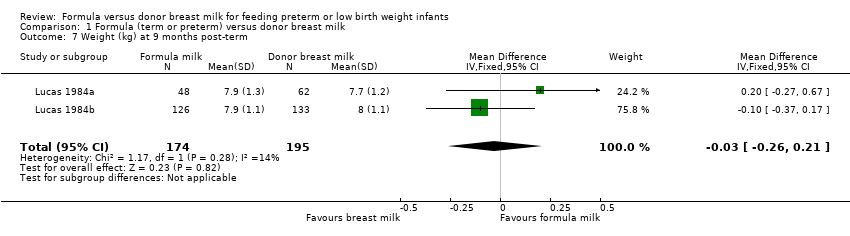
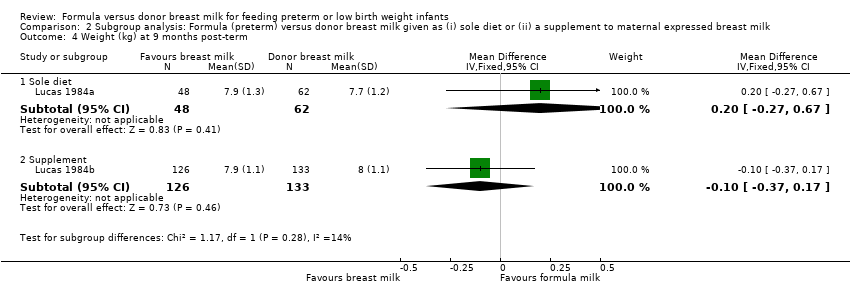
| 4 Weight (kg) at 9 months post‐term Show forest plot | 2 | | Mean Difference (IV, Fixed, 95% CI) | Subtotals only |
|
| 4.1 Sole diet | 1 | 110 | Mean Difference (IV, Fixed, 95% CI) | 0.20 [‐0.27, 0.67] |
| 4.2 Supplement | 1 | 259 | Mean Difference (IV, Fixed, 95% CI) | ‐0.10 [‐0.37, 0.17] |
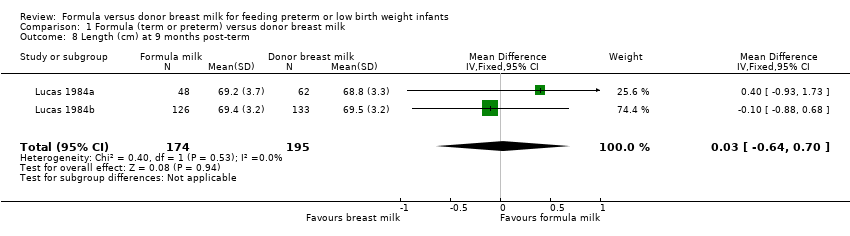
| 5 Length (cm) at 9 months post‐term Show forest plot | 2 | | Mean Difference (IV, Fixed, 95% CI) | Subtotals only |
|
| 5.1 Sole diet | 1 | 110 | Mean Difference (IV, Fixed, 95% CI) | 0.40 [‐0.93, 1.73] |
| 5.2 Supplement | 1 | 259 | Mean Difference (IV, Fixed, 95% CI) | ‐0.10 [‐0.88, 0.68] |
| 6 Head circumference (cm) at 9 months post‐term Show forest plot | 2 | | Mean Difference (IV, Fixed, 95% CI) | Subtotals only |
|
| 6.1 Sole diet | 1 | 110 | Mean Difference (IV, Fixed, 95% CI) | 0.20 [‐0.45, 0.85] |
| 6.2 Supplement | 1 | 259 | Mean Difference (IV, Fixed, 95% CI) | 0.20 [‐0.18, 0.58] |
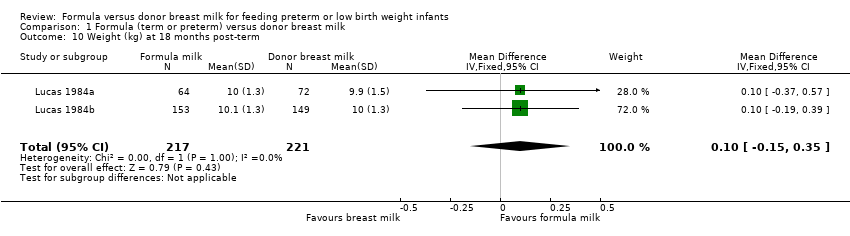
| 7 Weight (kg) at 18 months post‐term Show forest plot | 2 | | Mean Difference (IV, Fixed, 95% CI) | Subtotals only |
|
| 7.1 Sole diet | 1 | 136 | Mean Difference (IV, Fixed, 95% CI) | 0.10 [‐0.37, 0.57] |
| 7.2 Supplement | 1 | 302 | Mean Difference (IV, Fixed, 95% CI) | 0.10 [‐0.19, 0.39] |
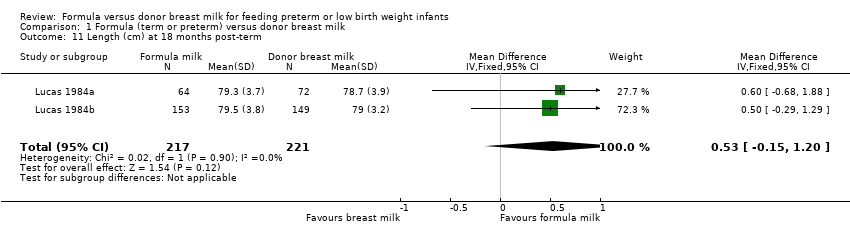
| 8 Length (cm) at 18 months post‐term Show forest plot | 2 | | Mean Difference (IV, Fixed, 95% CI) | Subtotals only |
|
| 8.1 Sole diet | 1 | 136 | Mean Difference (IV, Fixed, 95% CI) | 0.60 [‐0.68, 1.88] |
| 8.2 Supplement | 1 | 302 | Mean Difference (IV, Fixed, 95% CI) | 0.5 [‐0.29, 1.29] |
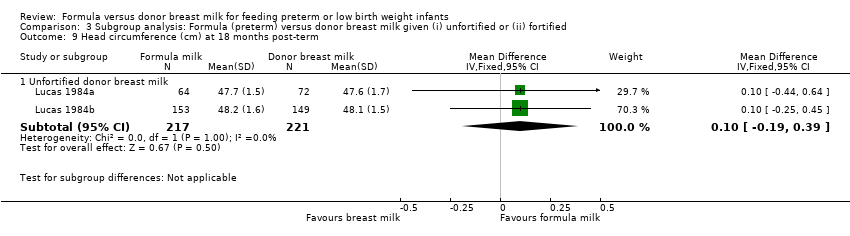
| 9 Head circumference (cm) at 18 months post‐term Show forest plot | 2 | | Mean Difference (IV, Fixed, 95% CI) | Subtotals only |
|
| 9.1 Sole diet | 1 | 136 | Mean Difference (IV, Fixed, 95% CI) | 0.10 [‐0.44, 0.64] |
| 9.2 Supplement | 1 | 302 | Mean Difference (IV, Fixed, 95% CI) | 0.10 [‐0.25, 0.45] |
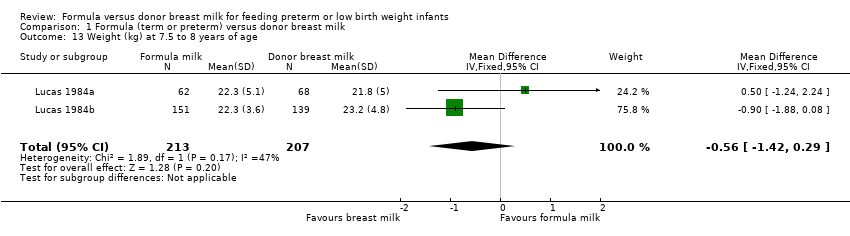
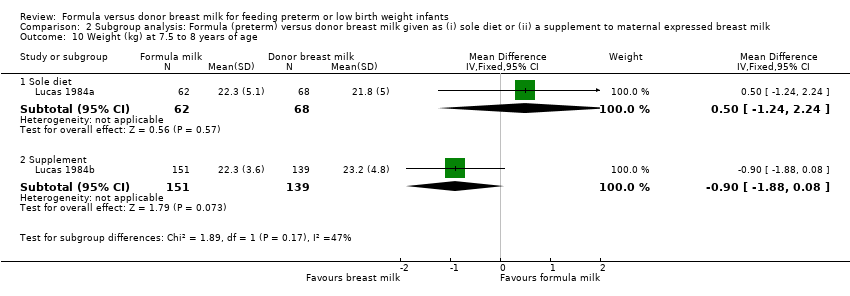
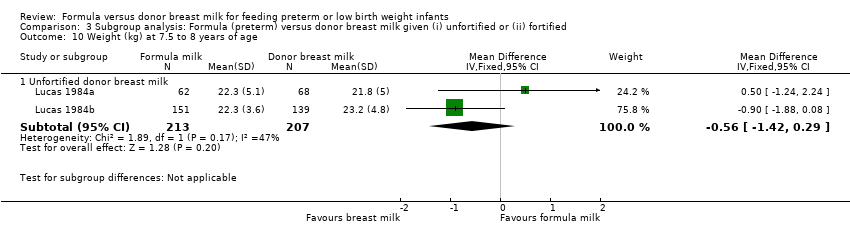
| 10 Weight (kg) at 7.5 to 8 years of age Show forest plot | 2 | | Mean Difference (IV, Fixed, 95% CI) | Subtotals only |
|
| 10.1 Sole diet | 1 | 130 | Mean Difference (IV, Fixed, 95% CI) | 0.5 [‐1.24, 2.24] |
| 10.2 Supplement | 1 | 290 | Mean Difference (IV, Fixed, 95% CI) | ‐0.90 [‐1.88, 0.08] |
| 11 Length (cm) at 7.5 to 8 years of age Show forest plot | 2 | 420 | Mean Difference (IV, Fixed, 95% CI) | 0.05 [‐1.12, 1.23] |
|
| 11.1 Sole diet | 1 | 130 | Mean Difference (IV, Fixed, 95% CI) | 1.0 [‐1.26, 3.26] |
| 11.2 Supplement | 1 | 290 | Mean Difference (IV, Fixed, 95% CI) | ‐0.30 [‐1.68, 1.08] |
| 12 Head circumference (cm) at 7.5 to 8 years of age Show forest plot | 2 | 420 | Mean Difference (IV, Fixed, 95% CI) | ‐0.19 [‐0.54, 0.16] |
|
| 12.1 Sole diet | 1 | 130 | Mean Difference (IV, Fixed, 95% CI) | 0.10 [‐0.56, 0.76] |
| 12.2 Supplement | 1 | 290 | Mean Difference (IV, Fixed, 95% CI) | ‐0.30 [‐0.71, 0.11] |
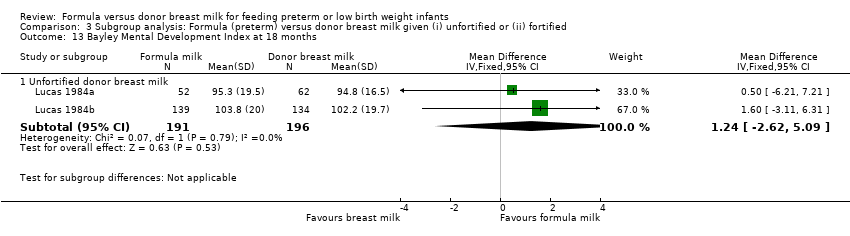
| 13 Bayley Mental Development Index at 18 months Show forest plot | 2 | | Mean Difference (IV, Fixed, 95% CI) | Subtotals only |
|
| 13.1 Sole diet | 1 | 114 | Mean Difference (IV, Fixed, 95% CI) | 0.5 [‐6.21, 7.21] |
| 13.2 Supplement | 1 | 273 | Mean Difference (IV, Fixed, 95% CI) | 1.60 [‐3.11, 6.31] |
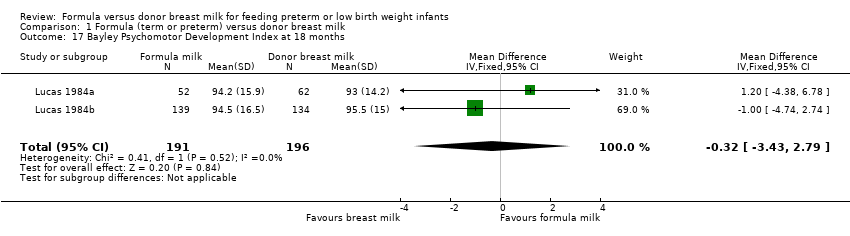
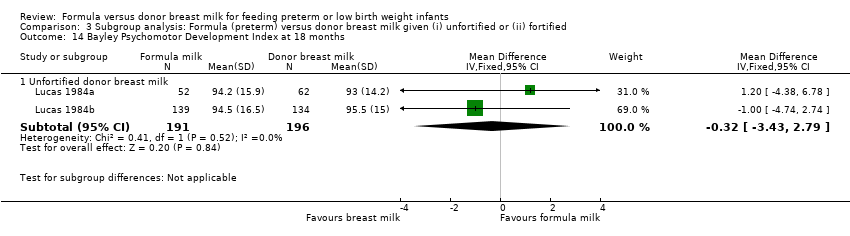
| 14 Bayley Psychomotor Development Index at 18 months Show forest plot | 2 | | Mean Difference (IV, Fixed, 95% CI) | Subtotals only |
|
| 14.1 Sole diet | 1 | 114 | Mean Difference (IV, Fixed, 95% CI) | 1.20 [‐4.38, 6.78] |
| 14.2 Supplement | 1 | 273 | Mean Difference (IV, Fixed, 95% CI) | ‐1.0 [‐4.74, 2.74] |
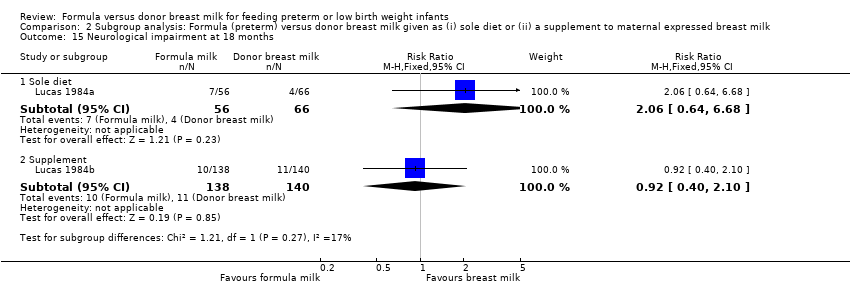
| 15 Neurological impairment at 18 months Show forest plot | 2 | | Risk Ratio (M‐H, Fixed, 95% CI) | Subtotals only |
|
| 15.1 Sole diet | 1 | 122 | Risk Ratio (M‐H, Fixed, 95% CI) | 2.06 [0.64, 6.68] |
| 15.2 Supplement | 1 | 278 | Risk Ratio (M‐H, Fixed, 95% CI) | 0.92 [0.40, 2.10] |
| 16 All‐cause mortality Show forest plot | 4 | | Risk Ratio (M‐H, Fixed, 95% CI) | Subtotals only |
|
| 16.1 Sole diet | 2 | 212 | Risk Ratio (M‐H, Fixed, 95% CI) | 1.70 [0.71, 4.07] |
| 16.2 Supplement | 2 | 509 | Risk Ratio (M‐H, Fixed, 95% CI) | 1.16 [0.60, 2.24] |
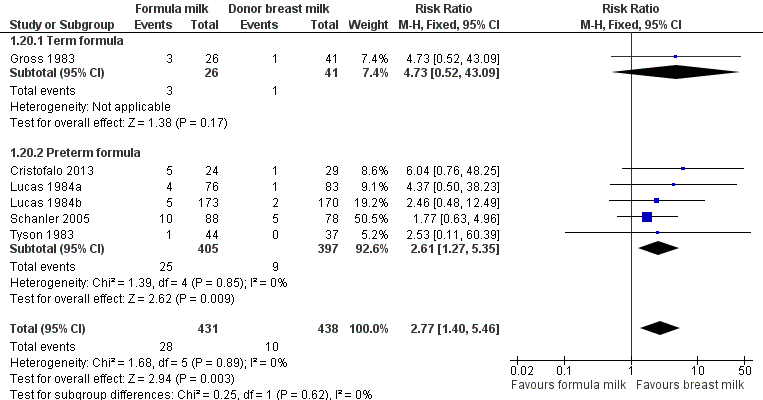
| 17 Necrotising enterocolitis Show forest plot | 6 | | Risk Ratio (M‐H, Fixed, 95% CI) | Subtotals only |
|
| 17.1 Sole diet | 4 | 360 | Risk Ratio (M‐H, Fixed, 95% CI) | 4.62 [1.47, 14.56] |
| 17.2 Supplement | 2 | 509 | Risk Ratio (M‐H, Fixed, 95% CI) | 1.96 [0.82, 4.67] |
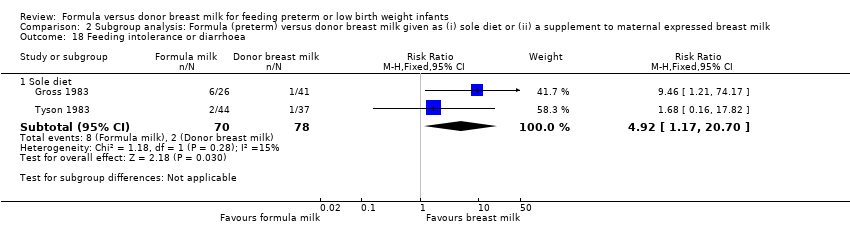
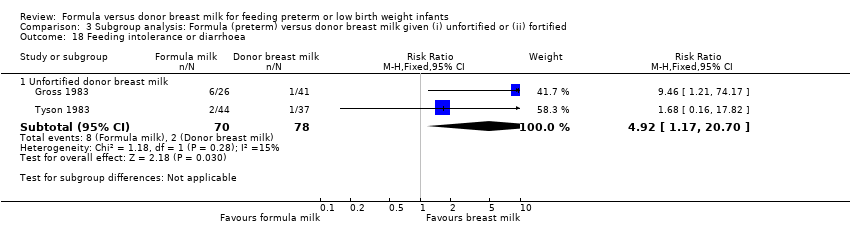
| 18 Feeding intolerance or diarrhoea Show forest plot | 2 | | Risk Ratio (M‐H, Fixed, 95% CI) | Subtotals only |
|
| 18.1 Sole diet | 2 | 148 | Risk Ratio (M‐H, Fixed, 95% CI) | 4.92 [1.17, 20.70] |
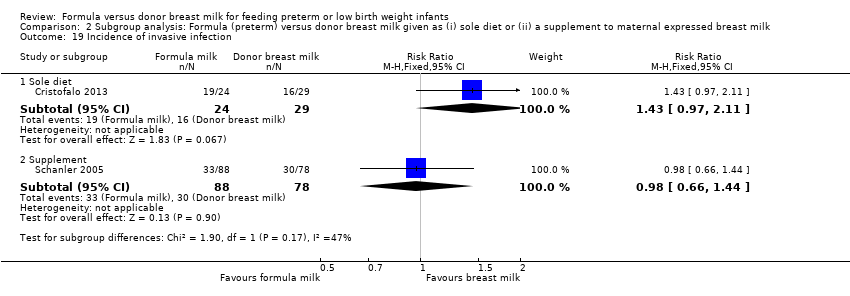
| 19 Incidence of invasive infection Show forest plot | 2 | | Risk Ratio (M‐H, Fixed, 95% CI) | Subtotals only |
|
| 19.1 Sole diet | 1 | 53 | Risk Ratio (M‐H, Fixed, 95% CI) | 1.43 [0.97, 2.11] |
| 19.2 Supplement | 1 | 166 | Risk Ratio (M‐H, Fixed, 95% CI) | 0.98 [0.66, 1.44] |