Formula versus donor breast milk for feeding preterm or low birth weight infants
Información
- DOI:
- https://doi.org/10.1002/14651858.CD002971.pub3Copiar DOI

- Base de datos:
-
- Cochrane Database of Systematic Reviews
- Versión publicada:
-
- 22 abril 2014see what's new
- Tipo:
-
- Intervention
- Etapa:
-
- Review
- Grupo Editorial Cochrane:
-
Grupo Cochrane de Neonatología
- Copyright:
-
- Copyright © 2014 The Cochrane Collaboration. Published by John Wiley & Sons, Ltd.
Cifras del artículo
Altmetric:
Citado por:
Autores
Contributions of authors
William McGuire (WM) and Mary Anthony developed the protocol and undertook the original review in 2000. Ginny Henderson and WM updated the review in 2003. Maria Quigley and WM revised the protocol and updated the review in 2007 and in 2014.
Sources of support
Internal sources
-
National Perinatal Epidemiology Unit, UK.
-
Centre for Reviews and Dissemination, University of York, UK.
External sources
-
National Institute for Health Research, UK.
-
Tenovus, Scotland, UK.
-
Eunice Kennedy Shriver National Institute of Child Health and Human Development National Institutes of Health, Department of Health and Human Services, USA.
Editorial support of the Cochrane Neonatal Review Group has been funded with Federal funds from the Eunice Kennedy Shriver National Institute of Child Health and Human Development National Institutes of Health, Department of Health and Human Services, USA, under Contract No. HHSN275201100016C.
-
Department of Health, UK.
Declarations of interest
William McGuire and Maria Quigley do not have any declarations of interest.
Acknowledgements
We thanks Mary Anthony and Ginny Henderson for contributing to previous versions of this review.
This report is independent research funded by a UK National Institute of Health Research Grant (NIHR) Cochrane Programme Grant (13/89/12). The views expressed in this publication are those of the authors and not necessarily those of the NHS, the NIHR, or the UK Department of Health.
Version history
| Published | Title | Stage | Authors | Version |
| 2019 Jul 19 | Formula versus donor breast milk for feeding preterm or low birth weight infants | Review | Maria Quigley, Nicholas D Embleton, William McGuire | |
| 2018 Jun 20 | Formula versus donor breast milk for feeding preterm or low birth weight infants | Review | Maria Quigley, Nicholas D Embleton, William McGuire | |
| 2014 Apr 22 | Formula versus donor breast milk for feeding preterm or low birth weight infants | Review | Maria Quigley, William McGuire | |
| 2007 Oct 17 | Formula milk versus donor breast milk for feeding preterm or low birth weight infants | Review | Maria Quigley, Ginny Henderson, Mary Y Anthony, William McGuire | |
| 2001 Oct 23 | Formula milk versus term human milk for feeding preterm or low birth weight infants | Review | Ginny Henderson, Mary Y Anthony, William McGuire, Maria Quigley | |
Differences between protocol and review
We revised the structure of the review in 2007. We now include:
1. Trials that compared feeding with formula milk with either term or preterm donor breast milk (inception protocol and review restricted to term breast milk).
2. Trials that compared feeding with formula versus donor breast milk as a sole diet or as a supplement to maternal expressed breast milk (inception protocol and review restricted to sole diet).
Keywords
MeSH
Medical Subject Headings (MeSH) Keywords
- *Infant Formula;
- *Milk, Human;
- Child Development;
- Enteral Nutrition [*methods];
- Food, Fortified;
- Head [growth & development];
- Infant Nutritional Physiological Phenomena;
- Infant, Low Birth Weight [*growth & development];
- Infant, Premature [*growth & development];
- Randomized Controlled Trials as Topic;
- Weight Gain;
Medical Subject Headings Check Words
Humans; Infant, Newborn;
PICO

Risk of bias graph: review authors' judgements about each risk of bias item presented as percentages across all included studies.

Forest plot of comparison: 1 Formula (term or preterm) versus donor breast milk, outcome: 1.1 Time to regain birth weight (days from birth).

Forest plot of comparison: 1 Formula (term or preterm) versus donor breast milk, outcome: 1.2 Short‐term weight change (g/kg/day).

Forest plot of comparison: 1 Formula (term or preterm) versus donor breast milk, outcome: 1.3 Short‐term change in crown‐heel length (mm/week).
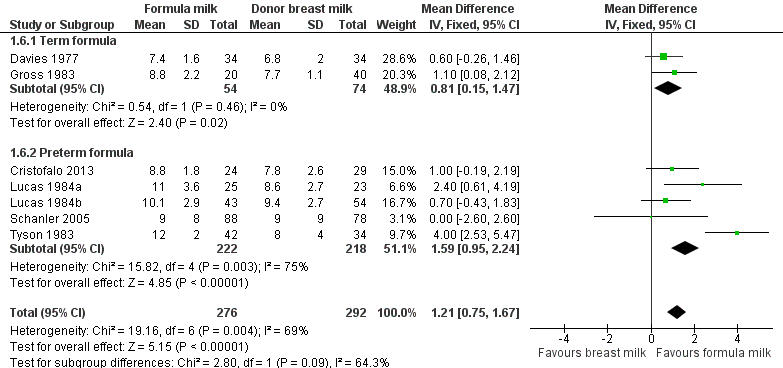
Forest plot of comparison: 1 Formula (term or preterm) versus donor breast milk, outcome: 1.6 Short‐term change in head circumference (mm/week).
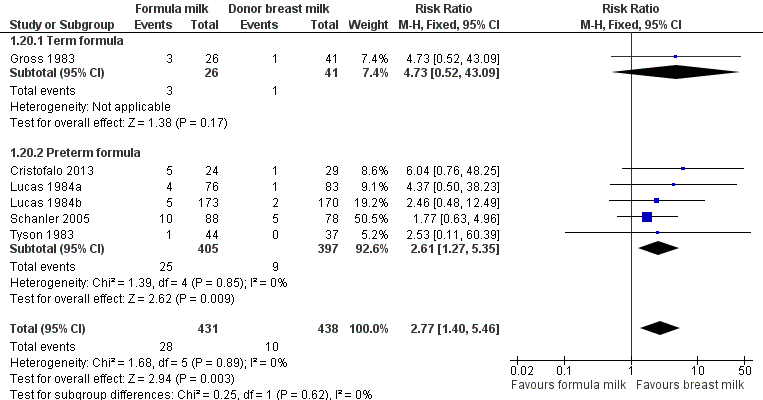
Forest plot of comparison: 1 Formula (term or preterm) versus donor breast milk, outcome: 1.20 Necrotising enterocolitis.
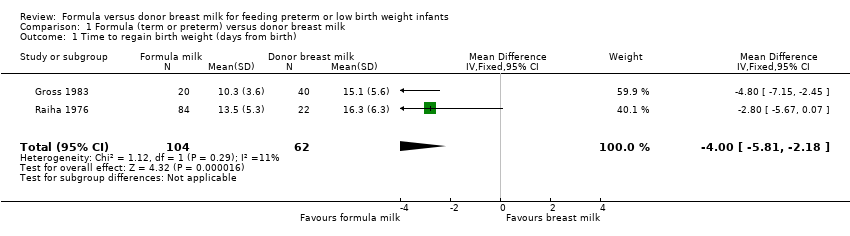
Comparison 1 Formula (term or preterm) versus donor breast milk, Outcome 1 Time to regain birth weight (days from birth).

Comparison 1 Formula (term or preterm) versus donor breast milk, Outcome 2 Short term weight change (g/kg/day).

Comparison 1 Formula (term or preterm) versus donor breast milk, Outcome 3 Short‐term change in crown‐heel length (mm/week).

Comparison 1 Formula (term or preterm) versus donor breast milk, Outcome 4 Short‐term change in crown‐rump length (mm/week).

Comparison 1 Formula (term or preterm) versus donor breast milk, Outcome 5 Short‐term change in femoral length (mm/week).
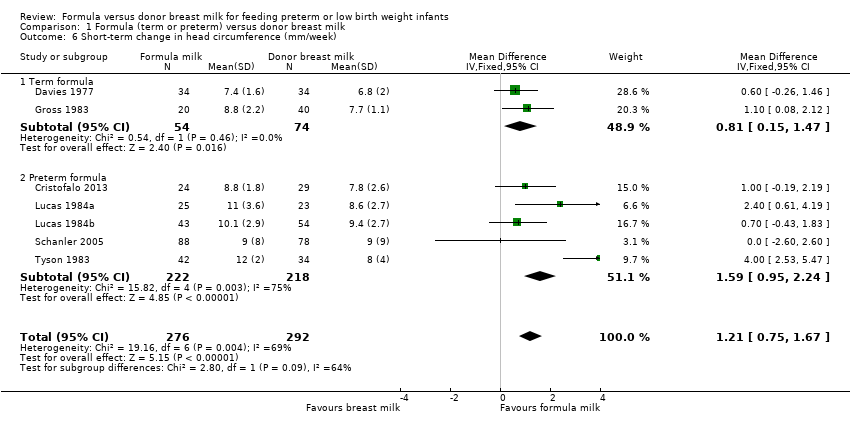
Comparison 1 Formula (term or preterm) versus donor breast milk, Outcome 6 Short‐term change in head circumference (mm/week).
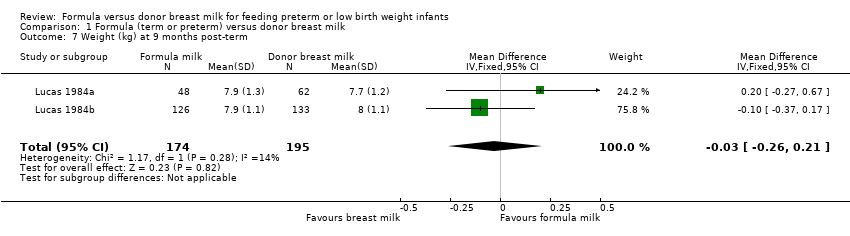
Comparison 1 Formula (term or preterm) versus donor breast milk, Outcome 7 Weight (kg) at 9 months post‐term.
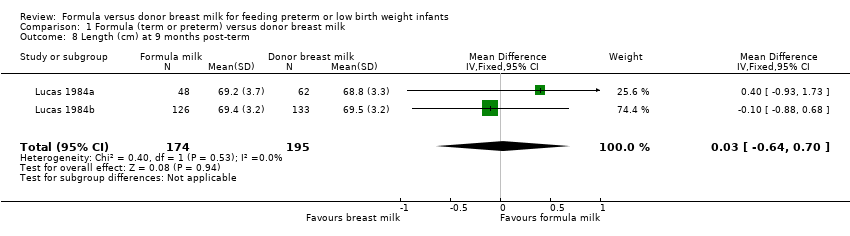
Comparison 1 Formula (term or preterm) versus donor breast milk, Outcome 8 Length (cm) at 9 months post‐term.

Comparison 1 Formula (term or preterm) versus donor breast milk, Outcome 9 Head circumference (cm) at 9 months post‐term.
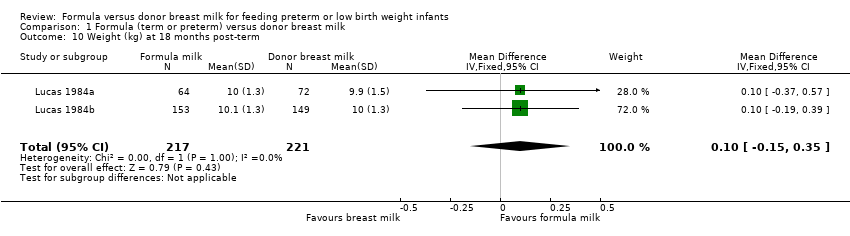
Comparison 1 Formula (term or preterm) versus donor breast milk, Outcome 10 Weight (kg) at 18 months post‐term.
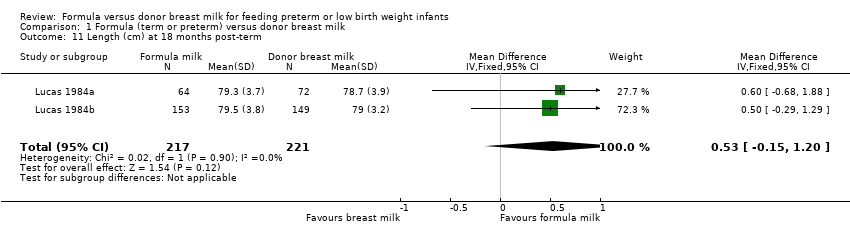
Comparison 1 Formula (term or preterm) versus donor breast milk, Outcome 11 Length (cm) at 18 months post‐term.

Comparison 1 Formula (term or preterm) versus donor breast milk, Outcome 12 Head circumference (cm) at 18 months post‐term.
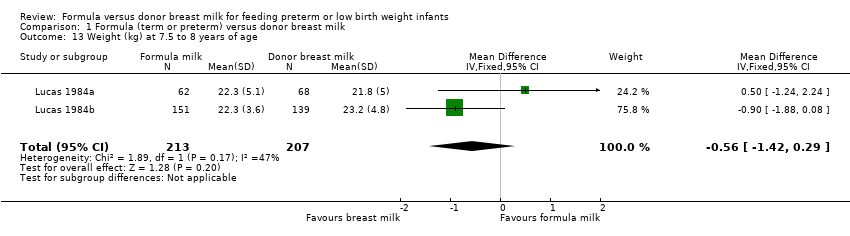
Comparison 1 Formula (term or preterm) versus donor breast milk, Outcome 13 Weight (kg) at 7.5 to 8 years of age.

Comparison 1 Formula (term or preterm) versus donor breast milk, Outcome 14 Length (cm) at 7.5 to 8 years of age.

Comparison 1 Formula (term or preterm) versus donor breast milk, Outcome 15 Head circumference (cm) at 7.5 to 8 years of age.

Comparison 1 Formula (term or preterm) versus donor breast milk, Outcome 16 Bayley Mental Development Index at 18 months.
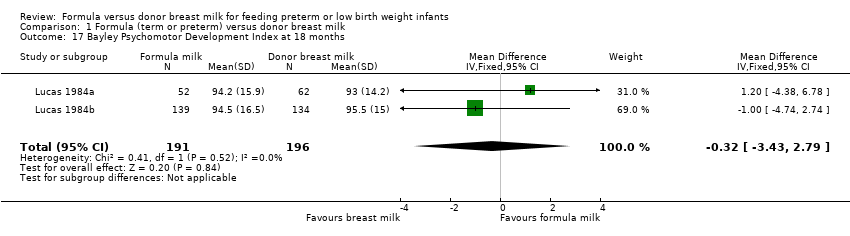
Comparison 1 Formula (term or preterm) versus donor breast milk, Outcome 17 Bayley Psychomotor Development Index at 18 months.

Comparison 1 Formula (term or preterm) versus donor breast milk, Outcome 18 Neurological impairment at 18 months.

Comparison 1 Formula (term or preterm) versus donor breast milk, Outcome 19 All‐cause mortality.

Comparison 1 Formula (term or preterm) versus donor breast milk, Outcome 20 Necrotising enterocolitis.

Comparison 1 Formula (term or preterm) versus donor breast milk, Outcome 21 Days after birth to establish full enteral feeding.

Comparison 1 Formula (term or preterm) versus donor breast milk, Outcome 22 Feeding intolerance or diarrhoea.

Comparison 1 Formula (term or preterm) versus donor breast milk, Outcome 23 Incidence of invasive infection.
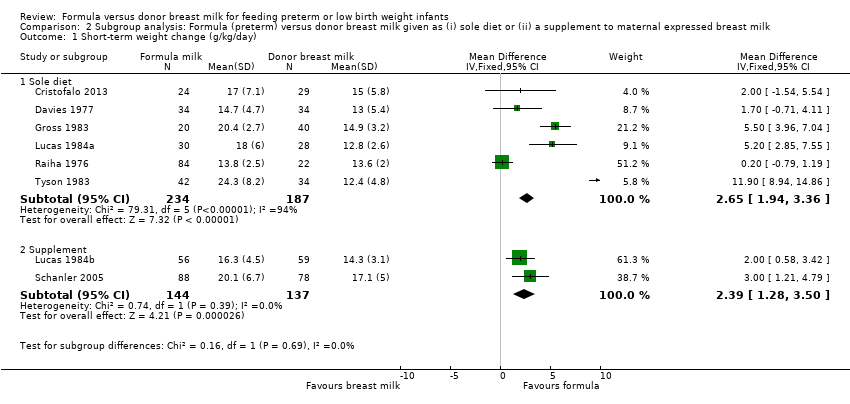
Comparison 2 Subgroup analysis: Formula (preterm) versus donor breast milk given as (i) sole diet or (ii) a supplement to maternal expressed breast milk, Outcome 1 Short‐term weight change (g/kg/day).

Comparison 2 Subgroup analysis: Formula (preterm) versus donor breast milk given as (i) sole diet or (ii) a supplement to maternal expressed breast milk, Outcome 2 Short‐term change in crown‐heel length (mm/week).

Comparison 2 Subgroup analysis: Formula (preterm) versus donor breast milk given as (i) sole diet or (ii) a supplement to maternal expressed breast milk, Outcome 3 Short‐term change in head circumference (mm/week).
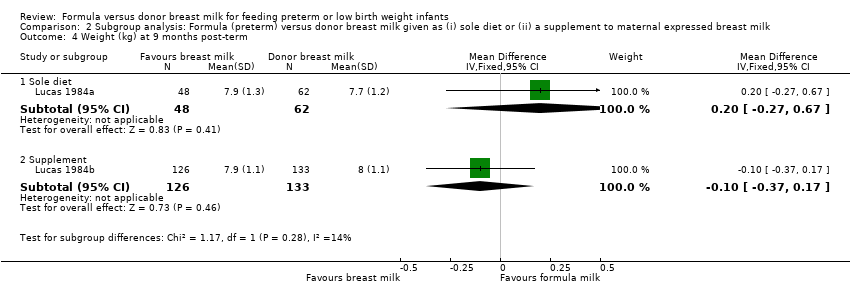
Comparison 2 Subgroup analysis: Formula (preterm) versus donor breast milk given as (i) sole diet or (ii) a supplement to maternal expressed breast milk, Outcome 4 Weight (kg) at 9 months post‐term.

Comparison 2 Subgroup analysis: Formula (preterm) versus donor breast milk given as (i) sole diet or (ii) a supplement to maternal expressed breast milk, Outcome 5 Length (cm) at 9 months post‐term.

Comparison 2 Subgroup analysis: Formula (preterm) versus donor breast milk given as (i) sole diet or (ii) a supplement to maternal expressed breast milk, Outcome 6 Head circumference (cm) at 9 months post‐term.

Comparison 2 Subgroup analysis: Formula (preterm) versus donor breast milk given as (i) sole diet or (ii) a supplement to maternal expressed breast milk, Outcome 7 Weight (kg) at 18 months post‐term.

Comparison 2 Subgroup analysis: Formula (preterm) versus donor breast milk given as (i) sole diet or (ii) a supplement to maternal expressed breast milk, Outcome 8 Length (cm) at 18 months post‐term.

Comparison 2 Subgroup analysis: Formula (preterm) versus donor breast milk given as (i) sole diet or (ii) a supplement to maternal expressed breast milk, Outcome 9 Head circumference (cm) at 18 months post‐term.
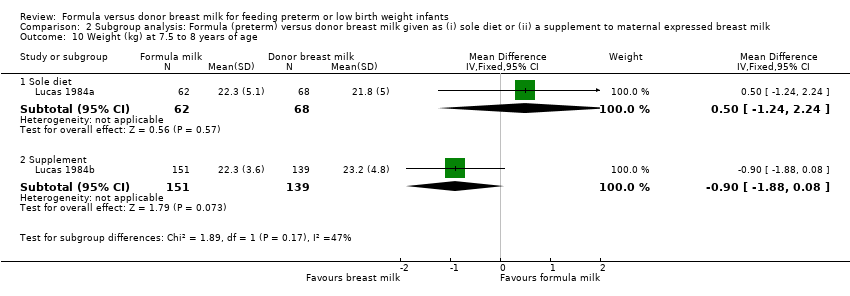
Comparison 2 Subgroup analysis: Formula (preterm) versus donor breast milk given as (i) sole diet or (ii) a supplement to maternal expressed breast milk, Outcome 10 Weight (kg) at 7.5 to 8 years of age.

Comparison 2 Subgroup analysis: Formula (preterm) versus donor breast milk given as (i) sole diet or (ii) a supplement to maternal expressed breast milk, Outcome 11 Length (cm) at 7.5 to 8 years of age.

Comparison 2 Subgroup analysis: Formula (preterm) versus donor breast milk given as (i) sole diet or (ii) a supplement to maternal expressed breast milk, Outcome 12 Head circumference (cm) at 7.5 to 8 years of age.

Comparison 2 Subgroup analysis: Formula (preterm) versus donor breast milk given as (i) sole diet or (ii) a supplement to maternal expressed breast milk, Outcome 13 Bayley Mental Development Index at 18 months.

Comparison 2 Subgroup analysis: Formula (preterm) versus donor breast milk given as (i) sole diet or (ii) a supplement to maternal expressed breast milk, Outcome 14 Bayley Psychomotor Development Index at 18 months.
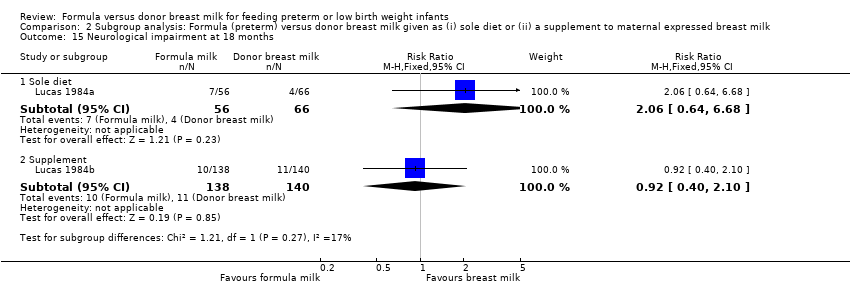
Comparison 2 Subgroup analysis: Formula (preterm) versus donor breast milk given as (i) sole diet or (ii) a supplement to maternal expressed breast milk, Outcome 15 Neurological impairment at 18 months.

Comparison 2 Subgroup analysis: Formula (preterm) versus donor breast milk given as (i) sole diet or (ii) a supplement to maternal expressed breast milk, Outcome 16 All‐cause mortality.

Comparison 2 Subgroup analysis: Formula (preterm) versus donor breast milk given as (i) sole diet or (ii) a supplement to maternal expressed breast milk, Outcome 17 Necrotising enterocolitis.
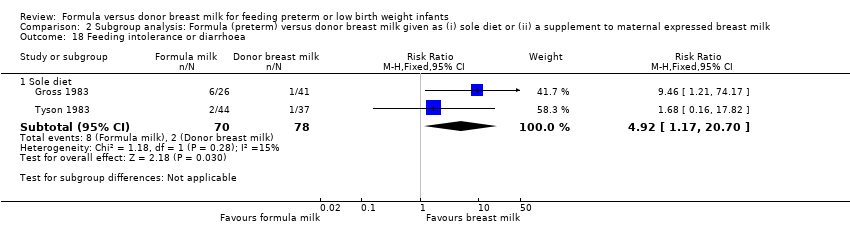
Comparison 2 Subgroup analysis: Formula (preterm) versus donor breast milk given as (i) sole diet or (ii) a supplement to maternal expressed breast milk, Outcome 18 Feeding intolerance or diarrhoea.
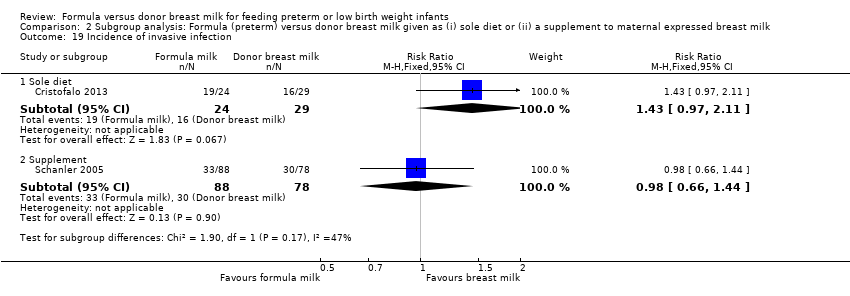
Comparison 2 Subgroup analysis: Formula (preterm) versus donor breast milk given as (i) sole diet or (ii) a supplement to maternal expressed breast milk, Outcome 19 Incidence of invasive infection.
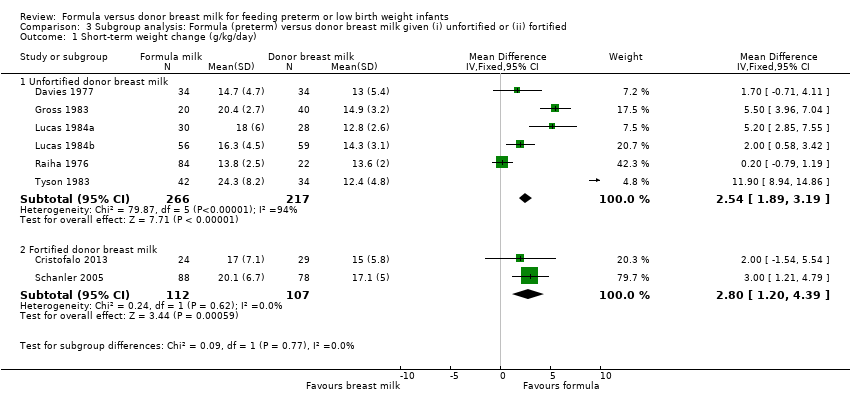
Comparison 3 Subgroup analysis: Formula (preterm) versus donor breast milk given (i) unfortified or (ii) fortified, Outcome 1 Short‐term weight change (g/kg/day).

Comparison 3 Subgroup analysis: Formula (preterm) versus donor breast milk given (i) unfortified or (ii) fortified, Outcome 2 Short‐term change in crown‐heel length (mm/week).
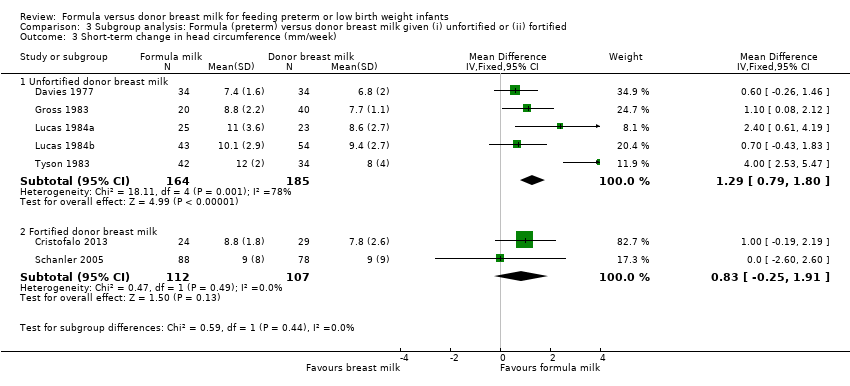
Comparison 3 Subgroup analysis: Formula (preterm) versus donor breast milk given (i) unfortified or (ii) fortified, Outcome 3 Short‐term change in head circumference (mm/week).

Comparison 3 Subgroup analysis: Formula (preterm) versus donor breast milk given (i) unfortified or (ii) fortified, Outcome 4 Weight (kg) at 9 months post‐term.

Comparison 3 Subgroup analysis: Formula (preterm) versus donor breast milk given (i) unfortified or (ii) fortified, Outcome 5 Length (cm) at 9 months post‐term.

Comparison 3 Subgroup analysis: Formula (preterm) versus donor breast milk given (i) unfortified or (ii) fortified, Outcome 6 Head circumference (cm) at 9 months post‐term.

Comparison 3 Subgroup analysis: Formula (preterm) versus donor breast milk given (i) unfortified or (ii) fortified, Outcome 7 Weight (kg) at 18 months post‐term.

Comparison 3 Subgroup analysis: Formula (preterm) versus donor breast milk given (i) unfortified or (ii) fortified, Outcome 8 Length (cm) at 18 months post‐term.
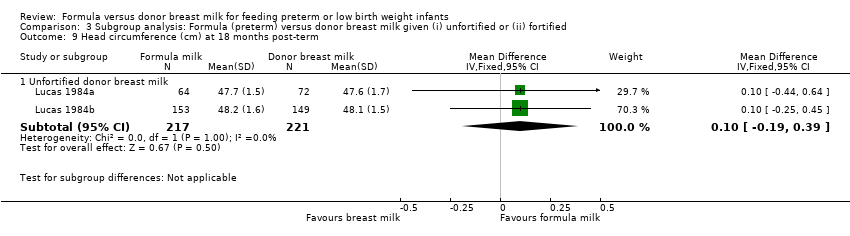
Comparison 3 Subgroup analysis: Formula (preterm) versus donor breast milk given (i) unfortified or (ii) fortified, Outcome 9 Head circumference (cm) at 18 months post‐term.
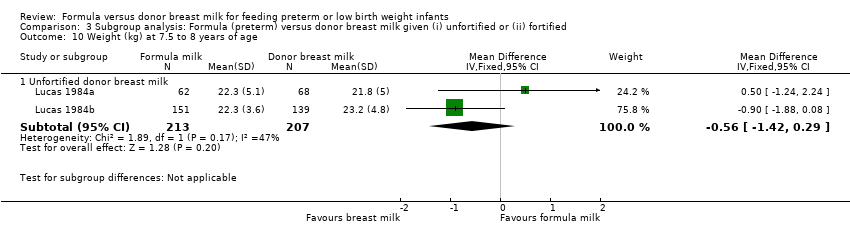
Comparison 3 Subgroup analysis: Formula (preterm) versus donor breast milk given (i) unfortified or (ii) fortified, Outcome 10 Weight (kg) at 7.5 to 8 years of age.

Comparison 3 Subgroup analysis: Formula (preterm) versus donor breast milk given (i) unfortified or (ii) fortified, Outcome 11 Length (cm) at 7.5 to 8 years of age.

Comparison 3 Subgroup analysis: Formula (preterm) versus donor breast milk given (i) unfortified or (ii) fortified, Outcome 12 Head circumference (cm) at 7.5 to 8 years of age.
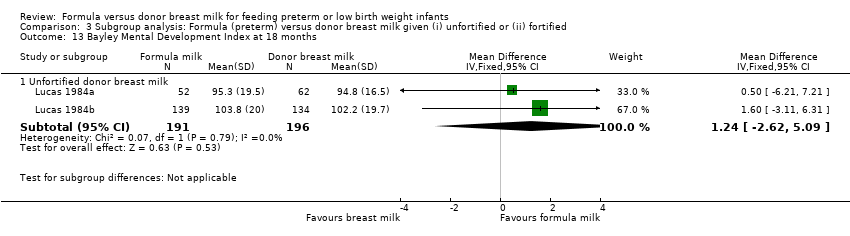
Comparison 3 Subgroup analysis: Formula (preterm) versus donor breast milk given (i) unfortified or (ii) fortified, Outcome 13 Bayley Mental Development Index at 18 months.
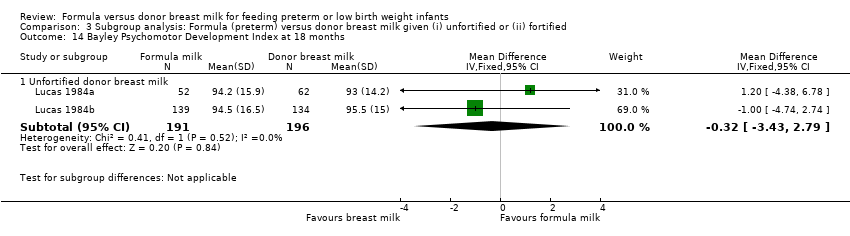
Comparison 3 Subgroup analysis: Formula (preterm) versus donor breast milk given (i) unfortified or (ii) fortified, Outcome 14 Bayley Psychomotor Development Index at 18 months.

Comparison 3 Subgroup analysis: Formula (preterm) versus donor breast milk given (i) unfortified or (ii) fortified, Outcome 15 Neurological impairment at 18 months.

Comparison 3 Subgroup analysis: Formula (preterm) versus donor breast milk given (i) unfortified or (ii) fortified, Outcome 16 All‐cause mortality.

Comparison 3 Subgroup analysis: Formula (preterm) versus donor breast milk given (i) unfortified or (ii) fortified, Outcome 17 Necrotising enterocolitis.
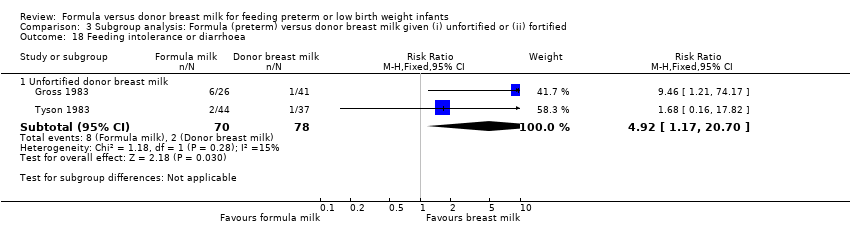
Comparison 3 Subgroup analysis: Formula (preterm) versus donor breast milk given (i) unfortified or (ii) fortified, Outcome 18 Feeding intolerance or diarrhoea.

Comparison 3 Subgroup analysis: Formula (preterm) versus donor breast milk given (i) unfortified or (ii) fortified, Outcome 19 Incidence of invasive infection.
| Outcome or subgroup title | No. of studies | No. of participants | Statistical method | Effect size |
| 1 Time to regain birth weight (days from birth) Show forest plot | 2 | 166 | Mean Difference (IV, Fixed, 95% CI) | ‐2.00 [‐5.81, ‐2.18] |
| 2 Short term weight change (g/kg/day) Show forest plot | 8 | 702 | Mean Difference (IV, Fixed, 95% CI) | 2.58 [1.98, 3.17] |
| 2.1 Term formula | 3 | 234 | Mean Difference (IV, Fixed, 95% CI) | 1.74 [0.96, 2.53] |
| 2.2 Preterm formula | 5 | 468 | Mean Difference (IV, Fixed, 95% CI) | 3.71 [2.79, 4.63] |
| 3 Short‐term change in crown‐heel length (mm/week) Show forest plot | 7 | 494 | Mean Difference (IV, Fixed, 95% CI) | 1.36 [0.87, 1.85] |
| 3.1 Term formula | 2 | 128 | Mean Difference (IV, Fixed, 95% CI) | 0.80 [0.10, 1.50] |
| 3.2 Preterm formula | 5 | 366 | Mean Difference (IV, Fixed, 95% CI) | 1.93 [1.23, 2.62] |
| 4 Short‐term change in crown‐rump length (mm/week) Show forest plot | 1 | Mean Difference (IV, Fixed, 95% CI) | Subtotals only | |
| 5 Short‐term change in femoral length (mm/week) Show forest plot | 1 | Mean Difference (IV, Fixed, 95% CI) | Subtotals only | |
| 6 Short‐term change in head circumference (mm/week) Show forest plot | 7 | 568 | Mean Difference (IV, Fixed, 95% CI) | 1.21 [0.75, 1.67] |
| 6.1 Term formula | 2 | 128 | Mean Difference (IV, Fixed, 95% CI) | 0.81 [0.15, 1.47] |
| 6.2 Preterm formula | 5 | 440 | Mean Difference (IV, Fixed, 95% CI) | 1.59 [0.95, 2.24] |
| 7 Weight (kg) at 9 months post‐term Show forest plot | 2 | 369 | Mean Difference (IV, Fixed, 95% CI) | ‐0.03 [‐0.26, 0.21] |
| 8 Length (cm) at 9 months post‐term Show forest plot | 2 | 369 | Mean Difference (IV, Fixed, 95% CI) | 0.03 [‐0.64, 0.70] |
| 9 Head circumference (cm) at 9 months post‐term Show forest plot | 2 | 369 | Mean Difference (IV, Fixed, 95% CI) | 0.20 [‐0.13, 0.53] |
| 10 Weight (kg) at 18 months post‐term Show forest plot | 2 | 438 | Mean Difference (IV, Fixed, 95% CI) | 0.10 [‐0.15, 0.35] |
| 11 Length (cm) at 18 months post‐term Show forest plot | 2 | 438 | Mean Difference (IV, Fixed, 95% CI) | 0.53 [‐0.15, 1.20] |
| 12 Head circumference (cm) at 18 months post‐term Show forest plot | 2 | 438 | Mean Difference (IV, Fixed, 95% CI) | 0.10 [‐0.19, 0.39] |
| 13 Weight (kg) at 7.5 to 8 years of age Show forest plot | 2 | 420 | Mean Difference (IV, Fixed, 95% CI) | ‐0.56 [‐1.42, 0.29] |
| 14 Length (cm) at 7.5 to 8 years of age Show forest plot | 2 | 420 | Mean Difference (IV, Fixed, 95% CI) | 0.05 [‐1.12, 1.23] |
| 15 Head circumference (cm) at 7.5 to 8 years of age Show forest plot | 2 | 420 | Mean Difference (IV, Fixed, 95% CI) | ‐0.19 [‐0.54, 0.16] |
| 16 Bayley Mental Development Index at 18 months Show forest plot | 2 | 387 | Mean Difference (IV, Fixed, 95% CI) | 1.24 [‐2.62, 5.09] |
| 17 Bayley Psychomotor Development Index at 18 months Show forest plot | 2 | 387 | Mean Difference (IV, Fixed, 95% CI) | ‐0.32 [‐3.43, 2.79] |
| 18 Neurological impairment at 18 months Show forest plot | 2 | 400 | Risk Ratio (M‐H, Fixed, 95% CI) | 1.21 [0.62, 2.35] |
| 19 All‐cause mortality Show forest plot | 4 | 721 | Risk Ratio (M‐H, Fixed, 95% CI) | 1.33 [0.79, 2.25] |
| 20 Necrotising enterocolitis Show forest plot | 6 | 869 | Risk Ratio (M‐H, Fixed, 95% CI) | 2.77 [1.40, 5.46] |
| 20.1 Term formula | 1 | 67 | Risk Ratio (M‐H, Fixed, 95% CI) | 4.73 [0.52, 43.09] |
| 20.2 Preterm formula | 5 | 802 | Risk Ratio (M‐H, Fixed, 95% CI) | 2.61 [1.27, 5.35] |
| 21 Days after birth to establish full enteral feeding Show forest plot | 1 | 53 | Mean Difference (IV, Fixed, 95% CI) | 4.70 [‐2.56, 11.96] |
| 22 Feeding intolerance or diarrhoea Show forest plot | 2 | 148 | Risk Difference (M‐H, Fixed, 95% CI) | 0.10 [0.01, 0.19] |
| 22.1 Term formula | 1 | 67 | Risk Difference (M‐H, Fixed, 95% CI) | 0.21 [0.04, 0.38] |
| 22.2 Preterm formula | 1 | 81 | Risk Difference (M‐H, Fixed, 95% CI) | 0.02 [‐0.06, 0.10] |
| 23 Incidence of invasive infection Show forest plot | 2 | 219 | Risk Ratio (M‐H, Fixed, 95% CI) | 1.12 [0.84, 1.49] |
| Outcome or subgroup title | No. of studies | No. of participants | Statistical method | Effect size |
| 1 Short‐term weight change (g/kg/day) Show forest plot | 8 | Mean Difference (IV, Fixed, 95% CI) | Subtotals only | |
| 1.1 Sole diet | 6 | 421 | Mean Difference (IV, Fixed, 95% CI) | 2.65 [1.94, 3.36] |
| 1.2 Supplement | 2 | 281 | Mean Difference (IV, Fixed, 95% CI) | 2.39 [1.28, 3.50] |
| 2 Short‐term change in crown‐heel length (mm/week) Show forest plot | 7 | Mean Difference (IV, Fixed, 95% CI) | Subtotals only | |
| 2.1 Sole diet | 5 | 283 | Mean Difference (IV, Fixed, 95% CI) | 1.54 [0.98, 2.11] |
| 2.2 Supplement | 2 | 211 | Mean Difference (IV, Fixed, 95% CI) | 0.75 [‐0.28, 1.78] |
| 3 Short‐term change in head circumference (mm/week) Show forest plot | 7 | Mean Difference (IV, Fixed, 95% CI) | Subtotals only | |
| 3.1 Sole diet | 5 | 305 | Mean Difference (IV, Fixed, 95% CI) | 1.36 [0.85, 1.88] |
| 3.2 Supplement | 2 | 263 | Mean Difference (IV, Fixed, 95% CI) | 0.59 [‐0.44, 1.62] |
| 4 Weight (kg) at 9 months post‐term Show forest plot | 2 | Mean Difference (IV, Fixed, 95% CI) | Subtotals only | |
| 4.1 Sole diet | 1 | 110 | Mean Difference (IV, Fixed, 95% CI) | 0.20 [‐0.27, 0.67] |
| 4.2 Supplement | 1 | 259 | Mean Difference (IV, Fixed, 95% CI) | ‐0.10 [‐0.37, 0.17] |
| 5 Length (cm) at 9 months post‐term Show forest plot | 2 | Mean Difference (IV, Fixed, 95% CI) | Subtotals only | |
| 5.1 Sole diet | 1 | 110 | Mean Difference (IV, Fixed, 95% CI) | 0.40 [‐0.93, 1.73] |
| 5.2 Supplement | 1 | 259 | Mean Difference (IV, Fixed, 95% CI) | ‐0.10 [‐0.88, 0.68] |
| 6 Head circumference (cm) at 9 months post‐term Show forest plot | 2 | Mean Difference (IV, Fixed, 95% CI) | Subtotals only | |
| 6.1 Sole diet | 1 | 110 | Mean Difference (IV, Fixed, 95% CI) | 0.20 [‐0.45, 0.85] |
| 6.2 Supplement | 1 | 259 | Mean Difference (IV, Fixed, 95% CI) | 0.20 [‐0.18, 0.58] |
| 7 Weight (kg) at 18 months post‐term Show forest plot | 2 | Mean Difference (IV, Fixed, 95% CI) | Subtotals only | |
| 7.1 Sole diet | 1 | 136 | Mean Difference (IV, Fixed, 95% CI) | 0.10 [‐0.37, 0.57] |
| 7.2 Supplement | 1 | 302 | Mean Difference (IV, Fixed, 95% CI) | 0.10 [‐0.19, 0.39] |
| 8 Length (cm) at 18 months post‐term Show forest plot | 2 | Mean Difference (IV, Fixed, 95% CI) | Subtotals only | |
| 8.1 Sole diet | 1 | 136 | Mean Difference (IV, Fixed, 95% CI) | 0.60 [‐0.68, 1.88] |
| 8.2 Supplement | 1 | 302 | Mean Difference (IV, Fixed, 95% CI) | 0.5 [‐0.29, 1.29] |
| 9 Head circumference (cm) at 18 months post‐term Show forest plot | 2 | Mean Difference (IV, Fixed, 95% CI) | Subtotals only | |
| 9.1 Sole diet | 1 | 136 | Mean Difference (IV, Fixed, 95% CI) | 0.10 [‐0.44, 0.64] |
| 9.2 Supplement | 1 | 302 | Mean Difference (IV, Fixed, 95% CI) | 0.10 [‐0.25, 0.45] |
| 10 Weight (kg) at 7.5 to 8 years of age Show forest plot | 2 | Mean Difference (IV, Fixed, 95% CI) | Subtotals only | |
| 10.1 Sole diet | 1 | 130 | Mean Difference (IV, Fixed, 95% CI) | 0.5 [‐1.24, 2.24] |
| 10.2 Supplement | 1 | 290 | Mean Difference (IV, Fixed, 95% CI) | ‐0.90 [‐1.88, 0.08] |
| 11 Length (cm) at 7.5 to 8 years of age Show forest plot | 2 | 420 | Mean Difference (IV, Fixed, 95% CI) | 0.05 [‐1.12, 1.23] |
| 11.1 Sole diet | 1 | 130 | Mean Difference (IV, Fixed, 95% CI) | 1.0 [‐1.26, 3.26] |
| 11.2 Supplement | 1 | 290 | Mean Difference (IV, Fixed, 95% CI) | ‐0.30 [‐1.68, 1.08] |
| 12 Head circumference (cm) at 7.5 to 8 years of age Show forest plot | 2 | 420 | Mean Difference (IV, Fixed, 95% CI) | ‐0.19 [‐0.54, 0.16] |
| 12.1 Sole diet | 1 | 130 | Mean Difference (IV, Fixed, 95% CI) | 0.10 [‐0.56, 0.76] |
| 12.2 Supplement | 1 | 290 | Mean Difference (IV, Fixed, 95% CI) | ‐0.30 [‐0.71, 0.11] |
| 13 Bayley Mental Development Index at 18 months Show forest plot | 2 | Mean Difference (IV, Fixed, 95% CI) | Subtotals only | |
| 13.1 Sole diet | 1 | 114 | Mean Difference (IV, Fixed, 95% CI) | 0.5 [‐6.21, 7.21] |
| 13.2 Supplement | 1 | 273 | Mean Difference (IV, Fixed, 95% CI) | 1.60 [‐3.11, 6.31] |
| 14 Bayley Psychomotor Development Index at 18 months Show forest plot | 2 | Mean Difference (IV, Fixed, 95% CI) | Subtotals only | |
| 14.1 Sole diet | 1 | 114 | Mean Difference (IV, Fixed, 95% CI) | 1.20 [‐4.38, 6.78] |
| 14.2 Supplement | 1 | 273 | Mean Difference (IV, Fixed, 95% CI) | ‐1.0 [‐4.74, 2.74] |
| 15 Neurological impairment at 18 months Show forest plot | 2 | Risk Ratio (M‐H, Fixed, 95% CI) | Subtotals only | |
| 15.1 Sole diet | 1 | 122 | Risk Ratio (M‐H, Fixed, 95% CI) | 2.06 [0.64, 6.68] |
| 15.2 Supplement | 1 | 278 | Risk Ratio (M‐H, Fixed, 95% CI) | 0.92 [0.40, 2.10] |
| 16 All‐cause mortality Show forest plot | 4 | Risk Ratio (M‐H, Fixed, 95% CI) | Subtotals only | |
| 16.1 Sole diet | 2 | 212 | Risk Ratio (M‐H, Fixed, 95% CI) | 1.70 [0.71, 4.07] |
| 16.2 Supplement | 2 | 509 | Risk Ratio (M‐H, Fixed, 95% CI) | 1.16 [0.60, 2.24] |
| 17 Necrotising enterocolitis Show forest plot | 6 | Risk Ratio (M‐H, Fixed, 95% CI) | Subtotals only | |
| 17.1 Sole diet | 4 | 360 | Risk Ratio (M‐H, Fixed, 95% CI) | 4.62 [1.47, 14.56] |
| 17.2 Supplement | 2 | 509 | Risk Ratio (M‐H, Fixed, 95% CI) | 1.96 [0.82, 4.67] |
| 18 Feeding intolerance or diarrhoea Show forest plot | 2 | Risk Ratio (M‐H, Fixed, 95% CI) | Subtotals only | |
| 18.1 Sole diet | 2 | 148 | Risk Ratio (M‐H, Fixed, 95% CI) | 4.92 [1.17, 20.70] |
| 19 Incidence of invasive infection Show forest plot | 2 | Risk Ratio (M‐H, Fixed, 95% CI) | Subtotals only | |
| 19.1 Sole diet | 1 | 53 | Risk Ratio (M‐H, Fixed, 95% CI) | 1.43 [0.97, 2.11] |
| 19.2 Supplement | 1 | 166 | Risk Ratio (M‐H, Fixed, 95% CI) | 0.98 [0.66, 1.44] |
| Outcome or subgroup title | No. of studies | No. of participants | Statistical method | Effect size |
| 1 Short‐term weight change (g/kg/day) Show forest plot | 8 | Mean Difference (IV, Fixed, 95% CI) | Subtotals only | |
| 1.1 Unfortified donor breast milk | 6 | 483 | Mean Difference (IV, Fixed, 95% CI) | 2.54 [1.89, 3.19] |
| 1.2 Fortified donor breast milk | 2 | 219 | Mean Difference (IV, Fixed, 95% CI) | 2.80 [1.20, 4.39] |
| 2 Short‐term change in crown‐heel length (mm/week) Show forest plot | 7 | Mean Difference (IV, Fixed, 95% CI) | Subtotals only | |
| 2.1 Unfortified donor breast milk | 5 | 275 | Mean Difference (IV, Fixed, 95% CI) | 1.26 [0.72, 1.80] |
| 2.2 Fortified donor breast milk | 2 | 219 | Mean Difference (IV, Fixed, 95% CI) | 1.86 [0.64, 3.07] |
| 3 Short‐term change in head circumference (mm/week) Show forest plot | 7 | Mean Difference (IV, Fixed, 95% CI) | Subtotals only | |
| 3.1 Unfortified donor breast milk | 5 | 349 | Mean Difference (IV, Fixed, 95% CI) | 1.29 [0.79, 1.80] |
| 3.2 Fortified donor breast milk | 2 | 219 | Mean Difference (IV, Fixed, 95% CI) | 0.83 [‐0.25, 1.91] |
| 4 Weight (kg) at 9 months post‐term Show forest plot | 2 | Mean Difference (IV, Fixed, 95% CI) | Subtotals only | |
| 4.1 Unfortified donor breast milk | 2 | 369 | Mean Difference (IV, Fixed, 95% CI) | ‐0.03 [‐0.26, 0.21] |
| 5 Length (cm) at 9 months post‐term Show forest plot | 2 | Mean Difference (IV, Fixed, 95% CI) | Subtotals only | |
| 5.1 Unfortified donor breast milk | 2 | 369 | Mean Difference (IV, Fixed, 95% CI) | 0.03 [‐0.64, 0.70] |
| 6 Head circumference (cm) at 9 months post‐term Show forest plot | 2 | Mean Difference (IV, Fixed, 95% CI) | Subtotals only | |
| 6.1 Unfortified donor breast milk | 2 | 369 | Mean Difference (IV, Fixed, 95% CI) | 0.20 [‐0.13, 0.53] |
| 7 Weight (kg) at 18 months post‐term Show forest plot | 2 | Mean Difference (IV, Fixed, 95% CI) | Subtotals only | |
| 7.1 Unfortified donor breast milk | 2 | 438 | Mean Difference (IV, Fixed, 95% CI) | 0.10 [‐0.15, 0.35] |
| 8 Length (cm) at 18 months post‐term Show forest plot | 2 | Mean Difference (IV, Fixed, 95% CI) | Subtotals only | |
| 8.1 Unfortified donor breast milk | 2 | 438 | Mean Difference (IV, Fixed, 95% CI) | 0.53 [‐0.15, 1.20] |
| 9 Head circumference (cm) at 18 months post‐term Show forest plot | 2 | Mean Difference (IV, Fixed, 95% CI) | Subtotals only | |
| 9.1 Unfortified donor breast milk | 2 | 438 | Mean Difference (IV, Fixed, 95% CI) | 0.10 [‐0.19, 0.39] |
| 10 Weight (kg) at 7.5 to 8 years of age Show forest plot | 2 | Mean Difference (IV, Fixed, 95% CI) | Subtotals only | |
| 10.1 Unfortified donor breast milk | 2 | 420 | Mean Difference (IV, Fixed, 95% CI) | ‐0.56 [‐1.42, 0.29] |
| 11 Length (cm) at 7.5 to 8 years of age Show forest plot | 2 | Mean Difference (IV, Fixed, 95% CI) | Subtotals only | |
| 11.1 Unfortified donor breast milk | 2 | 420 | Mean Difference (IV, Fixed, 95% CI) | 0.05 [‐1.12, 1.23] |
| 12 Head circumference (cm) at 7.5 to 8 years of age Show forest plot | 2 | Mean Difference (IV, Fixed, 95% CI) | Subtotals only | |
| 12.1 Unfortified donor breast milk | 2 | 420 | Mean Difference (IV, Fixed, 95% CI) | ‐0.19 [‐0.54, 0.16] |
| 13 Bayley Mental Development Index at 18 months Show forest plot | 2 | Mean Difference (IV, Fixed, 95% CI) | Subtotals only | |
| 13.1 Unfortified donor breast milk | 2 | 387 | Mean Difference (IV, Fixed, 95% CI) | 1.24 [‐2.62, 5.09] |
| 14 Bayley Psychomotor Development Index at 18 months Show forest plot | 2 | Mean Difference (IV, Fixed, 95% CI) | Subtotals only | |
| 14.1 Unfortified donor breast milk | 2 | 387 | Mean Difference (IV, Fixed, 95% CI) | ‐0.32 [‐3.43, 2.79] |
| 15 Neurological impairment at 18 months Show forest plot | 2 | Risk Ratio (M‐H, Fixed, 95% CI) | Subtotals only | |
| 15.1 Unfortified donor breast milk | 2 | 400 | Risk Ratio (M‐H, Fixed, 95% CI) | 1.21 [0.62, 2.35] |
| 16 All‐cause mortality Show forest plot | 4 | Risk Ratio (M‐H, Fixed, 95% CI) | Subtotals only | |
| 16.1 Unfortified donor breast milk | 2 | 502 | Risk Ratio (M‐H, Fixed, 95% CI) | 1.29 [0.73, 2.29] |
| 16.2 Fortified donor breast milk | 2 | 219 | Risk Ratio (M‐H, Fixed, 95% CI) | 1.53 [0.42, 5.51] |
| 17 Necrotising enterocolitis Show forest plot | 6 | Risk Ratio (M‐H, Fixed, 95% CI) | Subtotals only | |
| 17.1 Unfortified donor breast milk | 4 | 650 | Risk Ratio (M‐H, Fixed, 95% CI) | 3.30 [1.16, 9.41] |
| 17.2 Fortified donor breast milk | 2 | 219 | Risk Ratio (M‐H, Fixed, 95% CI) | 2.40 [0.98, 5.87] |
| 18 Feeding intolerance or diarrhoea Show forest plot | 2 | Risk Ratio (M‐H, Fixed, 95% CI) | Subtotals only | |
| 18.1 Unfortified donor breast milk | 2 | 148 | Risk Ratio (M‐H, Fixed, 95% CI) | 4.92 [1.17, 20.70] |
| 19 Incidence of invasive infection Show forest plot | 2 | Risk Ratio (M‐H, Fixed, 95% CI) | Subtotals only | |
| 19.1 Fortified donor breast milk | 2 | 219 | Risk Ratio (M‐H, Fixed, 95% CI) | 1.12 [0.84, 1.49] |